1. Introduction
Reduced graphene oxide (rGO) possesses properties between graphene oxide (GO) and graphene that makes it an attractive carbon material in the applications of energy storage systems, (bio)sensors, fuel cells, Li
+ ion batteries, supercapacitors, etc. [
1,
2,
3]. Several synthesis strategies of rGO have been proposed, which could be mainly categorized into the chemical, electrochemical, and thermal reduction of GO. Chemical reduction is a fast and straightforward method to obtain rGO at low temperatures (below 90 °C). However, reducing agents (hydrazine, lithium aluminum hydride, hydroiodic acid) used are harmful and highly toxic [
3,
4]. Moreover, the complete removal of reductants is complicated due to their adsorption on the rGO lattice [
5]. Electrochemical reduction of GO is considered a green synthesis approach, but it is not cost-effective in terms of large-scale production of rGO. As a scalable, eco-friendly, rapid, and inexpensive method, thermal reduction is more attractive than chemical and electrochemical treatments. The thermally reduced GO exhibits a higher reduction degree, larger specific surface area as well as better electronic properties compared to rGO samples prepared by the chemical process. Furthermore, thermal reduction is a promising method for the industrial preparation of rGO with less damage to the environment [
3].
However, the thermal reduction of GO is still challenging. Annealing of GO leads to high volumes of CO and CO
2 gases that cause structural disorders such as Stone–Wales defects, C vacancies, dislocations, grain boundaries, and sp
3 defects [
6]. It is well known that these disorders alter the length of C–C bonds and induce the σ and π orbitals re-hybridization. They may cause the scattering of electron waves and the change of electrons trajectories resulting in a decrease of electron carrier mobility and electrical conductivity in the sample. The presence of distortions can also deteriorate physical properties such as the thermal conductivity and mechanical strength of the material [
7]. For these reasons, it is essential to focus on the synthesis procedure to ensure the best recovery of the sp
2 carbon network in the rGO.
The final properties of rGO, including the C/O ratio, number of layers, surface area, and number of structural defects, could be controlled by changing thermal reduction conditions such as temperature, pressure, atmosphere, and oxidation degree of GO. The study reported by A. Kaniyoor et al. showed that the use of the H
2 and Ar mixture in the synthesis of rGO leads to a higher C/O ratio compared to that of the sample reduced only under Ar atmosphere [
8]. Then, at higher temperatures (1000–2800 °C), the restoration of the sp
2 carbon network occurs more effectively than at lower temperatures due to the more pronounced decomposition of oxygen-containing functional groups and stimulation of graphitization [
9,
10]. The higher oxidation degree of GO influences the more efficient reduction process [
11]. The substantial carbon source in thermal reduction of GO can also improve the restoration of the π-conjugated system, make a beneficial change in electrical properties, and decrease structural defects. For instance, Y. Liang et al. carried out thermal GO reduction in the presence of acetylene (C
2H
2) at 1000 °C temperature in order to prepare transparent graphene-based coatings for electrode materials. The sample obtained exhibited electrical conductivity more than four times higher than the compound in the absence of C
2H
2, representing the significant advantage of using additional carbon [
12]. Following this, carbon suboxide (C
3O
2) may also be a good candidate as an atomic carbon source in the thermal reduction of GO. Formally, C
3O
2 is an anhydride of malonic acid (CH
2(COOH)
2); therefore, this carbon oxide could be produced by dehydration of malonic acid (MA) and a strong dehydrating agent, phosphorus pentoxide (P
2O
5), at 150 °C temperature [
13]. C
3O
2 is gaseous and thermally decomposes into elemental carbon and two carbon monoxide molecules above 16 °C [
14]. For this reason, this linear molecule has been successfully used as an atomic carbon source in the synthesis of carbon nanotubes and carbon coatings [
15,
16]. Additionally, our previous study showed the positive impact of C
3O
2 on the decomposition kinetics of GO and the structural properties of rGO obtained at relatively low temperatures (250 °C) [
17]. Surprisingly, the use of the MA and P
2O
5 mixture could be beneficial in the thermal reduction of GO since the reaction between these two compounds produces C
3O
2 as well as H
3PO
4. According to the literature, phosphorus acid has been used as an effective dopant of phosphorus atoms in the chemical and thermal reduction of GO [
18,
19,
20,
21]. Modification with phosphorus can effectively modulate the electrical, catalytic, and electrochemical properties of rGO. The phosphorus atom has lower electronegativity than the carbon atom that changes charge densities in the graphene-based material resulting in enhanced capacitive performance and surface area of phosphorus-doped graphene compounds [
21,
22,
23]. Moreover, the incorporation of phosphorus atoms increases the density of charge carries in the carbon sample due to the contribution of phosphorus electrons to the π-conjugated system of rGO. For this reason, the electrical conductivity is expected to increase [
24]. Thus, we propose that this suggested thermal reduction technique with an additive of MA and P
2O
5 will provide new possibilities to achieve materials with restored sp
2 carbon network and improved electrochemical performance to successfully apply new phosphorus-doped rGO materials in (bio)sensors or supercapacitors. To the best of our knowledge, the mixture of MA and P
2O
5 has been used for the first time as a reducing mixture and phosphorus-containing agent for the reduction and modification of GO. Moreover, the detailed structural characterization and electrical conductivity behavior of rGO obtained using the mixture of MA and P
2O
5 have not been investigated in depth yet.
The aim of this research was to evaluate the changes in the structure and electrical behavior of different rGO samples prepared using thermal reduction of GO in the absence and presence of MA and P2O5 mixture. Two GO samples with different oxidation degrees and functional groups were used to prepare rGO samples. We have demonstrated the enhanced successful restoration of the π-conjugated system, as well as the simultaneous incorporation of phosphorus atoms. The impact of C3O2 and the insertion of phosphorus atoms on structural properties and morphology was evaluated in detail using X-ray diffraction (XRD), energy dispersive X-ray spectroscopy (EDX), X-ray photoelectron spectroscopy (XPS), Fourier transform infrared spectroscopy (FTIR), scanning electron microscopy (SEM), transmission electron microscopy (TEM), and Raman spectroscopies. Electrical conductivity measurements of synthesized rGO samples with additives were also carried out.
3. Results and Discussion
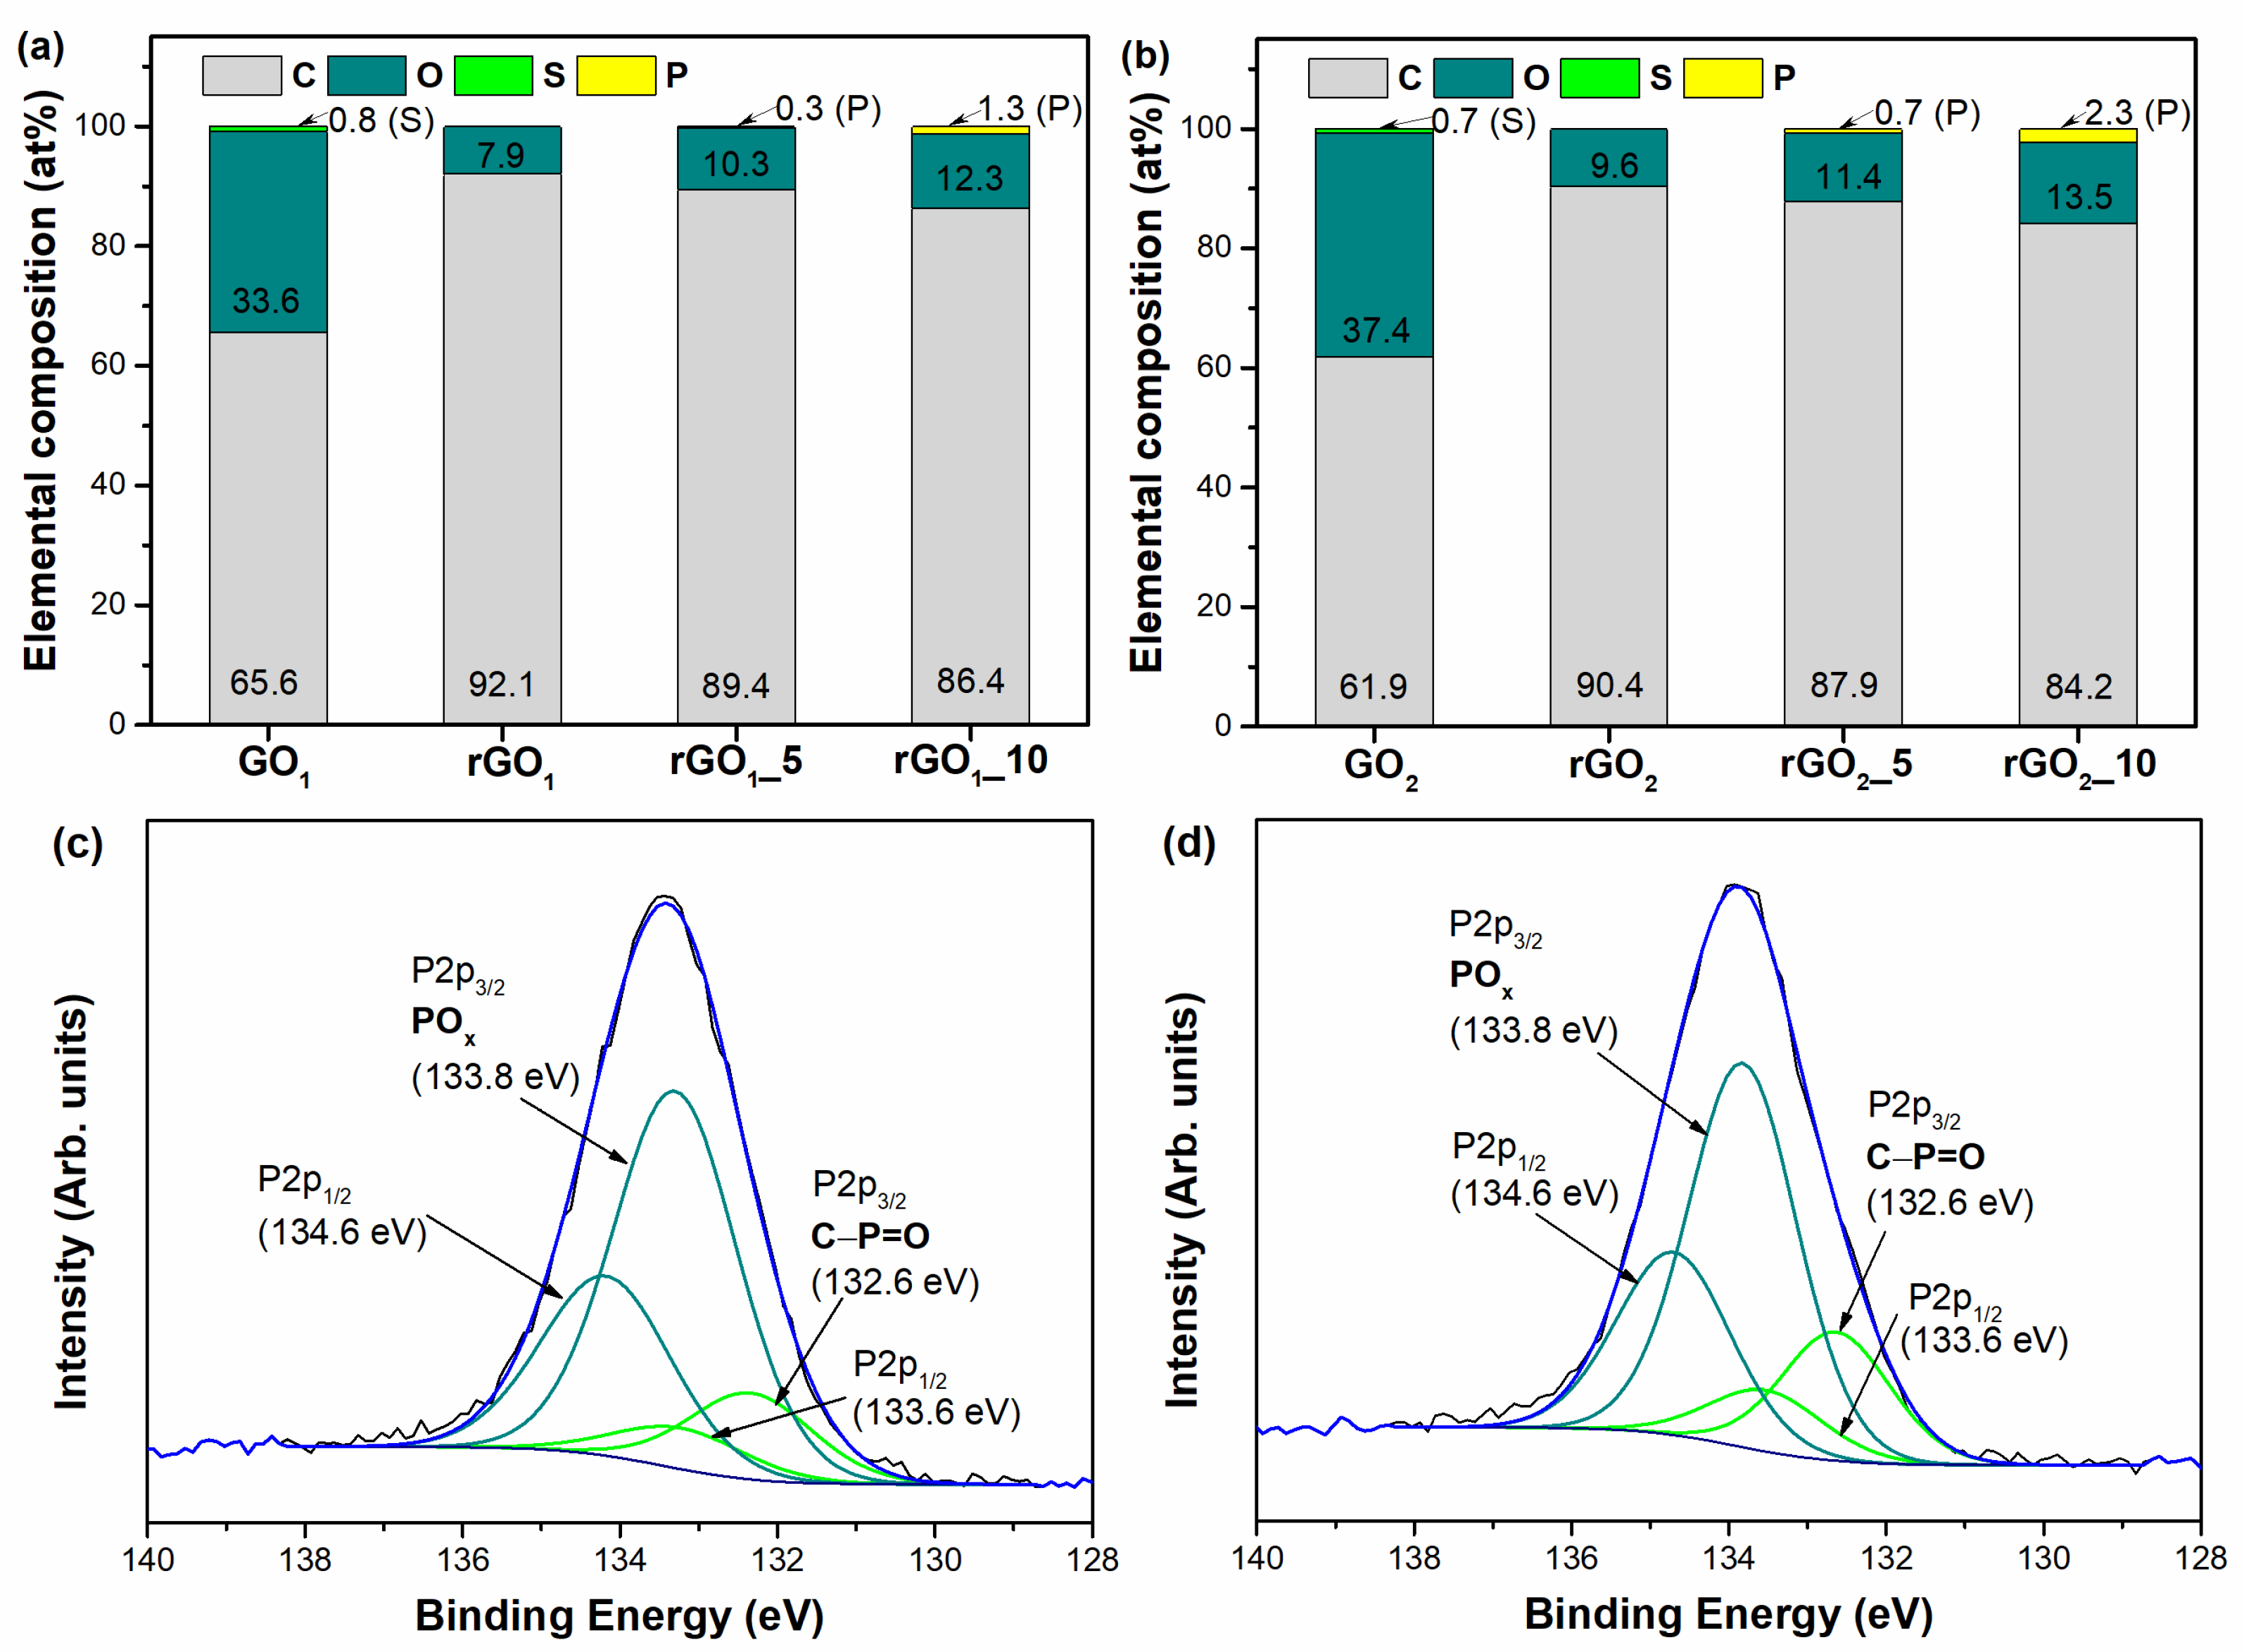
The elemental composition of the synthesized GO and rGO samples is presented in
Figure 1a,b. As can be seen in
Figure 1a,b, GO
1 and GO
2 contain carbon, oxygen, and sulfur atoms. The origin of sulfur is associated with the presence of HSO
4− and SO
42− residuals, introduced during the oxidation treatment of pristine graphite. Moreover, the C/O ratio of GO
2 is determined to be 1.66 indicating the higher oxidation degree compared to that of GO
1 (C/O = 1.95). After thermal treatment of GO samples without MA and P
2O
5 additives, only carbon and oxygen elements are identified for rGO
1 and rGO
2 and the ratio of C/O significantly increased up to 11.66 and 8.68 for rGO
1 and rGO
2, respectively. Besides, from
Figure 1a,b, it can be noted that the relative concentration of oxygen has been reduced from 33.6 at% and 37.4 at% for GO
1 and GO
2, respectively, to 7.9 at% for rGO
1 and 9.6 at% for rGO
2, suggesting a partial reduction of the GO samples. On the contrary, the samples obtained after thermal reduction of GO using a mixture of MA and P
2O
5 consist of carbon, oxygen, and phosphorus atoms. The similar tendency of the increasing of C/O values is observed for all rGO samples obtained using additives in the reduction process. The determined C/O values for rGO
1_5, rGO
1_10, rGO
2_5, and rGO
2_10 are 8.68, 7.02, 7.71, and 6.24, respectively. Supposedly, phosphorus functionalities enter the structure of rGO samples due to the formation of H
3PO
4 in the reaction between MA and P
2O
5 (Equation (1)). As can be seen in
Figure 1a,b, the content of phosphorus varies from 0.3 to 2.3 at%, while the highest content of P (2.3 at%) is determined in the rGO
2_10 sample. It should be noted that the phosphorus-doping level in this sample is much higher than other previously synthesized phosphorus-doped rGO samples reported in the literature [
18,
19,
29,
30]. Furthermore, the results obtained from the elemental analysis show that the amount of oxygen increases with an increase of the additives content used in the thermal reduction process. In the case of rGO
1 samples, the oxygen contents are 10.3 at% and 12.3 at% for rGO
1_5 and rGO
1_10, respectively, while in the case of rGO
2 samples, the oxygen contents are 11.4 at% and 13.5 at% for rGO
2_5 and rGO
2_10 samples, respectively. It could be a consequence of introducing oxygen-containing phosphate groups (O–P or O=P) into the graphene structure. The P2p XPS spectrum could provide detailed information on the phosphorus-containing functional groups presented on the surface of samples. As only two samples, rGO
1_10 and rGO
2_10, exhibited a higher amount of phosphorus, they were selected for a P2p peak deconvolution analysis, and the results are presented in
Figure 1c,d. It can be noted that for both samples, deconvolution of the P2p region presents an inseparable doublet with P2p
1/2 and P2p
3/2 components at ΔBE = 0.8 eV and an area ratio of 1:2. A low energy doublet with the energy of the P2p
3/2 component of 132.6 eV is assigned to the C–P=O bonds. An intense doublet with the P2p
3/2 component located at approximately 133.8 eV corresponds to the higher oxidation state of phosphorus [
31]. Regarding the content of specific phosphorus-containing functionalities in the samples, it can be noticed that the reduction of GO in the presence of the MA and P
2O
5 additive leads to the formation of mainly the higher oxidation state of phosphorus (PO
x), as the relative concentration of these groups in the rGO
2_10 sample is 74.9 at% and in the case of the rGO
1_10 sample is 81.4 at%. The content of the C–P=O groups was considerably lower (25.1 at% for rGO
2_10 and 18.6 at% for rGO
1_10). Overall, these results confirm the partial reduction of GO samples and present a new kind of dopant for the successful insertion of phosphorus functionalities in the thermally reduced GO structure.
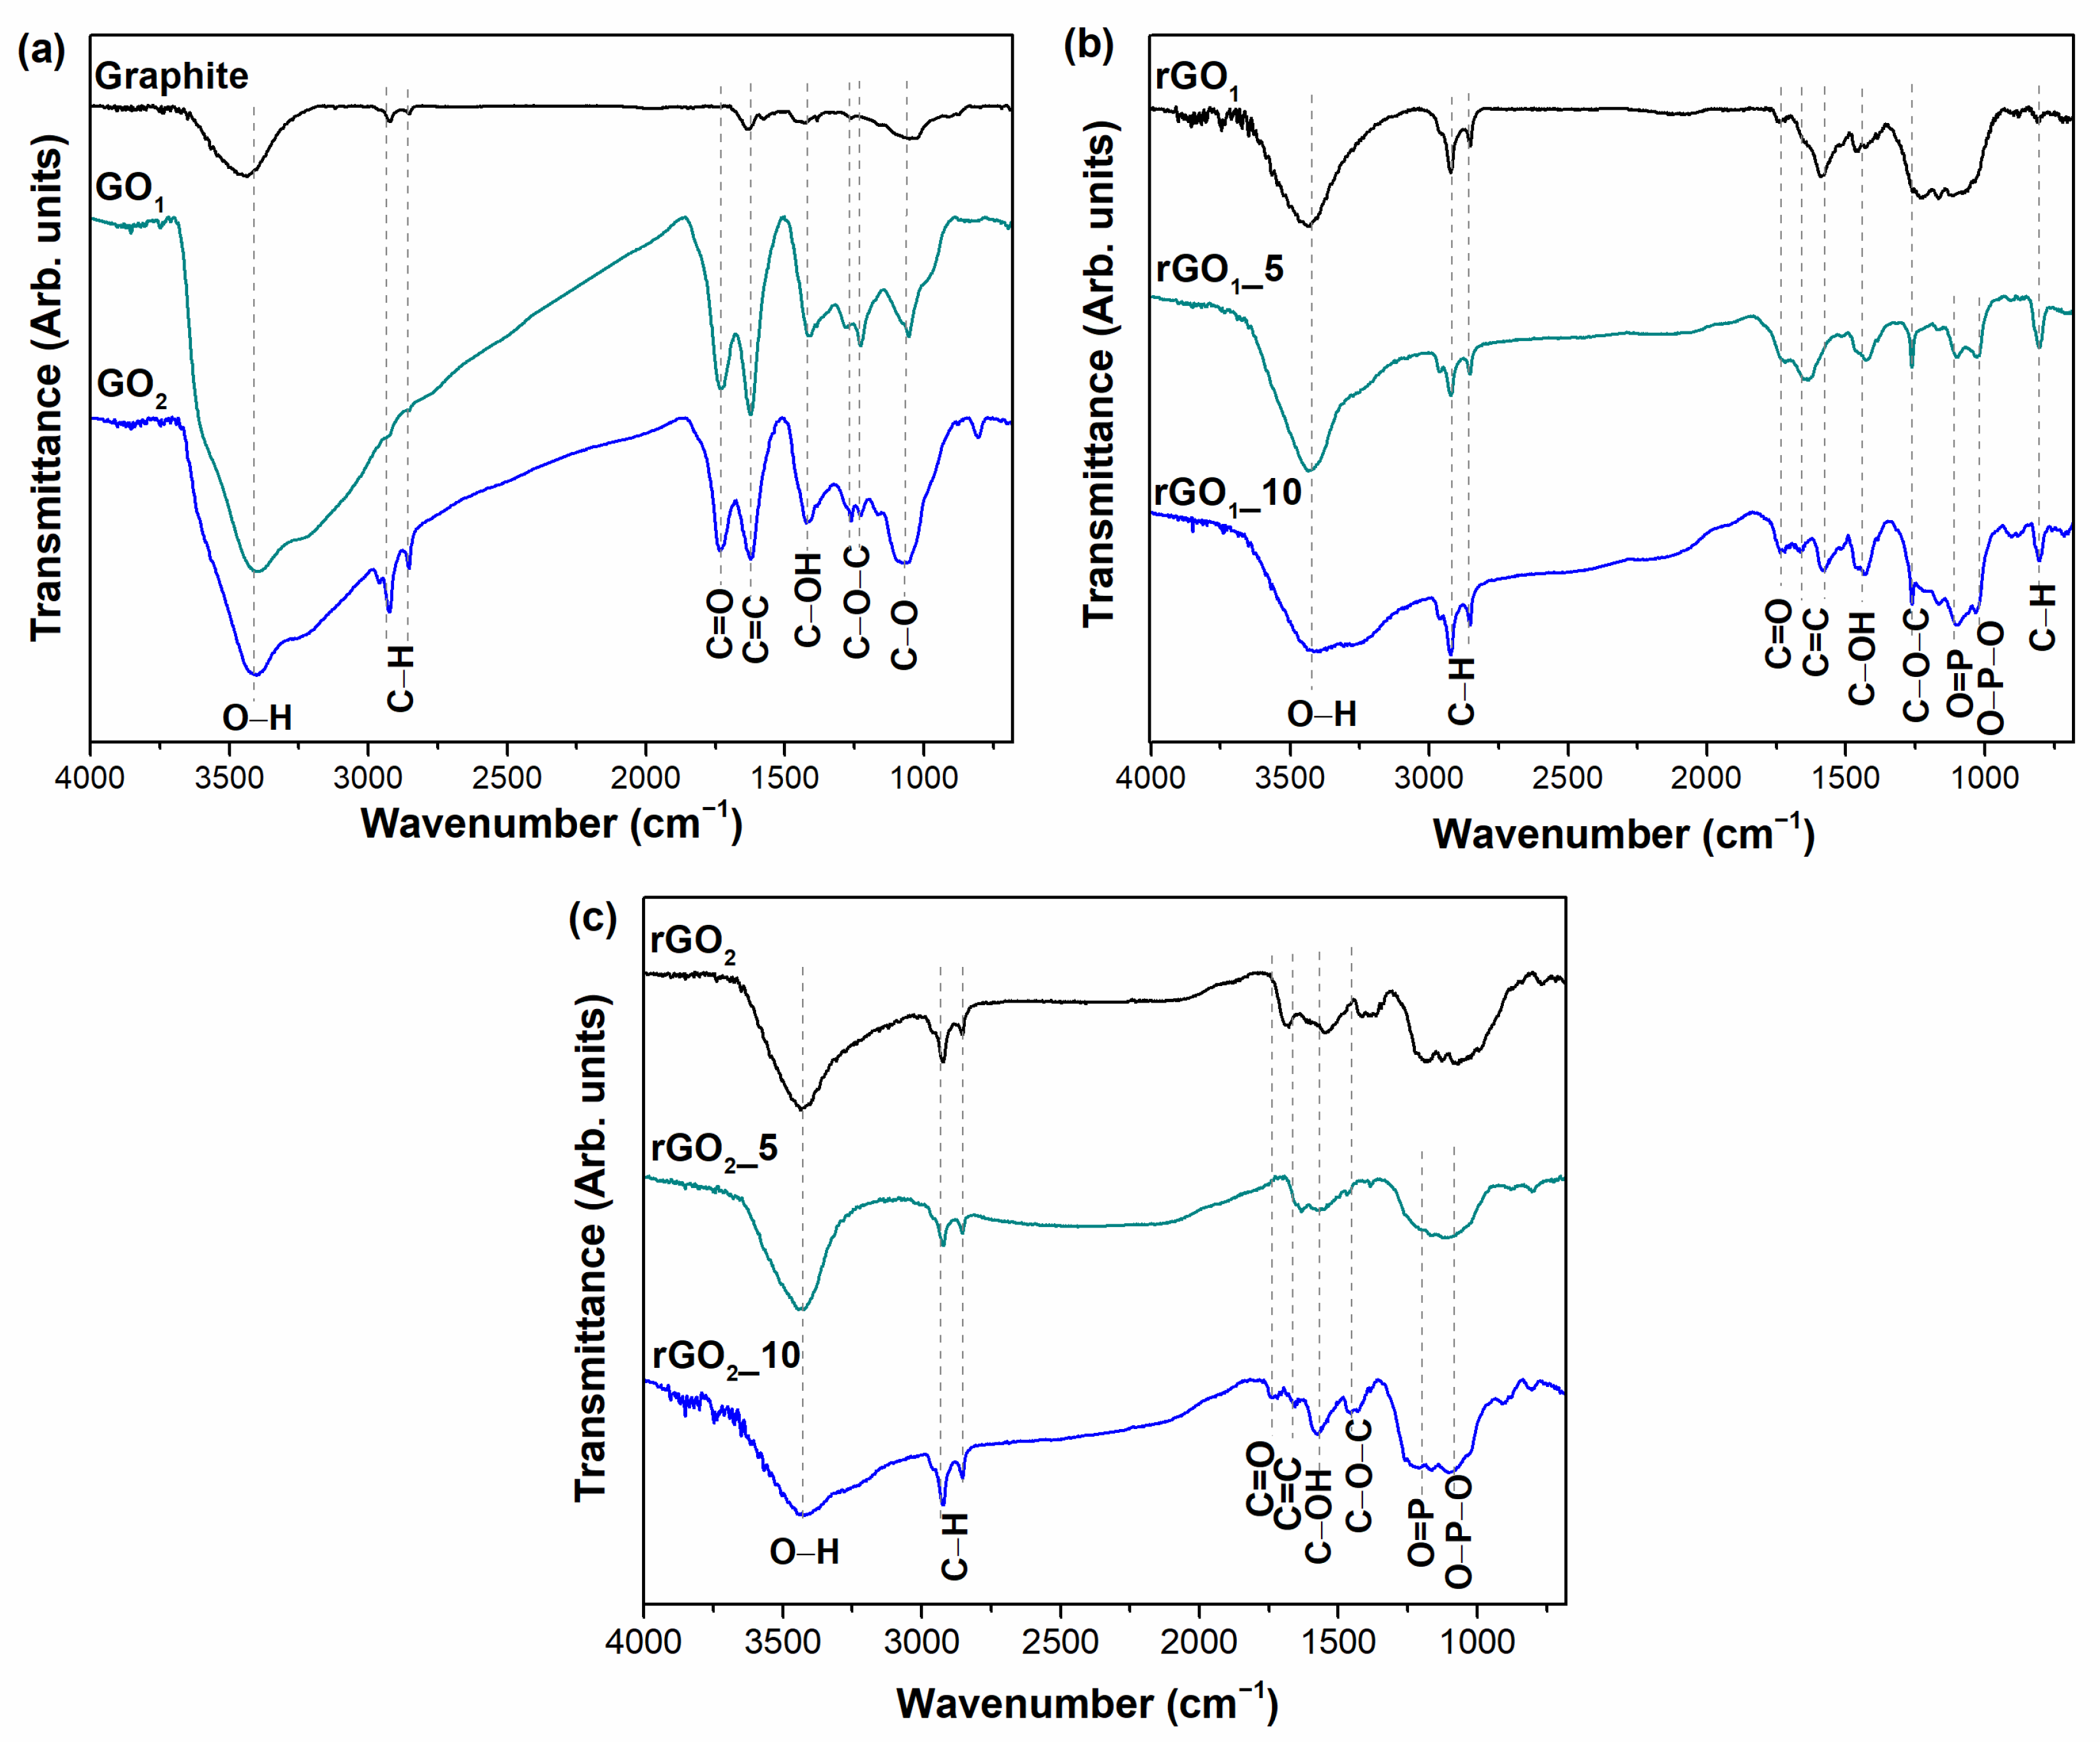
The functional groups on the surface of the samples obtained have been identified by FTIR spectroscopy.
Figure 2 demonstrates the FTIR spectra of the graphite, GO
1, GO
2, and rGO samples. In the spectrum of pristine graphite (
Figure 2a), the non-intensive absorption bands located at 2924 and 2853 cm
−1 correspond to the symmetric and asymmetric stretching modes of the C–H bonds [
32]. Then, a peak at 3444 cm
−1 is attributed to the –OH bonds of adsorbed water molecules. The band at 1633 cm
−1 arises due to the vibrations of aromatic C=C bonds, while the peaks at 1420 and 1052 cm
−1 are ascribed to the vibrations of the phenolic (C–OH) and epoxy groups (C–O), respectively [
33,
34]. The FTIR spectra of the GO
1 and GO
2 samples (
Figure 2a) exhibit quite a similar shape, which may reflect the similar surface composition of these materials. The width and intense band at 3444 cm
−1 corresponds to –OH stretching vibration [
35]. The new peak appearing at 1730 cm
−1 could be attributed to C=O stretching vibrations in carboxyl or carbonyl groups, while the presence of the band at 1622 cm
−1 could be related to the stretching of C=C bonds from unoxidized sp
2 carbon domains or C=O bonds in quinone groups [
34]. The band centered at 1420 cm
−1 is ascribed to –OH deformation vibrations of tertiary C–OH. The absorption modes at 1280 cm
−1 and 1222 cm
−1 are assigned to the C–O–C stretching vibrations in the epoxy functional group [
33]. Moreover, two quite intense methylene group stretching bands at 2924 and 2853 cm
−1 are identified in the spectrum of GO
2, indicating the presence of sp
3 hybridized carbon regions [
32]. Furthermore, the new absorption band centered at 800 cm
−1 could be attributed to the deformation vibrations of C–H bonds of aromatic rings [
33]. The above results demonstrate the presence of hydroxyl, carboxyl, quinone, and epoxy-functional groups and aromatic domains in the structure of GO samples, consistent with results reported elsewhere [
34,
36]. Most of these peaks are also present in the rGO
1 and rGO
2 samples (
Figure 2b,c), but with significantly lower intensities. This notable decrease in the intensity confirms the partial decomposition of oxygen-containing functional groups during the thermal reduction of GO
1 and GO
2 samples. The non-intensive vibrational bands at 3440 cm
−1 and in the range of 1730–950 cm
−1 indicate the remaining hydroxyl, carbonyl, quinone, epoxy, and phenolic functional groups after annealing of GO samples.
The thermal reduction of GO
1 with the mixture of MA (5 and 10 wt%) and P
2O
5 leads to the formation of the same functional groups as can be seen in the FTIR spectrum of rGO
1 (
Figure 2b). Nevertheless, the new peaks appear at 1260, 1160, 1104, and 802 cm
−1 that could be attributed to the formation of C–O–C, O=P, O–P–O, and C–H bonds on the surface of rGO
1_5 and rGO
1_10 samples, respectively [
33,
37]. The presence of phosphorus-containing bonds in those samples confirms the assumption of successful incorporation of P species into the structure of graphene. After thermal treatment of GO
2 with MA and P
2O additive, the FTIR spectra of the rGO
2_5 and rGO
2_10 samples (
Figure 2c) exhibit quite similar spectra, which may reflect similar surface composition of these materials. The spectra of rGO
2_5 and rGO
2_10 contain a peak at 3440 cm
−1 characterizing the vibrations of –OH bonds and bands at 2924 and 2853 cm
−1 identifying the presence of C–H bonds [
34]. However, the FTIR spectrum of rGO
2_5 exhibits two broad absorption bands in the ranges of 1680–1440 cm
−1 and 1310–950 cm
−1. The first wide band can be assigned to the stretching of the C=O and C=C bonds, while the second broad band may present the vibration of the C–O–C, C–OH, O=P, and O–P–O bonds [
33,
37]. The broad band in the range of 1310–950 cm
−1 is also observed in the spectrum of the rGO
2_10 sample that indicates the phosphorus insertion in this sample [
37]. Furthermore, the absorption band at 1580 cm
−1 is related to C=C bonds from aromatic domains showing the partially restored sp
2 hybridized carbon structure in rGO
2_10. These data confirm the results of the XPS measurement showing the effective functionalization of rGO with phosphorus-containing functional groups.
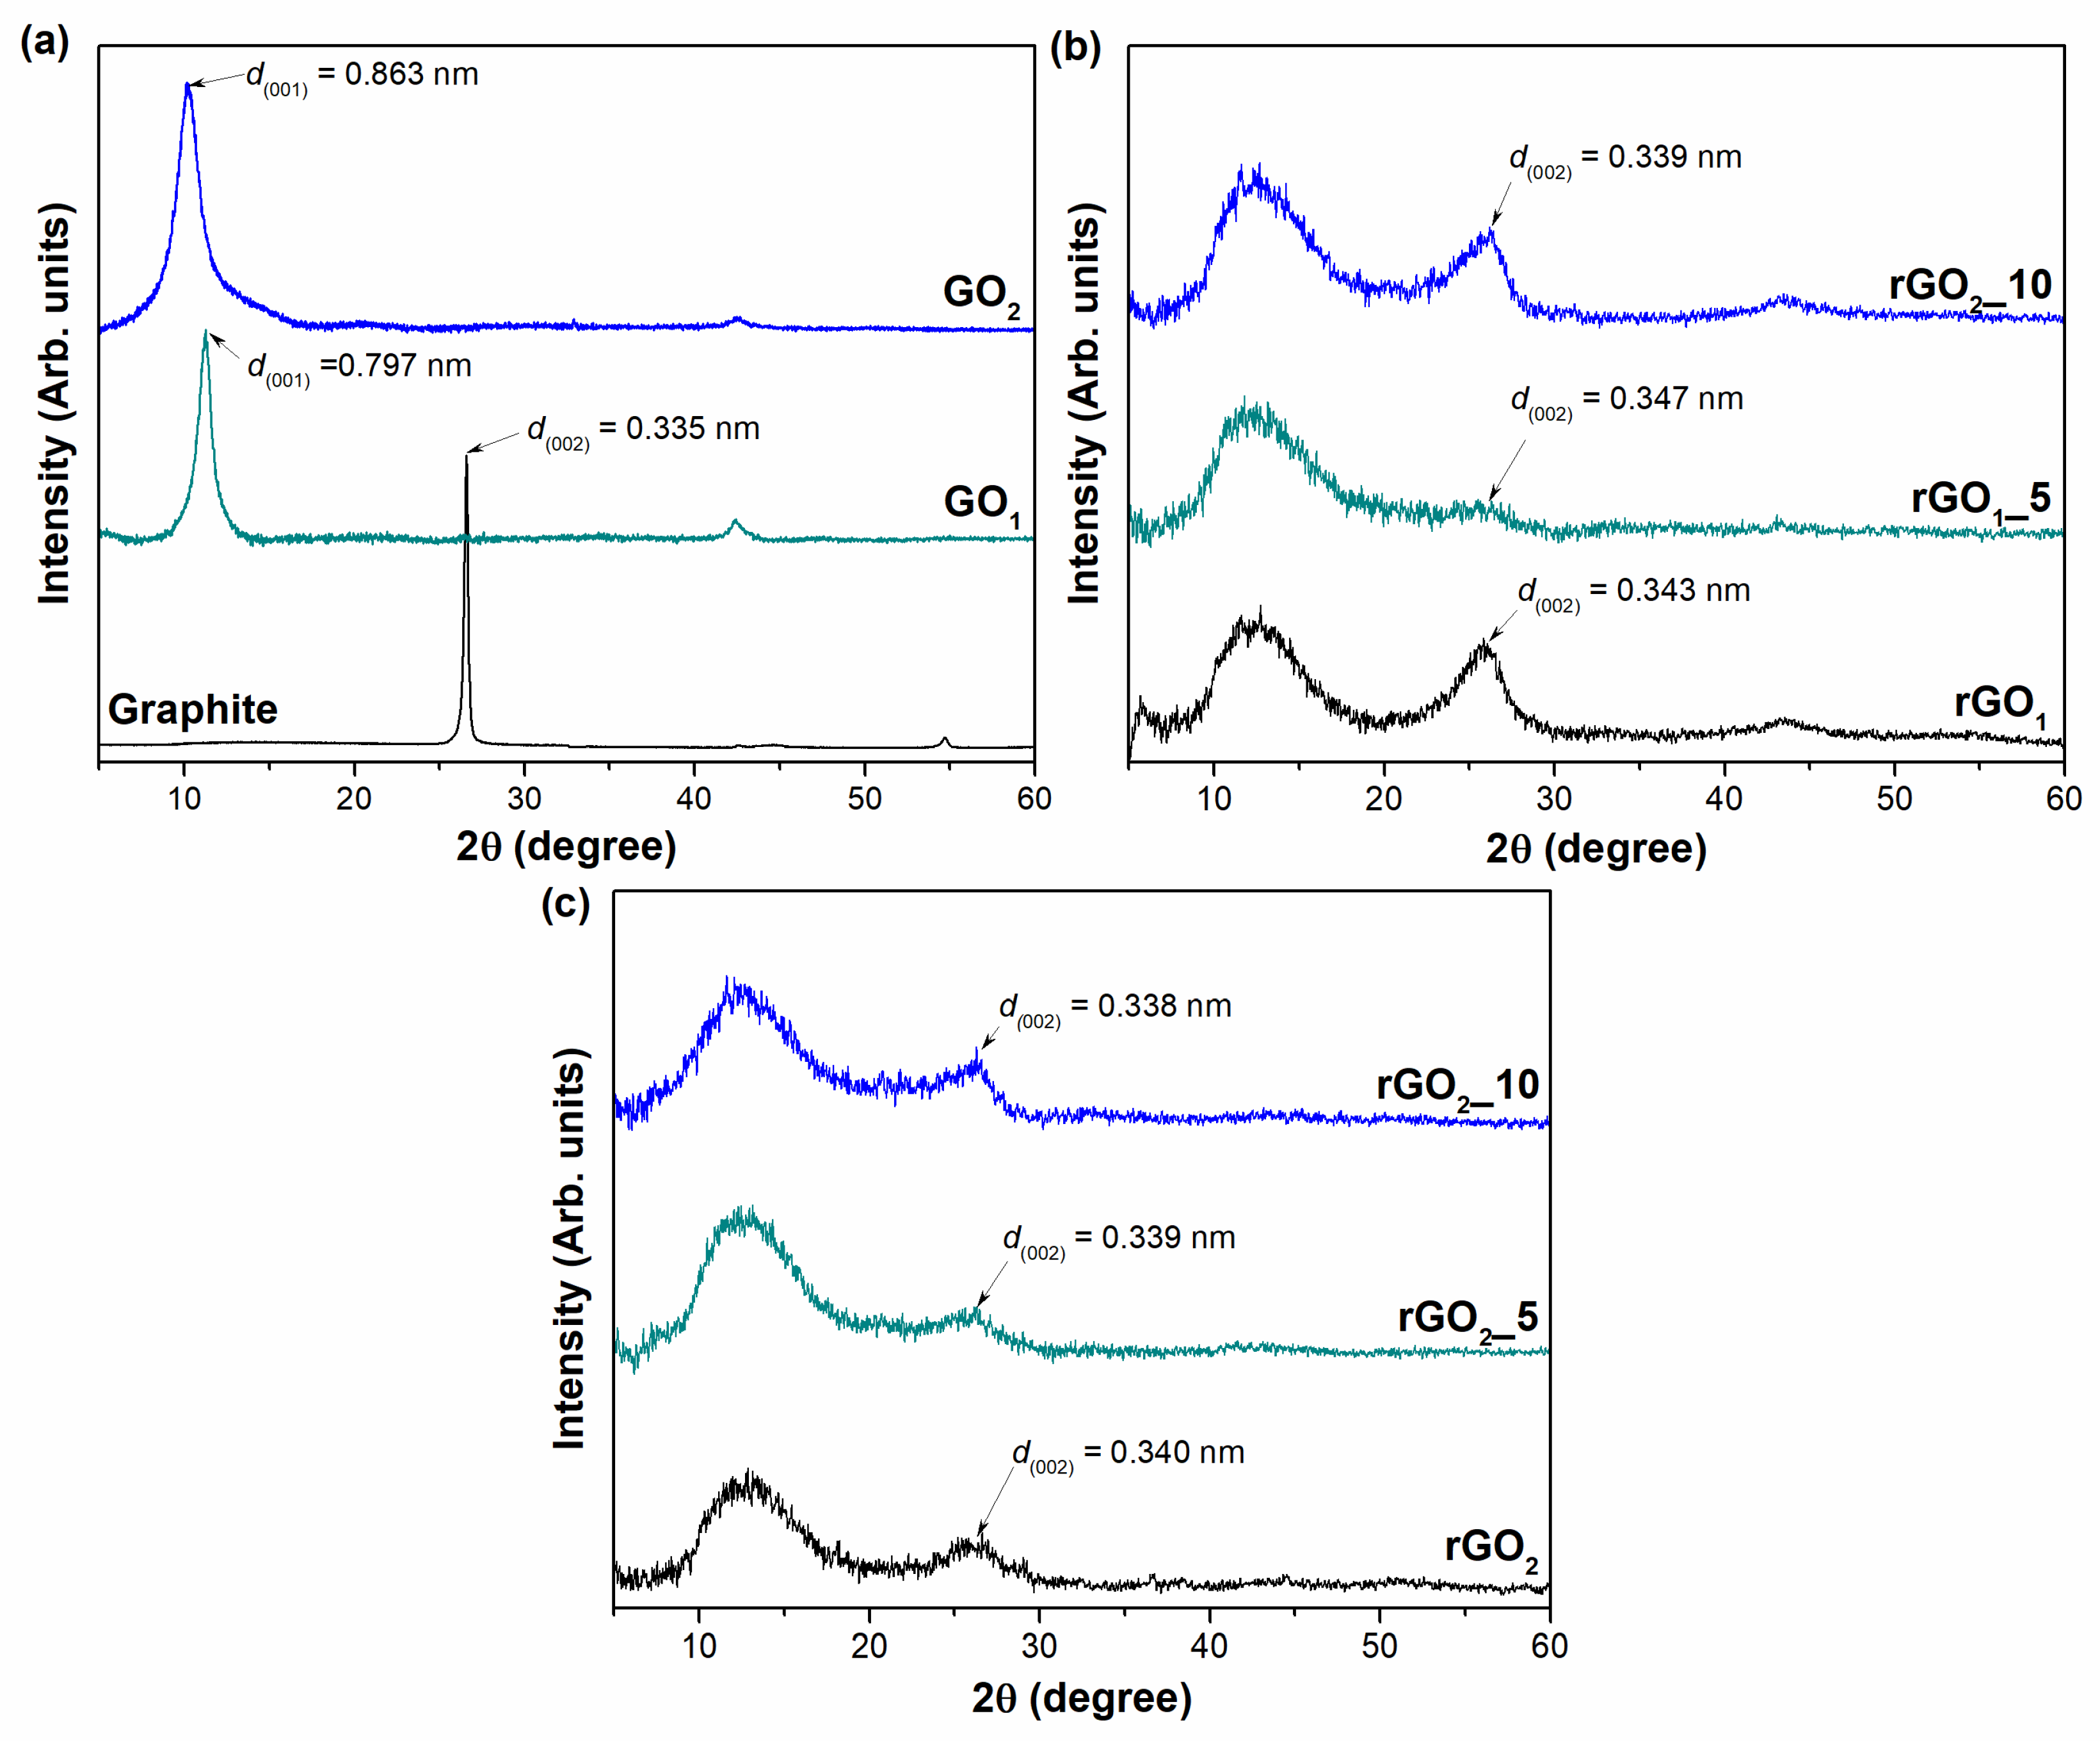
The structural changes of the synthesized samples have been investigated by XRD analysis. The XRD patterns of the graphite, GO, and rGO samples are presented in
Figure 3.
The XRD pattern of the pristine graphite powder (
Figure 3a) exhibits a characteristic peak at 2
θ = 26.60° corresponding to the (002) diffraction reflection and a low-intensity peak at 2
θ = 54.70° that is related to the (004) plane of the hexagonal lattice. According to Bragg’s equation, the interlayer distance d
(002) is determined to be 0.335 nm, which is a typical d-spacing value of graphite. The crystallite size
D reaches a value of about 31.98 nm. After the oxidation process, the (002) reflection disappears, while two new peaks arise in the ranges of 2
θ = 10–11.5° (001) and at 2
θ = 42.38° (100) in both cases of GO
1 and GO
2. The peaks of the (001) planes shift to lower 2
θ angles of 11.28° and 10.24° for the GO
1 and GO
2 samples compared to that of graphite, respectively, due to intercalation of water and the attachment of oxygen-containing functional groups onto the graphitic carbon lattice. Moreover, this results in an increase of the interlayer distance from 0.335 nm in the case of graphite to 0.797 nm and 0.863 nm for the GO
1 and GO
2 samples, respectively. These values are in good agreement with previous reports found in the literature [
38,
39]. The more significant expansion of the d-spacing for the GO
2 sample in comparison with that of GO
1 reveals that the higher oxidation degree of GO is achieved using a pre-oxidation step with the mixture of H
2SO
4, H
3BO
3, and CrO
3. The values of the crystallite size are estimated to be 8.41 nm and 4.50 nm for the GO
1 and GO
2 samples, respectively. It suggests that smaller crystallites are obtained during the synthesis of GO
2 because of the more substantial interruption of the structure due to the higher amount of oxygen-containing functional groups on the GO
2 surface.
Figure 3b,c presents the XRD results of thermally reduced GO
1 and GO
2 samples obtained with and without the use of MA and P
2O
5 additive, respectively. After annealing of GO
1, significant structural differences and changes in crystallinity are observed in all analyzed samples (
Figure 3b). The XRD patterns of the samples produced become broader because of the breakdown of the long-range structure of the GO. Notably, a characteristic diffraction peak of GO (001) still remains in the XRD pattern of the rGO
1 samples (at approximately 2
θ = 12.68–12.80°) and corresponds to interlayer spacing distances of 0.705 nm, 0.702 nm, and 0.692 nm for rGO
1, rGO
1_5, and rGO
1_10, respectively. This can support the conclusion of the elemental analysis, indicating that the reduction of graphene oxide to rGO is incomplete and that residual oxygen-containing functional groups are still present on the surface of rGO
1. It is important to note that the existence of the (001) plane in the rGO
1 samples may suggest the presence of thermally stable (at least at 800 °C) oxygen-containing functionalities, such as carbonyl, quinone, or pyrone groups, in the structure of the rGO samples. On the contrary, it is possible that the fraction of less stable functionalities may remain in the samples since the thermal shock time was relatively short. This could explain the reasons why rGO
1 samples are still high in oxygen [
40]. Nevertheless, a characteristic (002) peak of graphite was observed at 2
θ = 25.92° for the rGO
1, 2
θ = 25.63° for the rGO
1_5, and 2
θ = 26.23° for the rGO
1_10 samples, yielding an interlayer separation of 0.343 nm, 0.347 nm, and 0.339 nm for rGO
1, rGO
1_5, and rGO
1_10, respectively. This indicates that GO
1 reduction has occurred.
The XRD data of the annealed GO
2 samples with and without additives are presented in
Figure 3c. The same trend is noticed that after the thermal reduction of GO
2, the peaks in the XRD patterns of the produced samples become broader. All samples exhibit a low degree of crystallinity, which implies that the graphene layers are randomly arranged along their stacking direction. Moreover, the peak of GO
2 can still be observed in the range of 2
θ = 12.68–12.80°, denoting the coexistence of rGO and GO or the incompletion of the GO
2 reduction. Furthermore, as can be seen in
Figure 3c, the diffraction reflections in the range of 2
θ = 26.14–26.33° are attributed to the (002) plane. The determined values of d
(001) are equal to 0.697 nm, 0.695 nm, and 0.691 nm, while the values of d
(002) are 0.340 nm, 0.339 nm, and 0.338 nm, for rGO
2, rGO
2_5, and rGO
2_10, respectively. The smallest interlayer distance for the rGO
2_10 sample between all reduced products investigated in this research shows that the most efficient restoration of the π-conjugated system is obtained by using the GO
2 sample with the mixture of MA (10 wt%) and P
2O
5. Furthermore, XRD data showed that rGO samples derived from synthesized GO using the H
2SO
4/H
3BO
3/CrO
3 mixture exhibit lower
d-spacing values compared to those of GO
1 reduced products. This tendency is probably related to the higher number of functional groups on the surface of GO
2 that during thermal treatment generates higher values of pressure and energy required for a more efficient reduction process of GO.
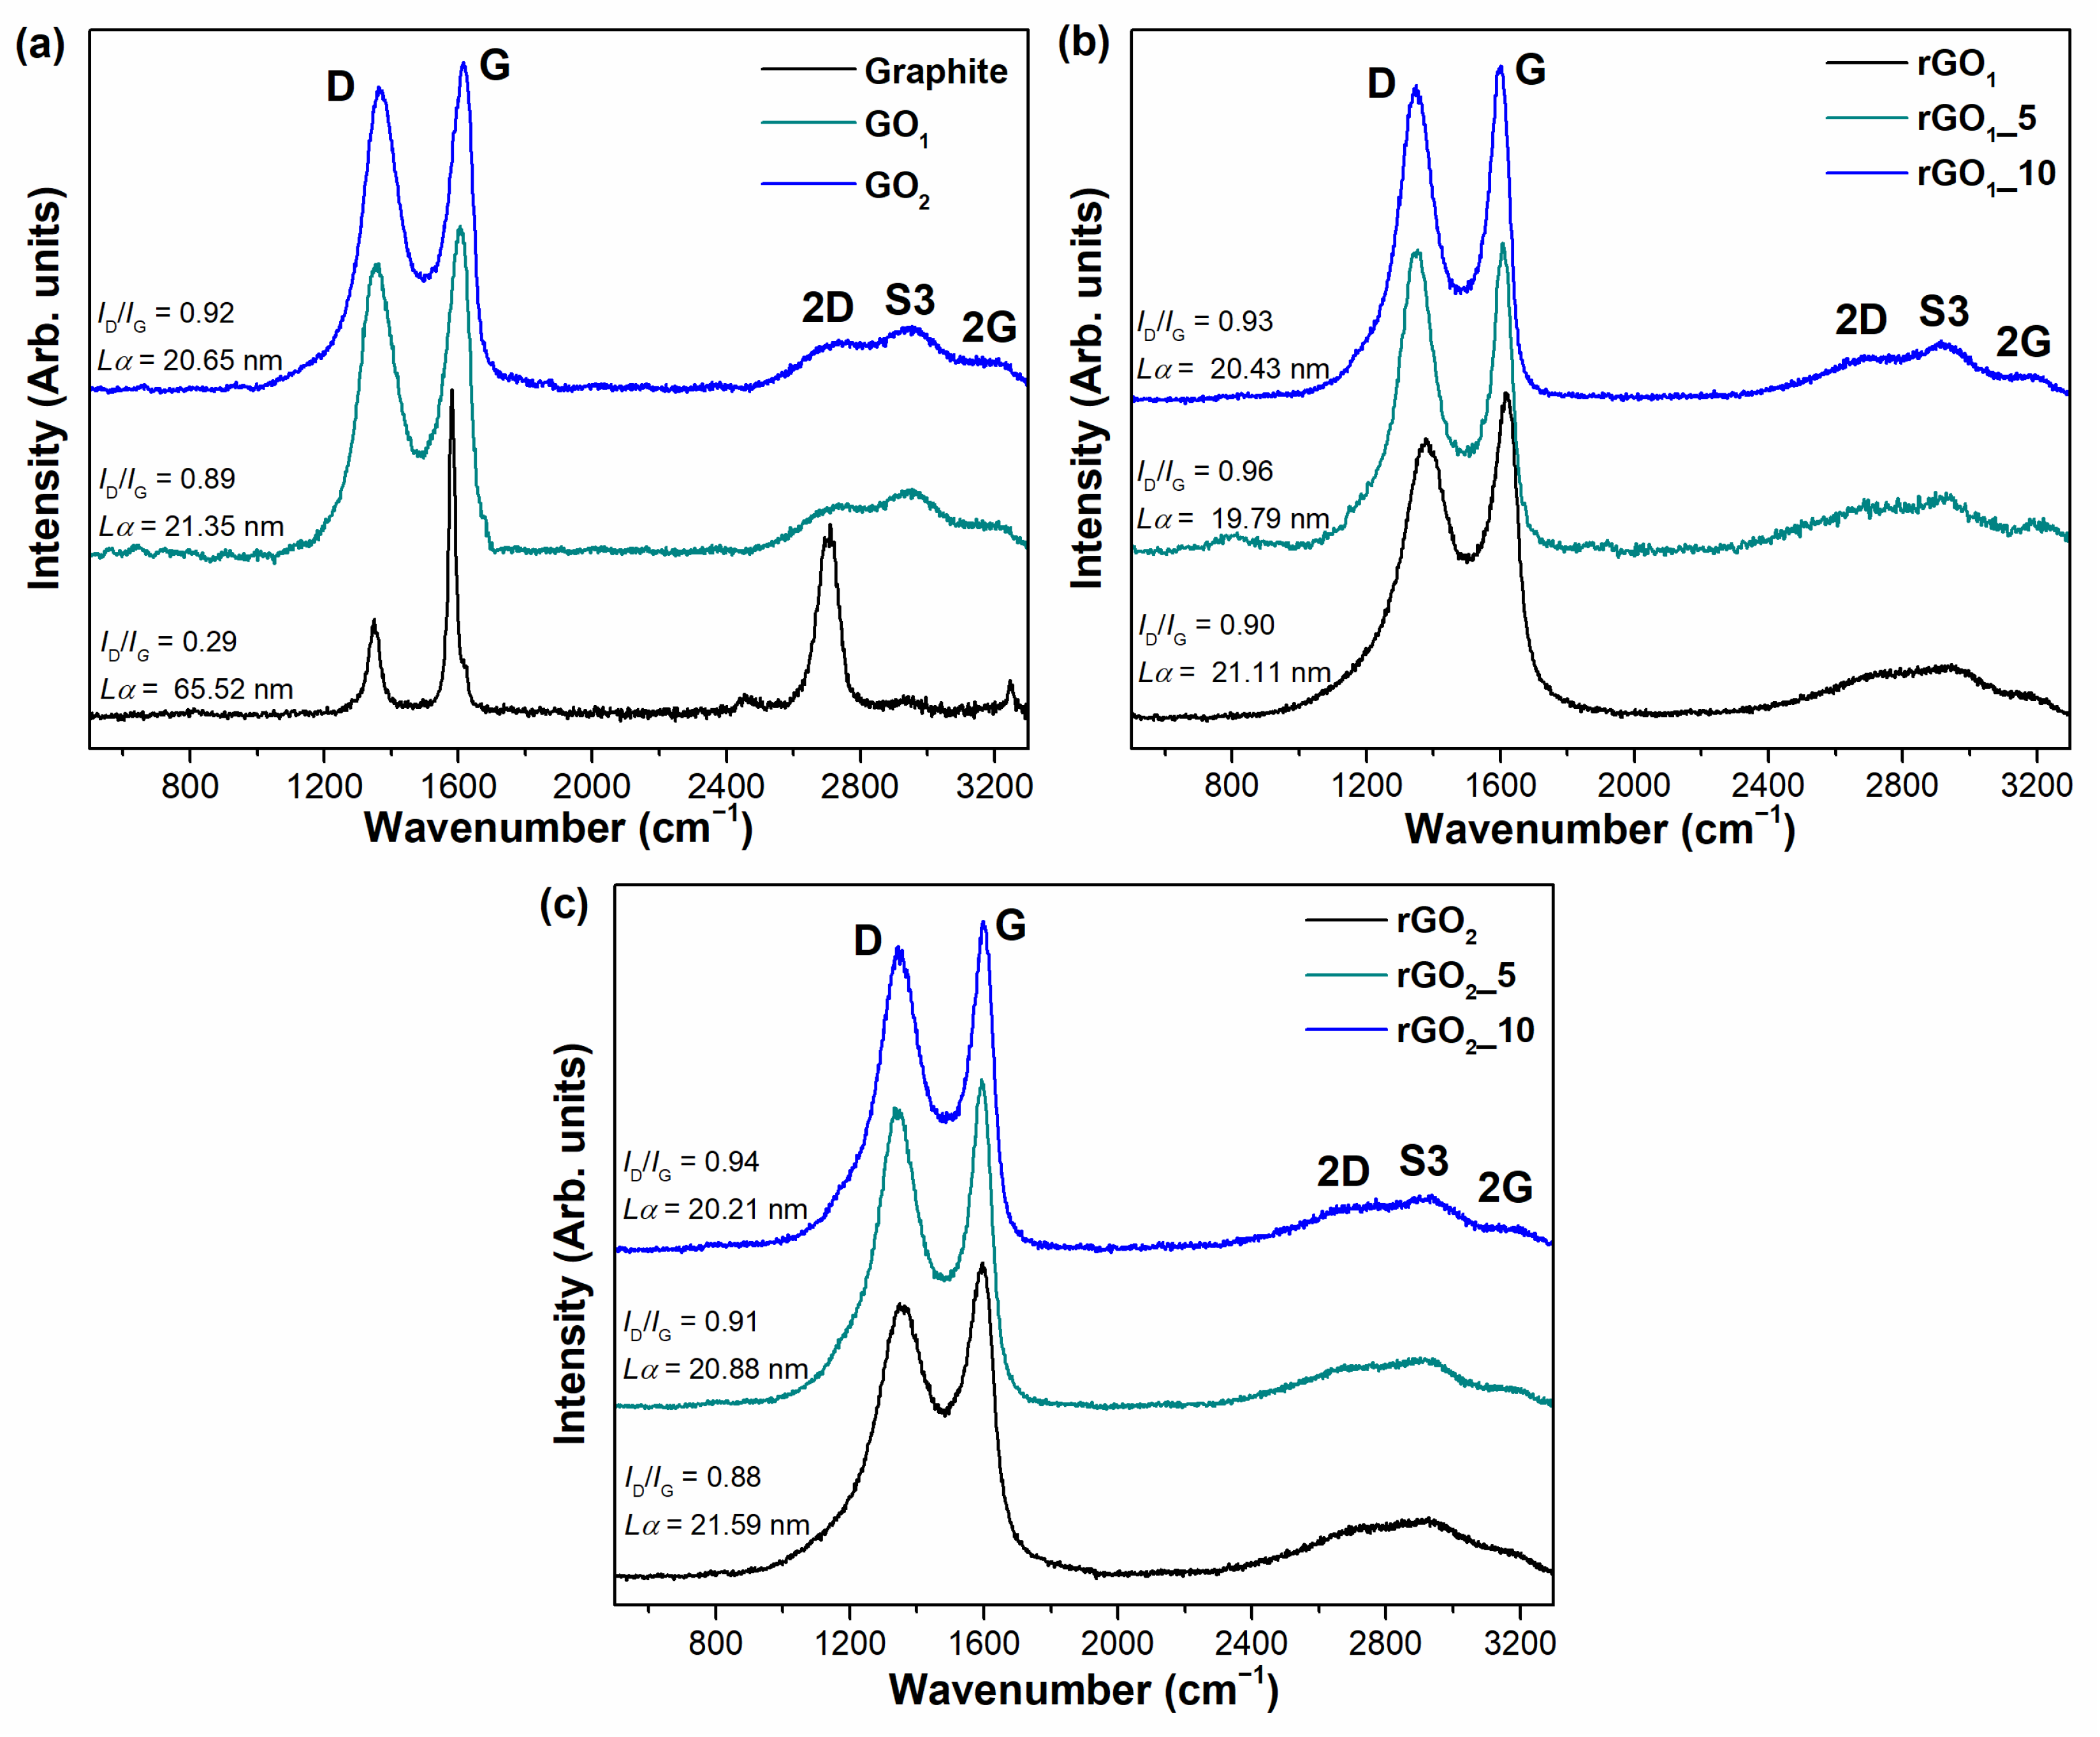
The behavior of the MA and P
2O
5 additive used to repair the π-conjugated system and defective sites of the graphene network during the annealing process were evaluated in detail by using Raman spectroscopy analysis. This technique was employed as a non-destructive, high-resolution, and fast tool to investigate the vibrational properties, the lattice structure, purity, defects, doping, and strain of carbon allotropes [
39]. The Raman spectra of graphite, GO
1, GO
2, and thermally reduced GO
1 and GO
2 samples are shown in
Figure 4.
Figure 4 shows that recorded Raman spectra are similar between all synthesized samples. Each Raman spectrum consists of two dominant peaks located at ~1360 cm
−1 and ~1600 cm
−1, corresponding to the D and G bands, which are typical modes of graphitic materials, respectively. The D band can be visualized as a breathing vibration of six-membered aromatic rings; defects and various disorders, such as carbon vacancies, grain boundaries, dislocations, sp
3 defects, armchair, or zigzag edges, are required for activation of this mode. The G band is associated with in-plane vibrations of pairs of sp
2 hybridized carbon atoms. This mode is always allowed in Raman spectra. The intensity ratio of the D and G modes (
ID/
IG) characterizes the degree of structural disorder in graphene-derived material. The number of defects decreases with a decrease in the
ID/
IG value [
41,
42,
43]. Furthermore, the ratio of
ID/
IG could be used to determine an average crystallite size
Lα (Equation (4)) [
28]. The second order bands are observed in the range of 2500–3300 cm
−1. The S3 peak located at ~2900 cm
−1 is an overtone derived from the combination of D and G modes, while the 2G peak at ~3180 cm
−1 is attributed to an overtone of the G band. The 2D band (also called the G’ band) at ~2700 cm
−1 is a second-order band of the D peak. It is called the 2D band since it involves two of the same phonons responsible for the D band but it does not require the presence of the defects in the structure in contrast with the D band [
44]. The value of
I2D/IG (intensities ratio of 2D and G bands) defines the number of graphene layers in the structure. The number of layers increases with an increase of the G band intensity and the decrease of the 2D intensity [
45]. In this study, the much higher intensity of the G peak is observed in all Raman spectra of synthesized samples compared to that of the 2D band. This suggests the multilayer structure in all obtained thermally reduced GO products.
As can be seen in
Figure 4a, the ratio of
ID/
IG is found to be 0.89 and 0.92 for GO
1 and GO
2 samples, respectively. The higher
ID/
IG value for GO
2 indicates that this sample has a more defective structure than GO
1 due to the higher number of sp
3 defects and other disorders generated by the attachment of oxygen-containing functional groups to the graphene layers. Furthermore, the D and G bands in the GO
2 spectrum are shifted to higher wavenumbers compared to that of GO
1, indicating a greater disruption of the conjugated structure after the oxidation process in the GO
2 sample. Meanwhile,
Figure 4b,c indicates that the values of
ID/IG for rGO samples obtained during thermal reduction of GO with MA and P
2O
5 additives varies from 0.91 to 0.96 and are slightly higher in comparison with those of pure GO. This increase might be due to the removal of functional groups and the high release of gaseous products during thermal reduction that causes disorders in the structure, such as vacancies, dislocations, armchair, and zigzag edges. Furthermore, from
Figure 4b,c it can be noted that the thermal treatment of GO in the presence of additives causes a slightly higher
ID/IG value than that of the thermal treatment of GO without additives. The value of the
ID/IG could rise due to the presence of phosphorus atoms in the structure of the rGO samples, which were effectively introduced during thermal treatment of GO in the presence of the MA and P
2O
5 mixture. These phosphorus atoms could be attached to the graphene layer in the form of C–P–O or C–P=O bonds generating sp
3 defects and, also, may be able to replace carbon atoms creating new point defects in the structure due to the higher atomic radius of P than that of C atoms. Nonetheless, this slight increase of
ID/IG does not detract from the benefits of the use of carbon suboxide in the thermal reduction of GO since lower values of
ID/IG are obtained compared to the results investigated by other authors [
18,
29,
45,
46]. Furthermore, the values of
Lα vary from 19.79 to 21.59 nm between all synthesized samples showing that the crystallite size remains similar during the thermal treatment in the presence and absence of the addition of MA and P
2O
5 mixture.
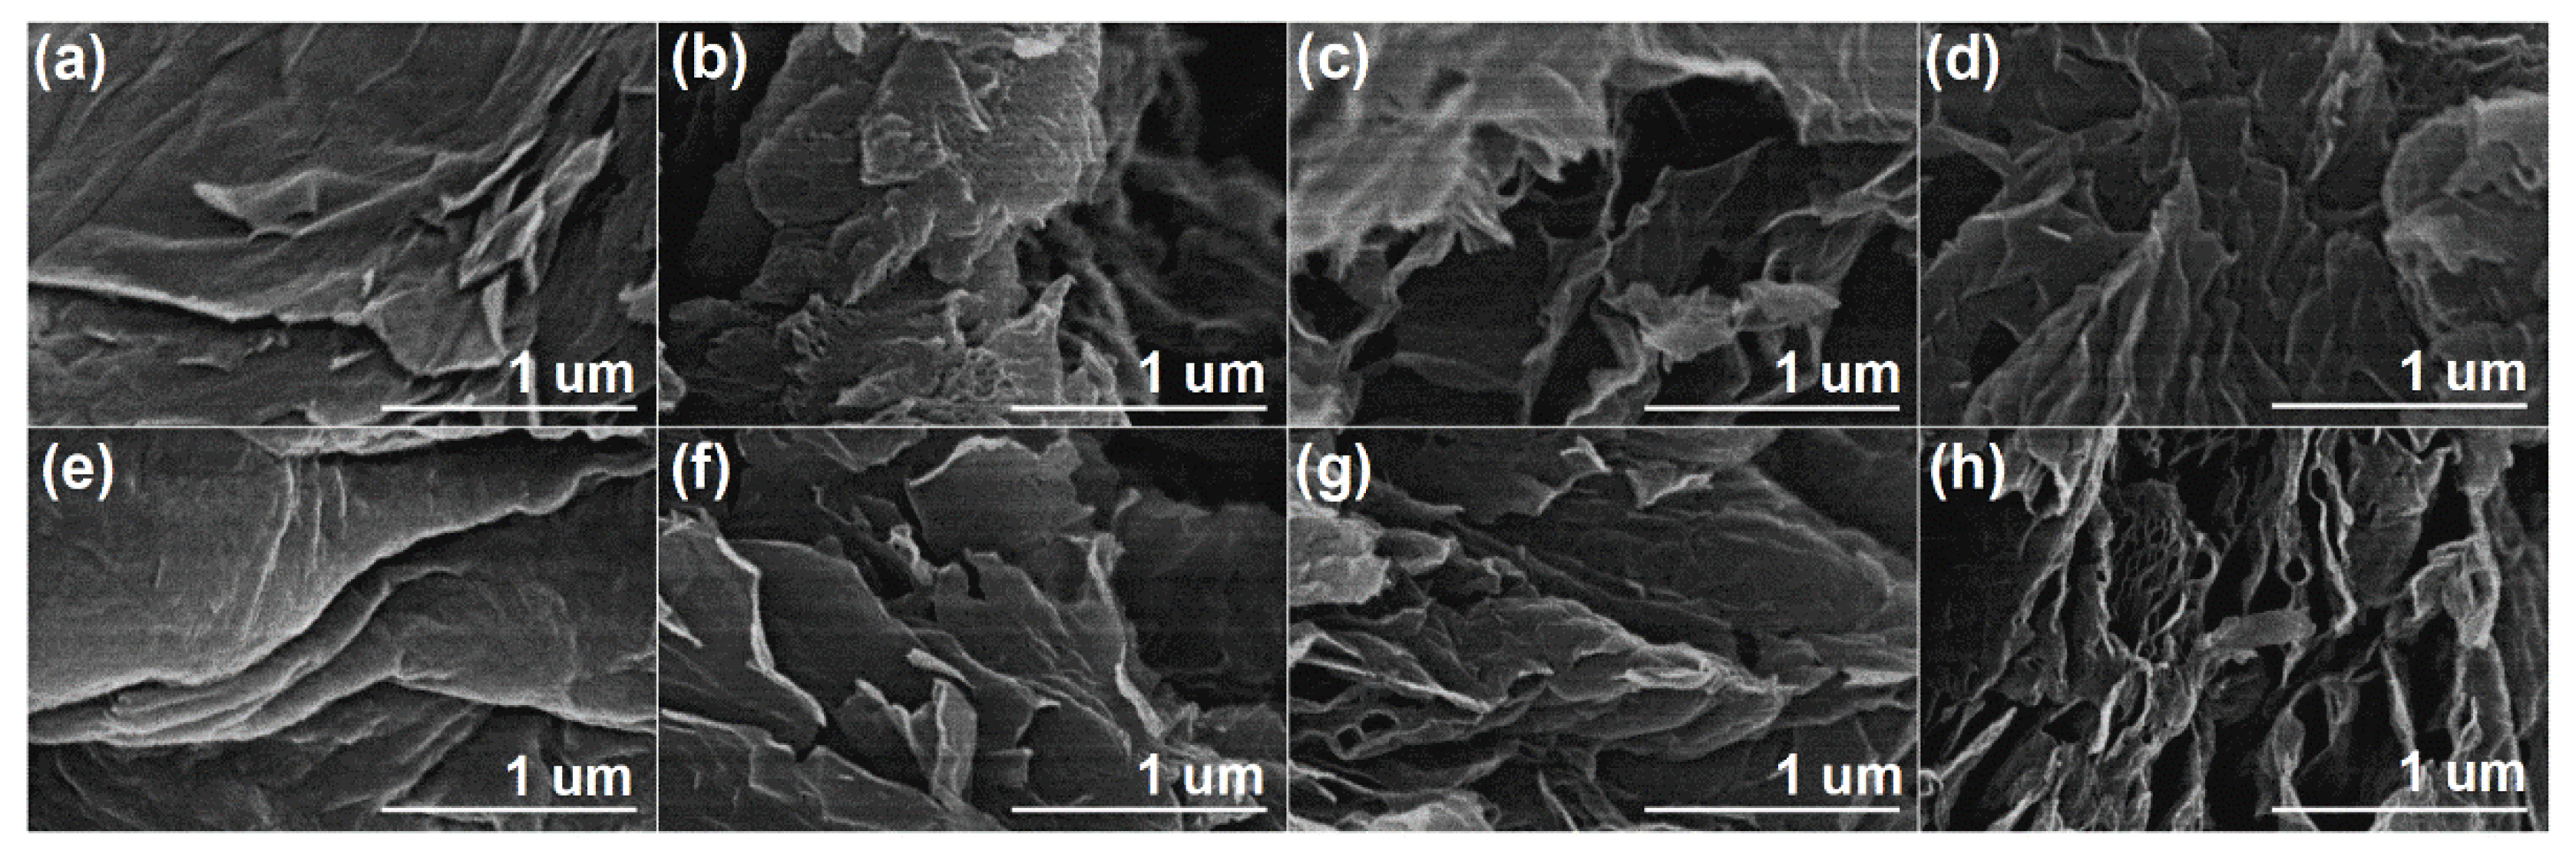
The morphology of thermally reduced GO samples was studied using SEM analysis at 50,000× magnification (
Figure 5). SEM images of the GO
1 and GO
2 samples (
Figure 5a,e) present a well-ordered layered structure with folds and wrinkles. This is a consequence of the oxidative treatment of graphite by the attachment of oxygen functional groups. After thermal reduction of the pure GO
1 sample (
Figure 5b), the layers agglomerate and form carbon derivatives of about 1 μm in size. The heat treatment of GO
1 with the mixture of MA (5 wt%) and P
2O
5 (
Figure 5c) leads to irregular stacking of graphene layers with multiple folds. The further increase of additives in the thermal reduction of GO
1 creates a corrugated morphology, as can be seen in
Figure 5d. These obtained folded sheets could be related not only to the reduction process but also to the insertion of phosphorus into the rGO
1_5 and rGO
1_10 structures, because the phosphorus atoms form a pyramid-like structure in the graphene sheet due to increased bond length and decreased bond angle [
23,
47]. After the reduction of pure GO
2 (
Figure 5f), no agglomerates are observed, but the graphene layers are disrupted into smaller randomly arranged sheets. The rGO
2_10 sample is composed of numerous thin layers that are randomly stacked together, forming a porous network. Furthermore, as can be seen from
Figure 5g,h, both reduced GO
2 samples in the presence of additives (rGO
2_5 and rGO
2_10) exhibit nanosheets with folded and crumpled features that could also be attributed to the doping of rGO with phosphorus atoms.
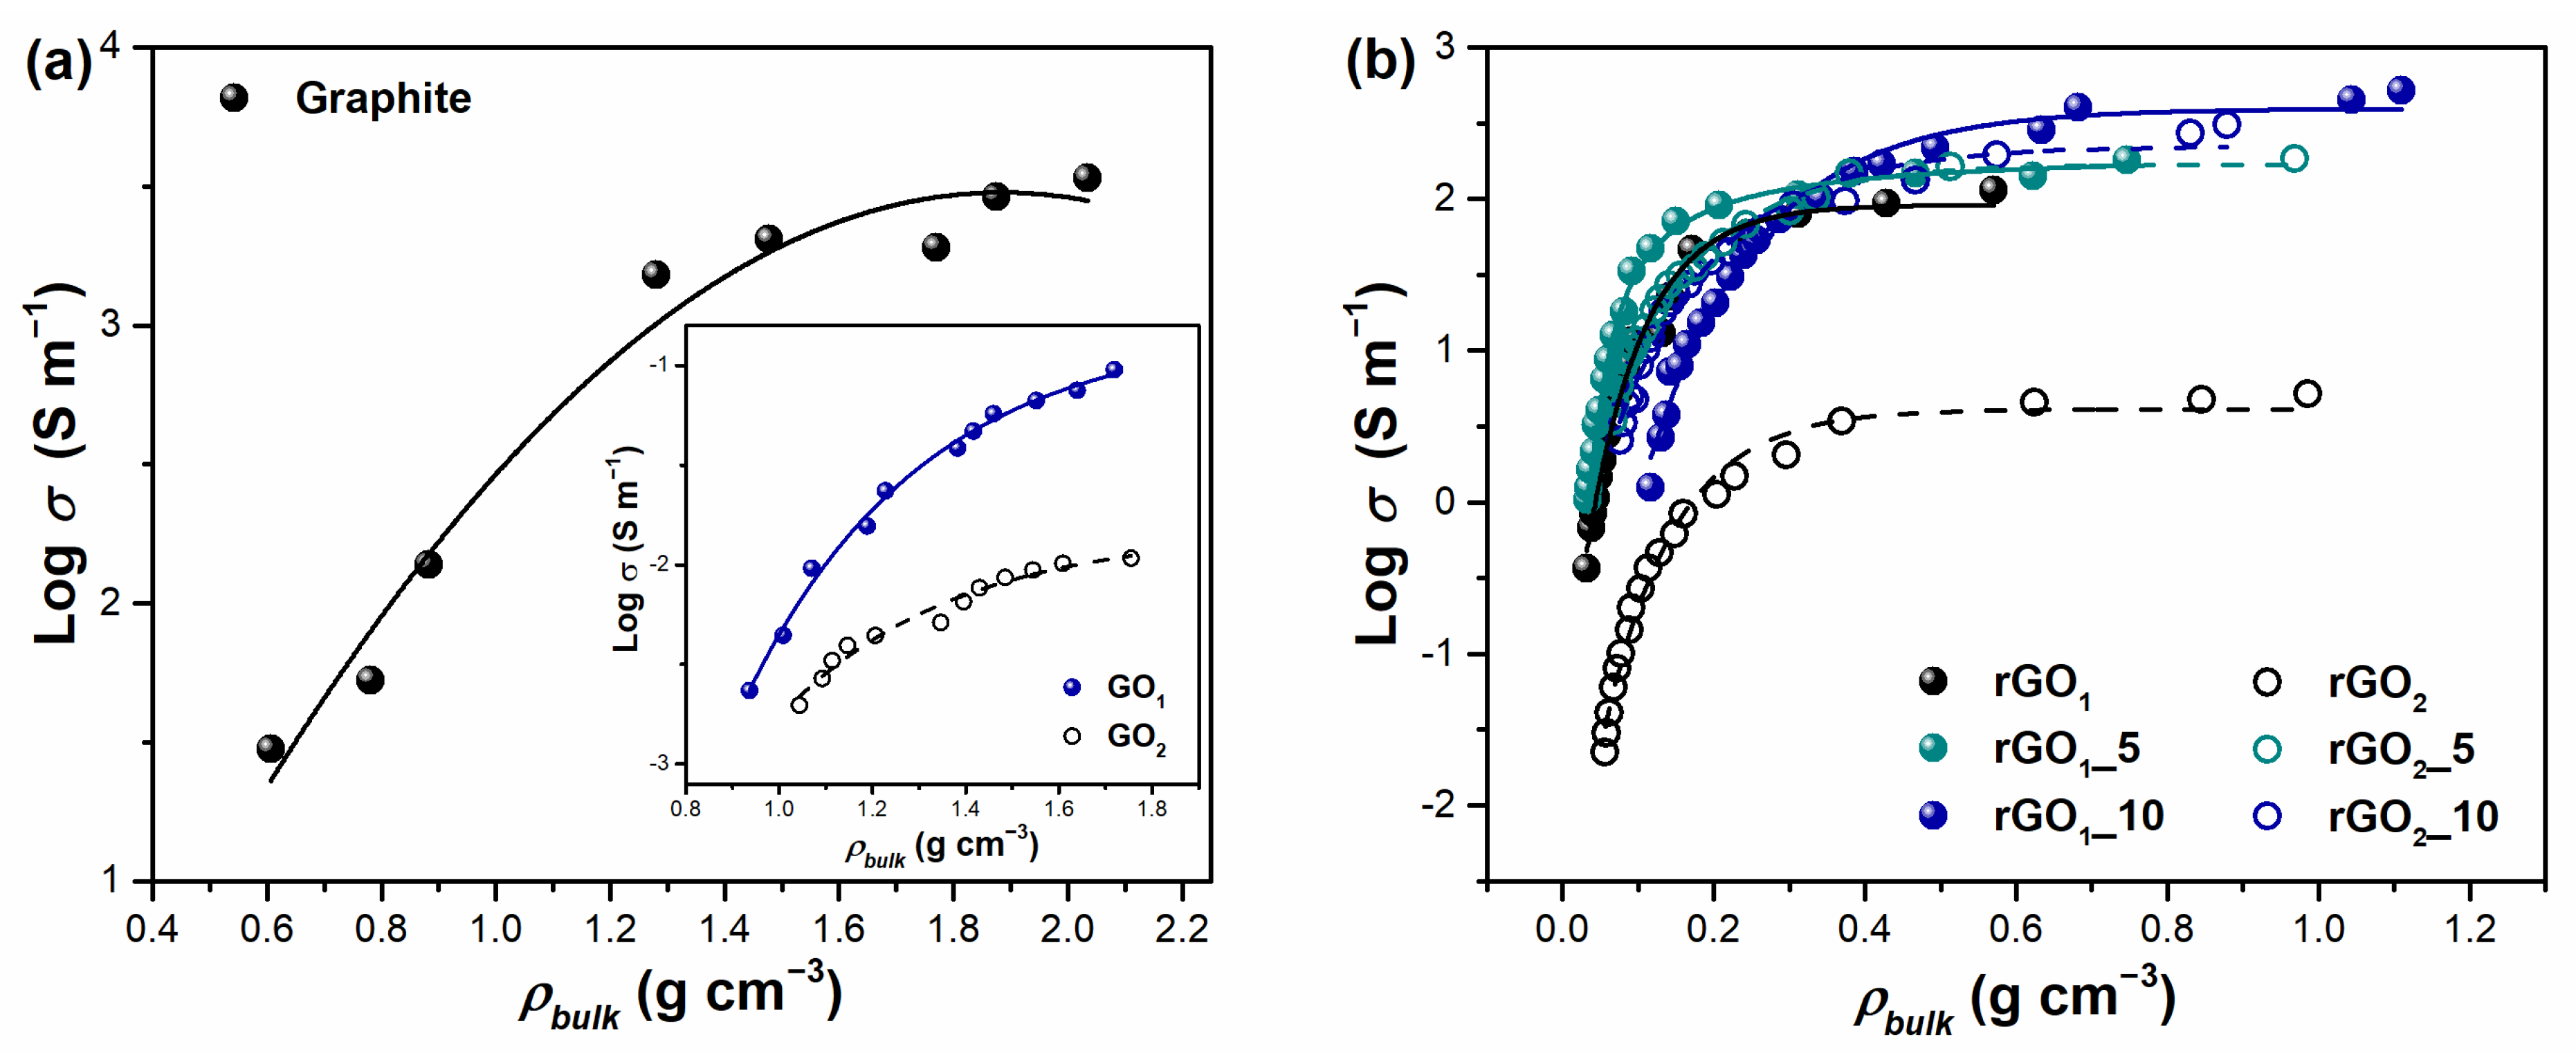
Electrical conductivity is one of the key characteristics determining the successful application of rGO in various electrochemical systems such as (bio)sensors, supercapacitors, fuel cells, etc. The electrical behavior of non-metallic powders, including carbonaceous compounds, could be estimated by monitoring the electrical conductivity of bulk materials under compression [
48]. Consequently, in this study, the relationship between electrical conductivity (
σ) on the logarithmic scale and bulk density (
ρbulk) was determined. The results presented in
Figure 6 reveal that the electrical conductivity of prepared carbon materials increases with the increasing of
ρbulk value. This trend is in accordance with the electrical conductivity and resistivity results of graphene, graphite, graphite oxide, carbon black, and carbon nanotubes reported in [
48,
49,
50]. By compressing a bulk material, closer contact between particles is achieved, leading to higher electrical conductivity because higher electron mobility is ensured in the sample. Following this, the highest electrical conductivity is established with maximum values of bulk density when the most compact arrangement of particles is obtained. The electrical conductivity of pristine graphite is dependent on the compression of the sample as well. From
Figure 6a, it can be noted that graphite is a good electrical conductor. Log electrical conductivity varies in the range 1.47–3.53 S m
−1, approaching the theoretical values [
50]. Besides, the maximum value of
ρbulk for graphite powder is found to be 2.03 g cm
−3, which is a similar result to the theoretical value of its density reported in the literature (
ρ = 2.26 g cm
−3) [
51]. Meanwhile, the electrical conductivity of both synthesized GO
1 and GO
2 samples is significantly lower than that of graphite. This decrease is certainly due to the existence of a large number of oxygen-containing functional groups in the backbone of the graphene sheet. Upon oxidation treatment of graphite its band gap significantly broadens due to the disruption of the sp
2 carbon network and the attachment of numerous oxygen-containing functionalities to the surface that inhibit the effective electron transport. Furthermore, higher resistivity is estimated in the case of GO
2, which proves the higher degree of oxidation for GO
2 compared to that of GO
1.
Figure 6b represents the dependence of electrical conductivity on bulk density for thermally reduced GO samples. It should be noted that the bulk density values for all annealed compounds are significantly decreased compared to those of their precursors (GO
1 and GO
2). This drastic change in density indicates the porous structure of products after thermal treatment. The highest bulk density corresponds to the rGO
1_10 sample (
ρbulk = 1.11 g cm
−3), while the lowest density value is determined for the rGO
1 product (
ρbulk = 0.57 cm
−3). Furthermore, a remarkable enhancement of electrical conductivity is observed after the thermal decomposition process of GO in the presence of the MA and P
2O
5 mixture. The higher the amount of additives used in the thermal reduction reaction, the higher the conductivity achieved. In addition, higher electrical conductivity values in the case of rGO samples are achieved at lower densities than that of graphite. This makes these materials promising in the production of supercapacitor electrodes. Log conductivity (S m
−1) appears to be in the range of –0.43–2.05 for rGO
1, 0.01–2.25 for rGO
1_5, 0.09–2.72 for rGO
1_10, –1.65–0.71 for rGO
2, 0.53–2.26 for rGO
2_5, and 0.40–2.48 for rGO
2_10, showing the semi-conductor properties of samples. These electrical conductivity values of rGO are similar to previous reports found in the literature [
49,
52]. It should be highlighted that the most obvious advantage of the use of additives is observed in the set of thermally reduced GO
2 samples. As can be seen from
Figure 6b, rGO
2 without additives shows the worst conductivity between all reduced products, but the addition of MA and P
2O
5 enhances electrical conductivity extremely in rGO
2_5 and rGO
2_10. These reduced samples exhibit values close to the reduced GO
1 products with additives indicating the achieved effective recovery of π-conjugated system. Moreover, it could be clearly seen that the addition of MA (10 wt%) and P
2O
5 in the thermal reduction of GO leads to the highest values of electrical conductivity between all reduced samples. This suggests that carbon suboxide used in the thermal reduction reaction of GO could repair the sp
2 hybridized carbon structure and improve electron mobility. However, the presence of phosphorus atoms observed by EDX and FTIR analysis could also influence the electrical behavior of the rGO
1_5, rGO
1_10, rGO
2_5, and rGO
2_10 samples because phosphorus atoms are capable of modulating the electronic structure and decreasing the resistivity of graphene-based derivatives. The incorporation of phosphorus species may increase the density of charge carries in the carbon product due to the contribution of phosphorus electrons to the graphene π-conjugated system [
23]. Overall, the obtained electrical conductivity data indicate that the thermal reduction of GO with the use of the MA and P
2O
5 mixture has a positive impact on electronic properties of the final products. The relatively high conductivity at low values of bulk density demonstrates the possibility of applying thermally reduced GO samples for metal-free and cheap carbon-based electrode materials.
The samples having the highest values in electrical conductivity (rGO
1_10 and rGO
2_10) were analyzed using TEM analysis to compare their structure morphology and crystallinity in detail. Obtained TEM and SAED patterns are presented in
Figure 7.
The TEM image of the rGO
1_10 specimen clearly shows several transparent reduced graphene oxide layers with wrinkled and folded features originated from the exfoliation process and incorporation of phosphorus atoms in the structure of graphene layer. However, the existence of darker areas indicates thick stacking nanostructure in some regions. In contrast, rGO
2_10 consists of a remarkable multi-layered structure with corrugations that confirms the presence of structural defects in the nanosheets. The SAED images presented in
Figure 7b,d show typical ring-like patterns indicating the polycrystalline nature of the rGO
1_10 and rGO
2_10 samples [
53]. Nevertheless, the more obscure and featureless rings with unclear diffraction spots in the SAED image of rGO
2_10 are evidence of a more amorphous and disordered structure compared with that of rGO
1_10. For this reason, the rGO
2_10 sample may contain a larger number of sp
3 regions and phosphorus atoms in its structure. Based on obtained XRD analysis data it is determined that the inner ring shown in SAED images is associated with the diffraction of (002) planes and the outer ring describes (100) planes. This is in accordance with the study on the SAED patterns of reduced graphene oxide reported by Ngidi et al. [
54]. The presence of both planes (002) and (100) confirms the partial restoration of sp
2 structure in both rGO
1_10 and rGO
2_10 samples.


 ,
, 


