Article

The Use of Plasmonic Spectroscopy for Detecting Ultra-Low Concentrations of Substances

A.M. Prokhorov Institute of General Physics, Russian Academy of Sciences, 119991 Moscow, Russia
*
Author to whom correspondence should be addressed.
Photonics 2022, 9(5), 281; https://doi.org/10.3390/photonics9050281
Submission received: 28 February 2022 / Revised: 4 April 2022 / Accepted: 19 April 2022 / Published: 20 April 2022

Abstract

:
This paper presents the results of research into the excitation of a surface electromagnetic wave (SEW) in Au/AgI and Au/Ag films contacting aqueous solutions of hydrogen peroxide (H2O2) and sodium chloride (NaCl). The dependences of the SEW excitation angle in the Kretschmann configuration on the interaction time of the solution with the metal film have been obtained. The effect of an aqueous H2O2 solution on the AgI and Ag film under prolonged exposure has been demonstrated. It has been shown that the dynamics of the excitation angle can be used to estimate the concentration of solutions with low and ultra-low concentrations. As an example, the results of using the technique for the analysis of aqueous solutions of NaCl are presented.

1. Introduction

The issue of studying solutions with low and ultra-low concentrations has recently attracted increasing attention. Many studies have been published demonstrating special properties of such solutions. These features can appear in optical [1,2], physical-chemical [3,4], structural [5], and other properties of highly diluted solutions.
In turn, small concentrations of aqueous solutions of hydrogen peroxide (H2O2) are of great importance in molecular medicine and biological research. At concentrations in the low nanomolar range, H2O2 acts as a signaling molecule and resembles phytohormones in many ways. This paper shows the possibility of detecting ultra-low concentrations of H2O2 in water. Such concentrations are typical for processes that occur when water is exposed to external influences [6]. In our research, we studied aqueous solutions of H2O2 with various dilution levels on the surface of Au/AgI and Au/Ag double films with hydrogen peroxide concentrations of 10−8 M, 10−6 M and 10−4 M for the Au/AgI surface and 10−10 M and 10−8 M for the Au/Ag surface.
To measure H2O2 solutions with an ultra-low concentration, we used the method of excitation of a surface electromagnetic wave (SEW) at the interface of Ag/H2O2 and Au/H2O2 with an intermediate layer of AgI [7]. This technique, which is based on the spectroscopy of surface electromagnetic waves, is the easiest one to use. It allows one to study a substance in a narrow, near-surface layer at the metal/dielectric medium interface.
In the approach of plane electromagnetic waves, the sensitivity of the simplest Kretschmann and Otto methods can be estimated using the formula [8]:
cos θ d θ = 2 ε m 3 n 2 2 2 n p ε m d n 2
where θ is the angle of reflection minimum, εm is the dielectric permittivity of the metallic film on which the SEW is excited, np is the refractive index of the bond prism, and n2 is the refractive index of the aqueous solution in the near-surface layer.
According to this equation, one can see that the sensitivity in terms of the refractive index in the order of magnitude is approximately equal to the accuracy of the measurement of the excitation angle. In a real experiment, the accuracy of measuring the excitation angle may be limited by the angle of divergence of the laser beam exciting the SEW. In particular, when measuring without collimating optics, the divergence of the laser beam is approximately 10−3 rad. That is, the sensitivity of the technique based on the excitation of SEW in the Kretschmann or Otto configuration is approximately 10−3 RIU (refractive index units). To increase the sensitivity, it is necessary to reduce the divergence of the laser beam and ensure angular measurements with an accuracy that is not inferior to the angular divergence of the beam.
If the dielectric medium studied is a liquid, this technique, even with a resolution of 10−3 RIU, can show greater sensitivity due to the fact that the SEW probe field will propagate in the formation region of a transition layer called a double electric layer or a Helmholtz layer [9]. If the concentration of ions in this layer exceeds their volume concentration, the sensitivity of the method will be increased.
In addition, in the case of liquid media, chemical or physical interactions of the solution with the metal surface may occur. In this case, the interaction products can also lead to an increase in the sensitivity of the technique. It is known that the most effective metals for the excitation of SEW are gold and silver. Gold is characterized by chemical neutrality to many liquid solutions, while silver has little chemical activity to aqueous solutions.

2. Materials and Methods

The technique applied is based on the detection of changes in the signal over time. It is obvious that there is always a chemical interaction between the measured medium (in this case, the solution) and the sensitive layer. With small measurement times and the use of inert surfaces, this can be neglected. However, during long-term measurements, a change in the signal associated with this interaction is observed and it depends both on the change in the surface state and on the interaction products that have appeared in the near-surface layer. The rate of the signal change depends on the composition of the solution, as well as on the concentration of dissolved substances. This dependence can be used to estimate the concentration of substances with ultra-low concentrations. We have shown that using this technique allows us to see differences in concentrations up to 10−10 M. Thus, the measured value becomes the rate of change in the signal or the tangent of angle inclination of the straight line approximating this dependence.
The experimental unit, which was used for the measurements, consisted of an optical SEW excitation system, a prism chip cuvette system, a data collection device, and a device for processing them. The SEW excitation system has been described in previous publications [7,10]. A collimated p-polarized laser beam (λ = 632.8 nm) was projected onto the sensitive layer of the chip. The reflected light fell into a photodetector, the signal of which was entered into a computer for processing. The excitation angle of SEW was θp = 53.4o. The rotation of the prism on the stand table was provided in increments of 0.0125 and the measurements were carried out at a temperature of 20 °C. The time of a single scan was 8 min in all cases. The diagram of the measuring unit is shown in Figure 1.
The test sample was poured into a cuvette, which was a fluoroplastic container with a size of 1 mm × 5 mm × 10 mm. The SEW was excited in the Kretschmann configuration by using a prism with a refractive index of n = 1.75; one of its faces was covered with a 54 nm thick gold film. In one case, an AgI layer with a thickness of about 40 nm was applied to the gold film; in the other case, it was an Ag layer with a thickness of 7 nm. The deposition of layers was carried out using the magnetron method in automatic mode, and the excitation of the SEW by laser emission with a wavelength of 650 nm was monitored in real time [11,12]. The study of AgI films using an atomic force microscope (AFM) showed a pronounced nanoscale cluster structure of the surface, while the surface of the Ag film did not have such a structure (Figure 2a,b, respectively). AFM (SOLVER P47) productions by NT-MDT Spectrum Instruments, Zelenograd, Russia.

2.1. Measurements of Hydrogen Peroxide Solutions

We studied aqueous solutions of H2O2 of various concentrations: 10−8 M, 10−6 M, and 10−4 M for the surface of Au/AgI double films, and 10−10 M and 10−8 M for the surface of Au/Ag double films. In both cases, the thickness of the Au film was 40 nm. The reason for making the Au/AgI structure was the assumption that, due to the branched surface of the AgI film (Figure 2), it would interact more intensively with H2O2 dissolved in water. The interaction of AgI and H2O2 in an aqueous solution follows the reaction AgI + 2H2O2 → Ag + 2H2O + I + O2. In the near-surface layer, iodine partially combines with oxygen and partially with water. This would lead to the emergence of a near-surface layer enriched with reaction products and a change in the state of the interface, which would allow for the observation of slow changes in the position of the minimum resonant absorption of the SEW and recording the presence of even ultra-low concentrations of H2O2.
During the measurements, the measuring cuvette was preliminary rinsed with freshly prepared deionized water, then the test solution was poured into the cuvette. Five consecutive measurements of the solutions were carried out. After the measurements, the cuvette was rinsed with fresh deionized water and the next test solution was poured into it. Upon completion of the measurements of H2O2 solutions, the cuvette was rinsed and the final measurements of deionized water were carried out in order to determine the extent of changes in the metal surface after contact with the measured H2O2 solutions.

2.2. Measurements of Mixtures of Sodium Chloride Solutions

We also studied the properties of a NaCl mixture with its high dilutions.
To obtain solutions of high dilutions, sequential 100-fold dilutions of the initial NaCl solution were used (its 12th and 20th consecutive dilutions indicated below as C12 and C20, respectively). For the control, dilutions of water were prepared in a similar way.
The tested NaCl solutions were prepared by mixing 1.01 M of NaCl solution with a dilution of NaCl or water (12th or 20th) in a volume ratio of 99:1. Thus, the final concentration of NaCl in the tested solutions was 1 M. For the preparation of all solutions, dilutions and mixtures used purified water produced using the Milli-Q Integral 5 (Merck Millipore, Molsheim, France). The experiments were carried out using Ag films.

3. Results

3.1. Studying the Hydrogen Peroxide Solutions

3.1.1. Measuring the SEW Excitation Angle on a Two-Layer Au/AgI substrate

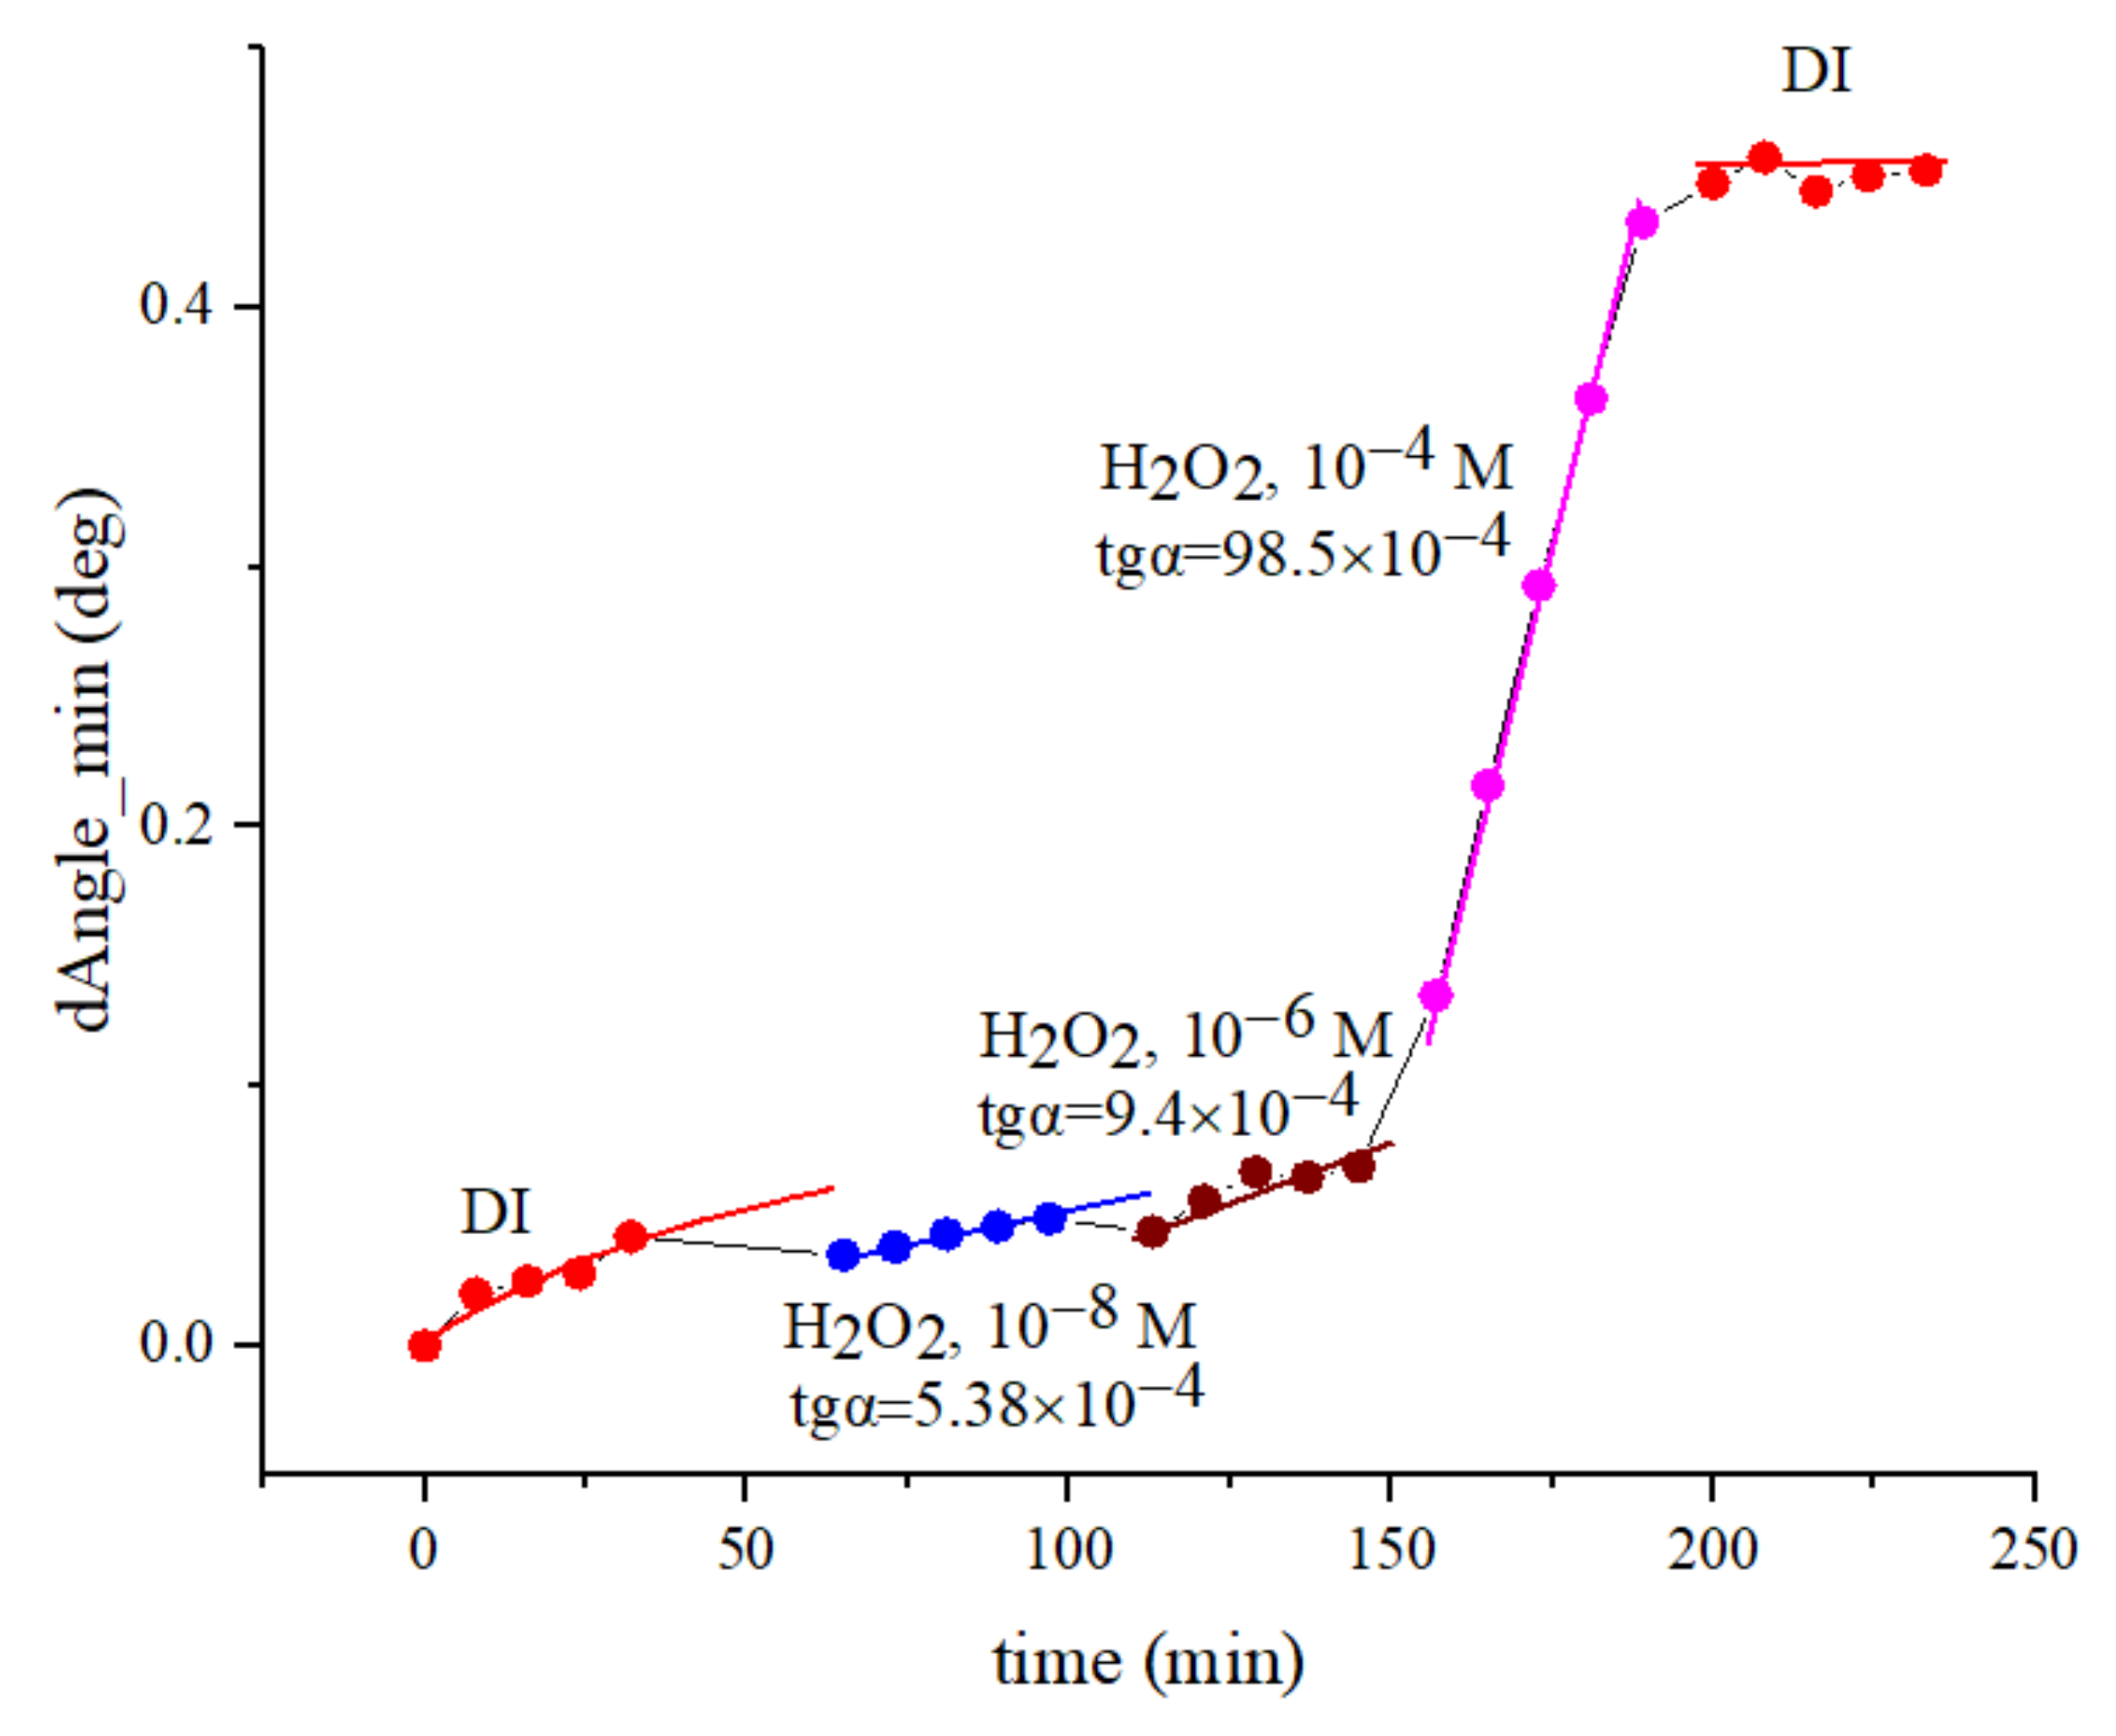
The results of measuring the SEW excitation angle on a two-layer Au/AgI substrate showed that aqueous solutions of H2O2 with concentrations of 10−8 M and 10−6 M have a weak effect on the dynamics of shift in the resonance minimum, and a pronounced effect was observed only at a concentration of 10−4 M. Indeed, the tangent of angle inclination of the segment approximating the experimental points at H2O2 concentration of 10−4 M is ten times higher than in the case of H2O2 concentrations of 10−8 and 10−6 M (Figure 3).
The results of measurements show that an increase in the concentration of the solution leads to a faster change in the signal over time. Consequently, an increase in the tangent of slope of the straight line approximating these changes is observed. At the initial stage of measurements, the tangent of the slope was 5.4 × 10⁻⁴ for a H2O2 concentration of 10−8 M, then the slope was 9.4·10−4 for a concentration of 10−6 M, and it increased by an order of magnitude for a solution of 10−4 M, being 98.5 × 10⁻⁴.

3.1.2. Measuring the SEW Excitation Angle on a Two-Layer Au/Ag substrate

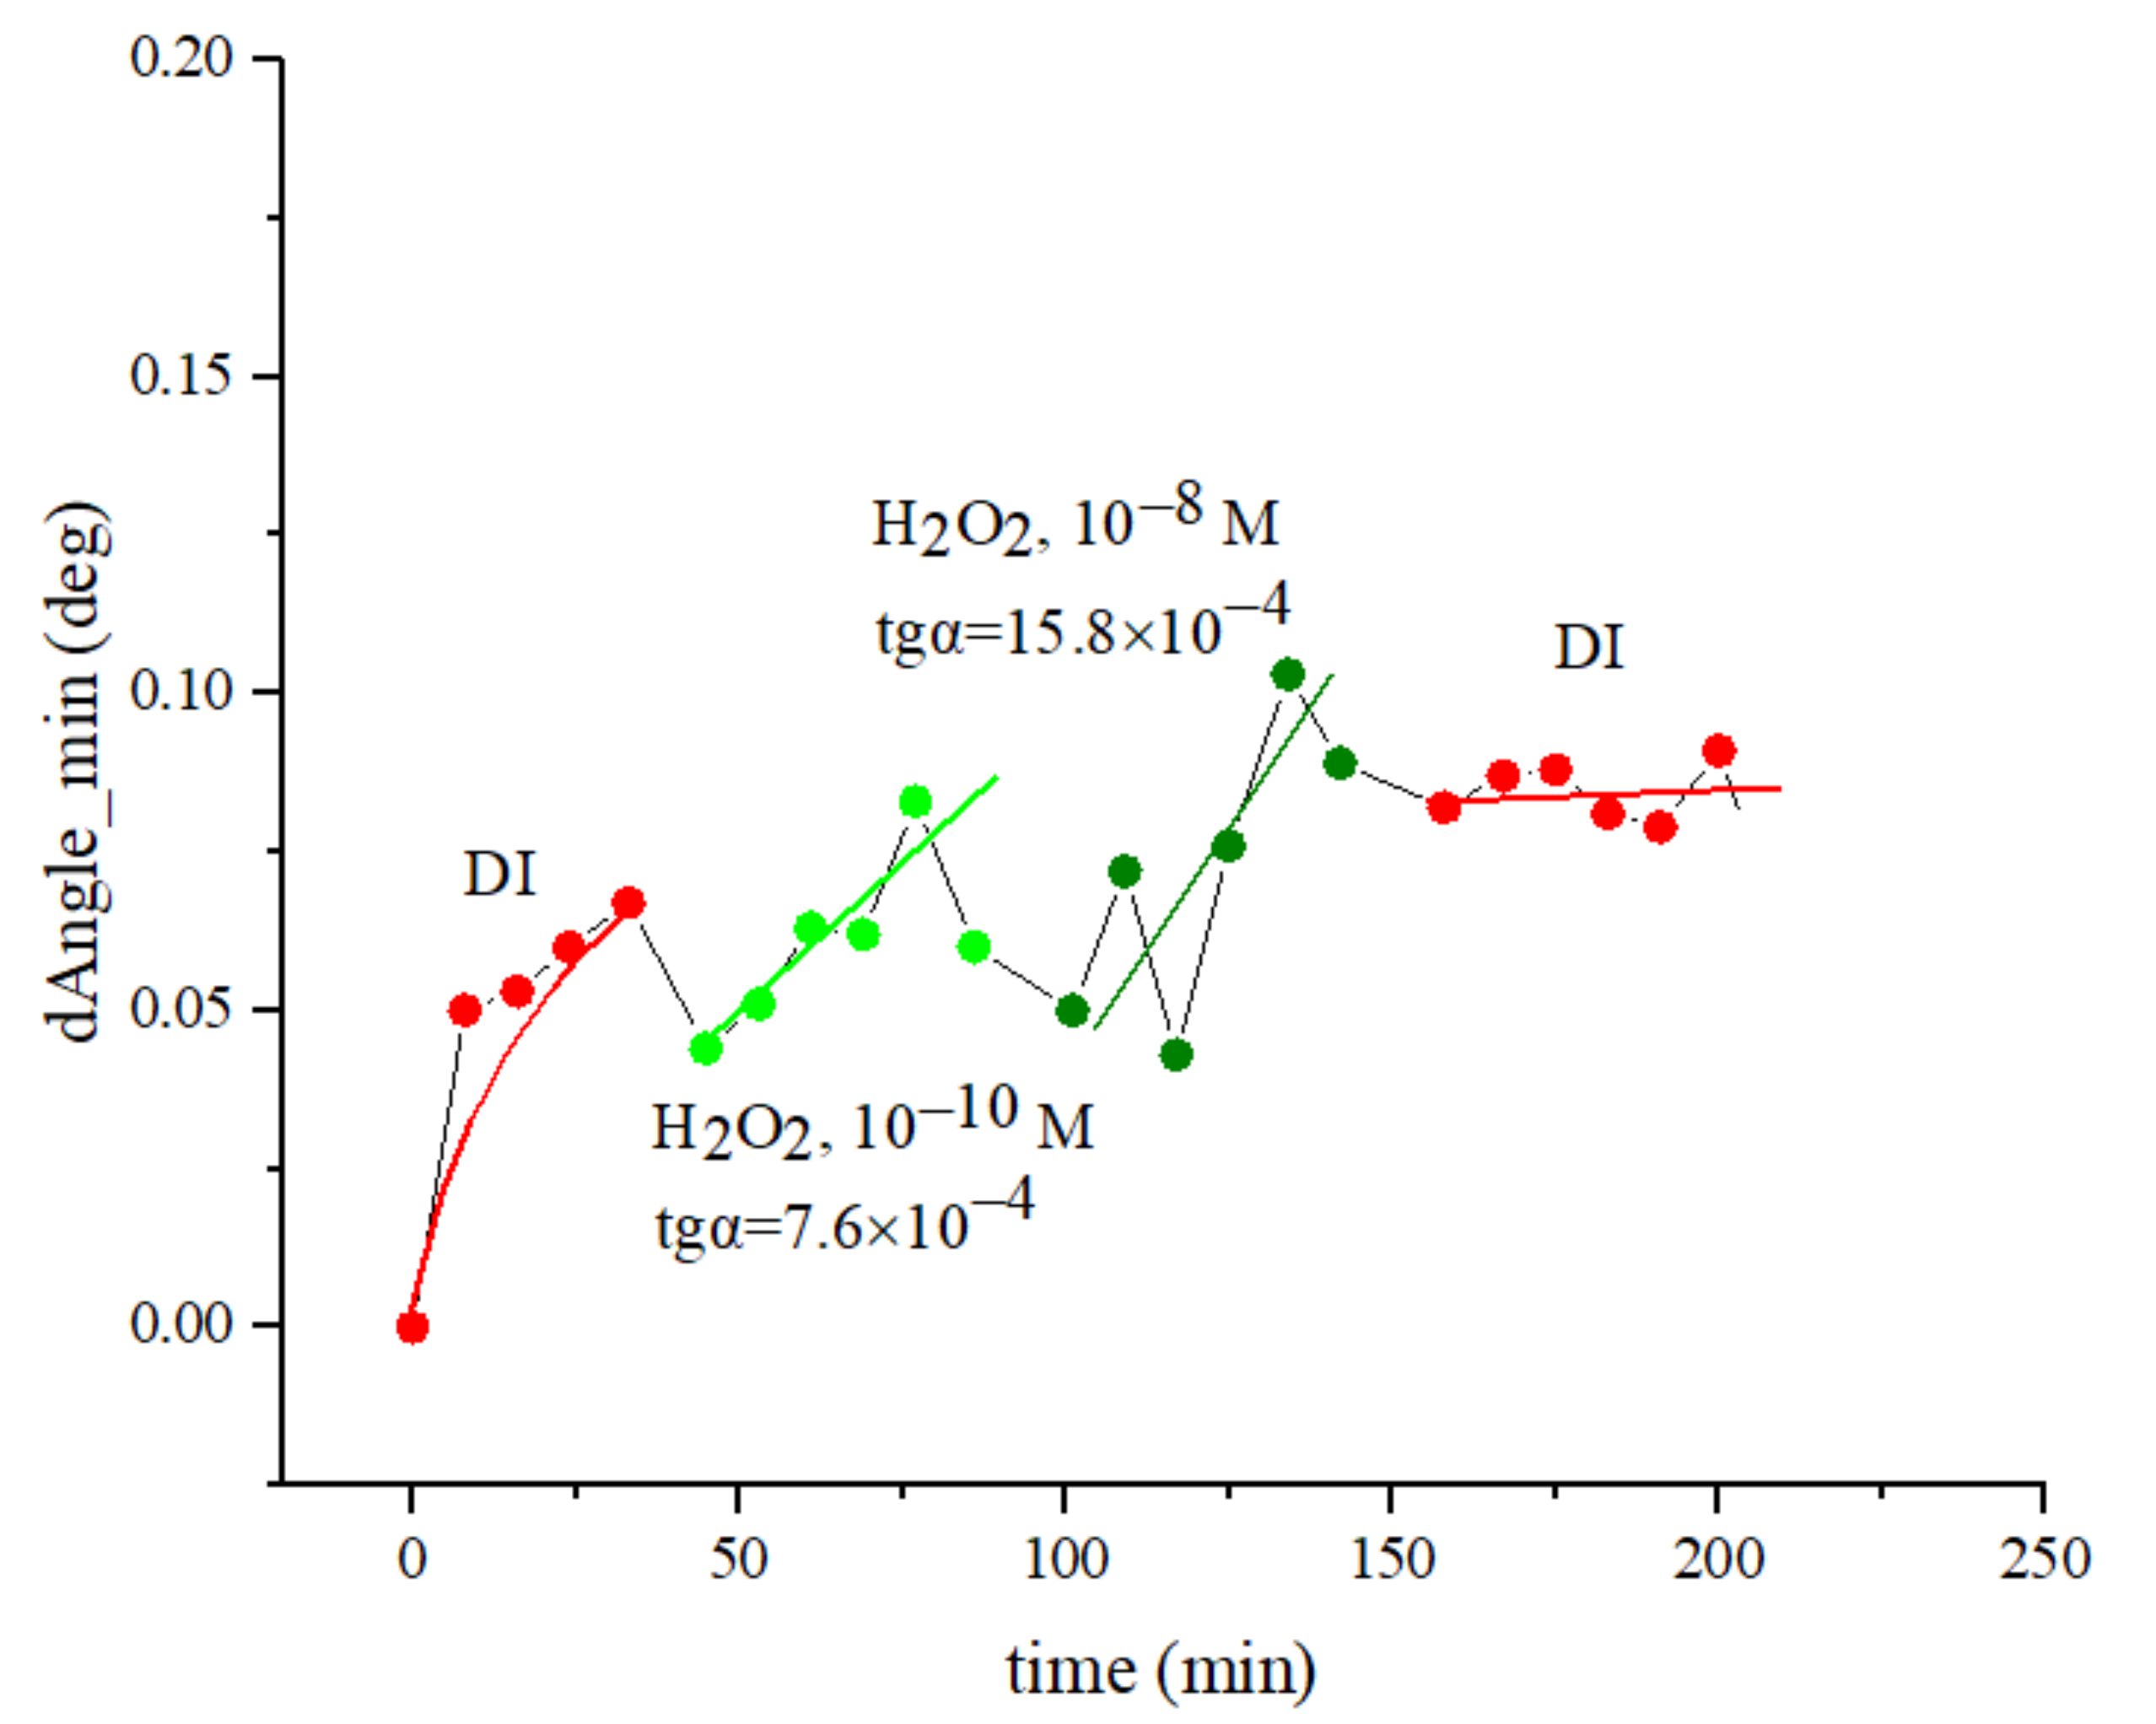
As indicated, along with measurements on the Au/Ag structure, measurements were carried out on the sensitive Au/Ag layer. The measurements were performed for solutions of H2O2 with concentrations of 10−10 M and 10−8 M. Figure 4 shows the diagrams of dependences obtained for shifts in the resonance minima during the SEW excitation.
It can immediately be concluded that the Au/Ag film is more sensitive to lower concentrations of hydrogen peroxide than the Au/AgI film, and it is sensitive to the H2O2 concentration of 10−10 M. Here, we also observe an increase in the rate of changes in the signal with an increase in the concentration of peroxide. The tangent of the inclination angle increases from 7.6 × 10⁻⁴ for a concentration of 10−10 M to 15.8 × 10⁻⁴ for a concentration of 10−8 M. After the 10−8 M solution, deionized water was poured into the cuvette. It can be seen that the position of the absorption minimum for it does not coincide with the minimum for the initial deionized water. This is due to the fact that the surface of the silver film has changed due to interaction with the H2O2 solution. The fact that the change in the SEW signal is associated with a change in the film surface is clearly seen from the results obtained using an atomic force microscope (AFM) (Figure 5).
As can be seen from the AFM image of the AgI surface (Figure 5), the AgI film becomes thinner and degrades down to the gold surface over time. The products of this reaction cause a change in the SEW signal sensitive to the state of the near-surface layer. Due to the low concentration of H2O2, this process is long and, in our case, it took several hours.
The results obtained are in good agreement with the assumption that chemical reactions occurring at the interface of phases allow the detection of ultra-low concentrations of substances. These reactions alter the state of the interface and lead to a change in the parameters of the SEW. By observing the dynamics of changes in these parameters, one can estimate the concentration of dissolved substances
Thus, the proposed method allows, if not quantitatively then qualitatively, an assessment of the concentration at ultra-low concentrations.

3.2. Studying High Dilutions of a Sodium Chloride Solution

There are data from the literature indicating the effect of solutions of high dilutions of a dissolved substance on the properties of the initial solution of the substance [13,14]. Therefore, we used our highly sensitive technique for determining the properties of solutions of high dilutions on the properties of the initial solution (NaCl).
The results of measuring the dynamics of the excitation angle are shown in Figure 6. The first test solution was deionized water. Measurements of deionized water were carried out at 8-min intervals. After that, sodium chloride solutions mixed with a NaCl dilution (C20) or a control water dilution (C20) were studied. Thus, first, we tested NaCl mixed with the 20th 100-fold dilution of NaCl (C20). After pouring it into the cuvette, the excitation angle increased abruptly, which was caused by a change in the refractive index of the solution. The next solution was NaCl mixed with the 20th 100-fold dilution of H2O (C20), which was replaced by NaCl mixed with the 20th 100-fold dilution of NaCl (C20). The change of solutions was accompanied by a typical change in the excitation angle.
The next stage of measurements was carried out after 20 h, during which the cuvette was filled with deionized water. In this series, each solution was in a cuvette for about 50 min, during which six measurements were carried out. Sodium chloride solutions mixed with a NaCl dilution (C12) or a control water dilution (C12) were studied. The solutions were measured in the following sequence: NaCl mixed with the 12th 100-fold dilution of NaCl (C12); NaCl mixed with the 12th 100-fold dilution of H2O (C12); NaCl mixed with the 12th 100-fold dilution of NaCl (C12). The behavior of the minimum reflection angle repeats that observed in the series of solutions based on the C20 dilution, namely solutions with NaCl dilutions, which have a higher refractive index. In addition, there are also jumps between series in the same sequence observed in this series. This series of studies was completed with measurements of deionized water, which showed an abrupt decrease in the excitation angle by an amount characteristic of changing the 1 M NaCl solution with deionized water.
The results obtained in this series of experiments indicate that the studied aqueous solutions of NaCl mixtures (in a volume ratio of 99:1) and NaCl dilutions (C12 or C20) have a higher refractive index compared to solutions of NaCl mixtures (in a volume ratio of 99:1) and H2O dilutions (C12 or C20). This difference cannot be explained by concentration differences, since it is impossible to talk about concentration at such high levels of dilutions. Apparently, this difference is related to the technology of the preparation of solutions of high dilutions. As shown earlier [13,14,15,16], solutions of such high dilutions have specific properties depending on the level of dilution. In addition, the results we obtained are consistent with the previous data obtained using the THz time-domain spectroscopy method [14], where it was shown that the properties of the final solution depended on the added high dilutions of various salts.

4. Conclusions

The experimental observation of the dynamics of SEW excitation parameters in aqueous solutions with low concentrations showed the dependence of the excitation angle on the contact time of an aqueous solution of H2O2 with a silver film and its concentration. The angle change was 10−4–10−3 DPM. The rate of changes in the SEW excitation angle was found to be dependent on the solution concentration. This technique can be used to detect low and ultra-low concentrations of various substances. The achieved sensitivity (up to 10−10 M) is a record and cannot be obtained using other direct measurement methods. The results obtained are of interest for the correct interpretation of the results obtained during the long-term measurement of the SEW propagation.
It was demonstrated that this technique may be used to study the properties of mixed solutions of sodium chloride with their high dilutions. The difference was shown between the physical properties of a NaCl solution mixed with its 20th centesimal dilution and the respective control: a NaCl solution mixed with the 20th centesimal dilution of H2O. Taking into account the order of dilutions, these features of mixed solutions are not due to the molecules of the initial substance, but to the technology of preparation of such solutions.

Author Contributions

Conceptualization, M.K. and V.S.; methodology, M.K. and V.S.; software, M.K., V.S. and E.M.; validation, V.P.; formal analysis, M.K. and V.S. and E.M.; investigation, M.K. and V.S.; resources, M.K.; data curation, M.K., V.S. and E.M.; writing—original draft preparation, M.K.; writing—review and editing, M.K. and E.M.; visualization, M.K., V.S. and E.M.; supervision, V.P.; project administration, V.P.; funding acquisition, V.P. All authors have read and agreed to the published version of the manuscript.

Funding

This research received no external funding.

Institutional Review Board Statement

Not applicable.

Informed Consent Statement

Not applicable.

Data Availability Statement

Not applicable.

Conflicts of Interest

The authors declare no conflict of interest.

References

  1. Lobyshev, V.I.; Tomkevich, M.S.; Petrushanko, I.Y. Experimental study of potentiated aqueous solutions. Biophysics 2005, 50, 416–420. [Google Scholar]
  2. Rey, L. Thermoluminescence of ultra-high dilutions of lithium chloride and sodium chloride. Chem. Phys. A-Stat. Mech. Its Appl. 2003, 323, 67–74. [Google Scholar] [CrossRef]
  3. Elia, V.; Niccoli, M. New physico-chemical properties of extremely diluted aqueous solutions. J. Therm. Anal. Calorim. 2004, 75, 815–836. [Google Scholar] [CrossRef]
  4. Lobyshev, V.I. Dielectric characteristics of highly deluted aqueous diclofenac solutions in the frequency range of 20 Hz to 10 MHz. Phys. Wave Phenom. 2019, 27, 119–127. [Google Scholar] [CrossRef]
  5. Bruskov, V.I.; Masalimov, Z.K.; Chernikov, A.V. Heat-induced generation of reactive oxygen species during reduction of dissolved air oxygen. Dokl. Biol. Sci. 2001, 381, 586–588. [Google Scholar] [CrossRef] [PubMed]
  6. Gudkov, S.V.; Lyakhov, G.A.; Pustovoy, V.I.; Shcherbakov, I.A. Vibration-Vortex Mechanism of Radical-Reaction Activation in an Aqueous Solution. Physical Analogies. Phys. Wave Phenom. 2021, 29, 108–113. [Google Scholar] [CrossRef]
  7. Kononov, M.A.; Pustovoy, V.I.; Svetikov, V.V. Specific features of the excitation of surface plasmons at the interface between metal and aqueous solution of extremely low concentration. Phys. Wave Phenom. 2020, 28, 4–7. [Google Scholar] [CrossRef]
  8. Agranovich, V.M.; Mills, D.L. (Eds.) Surface Polaritons: Electromagnetic Waves on Surfaces and Interfaces of Media; Nauka: Moscow, Russia, 1985; p. 528. [Google Scholar]
  9. Abronin, I.A.; Burshtein, K.Y.; Zhidomirov, G.M. Quantum-chemical calculations of the influence of a solvent on the electronic structure and reactivity of molecules. J. Struct. Chem. 1980, 21, 145–164. [Google Scholar] [CrossRef]
  10. Kononov, M.A.; Pustovoy, V.I.; Svetikov, V.V.; Usievich, B.A. Excitation of Surface Electromagnetic Waves at the Silver/NaCl Aqueous Solution Interface. Front. Phys. 2021, 9, 636979. [Google Scholar] [CrossRef]
  11. Vinogradov, S.V.; Kononov, M.A.; Savranskii, V.V.; Valyanskii, S.I. A simple optical method for determination of buffer layer quality. Bull. Lebedev Phys. Inst. 2003, 2, 3–9. [Google Scholar]
  12. Valyansky, S.I.; Vinogradov, S.V.; Kononov, M.A.; Kononov, V.M.; Savransky, V.V.; Tishkov, V.V. A system for monitoring and controlling metal film growth on glass prisms for the use in surface plasmon excitation devices. Appl. Phys. 2017, 4, 5–9. [Google Scholar]
  13. Petrov, S.I.; Epstein, O.I. Effect of potentiated solutions on mercury (II) signal in inversion voltammetry. Bull. Exp. Biol. Med. 2003, 135, 99–101. [Google Scholar] [CrossRef] [PubMed]
  14. Penkov, N.V. Peculiarities of the perturbation of water structure by ions with various hydration in concentrated solutions of CaCl2, CsCl, KBr, and KI. Phys. Wave Phenom. 2019, 27, 128–134. [Google Scholar] [CrossRef]
  15. Ryzhkina, I.; Murtazina, L.; Gainutdinov, K.; Konovalov, A. Diluted Aqueous Dispersed Systems of 4-Aminopyridine: The Relationship of Self-Organization, Physicochemical Properties, and Influence on the Electrical Characteristics of Neurons. Front. Chem. 2021, 9, 623860. [Google Scholar] [CrossRef] [PubMed]
  16. Konovalov, A.I.; Ryzhkina, I.S. Formation of nanoassociates as a key to understanding of physicochemical and biological properties of highly dilute aqueous solutions. Rus. Chem. Bull. 2014, 63, 1–14. [Google Scholar] [CrossRef]
Figure 1. Measuring unit (1, He-Ne laser; 2, polarizer; 3, divider; 4.1–4.3, mirrors; 5, focusing lens; 6–7, photo sensors; 8–9, analog-digital converter; 10, rotary platform; 11, adjustment linear translators; 12, angle reflector mirror; 13, input prism; 13.1–13.3, cuvettes with input/output pipes; 14, rotary platform controller; and 15, control computer).
Photonics 09 00281 g001
Figure 2. Images of the Au surface covered with AgI (a) and Ag (b) films obtained by an atomic force microscope.
Photonics 09 00281 g002
Figure 3. Shift in the resonance minima during the interaction of hydrogen peroxide solutions with concentrations of 10−8 M, 10−6 M, and 10−4 M with the Au/AgI surface.
Photonics 09 00281 g003
Figure 4. Shift in the resonance minima during the interaction of hydrogen peroxide solutions with concentrations of 10−10 M and 10−8 M with the Au/Ag surface.
Photonics 09 00281 g004
Figure 5. An AFM-image of the AgI surface after two consecutive one-hour exposures in the H2O2 solutions of 10−8 M, 10−6 M, and 10−4 M concentrations.
Photonics 09 00281 g005
Figure 6. Comparison of the angular displacement of the minimum reflection angle of deionized water (DW) and sodium chloride solutions mixed with a NaCl dilution (C20) or a control water dilution (C20), as well as sodium chloride solutions mixed with a NaCl dilution (C12) or a control water dilution (C12).
Photonics 09 00281 g006
Publisher’s Note: MDPI stays neutral with regard to jurisdictional claims in published maps and institutional affiliations.