Article

Super-Resolution Image Reconstruction Based on Single-Molecule Localization Algorithm

1
School of Physics and Optoelectronic Engineering, Xidian University, Xi’an 710071, China
2
Key Laboratory of Optoelectronic Devices and Systems, College of Physics and Optoelectronic Engineering, Shenzhen University, Shenzhen 518060, China
*
Author to whom correspondence should be addressed.
Photonics 2021, 8(7), 273; https://doi.org/10.3390/photonics8070273
Submission received: 28 May 2021 / Revised: 1 July 2021 / Accepted: 9 July 2021 / Published: 12 July 2021
(This article belongs to the Section Biophotonics and Biomedical Optics)

Abstract

:
Fluorescence imaging is an important and efficient tool in cell biology and biomedical research. In order to observe the dynamics of biological macromolecules such as DNA, RNA and proteins in live cells, it is extremely necessary to surpass the Abbe diffraction limit in microscopic imaging. Single-molecule localization microscopy (SMLM) is a sort of super-resolution imaging technique that can obtain a large number of images of sparse fluorescent molecules by the use of photoswitchable fluorescent probes and single-molecule localization technology. The center positions of fluorescent molecules in the images are precisely located, and then the entire sample pattern is reconstructed with super resolution. In this paper, we present a single-molecule localization algorithm (SMLA) that is based on blind deconvolution and centroid localization (BDCL) method. Single-molecule localization and image reconstruction of 15,000/9990 frames of original images of tubulins are accomplished. In addition, this fluorophore localization algorithm is used to localize high particle-density images. The results show that our BDCL-SMLA method is a reasonable attempt and useful method for SMLM imaging when the imaging system is unknown.

1. Introduction

Optical microscopy is widely used for imaging in life science with the advantages of non-invasion, high penetrability and non-destruction to biosamples. However, due to the Abbe diffraction limit [1], the spatial resolution of traditional optical microscope can only reach wavelength scale, usually 200 nm~500 nm, which enables the study of dynamic events and the fine structural details of cellular architecture, but limits its applications in studying structure, function and interaction of biological macromolecules such as DNA, RNA and proteins at nano level.
In the past decades, several imaging strategies to break the diffraction limit, including stimulated emission depletion microscopy (STED) [2], single-molecule localization microscopy (SMLM) [3,4] and super-resolution structured illumination microscopy (SIM) [5], have been developed with the progress of novel fluorescent probes and imaging theories. Their inventors, E. Betzig, S.W. Hell and W.E. Moerner were awarded the 2014 Nobel Prize “for the development of super-resolved fluorescence microscopy”. (Fluorescence) Photoactivated localization microscopy ((f)PALM) [3,6] and (direct) stochastic optical reconstruction microscopy ((d)STORM) [4,7] are two kinds of single-molecule localization microscopies, which employ photoswitchable fluorescent probes, localize single, blinking molecules in an extended image sequence and then produce a precise image. The spatial resolution of SMLM depends mainly on the number of detected photons from each molecule and can achieve approximately 20 nm or better [8,9,10,11].
It is concluded that obtaining a final super-resolution reconstructed image requires the following two steps: (1) Record the fluorescence signal of fluorophores with a detector; (2) Obtain the super-resolution reconstructed image by data analysis technique. As the key technology in SMLM, the data analysis technique, namely the single-molecule localization algorithm (SMLA), is extremely meaningful to obtain super-resolution images. Many algorithms have been currently developed [12,13], including nonlinear least squares (NLLS) [9,14], maximum likelihood estimate (MLE) [8,14], centroid method [13], Gauss fitting [13], gradient fitting [15] and fluoroBancroft (FB) method [16], etc. Among these algorithms, MLE, Gauss fitting and gradient fitting are considered more accurate, while centroid and fluoroBancroft methods are much faster in the localization of molecules [12,15]. Until now, scientists are still making unremitting efforts to improve the performance of localization algorithms in super-resolution imaging technology [17,18,19,20].
In order to localize a fluorophore precisely, it would be best to have a direct knowledge of the experimentally determined parameters such as point spread function (PSF) and background noise of the dataset to be processed. However, in many cases those factors are unknown to us, which brings many difficulties in reconstructing the image with super resolution. In this paper, we present a blind deconvolution and centroid localization-based single-molecule localization algorithm (BDCL-SMLA) that combines maximum likelihood estimation method and centroid method to resolve the problem mentioned above. Moreover, the BDCL-SMLA method can achieve the compatibly of both high accuracy and fast calculating speed. In order to prove the validity of the proposed method, single-molecule localization and image reconstruction of 15,000/9990 frames of original datasets of tubulins are accomplished. In addition, this algorithm is used to localize high particle-density images. The reconstructed images show the effectiveness and practicability of the BDCL-SMLA method.

2. Materials and Methods

In this section, the reference datasets we used are introduced and the BDCL-SMLA method is illustrated in detail.

2.1. Image Formation and Noise Models

The reference datasets that we used in this paper come from Suliana Manley’s laboratory: http://bigwww.epfl.ch/smlm/datasets/index.html (10 March 2021). The three experimental datasets are as follows:
(1)
Tublins, long sequence, 15,000 frames of 64 × 64 pixels, pixel size 100 nm;
(2)
Tubulin AF647, a fixed cell, stained with mouse anti-alpha-tubulin primary antibody and Alexa647 secondary antibody, 9990 frames of 128 × 128 pixels, pixel size 100 nm;
(3)
Tublins, high density, 500 frames of 64 × 64 pixels, pixel size 100 nm.
To estimate a fluorophore’s position, fitting models are assumed typically as this form [10]:
I ( x , y ) = I 0 h ( x x 0 , y y 0 ) + b .
where h is PSF of the imaging system that describes the shape of the blur formed when a point source is imaged and is proportional to the average number of photons at a given position relative to the source; I0 is the peak intensity and is proportional to the photon emission rate and the single-frame acquisition time; (x0, y0) are the fluorophore’s coordinates; b is the average background per pixel in the experiment. In most fitting algorithms, all four (or more) parameters (x0, y0, I0, b, etc.) are estimated.
High-accuracy calculation of PSF requires accounting for numerous factors, particularly the collection angle (numerical aperture) of the lens, interfaces between the sample and lens (such as coverslips and immersion oil) and the dipole moment of the light source. Noise is inevitable in the image acquisition due to the effects of temperature, out-of-focus fluorophores or scattered light, shot noise of the photons in the spot and read-out noise of a detector in the process of converting an optical signal to an electrical signal. All of these factors may degrade the image quality.

2.2. Blind Deconvolution and Image Restoration

A degraded image is the deterioration in image quality during the process of image formation, propagation and preservation. The degradation of the experimental images we used in this paper may be caused by the aberration of the optical imaging system, the relative motion of the imaging system and the fluorophores, the overlap of the fluorophore diffuse spots, the distortion of the display device and a large amount of noise generated in the image acquisition.
It is subjective that people handle the image for different enhancement purposes, such as filtering, smoothing and sharpening, etc., to apply to a particular application. In contrast, image restoration is to rebuild or restore the original image based on the corresponding degradation model or knowledge, which is relatively objective. If the degradation process is known, the image can be restored by performing its inverse operation; if there is no known degradation information, such as the experimental data in this paper, it is necessary to establish the model of the degradation process (fuzzy and noise) to restore the original image and weaken its impact on fluorophore localization to the maximum extent.
Generally, the degradation process of the image is modeled as a degenerate function and an additive noise term. According to the linear system theory, the image degradation/restoration model can be expressed as:
g ( x , y ) = h ( x , y ) * f ( x , y ) + n ( x , y ) .
where f ( x , y ) is the input image, h ( x , y ) is the degenerate function, n ( x , y ) is the additive noise, and g ( x , y ) is the generated degraded image.
Equation (2) is equivalent to the following frequency domain expression:
G ( u , v ) = H ( u , v ) F ( u , v ) + N ( u , v ) .
Then the original image can be expressed as:
F ( u , v ) = G ( u , v ) H ( u , v ) N ( u , v ) H ( u , v ) .
In other words, from the known degraded image and degradation transfer function we can get the frequency domain expression of the original image. Thus, by taking an inverse Fourier transform, also known as deconvolution technique, the restored image can be obtained. However, this method is only applicable for those problems with degenerate function but not considering additive noise.
The datasets we used in this paper are multi-frame degraded images; moreover, the PSF of the datasets is unknown. In order to restore the original images accurately, blind deconvolution algorithm [21,22] is chosen.
The blind deconvolution method is based on the maximum likelihood estimation, and it is an optimization strategy for estimating the parameters that are interfered by random noise. In blind deconvolution, the optimization is realized by using the specified constraints and assuming that the convergence is achieved by iterative procedure. Then, the resulting maximum likelihood functions, f ( x , y ) and h ( x , y ) are employed as the restored image and PSF.
In this way, the algorithm steps are summarized as follows: (1) Read the image matrix. The original grayscale images, which are Tiff format and uint8 type, are processed as a batch to Gif format and double type for convenience of use and high accuracy. (2) Calculate the weight of each pixel of the images above. (3) Estimate the point spread function. An all 1 matrix corresponding to the original image size is generated as an initial PSF and the weight value of each pixel are calculated. (4) Perform blind deconvolution iteration. The function in MATLAB, [ J , P S F ] = d e c o n v b l i n d ( I , I n i t P S F , N u m I t , D a m p e r , W e i g h t ) , is used for blind deconvolution, and a new PSF is developed. Furthermore, the number of iterations in blind deconvolution being either too small or too large would affect the restoration result; therefore, the number should be tried according to the image processing effects.
Blind deconvolution is the first step of single-molecule localization, and it is used to suppress the noise and restore the image. Since the actual PSF is unknown, and there are a large number of frames in the original sequence, it is difficult to restore the image precisely; that is, each fluorescent molecule occupies only one pixel. Therefore, the question of how to locate the fluorescent molecule is the focus of the paper.

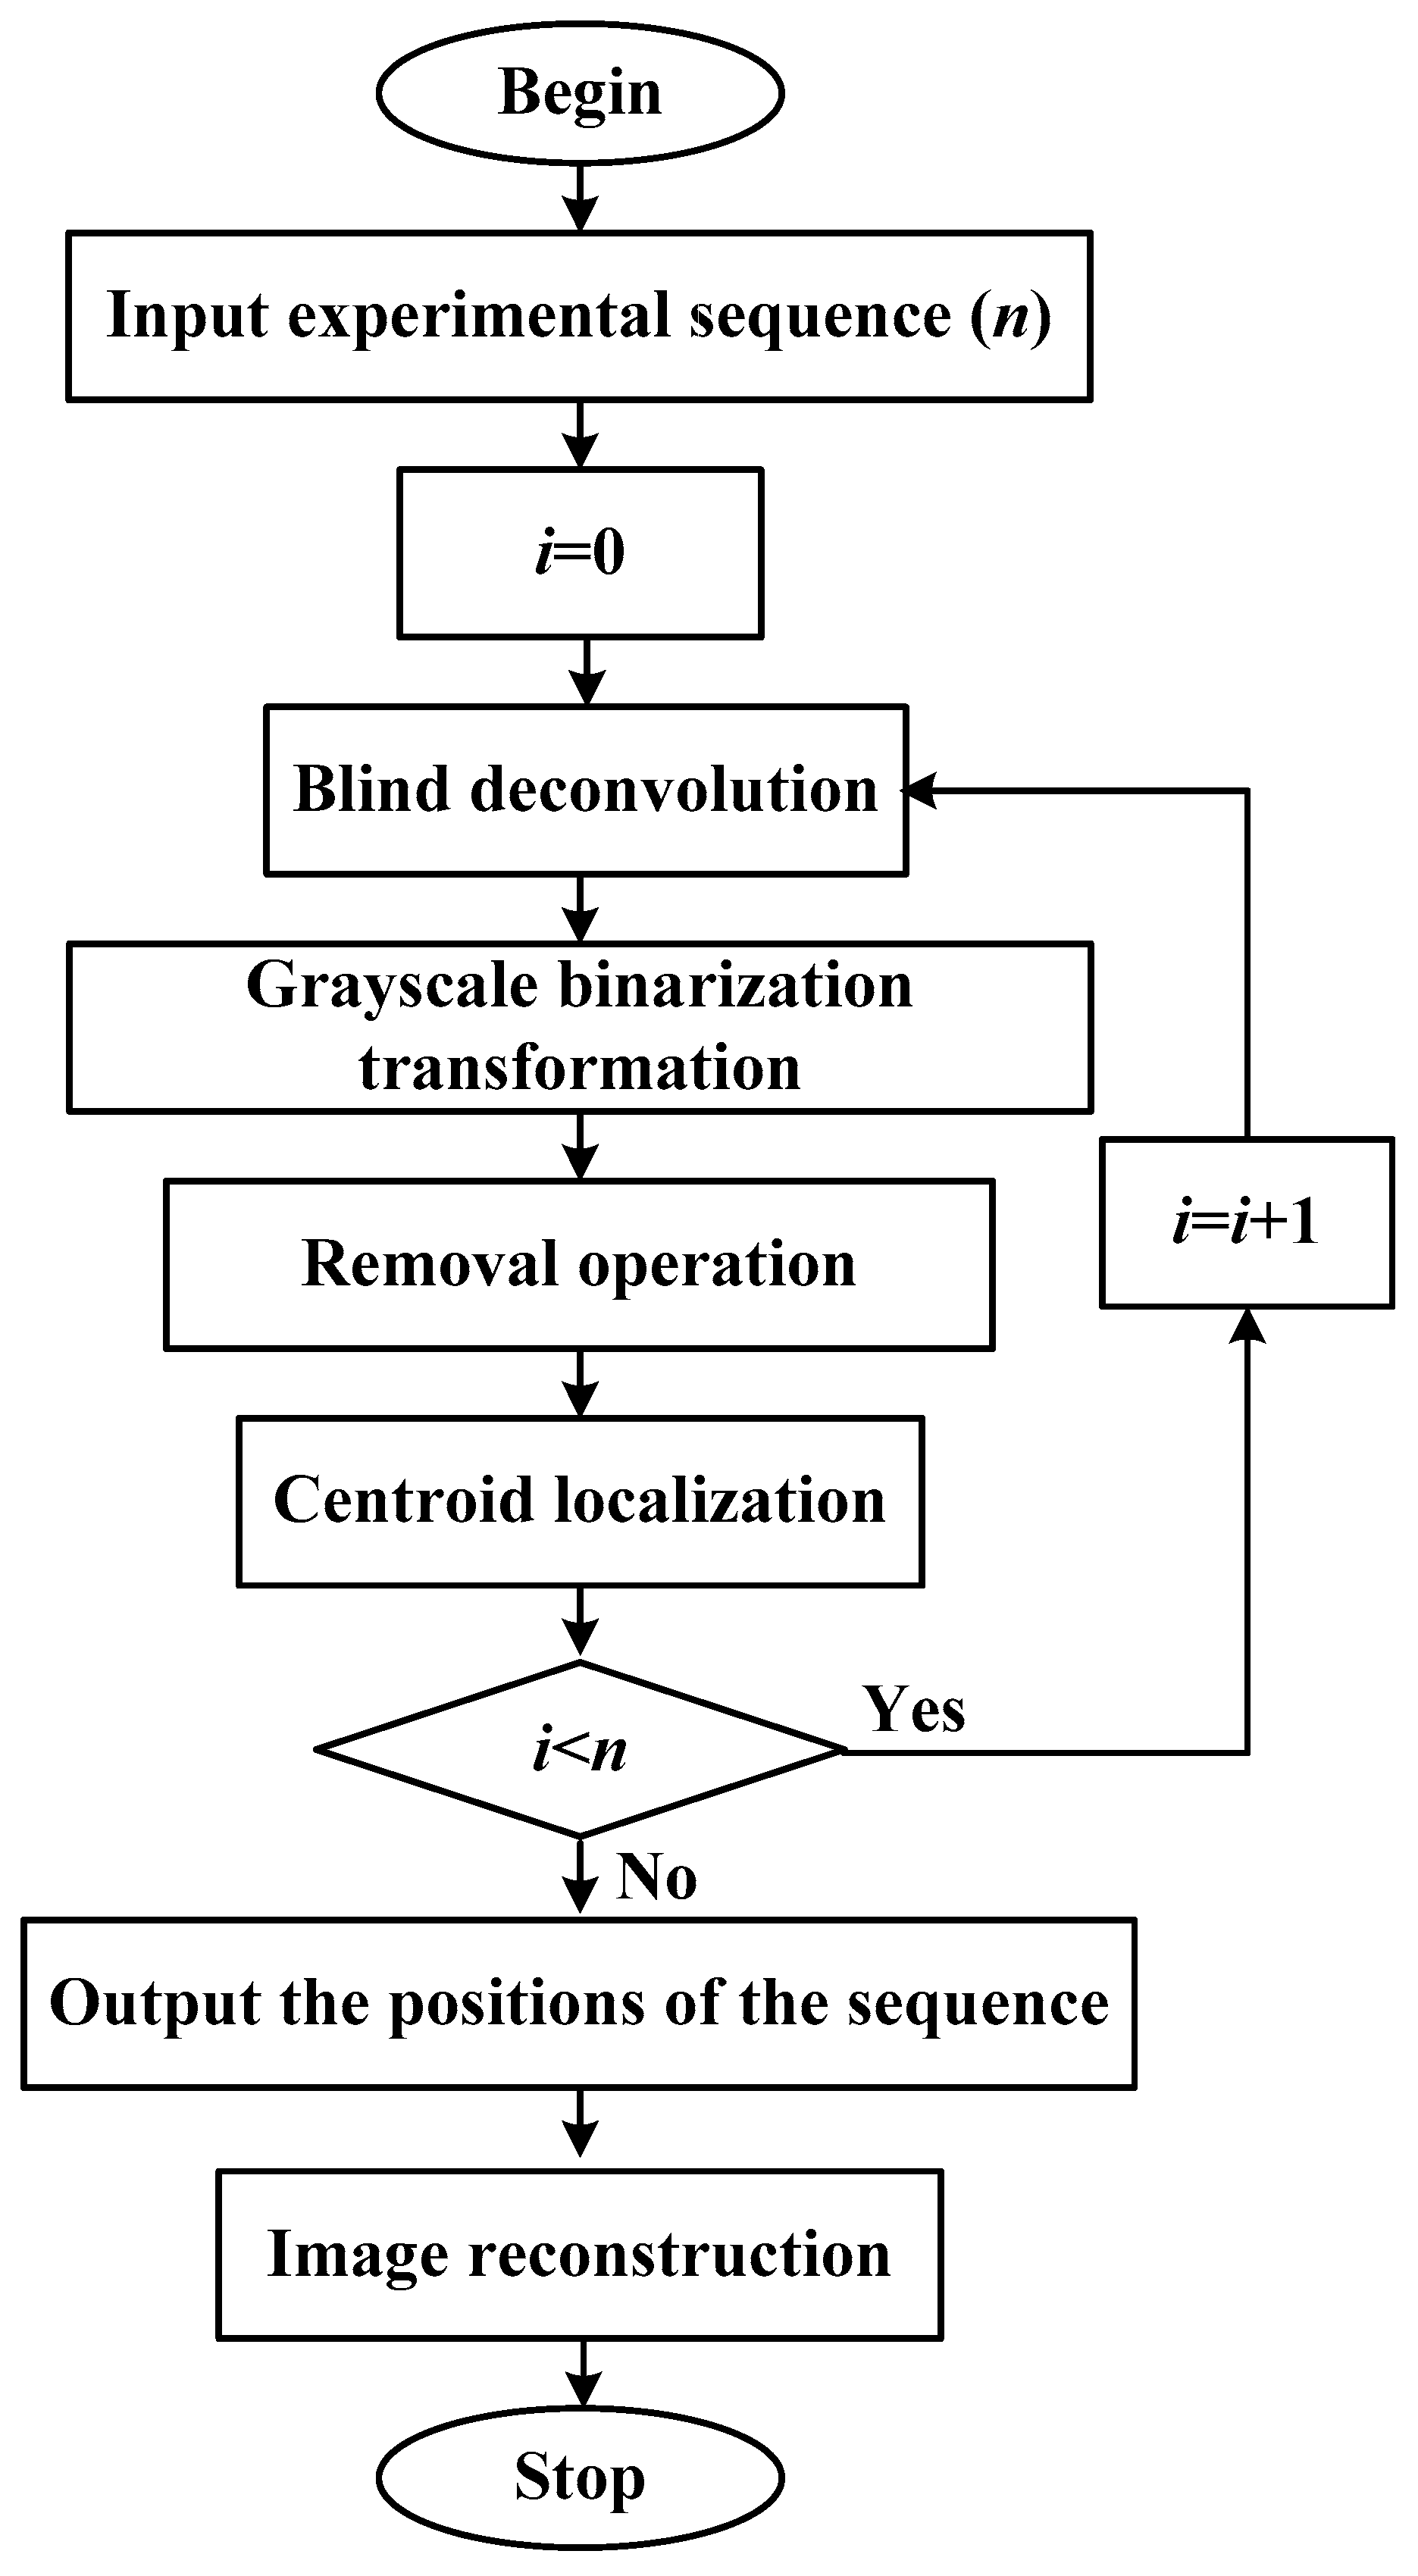
2.3. Centroid Localization and Image Reconstruction

The centroid method is one of the popular localization algorithms in fluorescence single-molecule localization, which locates the position of the fluorophore based on the circular symmetry of the fluorophore imaging model and the weighted average technique, or estimates the distance an object has moved by comparing the center of mass or centroid of two successive images of a particle. As the most commonly employed sub-pixel algorithm, the centroid method mainly locates the center symmetric object such as the circle and rectangle, but it can also be applied to the centroid localization of the irregular geometrically connected region efficiently and accurately. Equation (5) gives the centroid calculation for x and y axes [13].
C x = i = 1 n j = 1 n ( x i I i , j ) i = 1 n j = 1 n ( I i , j ) , C y = i = 1 n j = 1 n ( y i I i , j ) i = 1 n j = 1 n ( I i , j )
where I i , j is an image matrix of intensities, n is the size of the extracted image area, x i , y i denote the coordinates of the pixel ( i , j ) in the x , y axial directions, respectively. The obtained (Cx, Cy) is the centroid coordinate of the fluorophore along the x , y axes.
Precise positioning algorithm and image reconstruction steps are as follows:
(1)
Denoise and restore images with blind deconvolution method;
(2)
Set a proper threshold for the grayscale binarization transformation to exclude background image and localize the position of the light spots (fluorescent molecules);
(3)
Perform removal operation to reduce the effects on accuracy due to the overlap of the fluorophores or the large exposure area, which is particularly necessary for densely labeled region with many fluorophores in close proximity [10];
(4)
Employ centroid localization algorithm as shown in Equation (5) to locate the single molecule precisely;
(5)
Output the positions of the fluorophores in a single frame image;
(6)
Reconstruct the positions of all the fluorophores in image sequence and obtain super-resolution image.
Figure 1 shows the flow chart of single-molecule localization and image reconstruction. The practical application of the SMLA is implemented in MATLAB platform.

3. Results and Discussion

In order to prove the validity of the proposed method, the BDCL-SMLA and image reconstruction method are applied to the three reference datasets downloaded from Suliana Manley’s laboratory. The computer operating system we used is Windows 7 with the processor model of Intel(R) Core(TM) I3-6100 CPU @3.70 GHz. The programming language is MATLAB R2020a 9.8.0.
Take the first dataset of long sequence Tubulins for an example. Figure 2a shows the 200th, 400th and 600th original frames coming from the 15,000 frames. Figure 2b–e are the frames processed sequentially by blind deconvolution, grayscale binarization transformation, removal operation and centroid localization, respectively, corresponding to the algorithm flow chart illustrated in Figure 1. From the comparative results of (a) and (b), it is clear that blind deconvolution can effectively suppress the noise and restore the image. Figure 2f shows the frames simply resulted from centroid localization. There are some differences between (e) and (f), which may affect the reconstructed image.
Then, using the BDCL-SMLA method, we obtain the reconstructed image of long sequence Tubulins of 15,000 frames with image size of 6.4 μm × 6.4 μm as shown in Figure 3b, comparing to the original image in Figure 3a. The inset pictures display the lateral profiles along the lines at same position. The reconstruction process needs 505 s. Moreover, we obtain the images reconstructed from the original 15,000 frames at intervals of 5, 10, 20 and 30 frames, as shown in Figure 3c–f, which take 115 s, 65 s, 37 s and 25 s, respectively. With the decrease in the frames, the reconstruction speed improves, while low image contrast and artificial disappearances of some structures are observed. From our calculation, 750 frames (at interval of 20 frames) or more are necessary for reconstruction to ensure the image quality.
Figure 4a shows the original image of Tubulin AF647 of 9990 frames with image size of 12.8 μm × 12.8 μm. Figure 4b is the corresponding reconstructed image with distinctive structure using BDCL-SMLA method, and 457 s are taken to obtain it. The inset pictures display the lateral profiles along the lines at same position. Figure 4c is the reconstructed image only by centroid localization with running time of 90 s. Although the centroid localization algorithm is very fast, there is more noise on the image compared to (b). Figure 4d is the reconstructed image obtained through the blind deconvolution and centroid localization but skipping removal operation, with running time of 500 s. Comparing (b) and (d), it can be concluded that removal operation can shorten the running time and reduce the noise, and it should be an important step in the BDCL-SMLA method.
In addition, the fluorophore localization method is used to localize high particle-density fluorophores. The original image and reconstructed image of high-density Tubulins of 500 frames are shown in Figure 5a and b, respectively, with an image size of 6.4 μm × 6.4 μm. The inset pictures display the lateral profiles along the lines at same position. It can be seen that the structure that is indistinguishable in the original data is resolved clearly after reconstruction. However, the disappearances of some structures can be observed in (b), mainly because of the small number of frames and the selection of elliptic eccentricity in the connected region in the algorithm. Figure 5c shows the reconstructed image obtained only through the centroid localization. It is obvious that the reconstructed image with BDCL-SMLA method is superior to that with only centroid localization in the aspect of image contrast and structure details.

4. Conclusions

In summary, super-resolution localization microscopy methods have increasingly wide applications in cell biology. As the two key innovations for these methods, switchable fluorophores and powerful localization algorithms have attracted more and more attention from scientists. In this paper, we have developed a single-molecule localization algorithm based on the blind deconvolution and centroid localization (BDCL-SMLA) method without much knowledge of experimentally determined parameters such as PSF and background noise. This BDCL-SMLA method takes account into both speed and precision at the same time in super-resolution image reconstruction by combining the maximum likelihood estimation method and the centroid method. The BDCL-SMLA method is used to reconstruct the images of several datasets and good results are obtained, which is proved to be a reasonable attempt for the SMLM imaging when the imaging system is unknown. However, the method still has some shortcomings, such as reconstruction speed with a large number of frames and artificial disappearances of some structures with a small number of frames, which will be considered and improved in the next step.
With the availability of new probes and improvement of detector technology, greater precision in the localization of point sources becomes more feasible. On the other side, further advances in localization algorithms and the development of deep learning technology will likely further promote the development of SMLM and expand its application scopes.

Author Contributions

Conceptualization and Methodology, L.L.; Software, M.Q. and X.X.; Writing—Original Draft Preparation, M.Q., Y.L. and X.X.; Writing—Review and Editing, L.L. and D.C.; Supervision, J.Q.; Funding Acquisition, L.L. All authors have read and agreed to the published version of the manuscript.

Funding

This research was funded by the 111 Project.

Data Availability Statement

The data that support the findings of this study are available from the corresponding author upon reasonable request.

Acknowledgments

The authors are very thankful for the experimental data provided by Suliana Manley’s laboratory. Download from: http://bigwww.epfl.ch/smlm/datasets/index.html (10 March 2021).

Conflicts of Interest

The authors declare no conflict of interest.

References

  1. Abbe, E. Beiträge zur theorie des mikroskops und der mikroskopischen Wahrnehmung. Arch. Mikroskop. Anat. 1873, 9, 413–468. [Google Scholar] [CrossRef]
  2. Hell, S.W.; Wichmann, J. Breaking the diffraction resolution limit by stimulated emission: Stimulated-emission depletion fluorescence microscopy. Opt. Lett. 1994, 19, 780–782. [Google Scholar] [CrossRef] [PubMed]
  3. Betzig, E.; Patterson, G.H.; Sougrat, R.; Lindwasser, O.W.; Olenych, S.; Bonifacino, J.S.; Davidson, M.W.; Lippincott-Schwartz, J.; Hess, H.F. Imaging intracellular fluorescent proteins at nanometer resolution. Science 2006, 313, 1642–1645. [Google Scholar] [CrossRef] [PubMed] [Green Version]
  4. Rust, M.J.; Bates, M.; Zhuang, X.W. Sub-diffraction-limit imaging by stochastic optical reconstruction microscopy (STORM). Nat. Methods 2006, 3, 793–795. [Google Scholar] [CrossRef] [PubMed] [Green Version]
  5. Gustafsson, M.G.L. Nonlinear structured-illumination microscopy: Wide-field fluorescence imaging with theoretically unlimited resolution. Proc. Natl. Acad. Sci. USA 2005, 102, 13081–13086. [Google Scholar] [CrossRef] [PubMed] [Green Version]
  6. Hess, S.T.; Girirajan, T.P.K.; Mason, M.D. Ultra-high resolution imaging by fluorescence photoactivation localization microscopy. Biophys. J. 2006, 91, 4258–4272. [Google Scholar] [CrossRef] [PubMed] [Green Version]
  7. Heilemann, M.; Van De Linde, S.; Schüttpelz, M.; Kasper, R.; Seefeldt, B.; Mukherjee, A.; Tinnefeld, P.; Sauer, M. Subdiffraction-resolution fluorescence imaging with conventional fluorescent probes. Angew. Chem. Int. Ed. 2008, 47, 6172–6176. [Google Scholar] [CrossRef]
  8. Thompson, R.E.; Larson, D.R.; Webb, W.W. Precise nanometer localization analysis for individual fluorescent probes. Biophys. J. 2002, 82, 2775–2783. [Google Scholar] [CrossRef] [Green Version]
  9. Smith, C.S.; Joseph, N.; Rieger, B.; Lidke, K.A. Fast, single-molecule localization that achieves theoretically minimum uncertainty. Nat. Methods 2010, 7, 373–375. [Google Scholar] [CrossRef] [PubMed] [Green Version]
  10. Small, A.; Stahlheber, S. Fluorophore localization algorithms for super-resolution microscopy. Nat. Methods 2014, 11, 267–279. [Google Scholar] [CrossRef]
  11. Ovesný, M.; Křížek, P.; Borkovec, J.; Švindrych, Z.; Hagen, G.M. ThunderSTORM: A comprehensive ImageJ plug-in for PALM and STORM data analysis and super-resolution imaging. Bioinformatics 2014, 30, 2389–2390. [Google Scholar] [CrossRef] [PubMed]
  12. Quan, T.; Zeng, S.; Lv, X. Comparison of algorithms for localization of single fluorescent molecule in super resolution imaging. Chin. J. Lasers 2010, 37, 2714–2718. [Google Scholar] [CrossRef]
  13. Cheezum, M.K.; Walker, W.F.; Guilford, W.H. Quantitative comparison of algorithms for tracking single fluorescent particles. Biophys. J. 2001, 81, 2378–2388. [Google Scholar] [CrossRef] [Green Version]
  14. Aguet, F.; Ville, D.V.D.; Unser, M. A maximum-likelihood formalism for sub-resolution axial localization of fluorescent nanoparticles. Opt. Express 2005, 13, 10503–10522. [Google Scholar] [CrossRef] [PubMed] [Green Version]
  15. Ma, H.; Xu, J.; Jin, J.Y.; Gao, Y.; Lan, L.; Liu, Y. Fast and precise 3D fluorophores localization based on gradient fitting. Sci. Rep. 2015, 5, 14335. [Google Scholar] [CrossRef] [PubMed] [Green Version]
  16. Andersson, S.B. Localization of a fluorescent source without numerical fitting. Opt. Express 2008, 16, 18715–18724. [Google Scholar] [CrossRef] [PubMed] [Green Version]
  17. Tang, Y.; Dai, L.; Zhang, X.; Li, J.; Hendriks, J.; Fan, X.; Gruteser, N.; Meisenberg, A.; Baumann, A.; Katranidis, A.; et al. SNSMIL, a real-time single molecule identification and localization algorithm for super-resolution fluorescence microscopy. Sci. Rep. 2015, 5, 11073. [Google Scholar] [CrossRef] [PubMed] [Green Version]
  18. Cheng, T.; Chen, D.; Yu, B.; Niu, H. Reconstruction of super-resolution STORM images using compressed sensing based on low-resolution raw images and interpolation. Biomed. Opt. Express 2017, 8, 2445–2457. [Google Scholar] [CrossRef] [PubMed] [Green Version]
  19. Martens, K.J.A.; Bader, A.N.; Baas, S.; Rieger, B.; Hohlbein, J. Phasor based single-molecule localization microscopy in 3D (pSMLM-3D): An algorithm for MHz localization rates using standard CPUs. J. Chem. Phys. 2018, 148, 123311. [Google Scholar] [CrossRef] [PubMed] [Green Version]
  20. Xue, F.; He, W.; Xu, F.; Zhang, M.; Chen, L.; Xu, P. Hessian single-molecule localization microscopy using sCMOS camera. Biophys. Rep. 2018, 4, 215–221. [Google Scholar] [CrossRef] [PubMed]
  21. Sibarita, J.-B. Deconvolution microscopy. In Microscopy Techniques; Rietdorf, J., Ed.; Springer: Berlin/Heidelberg, Germany, 2005; Volume 95, pp. 201–243. ISBN 978-3-540-23698-6. [Google Scholar]
  22. Frahm, L. Stochastic Modeling of Photoswitchable Fluorophores for Quantitative Superresolution Microscopy. Ph.D. Thesis, Georg-August-University of Göttingen, Göttingen, Germany, November 2016. [Google Scholar]
Figure 1. Flow chart of single-molecule localization and image reconstruction.
Photonics 08 00273 g001
Figure 2. The 200th, 400th, 600th frames of long sequence Tubulins. (a) the original frames; (be) the frames after blind deconvolution, grayscale binarization transformation, removal operation, and centroid localization, sequentially; (f) the frames simply resulted from centroid localization. Image size: 6.4 μm × 6.4 μm.
Photonics 08 00273 g002
Figure 3. The original image (a) and reconstructed image with BDCL-SMLA method (b) of long sequence Tubulins, with the lateral profiles along the lines shown in inset pictures. (cf) the images reconstructed every 5, 10, 20, and 30 frames out of 15,000 images, respectively. Image size: 6.4 μm × 6.4 μm.
Photonics 08 00273 g003
Figure 4. The original image (a) and reconstructed image with BDCL-SMLA method (b) of Tubulin AF647, with the lateral profiles along the lines shown in inset pictures; (c) the reconstructed image obtained only through the centroid localization. (d) the reconstructed image obtained through the blind deconvolution and centroid localization without removal operation. Image size: 12.8 μm × 12.8 μm.
Photonics 08 00273 g004
Figure 5. The original image (a) and reconstructed image with BDCL-SMLA method (b) of high-density Tubulins, with the lateral profiles along the lines shown in inset pictures; (c) the reconstructed image obtained only through the centroid localization. Image size: 6.4 μm × 6.4 μm.
Photonics 08 00273 g005
Publisher’s Note: MDPI stays neutral with regard to jurisdictional claims in published maps and institutional affiliations.

