Article

Experimental Demonstration of High-Sensitivity Underwater Optical Wireless Communication Based on Photocounting Receiver

1
Information Materials and Intelligent Sensing Laboratory of Anhui Province, Anhui University, Hefei 230601, China
2
Wuhan National Laboratory for Optoelectronics, Huazhong University of Science and Technology, Wuhan 430074, China
3
Shanghai Huawei Technology Co., Ltd., Shanghai 200001, China
4
Center for Information Photonics and Communications, School of Information Science and Technology, Southwest Jiaotong University, Chengdu 611756, China
5
Alibaba Cloud, Alibaba Group, Beijing 100102, China
*
Author to whom correspondence should be addressed.
Photonics 2021, 8(11), 467; https://doi.org/10.3390/photonics8110467
Submission received: 8 September 2021 / Revised: 20 October 2021 / Accepted: 21 October 2021 / Published: 22 October 2021
(This article belongs to the Special Issue Visible Light Communication (VLC))

Abstract

:
In this paper, we propose a high-sensitivity long-reach underwater optical wireless communication (UOWC) system with an Mbps-scale data rate. Using a commercial blue light-emitting diode (LED) source, a photon counting receiver, and return-to-zero on–off keying modulation, a receiver sensitivity of −70 dBm at 7% FEC limit is successfully achieved for a 5 Mbps intensity modulation direct detection UOWC system over 10 m underwater channel. For 1 Mbps and 2 Mbps data rates, the receiver sensitivity is enhanced to −76 dBm and −74 dBm, respectively. We further investigate the system performance under different water conditions: first type of seawater (c = 0.056 m−1), second type (c = 0.151 m−1), and third type (c = 0.398 m−1). The maximum distance of the 2 Mbps signal can be extended up to 100 m in the first type of seawater.

1. Introduction

With the expanding area explored by human beings, the observation and utilization of the underwater world is growing increasingly important. Various underwater sensors, unmanned vehicles, and nodes are deployed underwater to transfer and collect information. To build an underwater transmission link, both cable- and wireless-based methods are utilized. Cables or fibers can offer a stable communication link with high transmission speed but limit the freedom of the communication terminal for a long-reach link.
The traditional method for underwater communication is to use acoustics, which is a medium of sound. The attenuation of the sound wave in water is acceptable, which is competent for ultralong-reach communication up to tens of kilometers. However, underwater acoustic communication is limited by the huge transmitted power, low data rate, and large latency [1]. Due to the skin effect, electromagnetic waves suffer from huge attenuation when propagating in water. Thus, it is hard to realize long-reach underwater communication using electromagnetic waves. Studies have shown that the visible spectrum from blue–green wavelengths suffers less attenuation caused by underwater absorption and scattering than electromagnetic waves [2]. Benefiting from the rich bandwidth resource of a laser diode (LD), a Gbps-scale underwater optical wireless communication (UOWC) system within tens of meters is feasible [3]. However, a strict tracking and alignment system is required after long-distance transmission due to the narrow beam and small divergence angle of the LD source. Moreover, most of the reported UOWC links are conducted in tap water with avalanche photodetectors (APDs) for optical signal detection, which may not be so attractive and available for some long-distance transmission scenarios requiring a large optical power budget and photon-scale detection, e.g., internal communications with Mbps data rates between autonomous underwater vehicles or underwater sensor nodes in underwater dynamic conditions [4]. Thus, a high-sensitivity detector combined with a large-coverage-area light source is indispensable to build a reliable communication link with respect to unpredictable channel obstructions and the various conditions of the sea. Photomultiplier tubes (PMTs), possessing the capability of single-photon detection, are the most widespread vacuum electronic devices in every field of experimental studies including optical communication, biology, space research, and chemistry. Compared with silicon photomultipliers, PMT needs high voltage to drive the device. However, the PMTs are not sensitive to temperature and have a lower noise level. Due to the sensitivity of PMT to background noise and magnetic fields, it is more suitable to build a PMT-based long-range UOWC link for deep-sea implementation.
Before building a long-range experimental UOWC system, the underwater channel conditions need to be investigated to establish the system parameters such as the optimal transmitted optical wavelength, modulation scheme, signal baud rate, and beam aperture. Because underwater data transmission using a light beam is not an easy mission in the presence of high water absorption and scattering, characterizing the underwater optical channel property to achieve appropriate system parameters is of crucial importance to enable a high-reliability and high-quality UOWC link.
In this paper, we consider a comprehensive underwater channel model to simulate the property of an underwater optical communication link by taking the practical system parameters into account. Under the guidance of the simulation results, we propose and experimentally demonstrate a long-reach Mbps-scale UOWC scheme with high receiver sensitivity based on a light-emitting diode (LED) transmitter and a PMT receiver. The proposed system can significantly relax the alignment requirement especially after long-distance transmission. Bit-error-ratio (BER) performance enhancements for 1 Mbps, 2 Mbps, and 5 Mbps after 10 m transmission are experimentally investigated under different water turbidities with an adaptive decision threshold (DT). The receiver adapts to the changing of signal level. With added attenuation, the maximum link loss at an attenuation coefficient of 1.33 m−1 is up to 99 dB at λ = 448 nm. The achievable maximum distances for a 2 Mbps data rate in the first type of seawater (c = 0.056 m−1) are up to 100 m and 134 m at 1 W and 10 W transmitted electrical power, respectively.

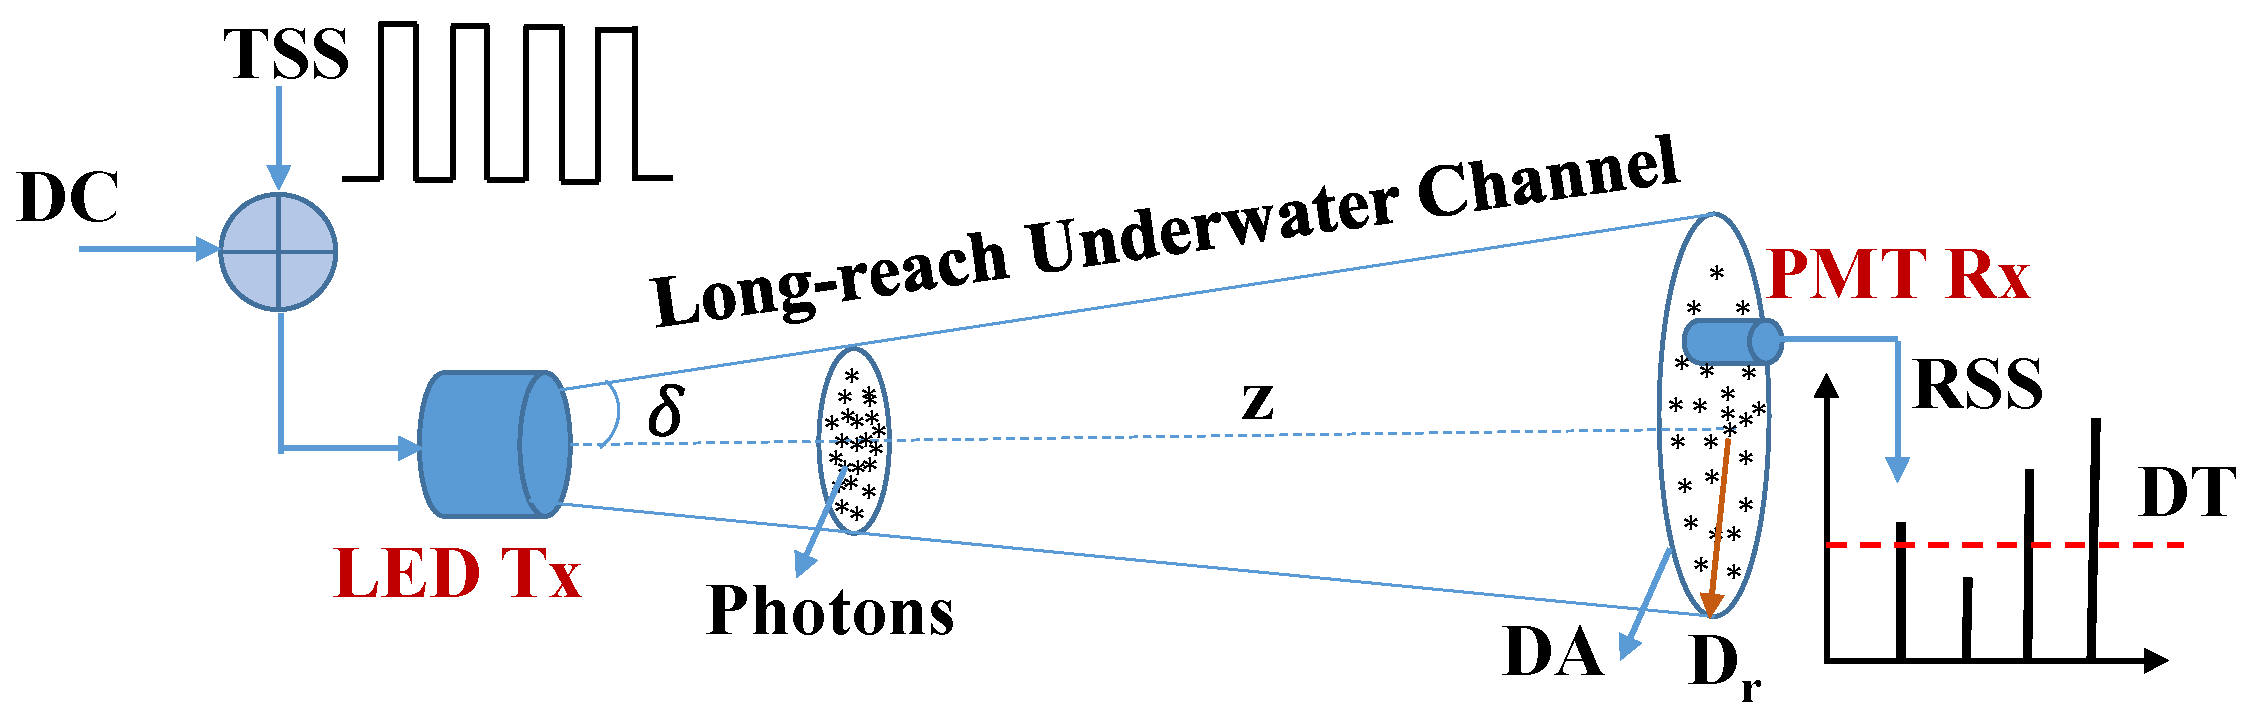
2. Operation Principle

Compared with free-space atmospheric laser communication, the UOWC system faces some unique challenges.
(i) Spectrum for communication: blue or green wavelengths should be dedicated to the UOWC link due to the water absorption effect, rather than infrared wavelengths (C-band 1530–1565 nm and L-band 1565–1625 nm) for an atmospheric free-space link enabled by well-established fiber-optic technologies and optoelectronic devices and components.
(ii) Channel condition: affected by seawater, the underwater optical transmission channel is quite complicated. When the modulated light propagates through seawater, it suffers from absorption and scattering. Seawater absorption means that part of the photon energy launched into the seawater is converted into other forms of energy, such as thermal and chemical. Scattering refers to the interaction between light and seawater, which changes the optical transmission path. Both absorption and scattering cause the loss of optical signal energy at the receiver, resulting in a reduction in signal-to-noise ratio and communication distance. As illustrated in [5], the link loss for a realistic 10 m green-light UOWC system can vary from 6.6 dB to 95.5 dB due to dynamic underwater channel conditions from a clean ocean to turbid harbor seawater.
Due to the variability of underwater channels, a robust long-reach UOWC link must be designed against a link loss of roughly up to 100 dB. Meanwhile, the link must be able to tolerate the dynamic changing underwater channels without breaking off. Although linear detectors including APDs have shown their abilities to detect multi-Gbps optical signals transmitted by LD sources, their sensitivities are typically limited by thermal noise [6]. On the other hand, photon-counting detectors can achieve very high sensitivities with moderate data rates on the Mbps scale. In this paper, we propose a reliable long-reach UOWC scheme using LED and PMT, whose concept is illustrated in Figure 1. Due to the advantages of its large light beam, compact structure, low cost, and low power consumption, LEDs are proposed as viable candidates to provide a transmission data rate of several Mbps or even up to hundreds of Mbps for implementing an alignment-released UOWC system. In the demonstration, a commercial LED transmitter is modulated by a predesigned return-to-zero on–off keying (RZ-OOK) with half power semi-angle of 1.25° [7]. With increasing transmission distance z, the receiving radius D r at the detection area increases, which significantly relaxes the alignment requirement. To achieve high receiver sensitivity and long distance, a typical and practically implemented photocounting receiver is used, which is the PMT combined with a pulse-holding circuit to detect photo-level signals. The received photoelectric current is characterized by a series of discrete rectangular pulses with certain width, whose number satisfies a Poisson distribution. In the demonstration, we propose a digital adaptive DT algorithm for signal recovery. The value of DT is adjusted as a function of the received signal level to achieve the minimum BER value.

3. System Model

3.1. LED Transmitter

In our experiment, a commercial low-cost LED at a peak wavelength of 448 nm was employed as the transmitter. The path loss of light caused by water absorption and scattering can be dominated by the Beer–Lambert law.
P r = η P t L c h = η P t e c z = η P t e ( a + b ) z ,
where η is electrical-to-optical conversion efficiency of LED, a and b represent the coefficients of absorption and scattering, respectively, c is the total loss due to both effects, and z is the underwater transmission distance. L c h is the channel loss, given by exp(−cz). P t and P r are the transmitted electrical power and received optical power (ROP), respectively.
The radiation pattern I ( ϕ ) of the LED obeys the Lambertian model, defined as
I ( ϕ ) = η P t ( m 1 + 1 ) 2 π cos m 1 ( ϕ ) ,
where ϕ is the angle of irradiance, and ϕ = 0 is the maximum radiation power angle, i.e., the direct state. m 1   is expressed as the Lambertian emission order of the beam directivity, which is related to the half-power angle ϕ 1 / 2 of the LED, written as
m 1 = ln 2 ln ( cos ϕ 1 / 2 ) .
The detected optical power by the photon counting receiver at the receiving plane A e f f through the distance z is defined as follows [8]:
P r = I ( ϕ ) L c h A e f f z 2 .

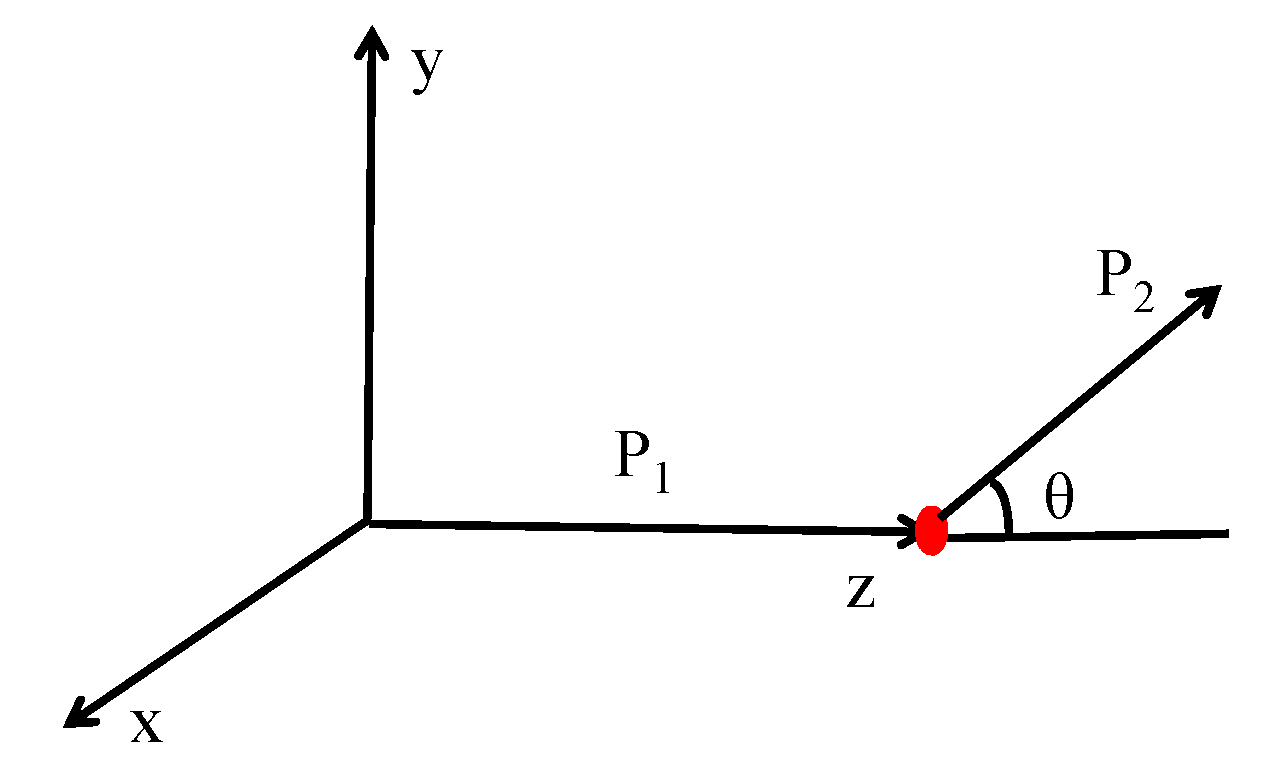
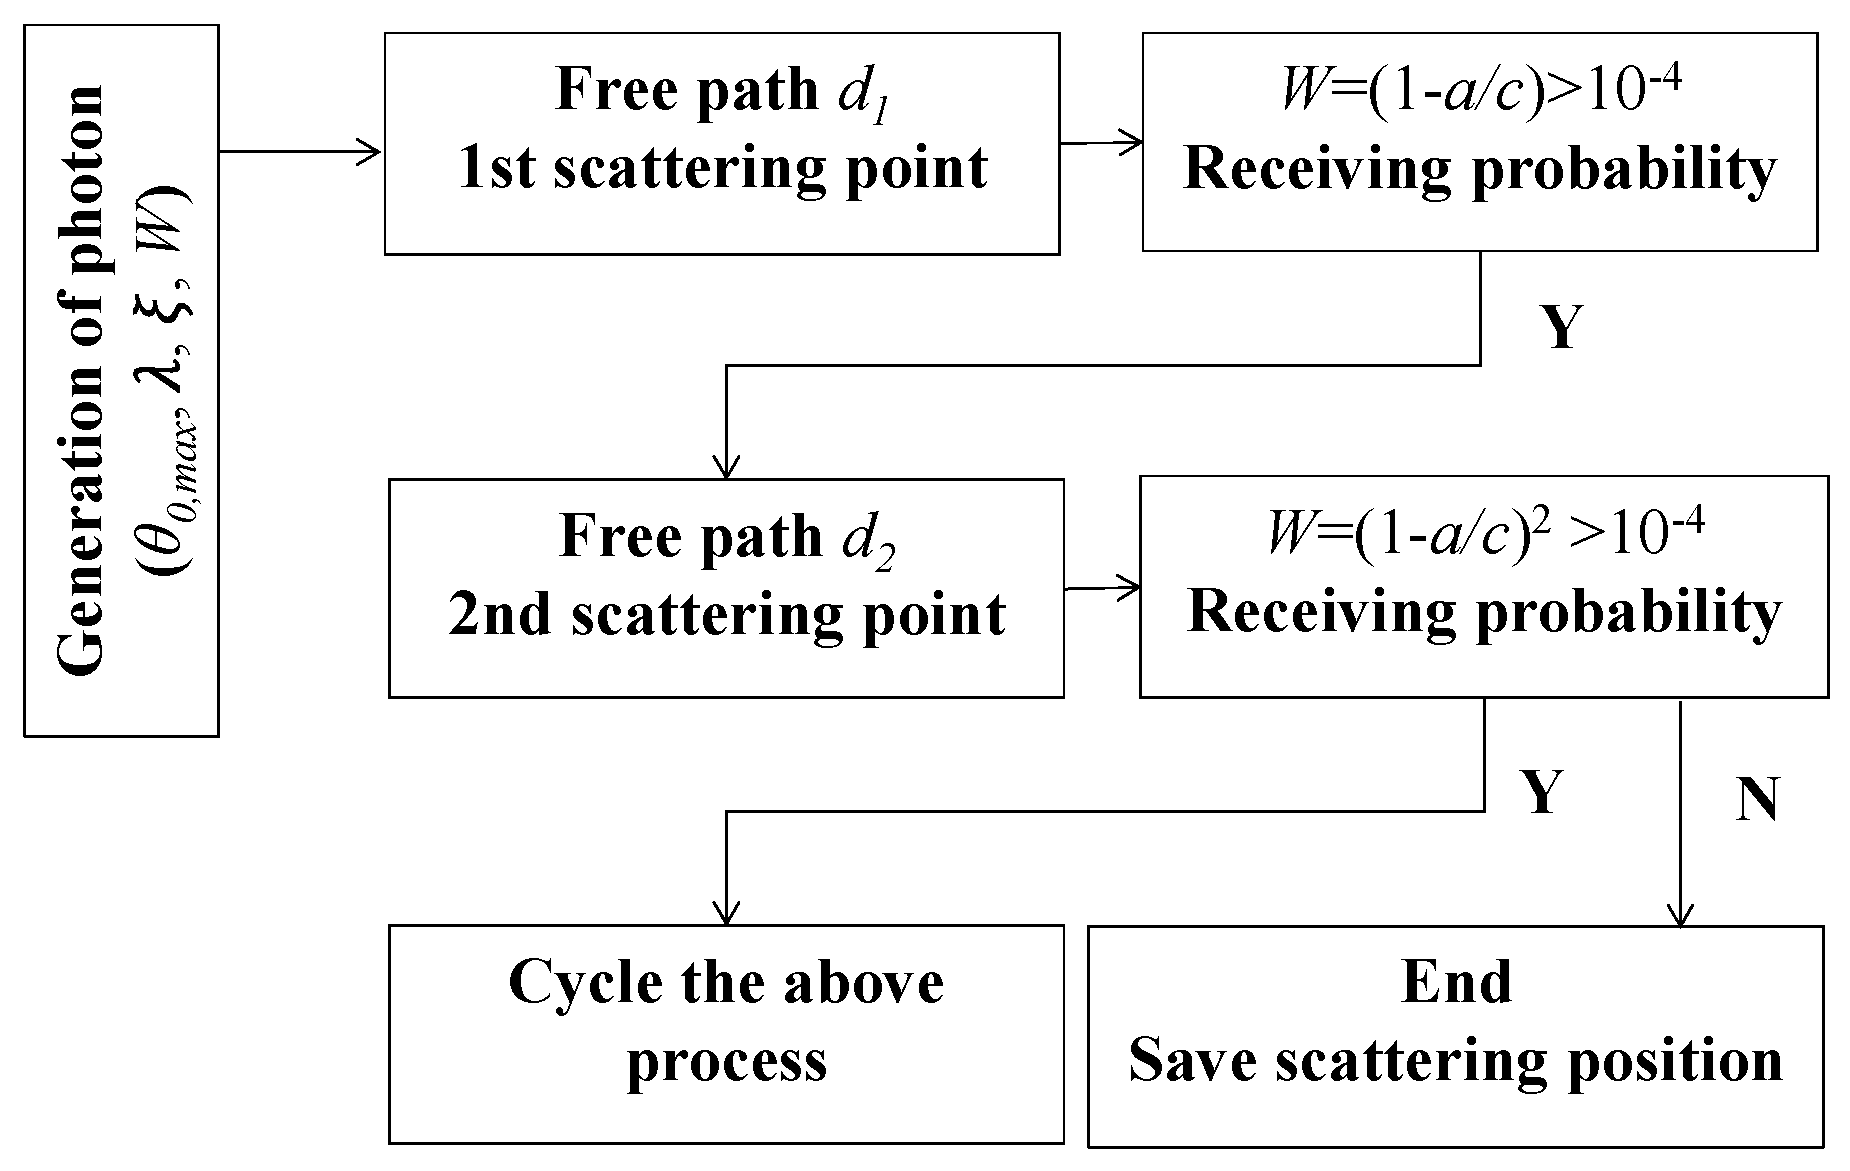
3.2. Underwater Channel

In an underwater environment, the transmitted light is greatly influenced by the optical properties of water. Underwater particles can cause energy attenuation and divergence of the beam. In this section, Kopelevich channel modeling is used as a volume scattering function (VSF) to investigate the extinction coefficient of natural water by simulation [9,10]. The specific form of this model is presented in [9].
Absorption coefficient a and scattering coefficient b denote the spectral absorption and scattering rate of unit interval, respectively. In this paper, we consider fulvic acid, humic acid and chlorophyll as the main absorption components of water [11,12], which can be expressed as follows:
a ( λ ) = a w ( λ ) + a c ( λ ) + a f ( λ ) + a h ( λ ) ,
a c ( λ ) = a c 0 ( λ ) ( C c / C c 0 ) 0.602 ,
a f ( λ ) = a f 0 C f exp ( k f λ ) ,
a h ( λ ) = a h 0 C h exp ( k h λ ) ,
where λ indicates the light wavelength, and a ω ( λ ) , a c ( λ ) , a f ( λ ) , and a h ( λ ) are the absorption coefficients caused by pure water, chlorophyll, fulvic acid, and humic acid, respectively. The variables of a c 0 , a f 0 , and a h 0 represent the chlorophyll, fulvic acid, and humic acid characteristic absorption coefficients, respectively [13,14,15]. The two constant parameters k f and k h are 0.0189 m−1 and 0.0111 m−1. C c , C f , and C h indicate the concentrations of chlorophyll, fulvic acid, and humic acid in water ( C c 0 = 1 mg/m3). The values of C c are given in Table 1. C f and C h are expressed as follows:
C f = 1.74098 C c exp ( 0.12327 C c / C c 0 ) ,
C h = 0.19334 C c exp ( 0.12327 C c / C c 0 ) .
We adopt a small and large particle scattering model to get the scattering coefficient of different types of water, which is a weighted summation with a pure water scattering coefficient [16].
b ( λ ) = b w ( λ ) + b s 0 ( λ ) C s + b l 0 ( λ ) C l ,
where b ω ( λ ) indicates the scattering coefficient of pure water, b s 0 ( λ ) and b l 0 ( λ ) denote the scattering coefficients caused by small and large suspended particles, respectively [16,17], and C s and C l are the concentrations of both types of particles in water.
The extinction coefficient c ( λ ) is the sum of the absorption coefficient and scattering coefficient. VSF is a very important parameter in underwater channel modeling. It indicates the ratio of scattered intensity (solid angle Δ Ω centered on θ ) to total incident light intensity at a specific scattering angle. θ indicates the scattering angle. In our model, we adopt the Kopelevich model as the VSF. Compared with the traditional Henyey–Greenstein model, the Kopelevich model not only covers small and large particles, but also can be more accurately applied to high turbid water [9].
VSF for underwater application can be expressed by the combination of pure water, small particles, and large particles [16].
p ( λ , θ ) = b w ( λ ) p R ( θ ) + b s 0 ( λ ) p s ( θ ) C s + b l 0 ( λ ) p l ( θ ) C l ,
where p R ( θ ) , p s ( θ ) , and p l ( θ ) indicate the probability density functions for pure water, small particles, and large particles, respectively.
For the Kopelevich model, the total seawater scattering coefficient can be modeled as follows [9]:
b ( λ ) = 0.0017 × ( 550 λ ) 4.3 + 1.34 C s ( 550 λ ) 1.7 + 0.312 C l ( 550 λ ) 0.3 ,
where C s and C l are the concentrations of small and large particles, respectively.
We set the weight (unit energy) for each photon, and the energy attenuation of the transmitted light beam is equivalent to the change in weight. We define four main parameters at the transmitter: the wavelength λ , the maximum half-divergence angle θ m a x , the zenith angle θ , and the azimuth angle φ . Initially, each photo is launched into water with the given maximum half-divergence angle θ m a x and unit weight. The initial departure direction of the photon is determined on the basis of random variables θ and φ . The direction is generated according to [ θ m a x ,   θ m a x ] for θ and [ 0 ,   2 π ] for φ . The direction vector of emitted photons is ( sin θ cos φ , sin θ sin φ , cos θ ). After traveling at a certain distance called the free path, emitted photons might lose their energy and change their transmission direction due to collision with particles in the underwater medium. Using a probability model, the free path can be expressed as follows [18]:
d = ln ( ξ ) / c ,
where ξ is a random variable which obeys a uniform distribution within (0, 1].
Due to the collision with particles in the underwater medium, emitted photons lose their energy and change their transmission direction. It is assumed that the weights of emitted photons before and after collision are W p r e and W p o s t , which satisfy Equation (15) [18].
W p o s t = W p r e ( 1 a / c ) .
Once scattering occurs, the transmission direction of emitted photons is changed. The new direction vector P2 after collision is dependent on the old direction vector P1, scattering angle θ , and azimuth angle φ , as shown in Figure 2. Random variable φ satisfies a uniform distribution within [0, 2π].
For a single photon, VSF can be considered as the probability density function of the scattering angle. The generating methods of scattering angle for different VSFs are definitely different. As for the Kopelevich model, we use the acceptance–rejection sampling method to get the random scattering angle. According to the old transmission direction vector ( u x i , u y i , u z i ), the scattering angle θ , and the azimuth angle φ , the transmission direction vector after scattering is represented by ( u x i + 1 , u y i + 1 , u z i + 1 ) [19].
u x i + 1 = u y i sin θ cos ϕ + u x i ( cos θ + sin θ sin ϕ ) u y i + 1 = u x i sin θ cos ϕ + u y i ( cos θ + sin θ sin ϕ ) u z i + 1 = ( u x i 2 + u y i 2 ) sin θ sin ϕ / u z i + u z i cos θ

3.3. Photocounting Receiver

After several scattering events, the photons have a chance to be detected by the receiver. Since the solid angle Δ Ω of the photon scattering space is small enough, it can be assumed that the VSF among Δ Ω is constant. The variable p ( θ ) of the scattering direction satisfies
0 π 1 / 2 π 0 2 π p ( θ ) d θ d ϕ = 1 .
By changing it into the integral of the solid angle, we get
p ( θ ) 2 π sin θ sin θ d θ d ϕ = p ( θ ) 2 π sin θ d Ω = 1 .
Thus, the reception probability of the emitted photon is
P = p ( θ ) 2 π sin θ Δ Ω .
Considering the conditional probability of free path, the final reception probability becomes
P = p ( θ ) 2 π sin θ Δ Ω × exp ( k s | r r r i | ) ,
where r r is the position of receive window, and r i is the position where the final scattering before detection happens. In our model, the threshold setting of the photon weight is 10−4, as shown in Table 2. Path loss and impulse response are crucial. We can calculate the path loss by summation of all products of reception probability and receiving photon weights. As for each scattering event, the position prior to scattering is available; thus, the entire path of the photon before detection is recorded. The channel response can be calculated so long as we count the receiving intensity in a given time slot. In summary, we can get the flow chart of the Monte Carlo model as shown in Figure 3. The channel responses of different wavelengths in four types of water are shown in Figure 4. It can be seen from Figure 4a–d that the optimum transmission wavelength is switched from 450 nm (blue) to 595 nm (red) when the water condition is changed from pure to turbid harbor. Moreover, a clear multipath channel characteristic is observed due to heavy scattering as illustrated Figure 4d, which is consistent with the results in [17]. The theoretical analysis and impulse response results under different water conditions guide the design of the experimental system. We can select the optimal wavelength according to the different water conditions to achieve the maximum data rate and the maximum transmission distance.

4. Experiment and Results

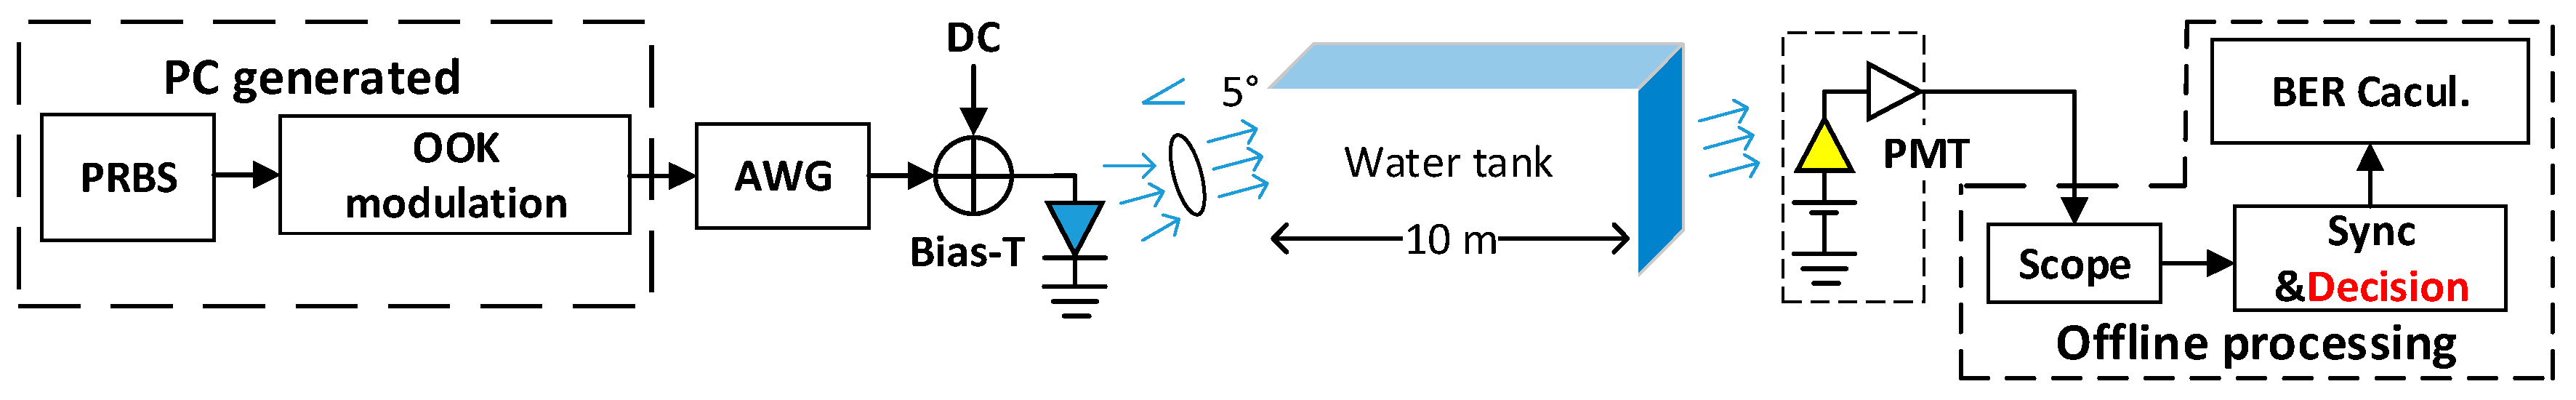
4.1. Experimental Setup and Paraeters

Figure 5 shows a schematic diagram of our experimental UOWC system using a blue LED source and PMT receiver (Hamamatsu, model CR315). An inclination angle of 5° is introduced to the transceiver, which causes huge attenuation to build a non-line-of-sight link. All the signal processing modules are implemented offline by MATLAB. At the transmitter, a pseudo-random bit sequence (PRBS) is generated and then sampled by an arbitrary signal generator (AWG) running at 10 MSa/s (1 Mbps), 20 MSa/s (2 Mbps), 50 MSa/s (5 Mbps), and 100 MSa/s (10 Mbps). Then, the baseband signals combined with a DC bias are injected into the LED. Compared with LD, the LED-based transmitter has no need of strict alignment or high emission power. A real-time oscilloscope is used to convert the analog signal into the digital domain. Simple digital signal processing (DSP) algorithms are applied at the receiving end, such as synchronization, decision, and BER calculation. The data length of each frame is 1151 bits, of which 127 bits are used for synchronization. We use multiple frames of information to increase the number of calculated bits. The number of effective bits used to calculate the BER was 20,718. To avoid synchronization problems, we increased the number of synchronization header bits. Unlike the conventional waveform sampling amplitude demodulation method, the photon-counting pulse signals need to be judged. When the amplitude of the sampled pulse is above the decision threshold voltage (DTV) VD, one photon is counted. Final decisions on symbol “1” or “0” are made by the counted average values in each symbol. Thus, the BER value can be calculated according to the hard threshold n t h . Some key parameters of the proposed UOWC system are summarized and listed in Table 3.

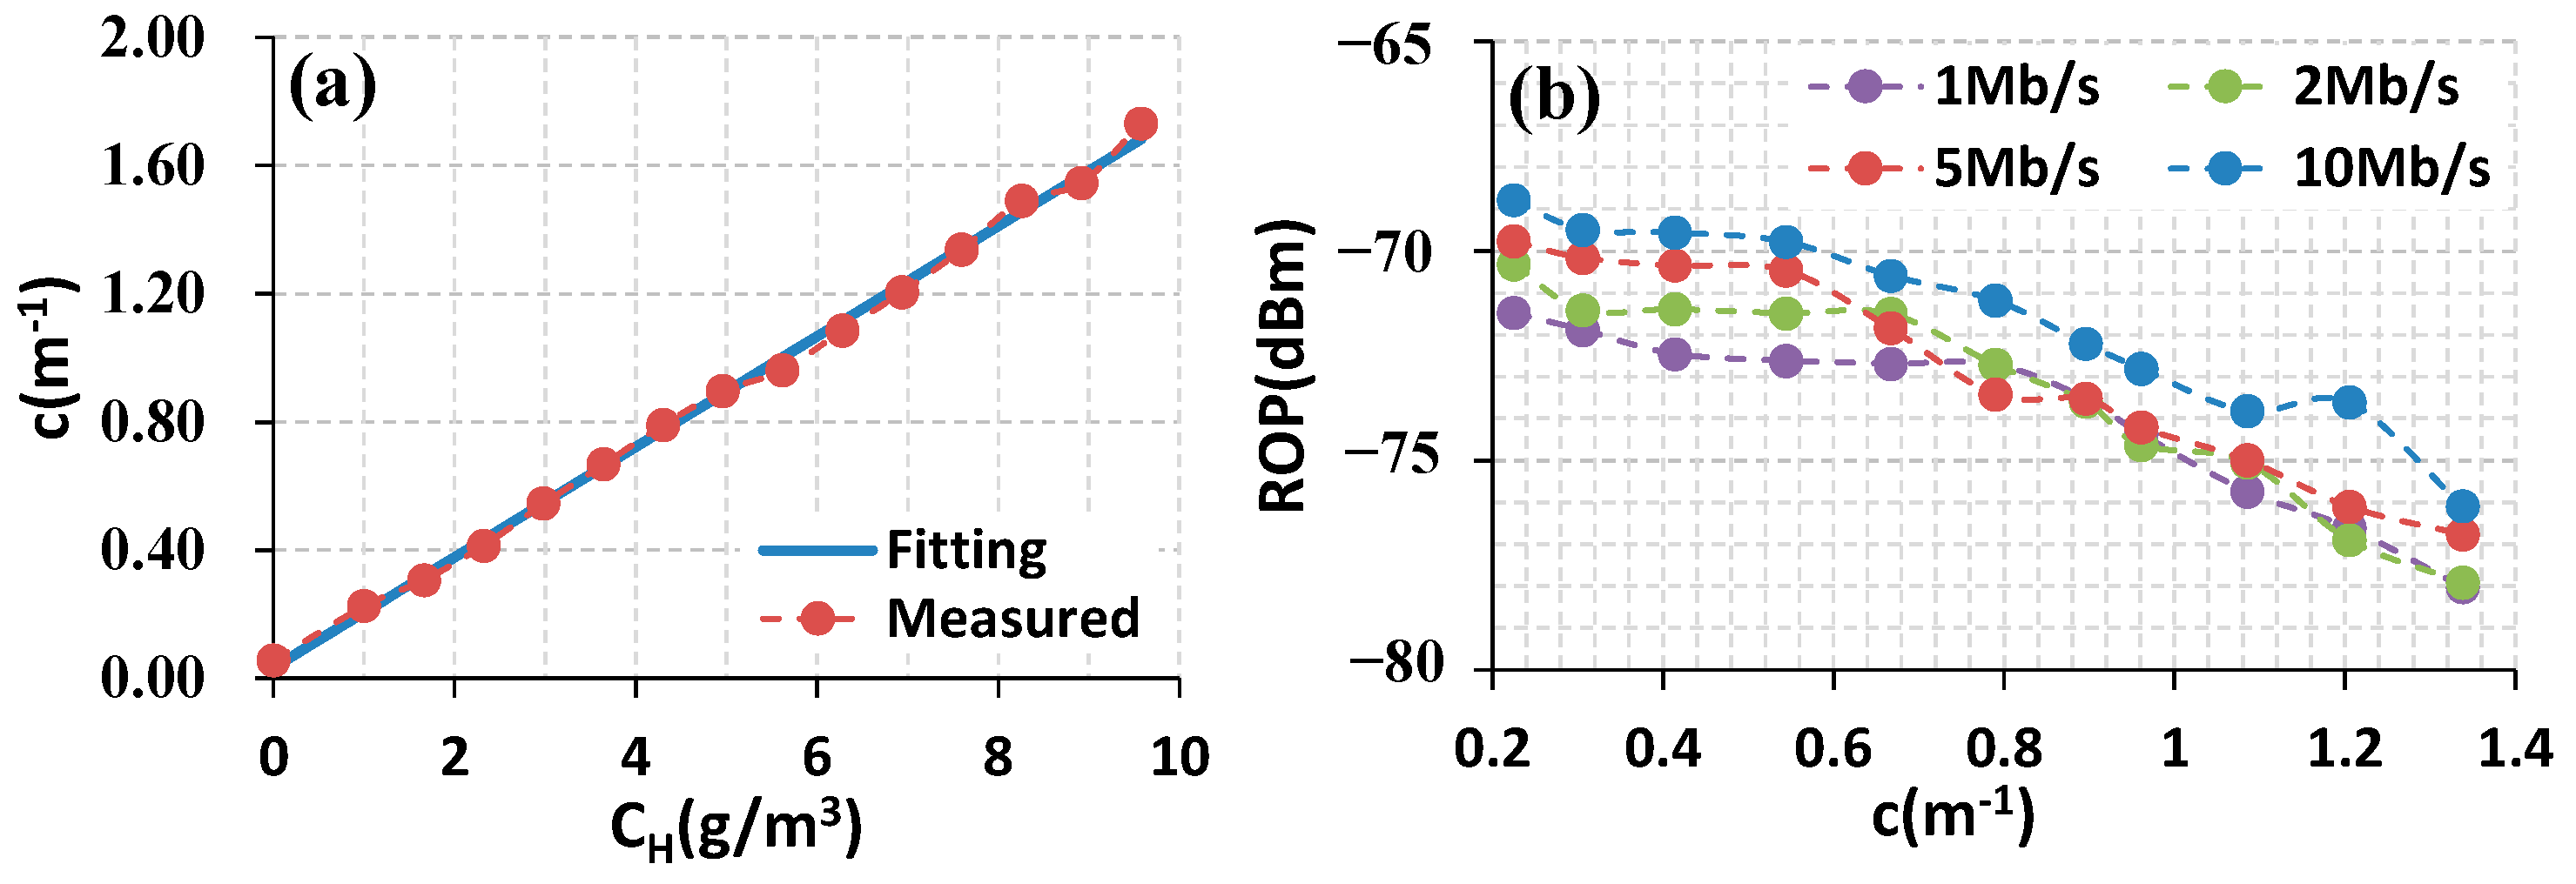
4.2. Attenuation Coefficient Measurement

Water quality significantly impacts the BER performance. The PMT receiver is more sensitive to optical power than other light-sensitive devices such as an APD. Ambient light may annihilate signals. Thus, the experimental system should be thoroughly shaded with black nonreflective material. Our experimental channel was a 10 m long water tank with a volume of 3 m3. Light absorption and scattering in seawater are caused by inorganic salts and planktonic plants. Some previous studies have shown that a similar effect of aluminum hydroxide or magnesium hydroxide to seawater is observed on the light of particles [20]. In the experiment, we added different concentrations of aluminum hydroxide to pure water to simulate seawater with different degrees of turbidity, i.e., pure seawater, clean seawater, coastal seawater, and harbor seawater, characterized by the parameters of attenuation coefficients.
c = ln P c P 0 . 1 z + c 0 .
In the experiment, we could not directly measure the relationship between the attenuation coefficient and the aluminum hydroxide concentration due to the presence of an off-angle at the transmitter. A preliminary experiment was carried out using an LD with very narrow divergence angle and a high-sensitivity optical power meter. Because of the reflection and absorption caused by the glass wall, we used Equation (21) to measure the relative attenuation coefficient. The results are shown in Figure 6a. We can see an approximate linear relationship between the aluminum hydroxide concentration and the attenuation coefficient. The parameter c is the measured attenuation coefficient, and c 0 is the attenuation coefficient of pure seawater with a value of 0.056 m−1. The shaded tank was filled with pure water. Then, we added aluminum hydroxide powder to the water at a mass of 3 g each time and measured the ROP as Pc. Figure 6b shows the measured curve of the ROP as a function of the attenuation coefficient varying from 0.2 m−1 to 1.3 m−1 for different data rates. It can be seen from Figure 3b that the ROP was about −78 dBm for a 2 Mbps data rate at c = 1.3 m−1, which means that a total loss of 99 dB was introduced (launched optical power was 21 dBm). The values of ROP were calculated using the average number of experimentally counted photons according to Equation (22).

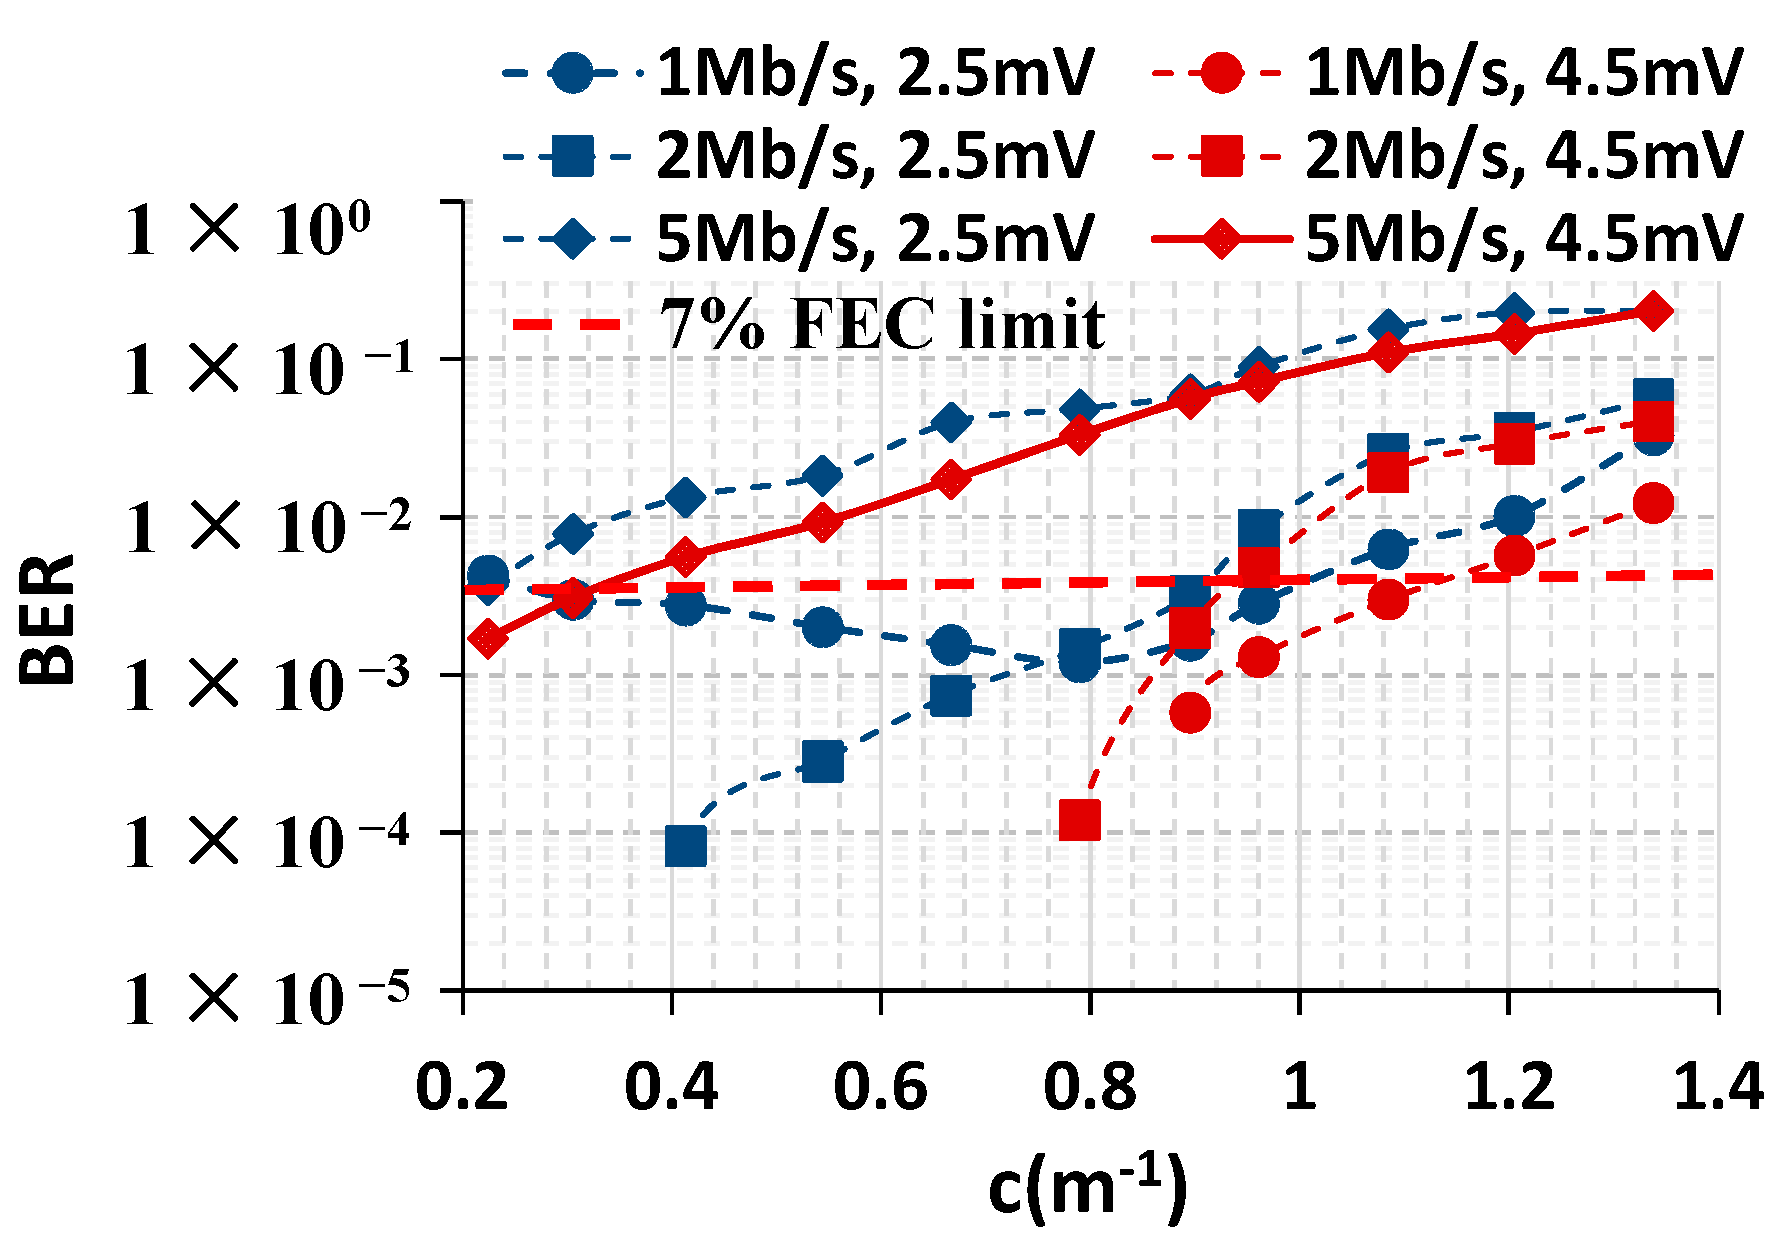
4.3. Measured BER Performance

In our experiment, we used a Hamamatsu PMT with a spectral response range from 300 nm to 650 nm as the receiver. The quantum efficiency of the PMT was 5%, and the typical dark count was 20 counts/sec. The number of photons counted in symbol “1” was contributed by the signal and the background light, while the photons counted in symbol “0” were caused by the background light and inter-symbol interference. An RZ code with a duty cycle of 0.7 was designed according to Equation (22), since the ROP can be maximized and a clock frequency component is included [21], where ξ is the quantum efficiency of PMT, h is Planck’s constant, ν is the frequency of light, Tb is the symbol duration, and n1 and n 0 are the average numbers of photons contained in symbols “1” and “0”.
P r , P M T = 1 ξ . 7 20 . h ν ( n 1 n 0 ) T b .
According to the measured results shown in Figure 7, when the number of received photons was less than 20, the measured data followed a relatively strict Poisson distribution since the PMT worked in the linear region. Upon increasing the number of photos to 40, the PMT was subjected to overexposure and worked in the nonlinear region, thus experiencing signal distortion [21]. In this condition, the distribution of the counted photons does not obey a strict Poisson distribution, as shown in Figure 7. The BER value can be calculated using Equation (23), where n t h is the hard-decision threshold [5].
BER = 1 2 k = 0 n t h 1 e n 1 n 1 k ! k + 1 2 k = n t h e n 0 n 0 k ! k , n t h = [ n 1 n 0 ln n 1 ln n 0 ] .
We present the measured BER performance under different water conditions in Figure 8. As discussed before, when the number of received photons is increased to around 20 (~−73 dBm), the number of the received photons no longer obeys a Poisson distribution. At this moment, the values of V D should also be adjusted. In our experiment, the optimal values of V D were obtained according to the rule of minimizing the BER. As illustrated in Figure 6b, an ROP of −73 dBm corresponded to a 10 m underwater transmission with an attenuation coefficient of 0.8 m−1. When the PMT worked in photon-counting mode ( c > 0.8 m−1), the number of photons in symbol “1” obeyed a strict Poisson distribution. Thus, the value of DTV V D was set to 2.5 mV. However, the measured BER performance worsened, especially for 1 Mbps and 2 Mbps data rates, when the attenuation coefficients varied from 0.2 m−1 to 0.8 m−1 (saturation region of PMT). With the adapted optimal value of V D = 4.5 mV, error-free transmissions of 1 Mbps and 2 Mbps data rates were successfully achieved. The BER performance enhancement at the 5 Mbps data rate was not significant, because, when increasing the signal baud rate, severe inter-symbol interference was introduced due to the limited bandwidth of LED. Moreover, conclusions can be made according to Figure 8 that the receiver sensitivities of our proposed LED–UOWC systems at 1 Mbps, 2 Mbps, and 5 Mbps data rates were −76 dBm (1.08 m−1), −74 dBm (0.92 m−1), and −70 dBm (0.24 m−1) at the 7% FEC limit of 3.8 × 10⁻³, respectively.

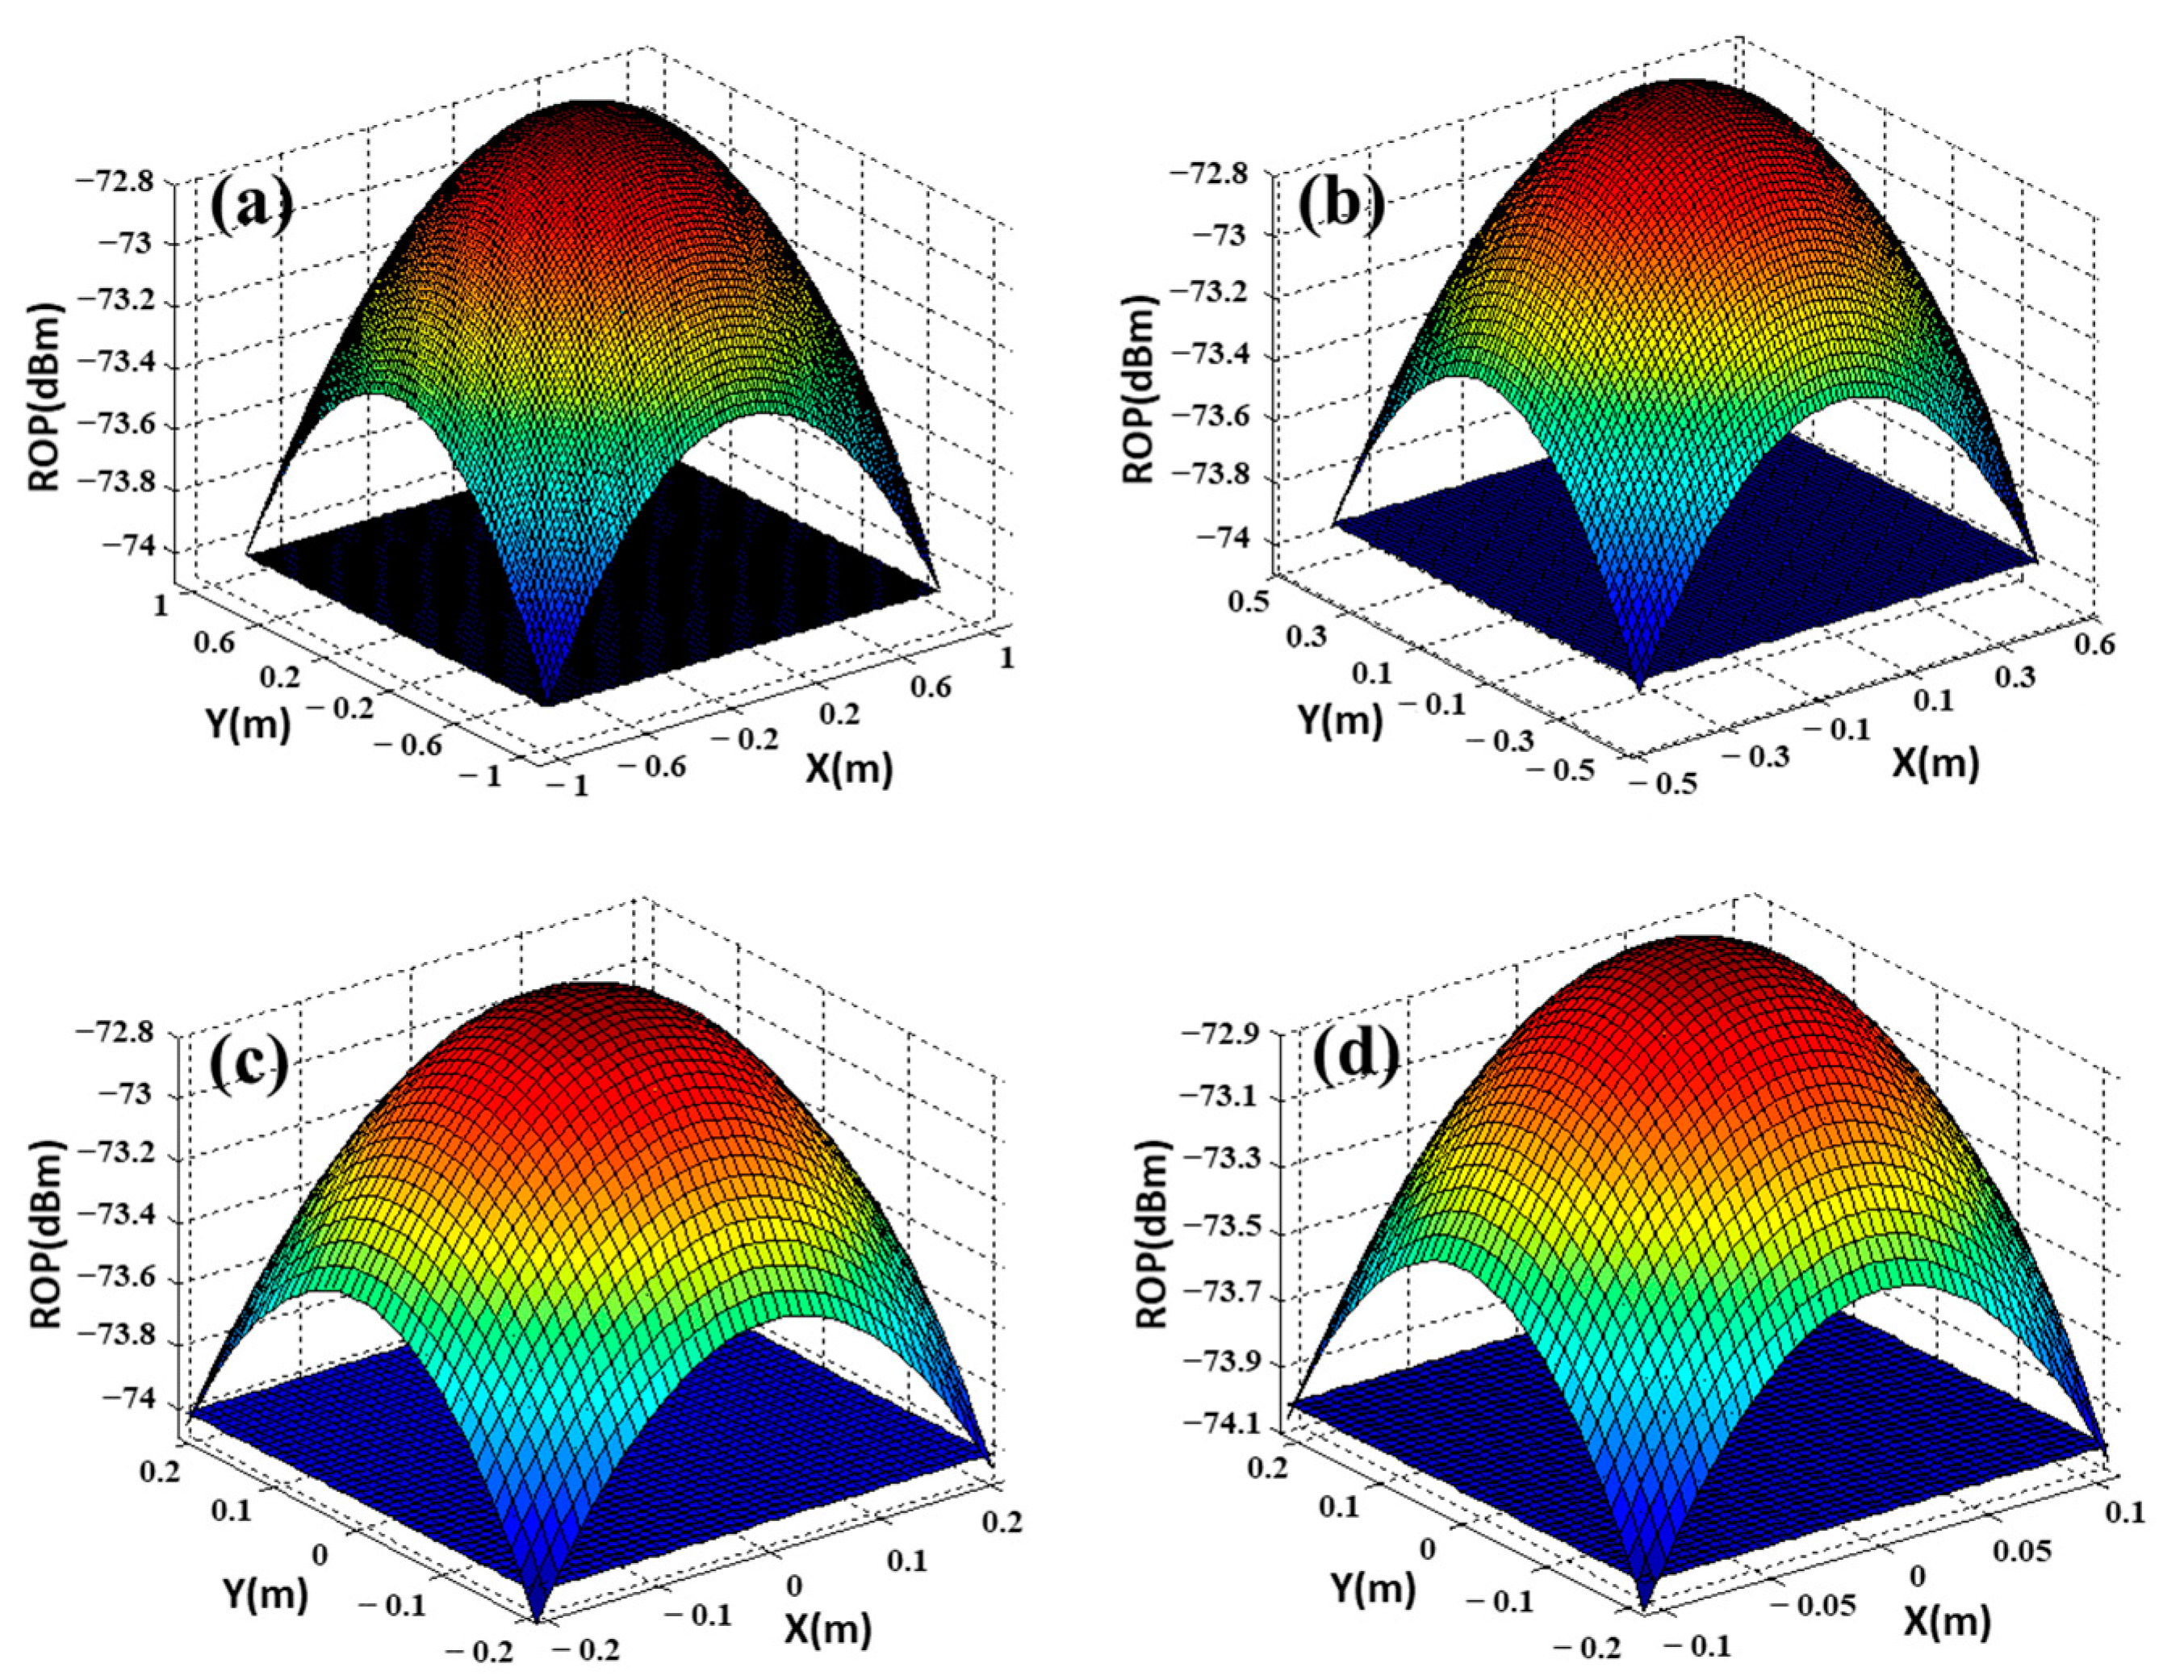
4.4. The Predicted Performance Based on the Proposed System

As illustrated in Figure 9, we further investigated the proposed system performance under conditions of the first type of seawater (pure, c = 0.056 m−1), the second type (clean, c = 0.151 m−1), and the third type (coastal, c = 0.398 m−1). According to the experimental results illustrated in Figure 4, the required ROP for 2 Mbps at the 7% FEC limit is −74 dBm. Using Equation (4) and the parameters in Table 1, the optical power distribution at the receiving plane within the receiver sensitivity of −74 dBm was established using Lambertian model. Within the receiving radii of 1.28 m, 0.62 m, and 0.29 m, the achievable distances were 83.5 m, 40.5 m, and 19.2 m for the first, second, and third types of seawater, respectively. The maximum transmission distances could be extended to 100 m, 46 m, and 21 m when the receiver was located in the center of the receiving plane, as depicted in Figure 10. With a transmitted electrical power of 10 W, the maximum distances were further increased to 134 m, 60 m, and 27 m. When c exceeded the value of 0.92 m−1 (ROP = −74 dBm), as shown in Figure 8, the BER performance for the 2 Mbps signal became worse than the 7% FEC limit. The calculated optical power based on Equation (22) was −74.37 dBm in this condition, which is consistent with the optical power distribution obtained by the Lambertian model, as shown in Figure 9. The experimental 2 Mbps data rate after 10 m could achieve a receiving area of π × 0.15 2 = 0.07 m2. Thus, it is believed that our proposed long-reach UOWC system is capable of achieving an Mbps-scale data rate with an alignment-released configuration.

5. Discussion

To build a long-range UOWC link or to propagate light through relative turbid water, two factors need to be considered: (i) pointing and alignment, and (ii) multipath interference.

5.1. Pointing and Alignment

To maintain a reliable line-of-sight UOWC link using an LD source after long-distance transmission is very difficult, since the optical beam is quite narrow. At this moment, pointing errors usually occur because of the link misalignment. Using a beam spread function, the link misalignment model for a UOWC system can be expressed as follows [3]:
BSF ( L , r ) = E ( L , r ) e c L + 0 E ( L , ϑ ) e c L × { exp [ 0 L b β ˜ ( ϑ ( L z ) ) d z ] 1 } J 0 ( ϑ r ) ϑ d ϑ ,
where BSF ( L , r ) is the irradiance distribution at the receiver plane. Employing a LED source with a large beam size corresponds to a large receiving range. Thus, we can get the irradiance distribution more accessibly at the receiver plane.

5.2. Multipath Interference

As illustrated in Figure 4d, a multipath interference effect is produced in an optical turbid harbor underwater channel after 8 m transmission. For a certain data rate, the effect of multipath interference eventually leads to time spreading and waveform distortion, thus decreasing the BER performance due to the inter-symbol interference. Thus, when designing a UOWC system, this issue should be taken into consideration. Fortunately, technologies such as channel equalization [22], adaptive optics, and spatial diversity [23] are capable of suppressing the interference.

6. Conclusions

In this paper, we demonstrated a high-sensitivity long-reach UOWC system using LED and PMT. An experiment was conducted to investigate the BER performance under different water turbidities. Several key factors were taken into consideration during the system design, such as symbol rates, symbol duty cycles, water conditions, PMT characteristics, and decision criteria. With the help of RZ-OOK modulation and a PMT receiver, we experimentally achieved receiver sensitivities of −76 dBm, −74 dBm, and −70 dBm for 1 Mbps, 2 Mbps, and 5 Mbps data rates over a 10 m underwater channel, respectively. More than 100 m distance is achievable for a 2 Mbps data rate in pure seawater at 1 W transmitted power.

Author Contributions

C.L. and Z.L. contributed equally; C.L. and Z.L. performed the investigation and experiment; C.L. performed the analytical calculations and wrote the original draft; D.C. conducted the underwater channel simulation; X.D., F.Y., S.L., and Z.H. discussed the experimental results and revised the manuscript. All authors read and agreed to the published version of the manuscript.

Funding

This work was supported by the National Natural Science Foundation of China (12174002, 11874012), the Anhui Provincial Natural Science Foundation of China (1808085MF186), the China Postdoctoral Science Foundation (2021M690179), the Beijing Postdoctoral research Foundation (2021-ZZ-093), the Innovation project for the Returned Overseas Scholars of Anhui Province (2021LCX011), the Key Research and Development Plan of Anhui Province (202104a05020059), the University Synergy Innovation Program of Anhui Province (GXXT-2020-052), and the Project of State Key Laboratory of Environment-Friendly Energy Materials, Southwest University of Science and Technology (19FKSY0111).

Institutional Review Board Statement

Not applicable.

Informed Consent Statement

Not applicable.

Data Availability Statement

Not applicable.

Conflicts of Interest

The authors declare no conflict of interest.

References

  1. Stojanovic, M. Recent advances in high-speed underwater acoustic communications. IEEE J. Ocean. Eng. 1996, 21, 125–136. [Google Scholar] [CrossRef]
  2. Duntley, S. Light in the sea. OSA J. Opt. Soc. Am. 1963, 53, 214–233. [Google Scholar] [CrossRef]
  3. Kaushal, H.; Kaddoum, G. Underwater optical wireless communication. IEEE Access 2016, 4, 1518–1547. [Google Scholar] [CrossRef]
  4. Shen, J.; Wang, J.; Chen, X.; Zhang, C.; Kong, M.; Tong, Z.; Xu, J. Towards power-efficient long-reach underwater wireless optical communication using a multi-pixel photon counter. OSA Opt. Exp. 2018, 26, 23565–23571. [Google Scholar] [CrossRef] [PubMed]
  5. Rao, H.; Fletcher, A.; Hamilton, S.; Hardy, N.; Moores, J.; Yarnall, T. A burst-mode photon counting receiver with automatic channel estimation and bit rate detection. In Proceedings of the SPIE Conference LASE, San Francisco, CA, USA, 13 April 2016; p. 97390H. [Google Scholar]
  6. Xu, F.; Khalighi, M.; Bourennane, S. Impact of different noise sources on the performance of PIN-and APD-based FSO receivers. In Proceedings of the 11th International Conference on Telecommunications, Graz, Austria, 15–17 June 2011; pp. 211–218. [Google Scholar]
  7. Wang, P.; Li, C.; Xu, Z. A cost-efficient real-time 25 Mb/s system for LED-UOWC: Design, channel coding, FPGA implementation, and characterization. IEEE/OSA J. Lightw. Technol. 2018, 36, 2627–2637. [Google Scholar] [CrossRef]
  8. Kahn, J.-M.; Barry, J.-R. Wireless infrared communication. Proc. IEEE 1997, 85, 265–298. [Google Scholar] [CrossRef] [Green Version]
  9. Kopelevich, V. Small-parametric model of the optical properties of seawater. In Ocean Optics, I: Physical Ocean Optics; Oxford University Press: Moscow, Russia, 1983; pp. 208–234. [Google Scholar]
  10. Haltrin, V.; Khalturin, V. Propagation of light in sea depth. In Optical Remote Sensing of the Sea and the Influence of the Atmosphere; Academy of Sciences of GDR: Berlin, Germany, 1985; Chapter 2; pp. 20–62. [Google Scholar]
  11. Haltrin, V.-I.; Kattawar, G. Self-consistent solutions to the equation of transfer with elastic and inelastic scattering in oceanic optics: I. Model. OSA Appl. Opt. 1993, 32, 5356–5367. [Google Scholar] [CrossRef] [PubMed]
  12. Haltrin, V.-I. Chlorophyll-based model of seawater optical properties. OSA Appl. Opt. 1999, 38, 6826–6832. [Google Scholar] [CrossRef] [PubMed] [Green Version]
  13. Prieur, L.; Sathyendranath, S. An optical classification of coastal and oceanic waters based on the specific spectral absorption curves of phytoplankton pigments, dissolved organic matter, and other particulate materials. Limnol. Oceanogr. 1981, 26, 671–689. [Google Scholar] [CrossRef]
  14. Carder, K.-L.; Stewart, R.-G.; Harvey, G.-R.; Ortner, P.-B. Marine humic and fulvic acids: Their effects on remote sensing of ocean chlorophyll. Limnol. Oceanogr. 1989, 34, 68–81. [Google Scholar] [CrossRef]
  15. Hawes, S.-K.; Carder, K.-L.; Harvey, G.-R. Quantum fluorescence efficiencies of fulvic and humic acids: Effect on ocean color and fluorometric detection. In Proceedings of the SPIE in Ocean Optics XI, San Diego, CA, USA, 31 December 1992; Volume 1750, pp. 212–223. [Google Scholar]
  16. Haltrin, V.-I. One-parameter model of seawater optical properties. In Proceedings of the Ocean Optics XIV CD-ROM, Kailua-Kona, HI, USA, 10–13 November 1998; pp. 1–7. [Google Scholar]
  17. Gabriel, C.; Khalighi, M.-A.; Bourennane, S.; Léon, P.; Rigaud, V. Monte-Carlo-based channel characterization for underwater optical communication systems. J. Opt. Commun. Netw. 2013, 5, 1–12. [Google Scholar] [CrossRef] [Green Version]
  18. Ishimaru, A. Wave Propagation and Scattering in Random Media; IEEE Press: Piscataway, NJ, USA, 1997. [Google Scholar]
  19. Bohren, C.-F.; Huffman, D.-R. Absorption and Scattering of Light by Small Particles; Wiley: Hoboken, NJ, USA, 1988. [Google Scholar]
  20. Pontbriand, C.; Farr, N.; Ware, J.; Preisig, J.; Popenoe, H. Diffuse high-bandwidth optical communications. In Proceedings of the IEEE OCEANS, Quebec City, QC, Canada, 15–18 September 2008; pp. 15–18. [Google Scholar]
  21. Ning, J.; Gao, G.; Zhang, J.; Peng, H.; Guo, Y. Adaptive receiver control for reliable high-speed underwater wireless optical communication with photomultiplier tube receiver. IEEE Photonics J. 2021, 13, 1–7. [Google Scholar] [CrossRef]
  22. Jaruwatanadilok, S. Underwater wireless optical communication channel modeling and performance evaluation using vector radiative transfer theory. IEEE J. Sel. Areas Commun. 2008, 26, 1620–1627. [Google Scholar] [CrossRef]
  23. Jamali, M.-V.; Salehi, J.-A.; Akhoundi, F. Performance studies of underwater wireless optical communication systems with spatial diversity: MIMO scheme. IEEE Trans. Commun. 2016, 65, 1176–1192. [Google Scholar] [CrossRef] [Green Version]
Figure 1. Proposed concept of long-reach UOWC using LED and PMT. DC: direct current, TSS: transmitted signal sequence, DA: detection area, RSS: received signal sequence, DT: decision threshold. δ is the divergence half-angle. z is the transmission distance. D r is the radius at the detection area.
Photonics 08 00467 g001
Figure 2. Scattering pattern of emitted photons.
Photonics 08 00467 g002
Figure 3. Flow chart of Monte Carlo model for photocounting receiver.
Photonics 08 00467 g003
Figure 4. Channel response of different wavelengths in four types of water. The launched wavelengths were set to 400 nm, 450 nm, 500 nm, 550 nm, and 595 nm, respectively. (a) pure water ( c = 0.056 m−1), (b) clean ocean water ( c = 0.151 m−1); (c) coastal water ( c = 0.398 m−1); (d) turbid harbor water (   c = 2.17 m−1).
Photonics 08 00467 g004
Figure 5. Experimental setup of LED–PMT UOWC system with 5° misalignment between transmitter and receiver. PRBS: pseudo-random bit sequence, AWG: arbitrary signal generator.
Photonics 08 00467 g005
Figure 6. (a) Attenuation coefficient as a function of aluminum hydroxide concentration and (b) received optical power (ROP) under different water turbidities after 10 m underwater channel.
Photonics 08 00467 g006
Figure 7. Distribution of the received photons: (a) seven photons; (b) 40 photons.
Photonics 08 00467 g007
Figure 8. Experimental BER performance under different water turbidities after 10 m.
Photonics 08 00467 g008
Figure 9. Optical power distribution at the receiving plane within the receiver sensitivity of −74 dBm: (a) c = 0.056 m−1, z = 83.5 m, D r = 1.28 m; (b) c = 0.151 m−1, z = 40.5 m, D r = 0.62 m; (c) c = 0.398 m−1, z = 19.2 m, D r = 0.29 m; (d) c = 0.92 m−1, z = 10 m,.   D r = 0.15 m.
Photonics 08 00467 g009
Figure 10. The predicted maximum distances using the proposed system.
Photonics 08 00467 g010
Table 1. Chlorophyll concentration in four types of water (mg/m3).
PureClean OceanCoastalTurbid Harbor
Cc00.310.835.99
Table 2. Simulation parameters.
SymbolPhysical MeaningValue
λ Incident optical wavelength (unit: nm)400, 450, 500, 550, and 595
θ 0 , m a x Initial maximum half-divergence angle (random generation within [ 0 ,   2 π ])8.2°
ξ Statistical random variable for free path (random generation within (0, 1])0.6
W Decision weight at the receiver>10−4
Table 3. Key parameters of the proposed UOWC system.
SymbolPhysical MeaningValue/Unit
m1Lambertian order2.9 × 103
ϕ Angle of irradiance
ϕ 1 / 2 Half-power semi-angle of LED1.25°
zTransmission distance10 m
η E/O conversion efficiency0.1289
PtTransmitted electrical power1 W
RbTransmitted data rate1/2/5 Mbps
Publisher’s Note: MDPI stays neutral with regard to jurisdictional claims in published maps and institutional affiliations.

