Article

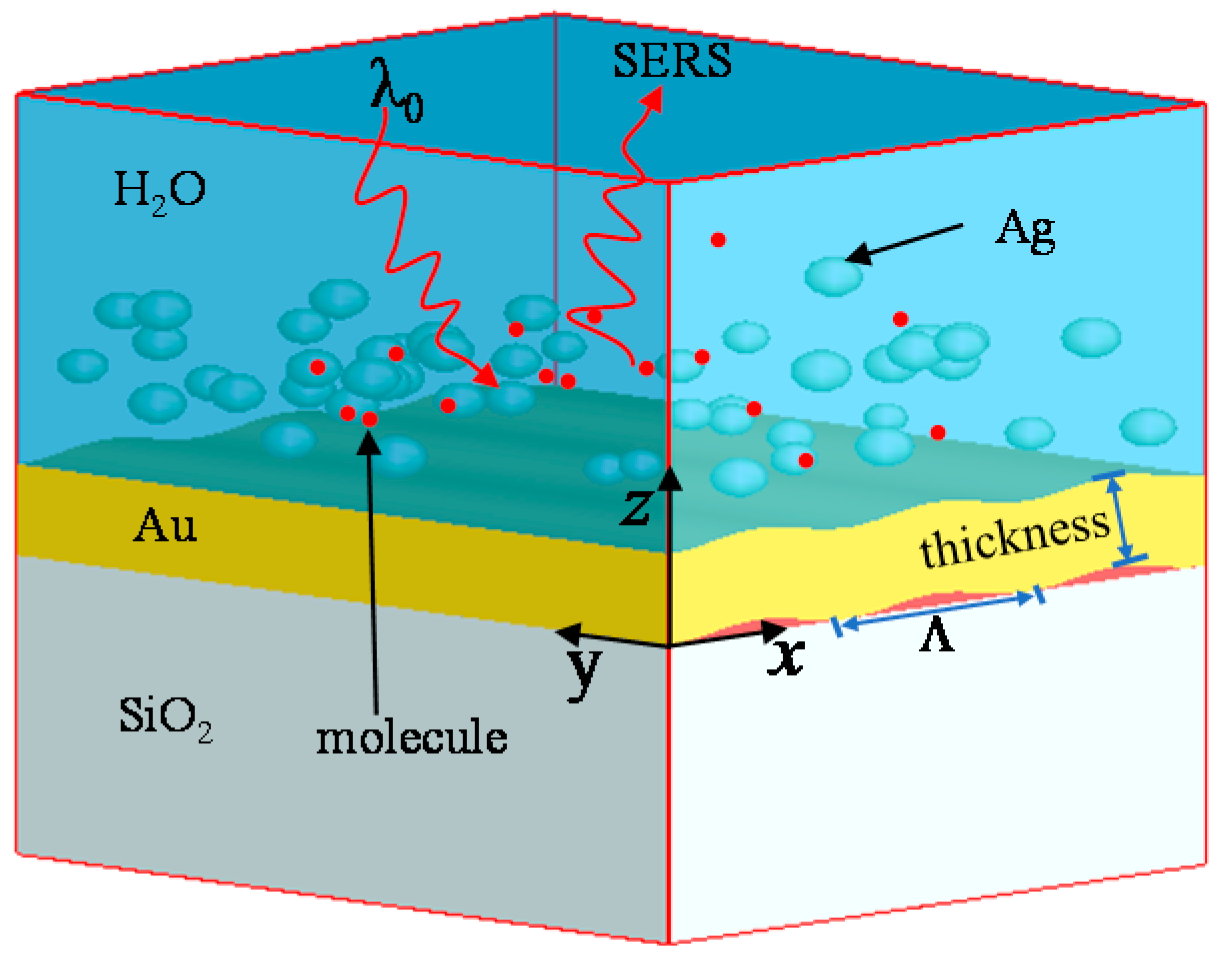
Composite Structure of Ag Colloidal Particles and Au Sinusoidal Nanograting with Large-Scale Ultra-High Field Enhancement for SERS Detection

1
Department of Engineering, Peoples Liberation Army Engineering University, Nanjing 210000, China
2
63908 Troops of the PLA, Shijiazhuang 050003, China
*
Author to whom correspondence should be addressed.
Photonics 2021, 8(10), 415; https://doi.org/10.3390/photonics8100415
Submission received: 30 August 2021 / Revised: 15 September 2021 / Accepted: 17 September 2021 / Published: 28 September 2021
(This article belongs to the Special Issue Applications of Surface-Enhanced Raman Spectroscopy (SERS))

Abstract

:
In this study, a novel composite Surface-Enhanced Raman Scattering (SERS) substrate is proposed for ultrasensitive detection. Consisting of gold sinusoidal nanograting and silver colloidal nanoparticles (AgNPs-AuSG), this type of SERS substrate is easy for fabrication by maskless laser interference lithography, and capable of providing large-scale ultra-high field enhancement, attributed to localized surface plasmons (LSPs) and surface plasmon polaritons (SPPs). The enhancement factor (EF) of this composite substrate is as high as up to 10 orders of magnitude in the simulation experiment. Experimental results show that this large-area, productive SERS substrate of AgNPs-AuSG has realized sensitive TNT and RDX detection with the limit of detection (LOD) of 10−10 M, which may be a potential candidate for trace explosives detection.

1. Introduction

Surface-enhanced Raman spectroscopy (SERS), as a ‘chemical fingerprint’ of the target materials, is a sensitive and reliable detection method extensively employed in biosensors [1,2], food security [3,4], and environment safety [5,6]. Considerable efforts have been made to develop the SERS substrate, including fabricating and using a range of structures and materials [7,8]. In terms of conventional two-dimensional SERS substrates, the enhanced Raman signal usually relies on the “hot spots” generated by the LSP resonance between nanoparticles [9,10]. Qian et al. [11] proposed a hybrid nanostructure composed of nanoporous gold films and gold nanoparticles. Ardini et al. [12] designed a large area-efficient SERS substrate, a nanoporous gold decorated with silver nanoparticles. These substrates have giant enhancement due to strong near-field coupling. It has been demonstrated that the coupling of mutual polariton modes can be excited by the particle-film complex structure [13,14,15]. Above the metal film, the metal nanoparticles (NPs) are periodically arranged with several nanometers apart from each other, which can act as a two-dimensional grating to excite the SPP wave, leading to the coupling of LSPs and SPPs [16]. So far, researchers have found that the SERS EF of the metal film and NPs coupling structure is sensitive to many factors, including the thickness of the dielectric layer, the size of the nanoparticle, and the distance between them [17,18]. However, it is not easy to control the interparticle at small periodicities, which is very important, because in this case strong coupling between adjacent NPs can be achieved [19,20,21,22]. In this paper, a composite SERS substrate is designed, as shown in Figure 1. The substrate is composed of two parts: one is the gold sinusoidal grating (AuSG) as a fixed substrate; the other is silver colloidal nanoparticles (AgNPs), which act as a flowing substrate.
The composite SERS substrate has the following advantages:
(1)
High field enhancement. There are a lot of hot spots in the dimer and gaps between the nanoparticles and the grating surface.
(2)
Fabrication friendliness. The sinusoidal nanograting can be easily fabricated over a large area using the currently established dual-laser interferometric lithography method, avoiding the expensive and time-consuming electron beam-based nano-fabrication method. AuSG with pattern periodicity has the advantage over the random configuration of surface structures due to its reproducibility and pattern scalability.
(3)
Continuous detection. Combining colloidal AgNPs with continuous flow microfluidics helps trap the analyte at the detection area [23], which is important for SERS detection. The flowing AgNPs also help resolve the problem of memory effects and make the composite SERS substrate reusable.
This paper delves into the EM field enhancement in the AgNPs-AuSG substrate, which could contribute to the actual detection of trace explosives.

2. Model and Theoretical Analysis

2.1. Theoretical Analysis

Theoretical and experimental studies have shown that when the gap between adjacent NPs reaches the order of tens of nanometers, the LSPs generated by NPs can be coupled to each other to elevate the EM fields, and the Raman intensity can be 2–4 orders of magnitude stronger than that of a single nanoparticle [24]. The concept of plasmon coupling (hybridization) was first proposed and explained from the perspective of molecular orbital hybridization by Nordlander [25].
Besides, the coupling of SPPs and LSPs can also be explained by the theory of plasmon hybridization. When NPs are close to the metal grating, the surface plasmon modes will interact with each other and produce a hybrid mode [21]. The coupling is related to the resonance frequencies of LSPs and SPPs. When their resonance frequencies are close, the coupling strength of LSPs and SPPs increases significantly, usually accompanied by Rabi splitting, that is, the energy separation between normal modes [26]. In order to avoid Rabi splitting, according to Mie’s theory, small AgNPs with a radius of about 30 nm are chosen, and the resonance wavelength of LSPs is far away from that of AuSG SPPs at 785 nm in the experiment [27]. The weak coupling of LSPs and SPPs will not affect their resonance frequencies, which brings convenience to Raman detection. Therefore, under the joint enhancement of SPP and LSP, we can obtain a highly enhanced electric field.
SPPs, propagating at the metal/dielectric interface, are essentially two-dimensional electromagnetic waves, which cannot be excited directly by light beams [28,29]. For the sinusoidal grating depicted in Figure 1, the SPPs can be excited when their wavevector matches with the incident photons and grating as follows [30]:
β = k 0 ε m ( ω ) × ε d ε m ( ω ) + ε d = k 0 n d sin θ i ± m 2 π Λ
where β is the SPP wave vector, k 0 = ω c is the incident wave vector, and 2 π / Λ = k g is the grating wavevector. Here, Λ is the periodicity of the grating, ω and c are the frequency and speed of the incident light, ε m ( ω ) and ε d are metal and dielectric permittivity, θ i is the angle of the incident light with respect to the normal on the grating, m is an integer and represents the grating diffractive order, n d is the refractive index of the medium surrounding the device, namely water.

2.2. FDTD

Since the use of near-infrared (NIR) excitation can greatly reduce the interferences from fluorescence and effectively avoid the decomposition of samples induced by strong excitation energies at the shorter wavelengths, 785 nm laser has become one of the most common excitation sources for portable Raman instruments. In the actual TNT and RDX detection experiments, an excitation laser with a wavelength of 785 nm (Ocean Optics Laser-785, 100 µm at 0.22 NA) is used. It is well known that an optimized SERS enhancement is expected when the periodicity of grating is tuned to match with the excitation source in SERS experiments. In order to excite SPPs at 785 nm, the periodicity of the AuSG has to be about 570 nm by Equation (1), with the dispersive dielectric function of Au from Ref. [31]. The optical responses of the composite substrate are computed through FDTD simulations, as defined in Figure 1. The Λ , amplitude, and thickness of AuSG are set to 570 nm, 20 nm, and 120 nm, respectively since it has a large SERS. Periodic boundary conditions (PBCs) are used in the X- and Y-direction, while perfectly matched layers (PMLs) are used in the Z-direction. The normal incidence of light (plane waves) with transverse magnetic (TM) polarization, are considered as excitations. The dispersive dielectric function of Ag and Au is extracted from the experimental data from the Refs. [31,32]. The nondispersive refractive indices of H2O and glass (SiO2) are considered as 1.3356 and 1.45, respectively. Relatively fine grid spacings set with 1 nm, and simulation time with 1000 fs is applied for well-converged results.

3. Results

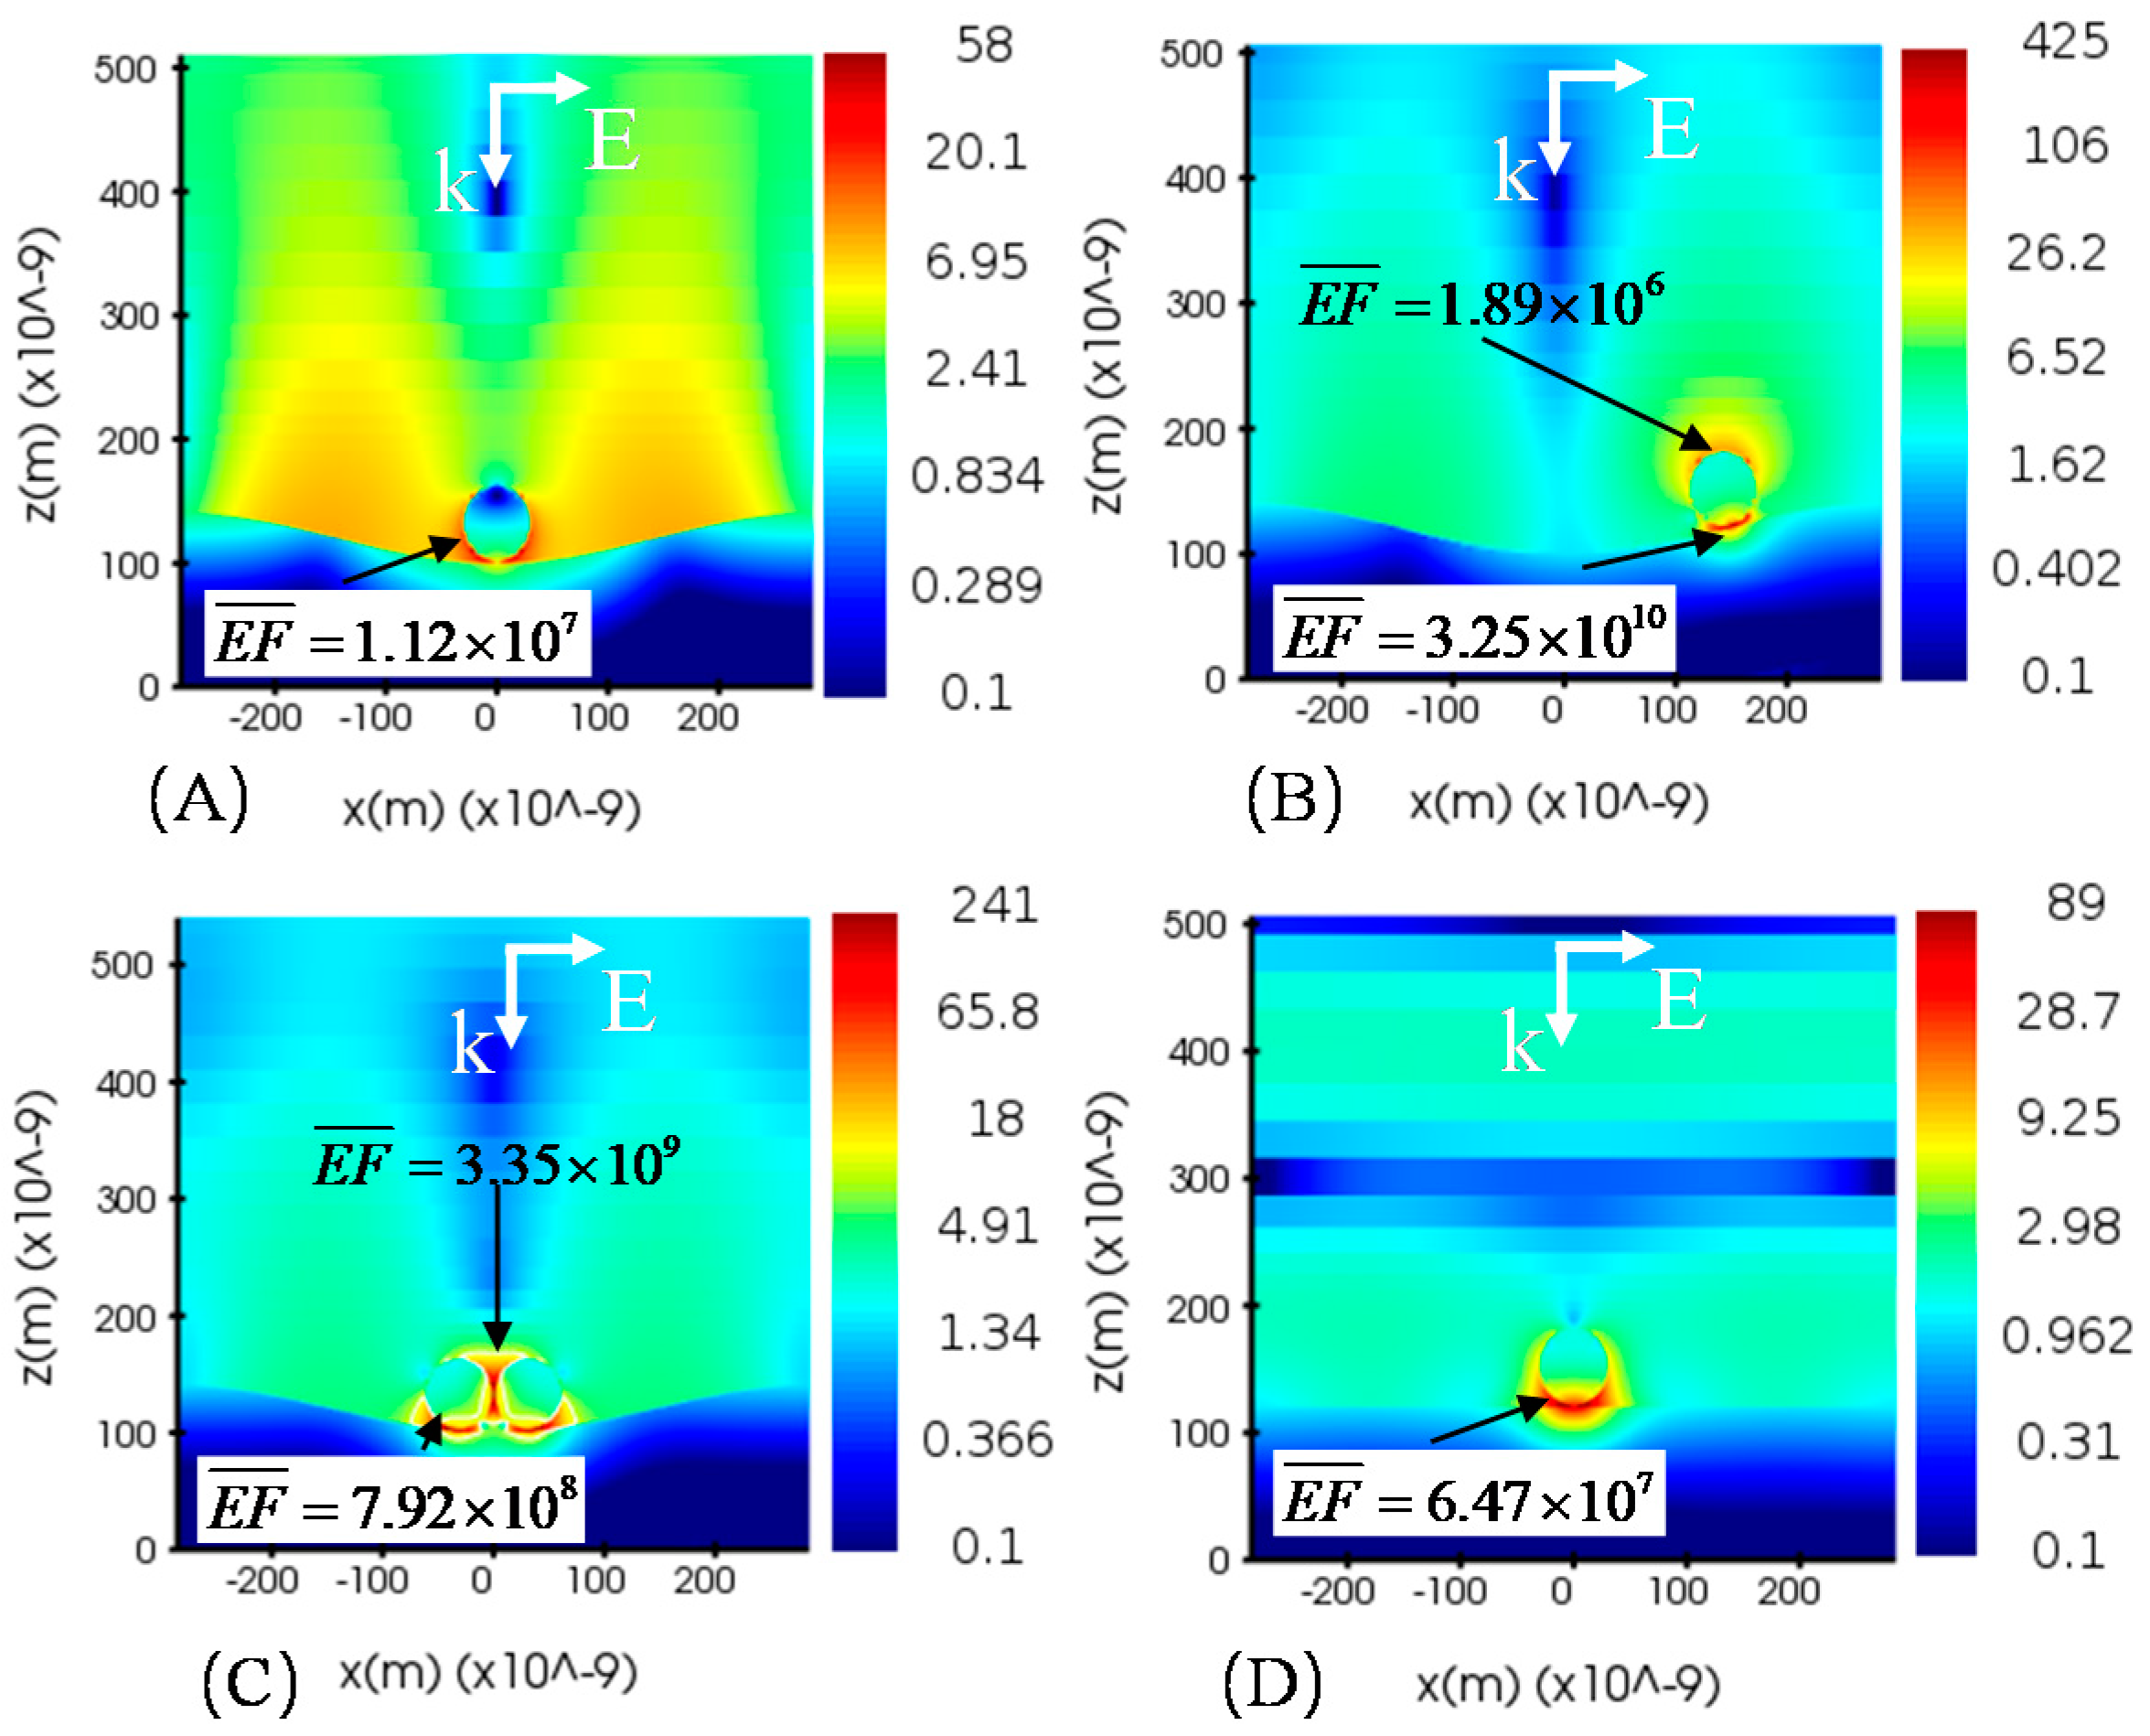
3.1. Double Enhancement

Some scholars have studied the characteristics of SPPs formed by gold sinusoidal grating [33]. Excitation of SPPs is detected as a minimum in the reflected light. The reflection and absorbance spectra of AuSG as a function of incident light and the electric field distribution at the resonance wavelength are shown in Figure 2.
It can be seen from Figure 2 that the SPPs resonate at the excitation light wavelength of 786 nm, which corresponds to m = 1 of the grating diffractive order, according to Formula (1). In the electric field distribution subplot, the SPPs propagate along the surface of the grating, accompanied by the periodic spatial distribution of the surface electric field. SPPs, as an evanescent wave, can enhance the electric field above the grating surface by a maximum of 16.5 times.
In turn, the surface electric field of AgNPs entering this range can be enhanced [34]. The coupling between LSPs and SPPs depends on many conditions, such as AgNP size and position. When AgNPs are located at different positions of the evanescent field, the coupling of LSPs and SPPs is different, resulting in different electric field enhancements. Due to the periodicity of the evanescent field, the electric field enhancement of AgNPs at two typical positions of the evanescent field is analyzed, as shown in Figure 3.
In Figure 3A, due to the weak evanescent field near AgNPs, the electric field of the AgNP surface is mainly enhanced by LSPs, and the field intensity is small. On the contrary, in Figure 3B, the evanescent field around AgNPs located at z = 200 nm is almost 10 V/m seen from Figure 2, which enhances the field of AgNP surface greatly. It is noted that the double enhancement of LSPs and SPPs, resulting in a field enhancement of as high as 43.8 around the AgNPs, is almost 2 times that in Figure 3A. It can be found that the LSP mode in Figure 3B is a dipole mode, while the quadrupole mode appears in Figure 3A. It is well known that the field at higher LSP modes is smaller than the one at the dipole mode.

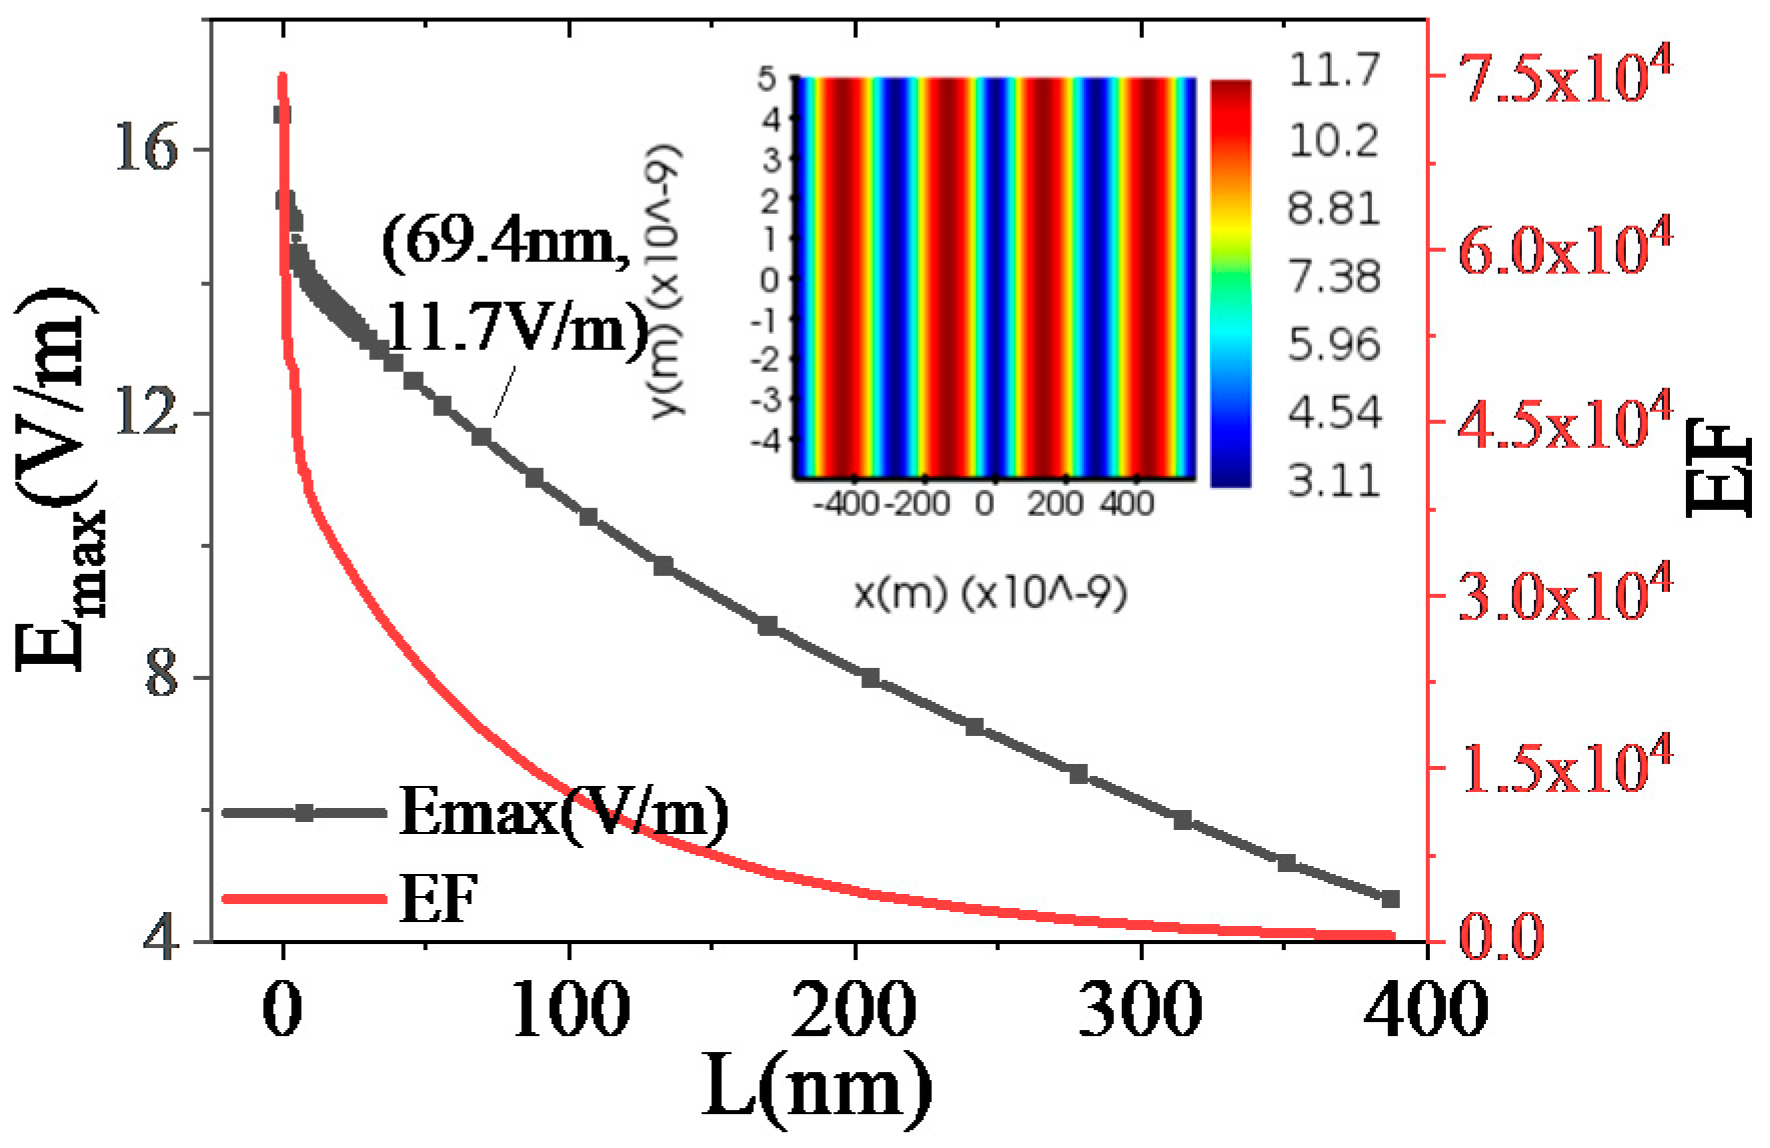
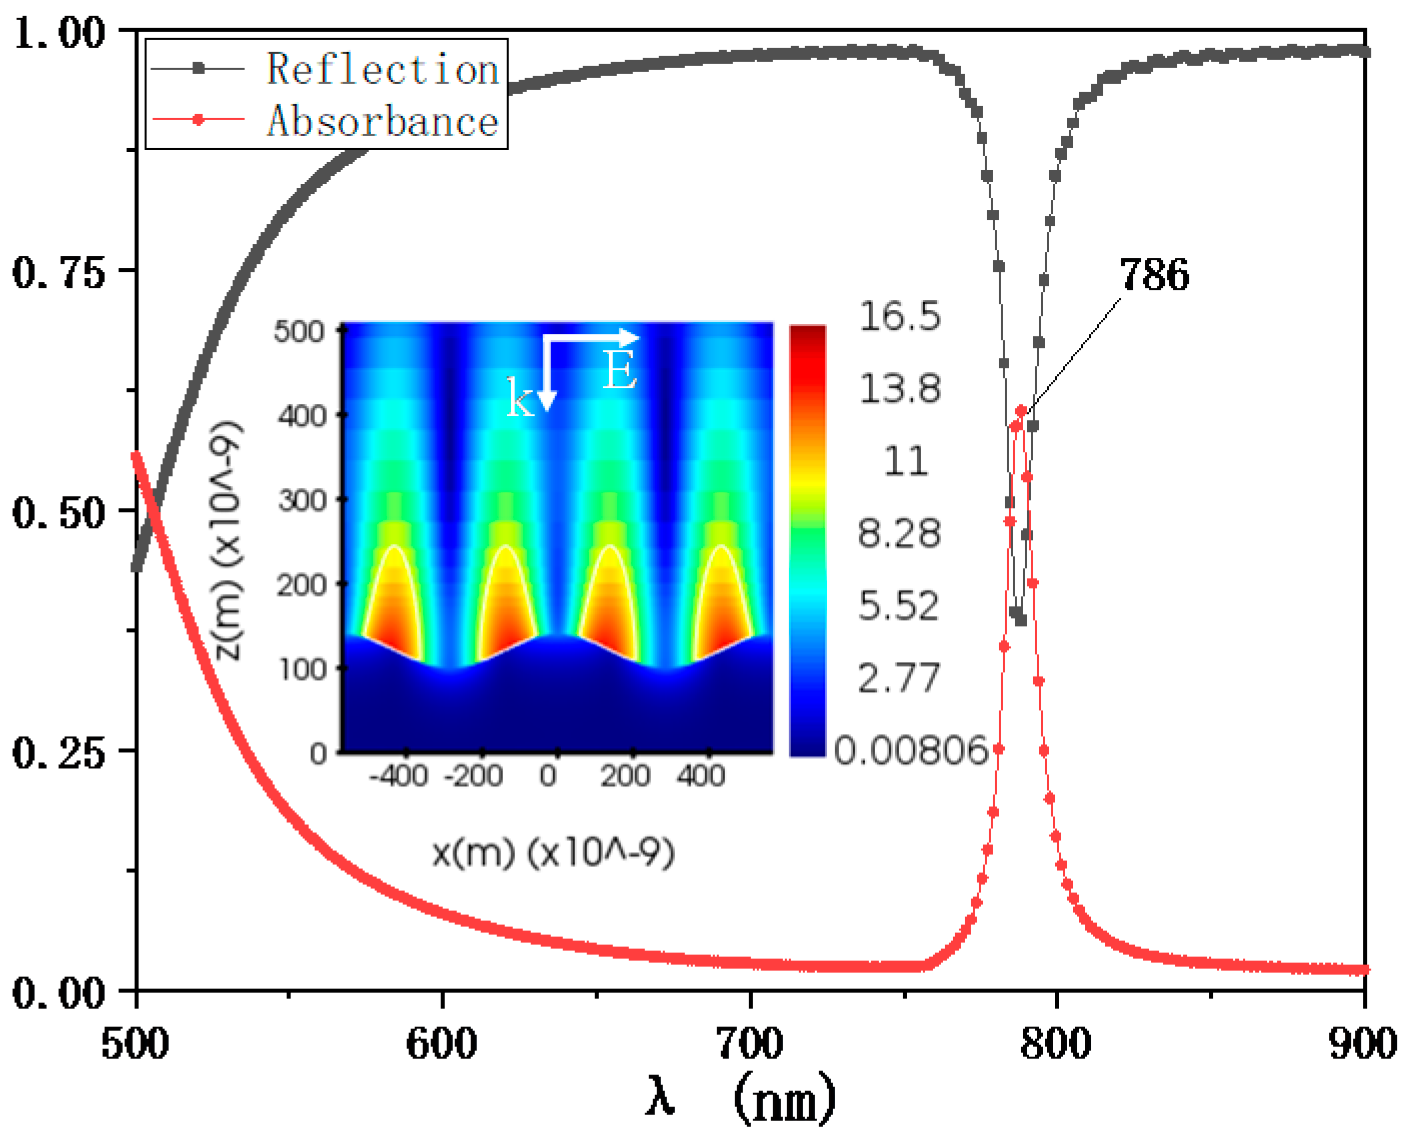
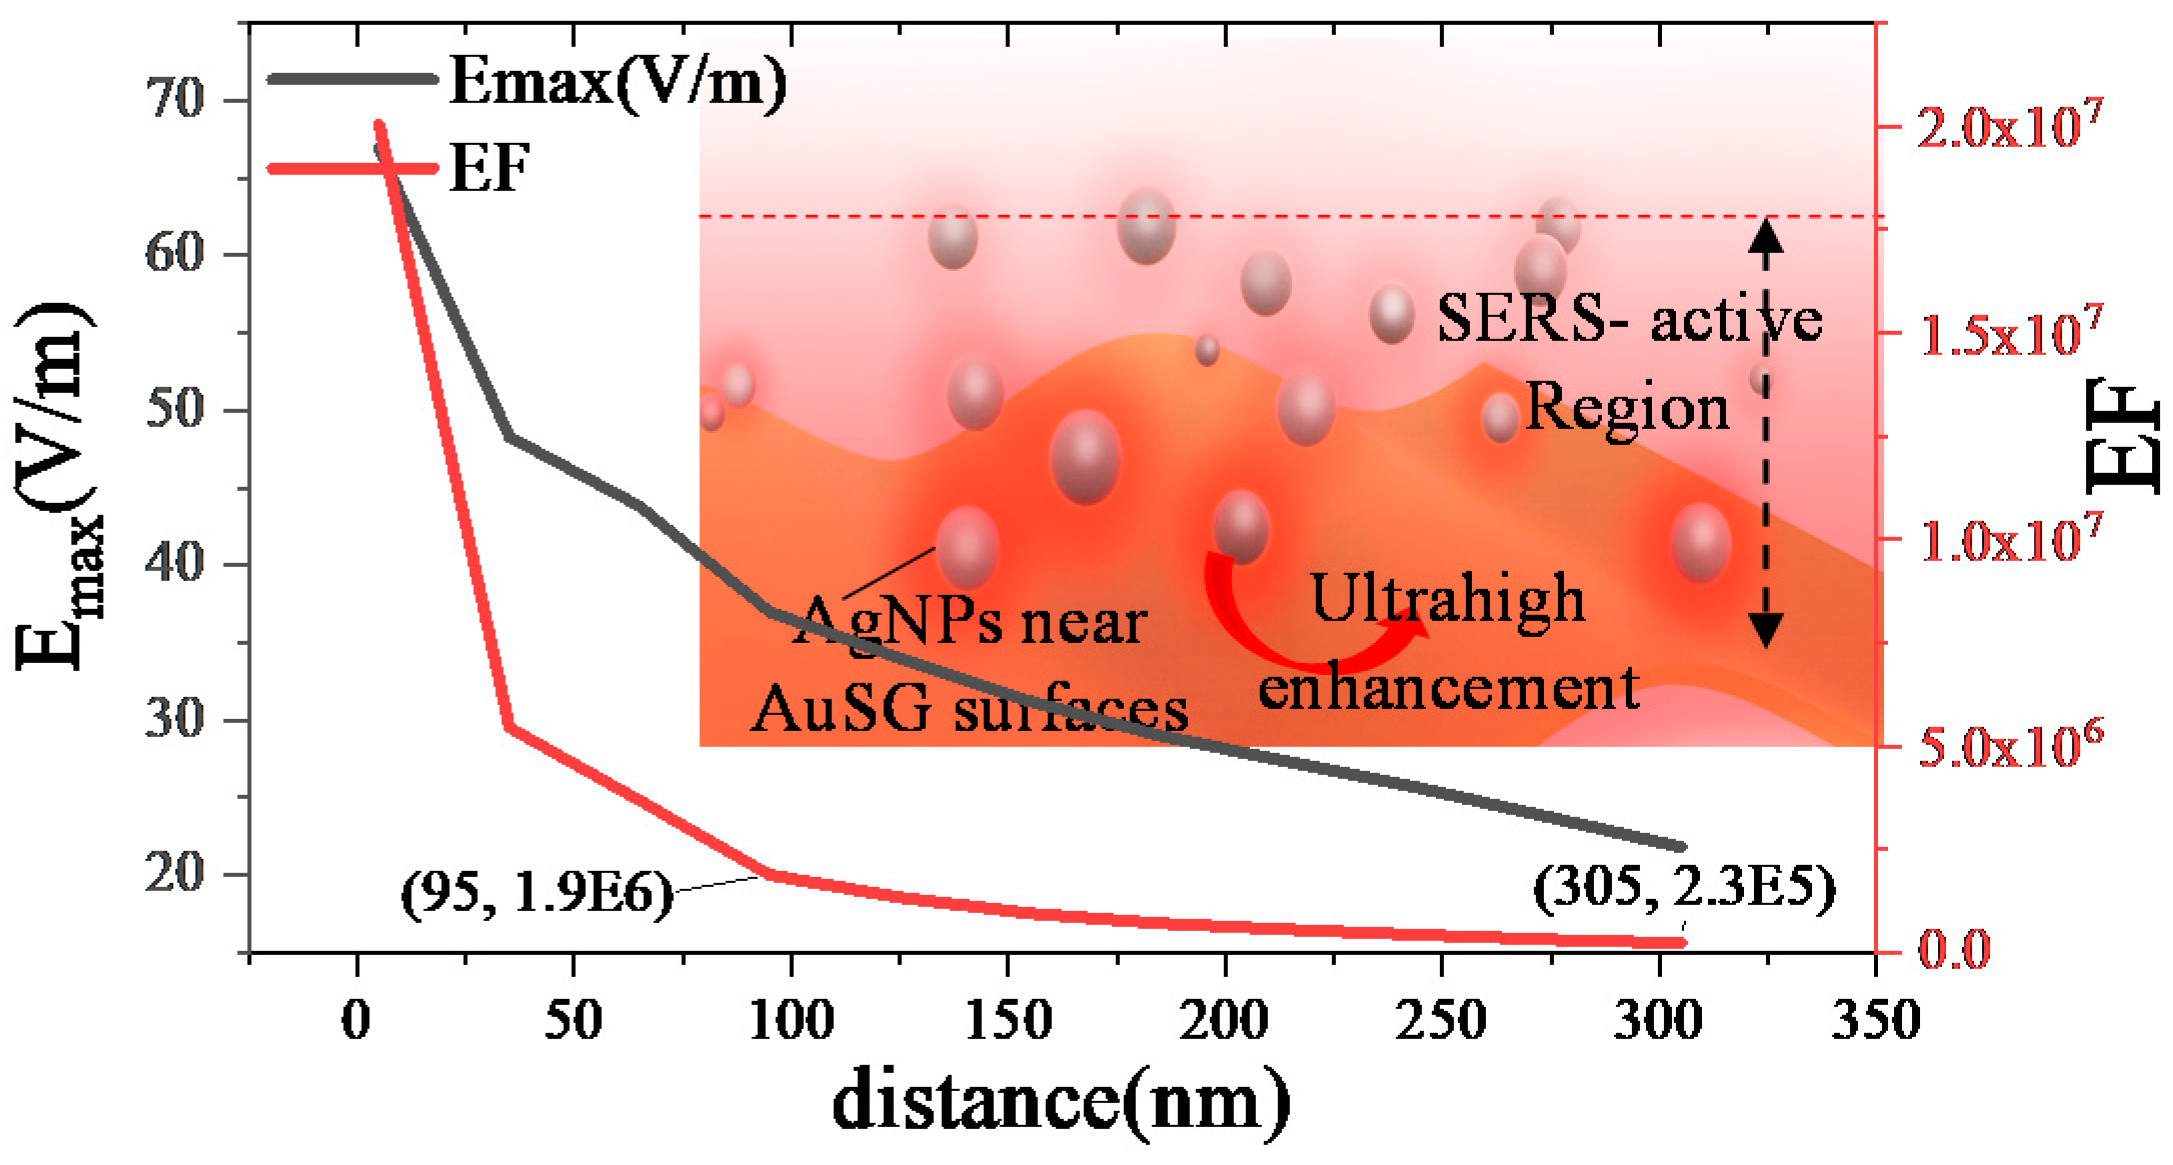
3.2. Large-Scale Field Enhancement

As an evanescent wave in the dielectric, the SPP fields fall off exponentially along the direction perpendicular to the grating surface, with the evanescent decay length of the fields calculated by Formula (2):
δ d = 1 β 2 ε d k 0 2
It is evident that δ d = 322 . 3   nm in the water at λ 0 = 785   nm by Formula (2). In other words, a wide area of the enhanced field is formed over the surface of the grating, which can further couple with the LSPs formed by AgNPs or Ag dimers in this region. The Emax and EF of x–y plane in the water away from the surface of AuSG are shown in Figure 4.
The z value of the monitoring plane (x–y plane) is continuously scanned through FDTD, and the electric field distribution of the x–y plane at different distances L is obtained. As can be seen from Figure 4, when L = 69.4 nm, the maximum electric field strength of the x–y plane can still be about 11.7 v/m. In other words, only due to the enhancement of SPPs of the AuSG, the theoretical EF reaches 104 in the range of L < 70 nm.
Combined with AgNPs, many hot spots can be formed in this area. Generally speaking, the stronger the evanescent field is, the greater the electric field enhancement on the AgNP surface may be. Due to the liquid flow, AgNPs do not always adhere to the AuSG surface, and the distance between them will vary randomly. The changing trend of the electric field enhancement of the composite substrate is further studied under the condition of changing the distance between AgNPs and AuSG.
In order to reduce the error caused by the simulation, the calculation method of the average EF of hot spots is first defined. It is well known that SERS EF can be approximately calculated as E F ( | E l o c | / | E 0 | ) 4 . According to the characteristics of the structure, considering the numerical instability of the metal surface and the scale of adsorbed molecules, the average EF of a certain area is defined as E F ¯ .
E F ¯ = ( ( | E l o c | / | E 0 | ) d v V ) 4
where E 0 = 1 V / m , is the incident electric field, E l o c = ( E x , E y , E z ) is the local electric field, and V is the volume of a certain area, that is, the range within 2 nm from the hot spot in the experiments.
In order to evaluate the enhancement capability of the composite substrate, a location with a large evanescent field on the different x-y plane is selected for analysis and simulation research. The Emax and EF as a function of the distance between AgNPs and AuSG with water medium are shown in Figure 5.
It can be obtained from Figure 5 that when the distance between AgNPs and AuSG is 5 nm, EF can reach as high as 107. Even when the distance is 95 nm, the EF reaches 106. On the contrary, when there is no AgNP, the EF at this position is only 104, as shown in Figure 4. This is because, in the larger evanescent field, SPPs can be used as the excitation source of the in-sphere LSPs, which greatly enhances the electric field intensity on the surface of AgNPs.
It is noted that in the range of less than 305 nm, the EF of the AgNP surface hot spot can be greater than 105. This wide range of electric field enhancement characteristics can greatly reduce the accuracy of the detection molecules on the substrate surface position in the SERS detection enhancement application.

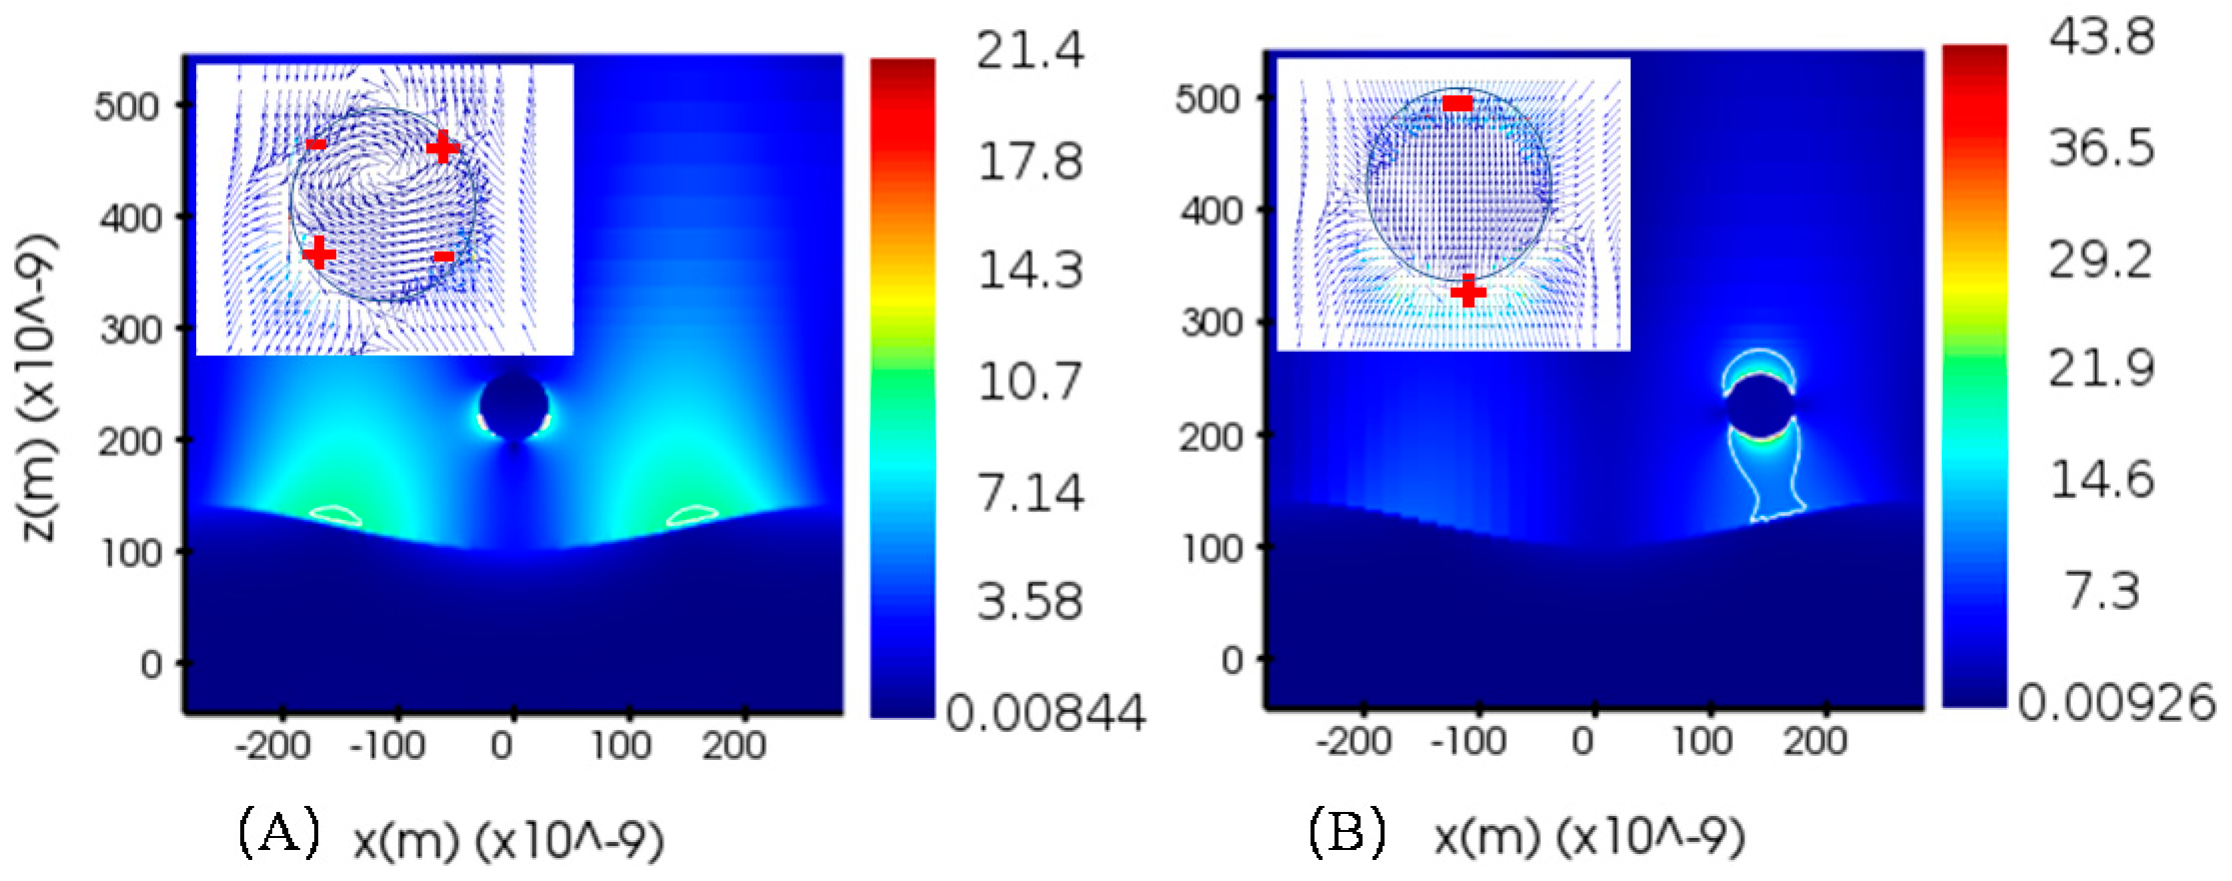
3.3. Ultra-High Field Enhancement
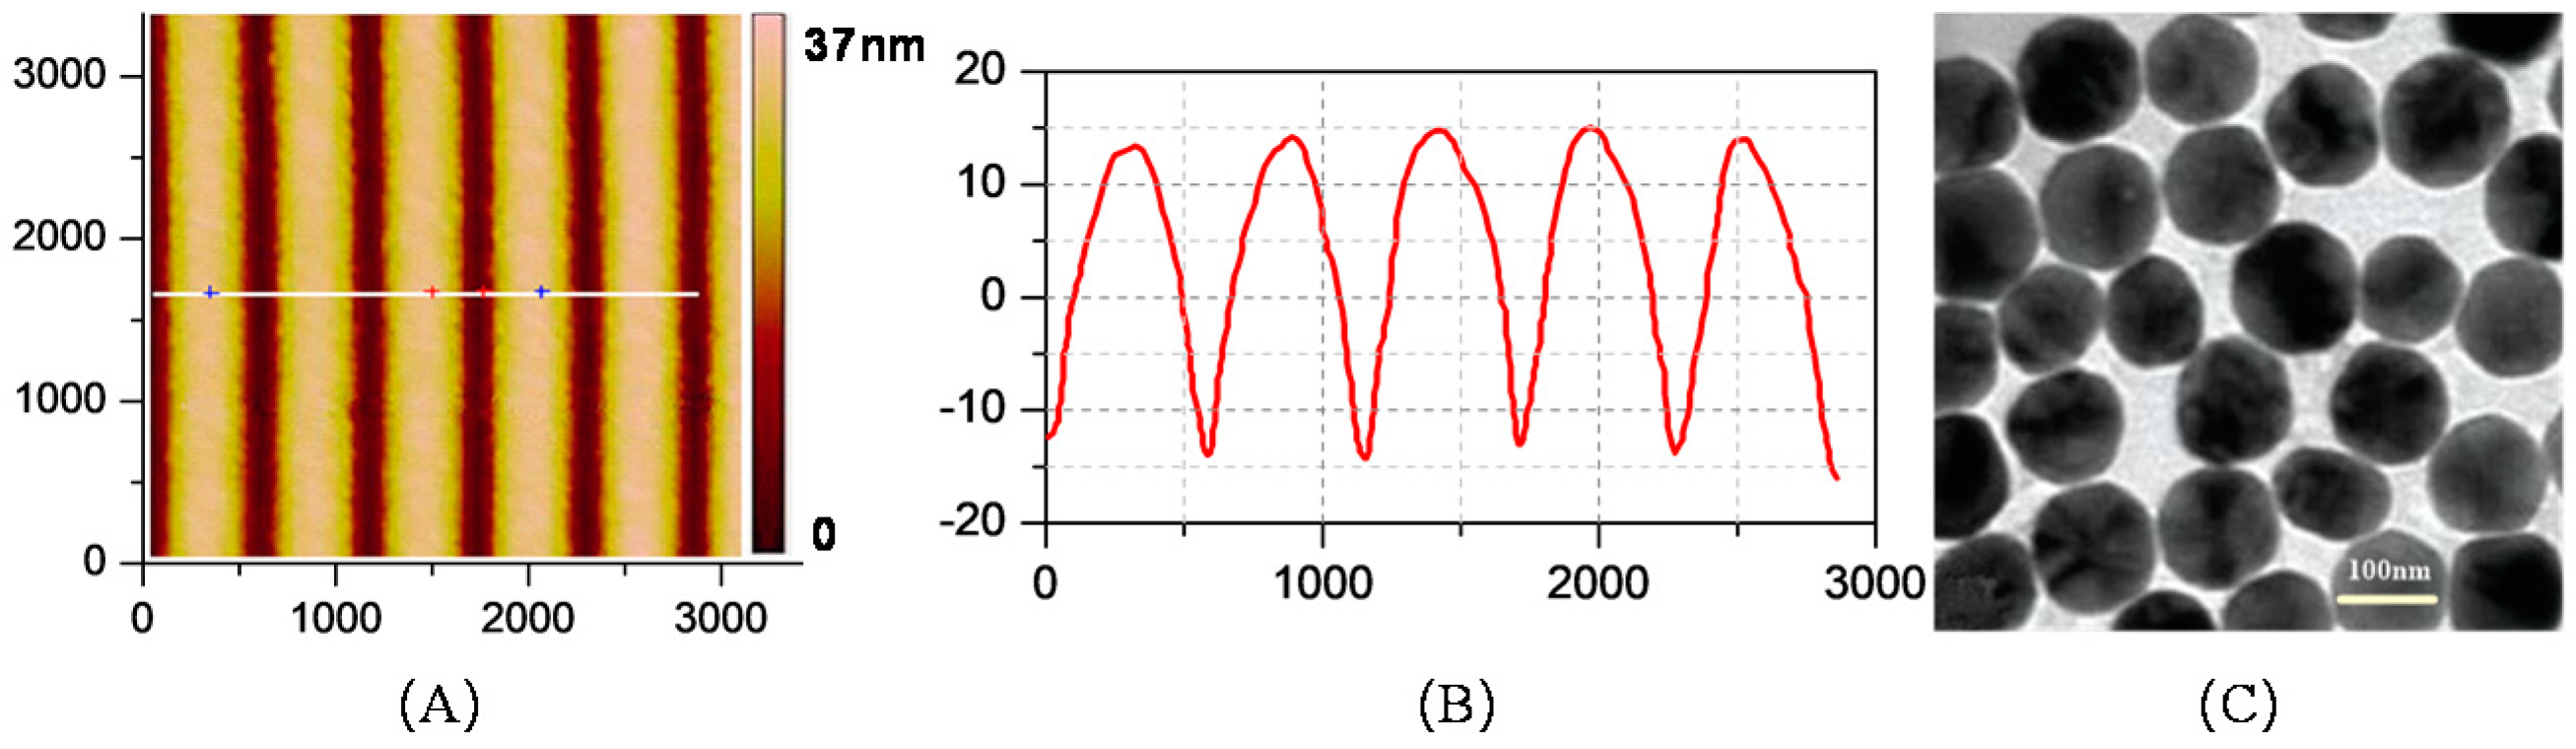
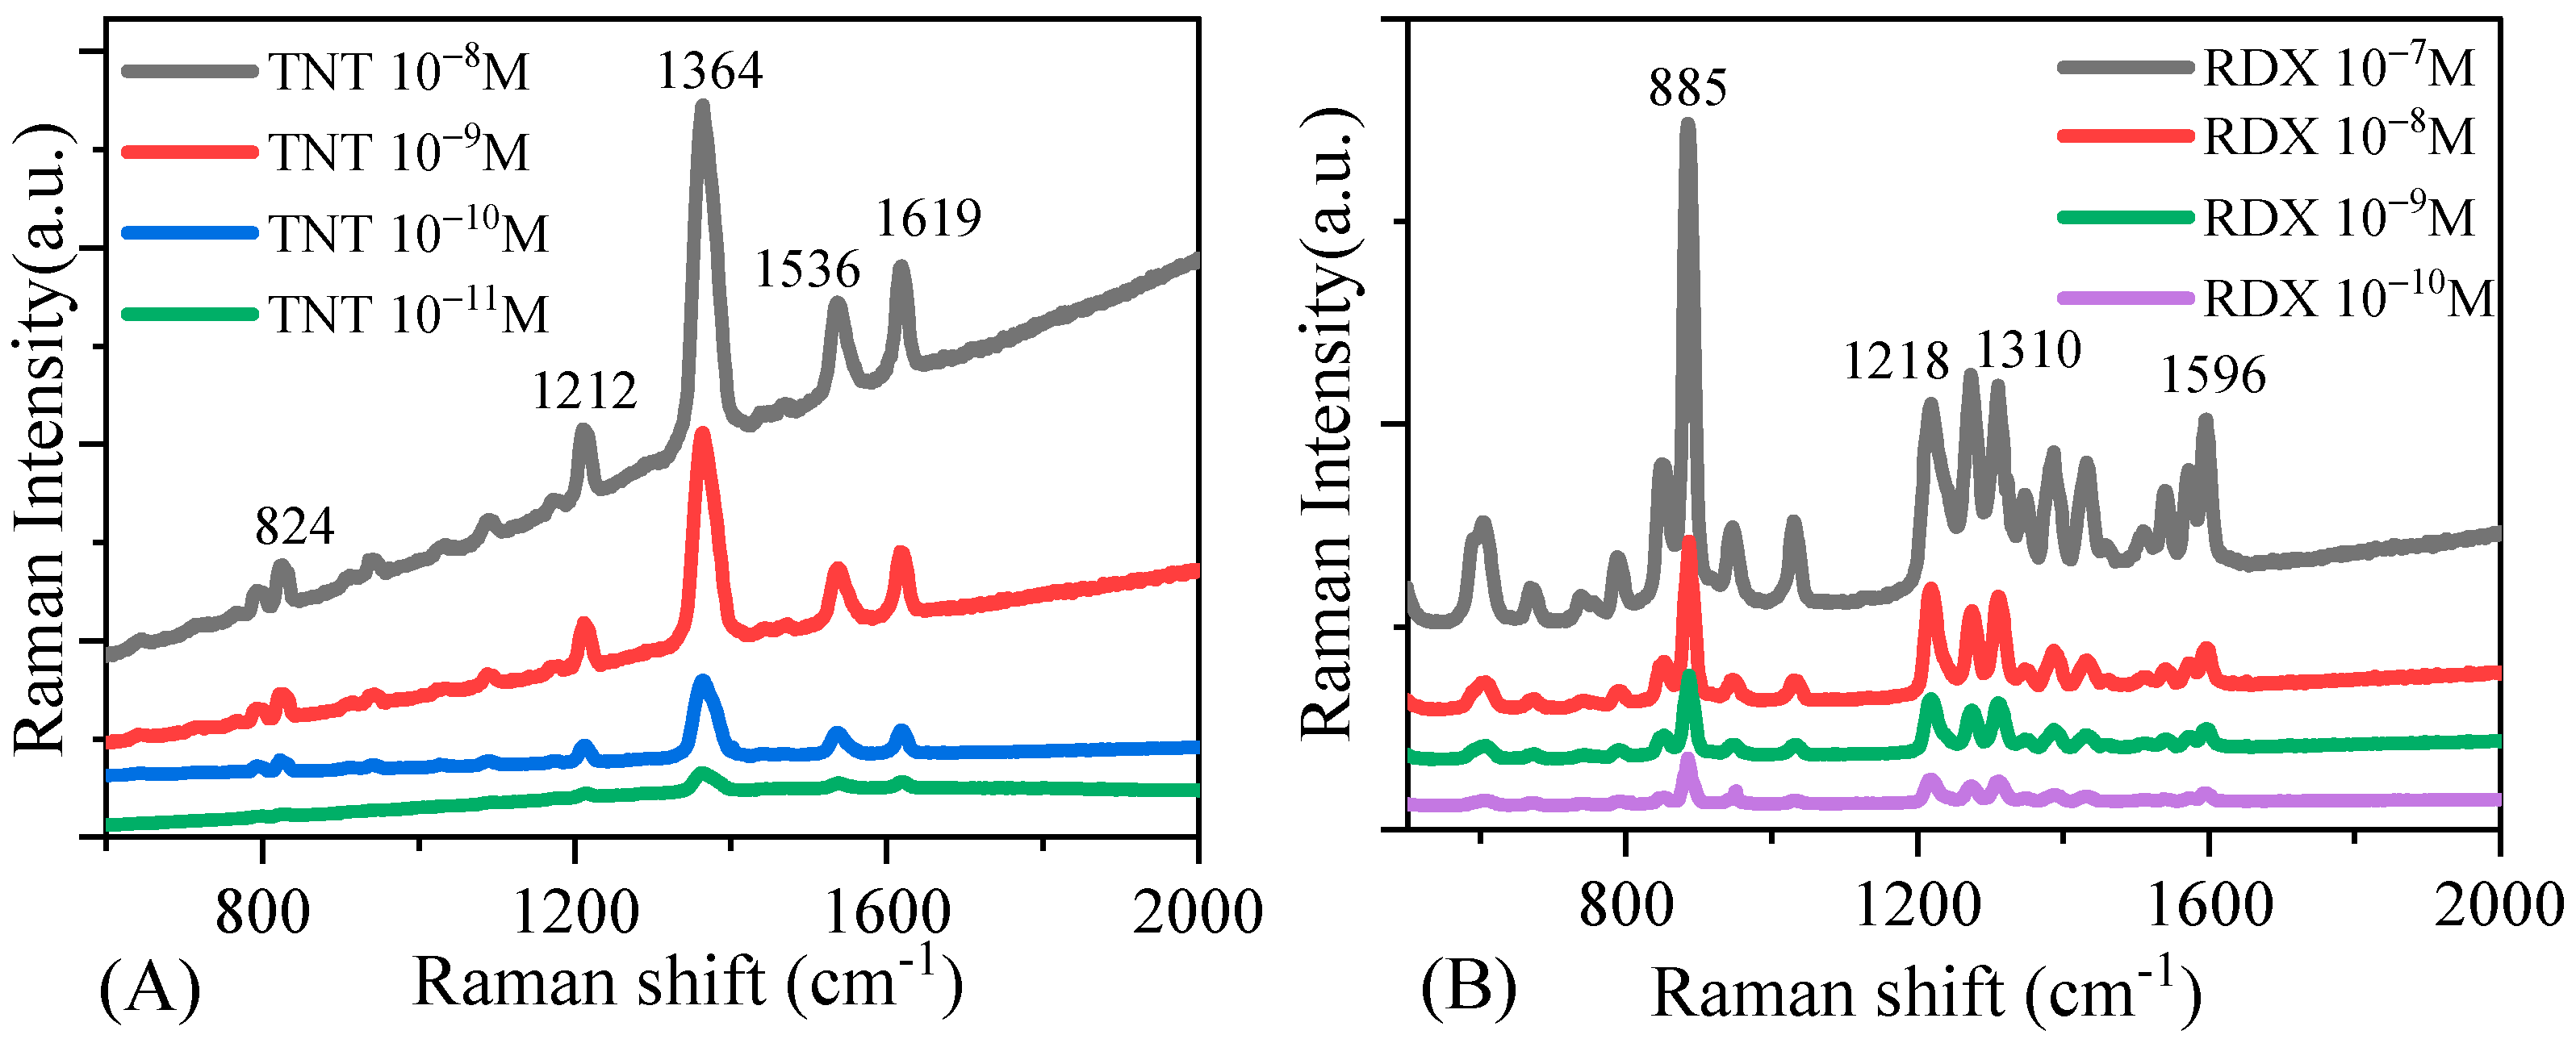
When AgNPs and AuSG are close, the nanogap between them forms a hot spot with extremely high field enhancement, and their electric coupling is similar to that of a dimer. When the distance between AgNPs and AuSG is 2 nm, the electric field distribution in the x–z plane and average EF of nanogap, that is, the hot spot, is shown in Figure 6.
SPPs can be coupled into LSPs to form an equivalent scattering source when encountering AgNPs, thereby elevating the electric fields. The average EF of the hot spot in Figure 6A is about 107, while in Figure 6B, it reaches 1010 due to the strong SPPs. In Figure 6A, a transverse dipole is formed, and electrons are concentrated on the left and right sides of the bottom of the AgNPs, forming two hot spots between the AgNPs and AuSG. In Figure 6B, the AgNPs become a longitudinal dipole affected by the strong evanescent wave, with electrons concentrate on the top and bottom surfaces, so that the EF of both the hot spot and the top region of the AgNPs are significantly elevated. When the dimer is close to AuSG, the hot spot is not only in the nanogap of AgNPs, but also in the nanogap between the dimer and AuSG. The average EF of all hot spots is greater than 108, as shown in Figure 6C. Theoretically, the composite substrate has an ultra-high electric field enhancement capability, making it possible and effective to detect trace explosives such as TNT, DNT, and RDX.
In Figure 6D, although plasmon resonance may also occur between AgNPs and Au film, and can generate hot spots with high field enhancement. But the resonance largely depends on factors such as the frequency of the incident light and the distance between AgNPs and Au film. Therefore, it is not easy to obtain a large electric field enhancement at a specific frequency, such as 785 nm. On the contrary, no matter how AgNPs flow, the composite substrate composed of AgNPs and AuSG can achieve a high electric field enhancement of 785 nm, which is close to the resonance wavelength of SPPs.

3.4. Experiment

In order to test the trace level explosives detection performance of the composite substrate and verify the simulation results, SERS detection of low concentration TNT and RDX solution samples is carried out.
The designed AuSG can be realized experimentally by the following procedures: Firstly, a positive photoresist (PR; NOA-63) is spin-coated on an SiO2 substrate. Secondly, the AuSG with a periodicity of about 570 nm is fabricated by laser interference lithography (LIL; Coherent MBD-266, a wavelength of 266 nm and a power of 30 mW) [35]. The amplitude and periodicity of AuSG can be flexibly adjusted and controlled by changing the time and angle of LIL. Then, the Au layer (about 120 nm) is deposited through evaporation at a rate of 0.1 nm/s. The AgNPs with a diameter of about 60–110 nm are prepared by the procedure described in Ref. [36]. The Atomic Force Microscope (AFM) image of the surface morphology of the grating and the Transmission Electron Microscope (TEM) image of AgNPs colloids are shown in Figure 7.
TNT and RDX solution samples with low concentrations are prepared, and then added to the composite substrate. In the experiment, Ocean Optics Laser-785 is used as the excitation laser, and SERS signal is measured with a Raman fiber optic probe (Inphotonics RPB, 200 µm collection fibers) and a Raman spectrometer (Ocean Optics QE Pro). The spot size of the excitation laser is about 200 μm at the focus point of the Raman probe. The SERS spectra of TNT and RDX are collected and the average values of Raman signal intensities from 600 to 2000 cm−1 are shown in Figure 8.
It can be found that when the concentration of TNT solution is 10−8 M, there are some strong Raman characteristic peaks of the TNT molecule SERS spectrum, which are 824 cm−1 (NO2 scissoring vibration), 1212 cm−1 (C-H ring bend and in-plane rocking), 1364 cm−1 (NO2 symmetric stretching), 1536 cm−1 (NO2 asymmetric stretching), and 1619 cm−1 (2,6-NO2, asymmetric ring stretching) [37], in Figure 8A. That is to say, the main Raman vibrations of TNT at those Raman shifts, are obviously enhanced and can be easily detected. However, when the concentration of the TNT solution drops to 10−11 mol/L, the Raman signal intensity of TNT is so weak that Raman characteristic peaks can hardly be found. The characteristic RDX bands at 885 cm−1 (C-N-C ring breathing mode), 1218 cm−1 (N-C stretching), and 1310 cm−1 (CH2 twisting, N-N stretching vibration) are also present in the SERS spectra down to a solution sample as low as 10−10 M, as shown in Figure 8B. From Figure 8, the experimental results indicate that the limit concentration of TNT and RDX solutions for SERS detection can reach 10−10 M. These results also confirm that the explosives materials have very distinct and identifiable SERS bands that can be measured using the composite SERS substrates.
Under experimental conditions, the analytical enhancement factor (AEF) can be calculated by:
A E F = I S E R S / C S E R S I R S / C R S
where I S E R S and C S E R S are the Raman signal intensity and trace explosives concentration from composite SERS substrate, while I R S and C R S are the Raman signal intensity and trace explosives concentration from non-SERS substrate, respectively. It can be seen from Figure 8 that the symmetrical nitro stretching at 1364 cm−1 is the strongest band of TNT, and the C-N-C ring breathing at 885 cm−1 is the strongest band of RDX, which can be used to estimate the AEF [37]. For the non-SERS substrate, the trace explosives concentration is 0.1 M. The AEF of the composite SERS substrate is about 5.3 × 10⁸ at 1364 cm−1 for TNT with a concentration of 10−8 M, and is 1.2 × 10⁸ at 885 cm−1 for RDX with a concentration of 10−8 M. The AEF is not as large as the maximum EF of simulation. One of the reasons may be the random distribution of explosive molecules and AgNPs in the fluid. Raman signals of not all molecules are strongly enhanced by the electromagnetic coupling effect between AgNPs and AuSG. The AEF critically depends on the availability of the number of hotspots, the analyte molecule adsorption, the orientation of molecules on the AgNP surface, and the excitation wavelength. We are investigating how to capture analytes through surface-grafted agents (such as 4-Aminothiophenol) or metal–organic-frameworks (such as ZIF-8), and localize them on the surface of flowing AgNPs to improve SERS performance.

4. Conclusions

In this paper, a composite SERS substrate consisting of gold sinusoidal nano-grating and silver colloidal nanoparticles was proposed and studied. The substrate can be fabrication-friendly for large areas only when double laser interferometric lithography and hot evaporation are used. Due to SPPs and LSPs, the composite substrate had a large-scale ultrahigh field enhancement, with EF reaching up to 10 orders of magnitude, verified by the numerical simulations. The experiment results show that the substrate had an LOD of 10−10 mol/L in the detection of both explosives TNT and RDX. Combined with microfluidic technology, we are confident that the composite SERS substrate has a great potential for real-time, continuous detection of trace explosives in the future.

Author Contributions

Writing-original draft preparation, Z.C. (Zhaoyi Chen); writing-review and editing, K.F.; Experiment, Z.C. (Zhibin Chen); methodology, H.L.; software, J.S. All authors have read and agreed to the published version of the manuscript.

Funding

This research was funded by National Defense Science Technology Project Fund (2004053).

Institutional Review Board Statement

Not applicable.

Informed Consent Statement

Not applicable.

Data Availability Statement

The data that support the findings of this study are available from the corresponding author upon reasonable request.

Conflicts of Interest

The authors declare no conflict of interest.

References

  1. Cao, Y.W.C.; Jin, R.; Mirkin, C.A. Nanoparticles with Raman spectroscopic fingerprints for DNA and RNA detection. Science 2002, 297, 1536–1540. [Google Scholar] [CrossRef] [PubMed] [Green Version]
  2. Zhang, C.; Man, B.Y.; Jiang, S.Z.; Yang, C.; Liu, M.; Chen, C.S.; Li, Z. SERS detection of low-concentration adenosine by silver nanoparticles on silicon nanoporous pyramid arrays structure. Appl. Surf. Sci. 2015, 347, 668–672. [Google Scholar] [CrossRef]
  3. Xu, J.; Li, C.; Si, H.; Zhao, X.; Wang, L.; Jiang, S.; Zhang, C. 3D SERS substrate based on Au-Ag bi-metal nanoparticles/MoS2 hybrid with pyramid structure. Opt. Express 2018, 26, 21546–21557. [Google Scholar] [CrossRef] [PubMed]
  4. Li, C.; Yu, J.; Xu, S.; Jiang, S.; Xiu, X.; Chen, C.; Zhang, C. Constructing 3D and Flexible Plasmonic Structure for High-Performance SERS Application. Adv. Mater. Technol. 2018, 3, 1800174. [Google Scholar] [CrossRef]
  5. Ma, P.; Liang, F.; Diao, Q.; Wang, D.; Yang, Q.; Gao, D.; Wang, X. Selective and sensitive SERS sensor for detection of Hg2+ in environmental water base on rhodamine-bonded and amino group functionalized SiO2-coated Au-Ag core-shell nanorods. RSC Adv. 2015, 5, 32168–32174. [Google Scholar] [CrossRef]
  6. Li, J.F.; Anema, J.R.; Wandlowski, T.; Tian, Z.Q. Dielectric shell isolated and graphene shell isolated nanoparticle enhanced Raman spectroscopies and their applications. Chem. Soc. Rev. 2015, 44, 8399–8409. [Google Scholar] [CrossRef] [Green Version]
  7. Li, C.; Xu, S.; Yu, J.; Li, Z.; Li, W.; Wang, J.; Zhang, C. Local hot charge density regulation: Vibration-free pyroelectric nanogenerator for effectively enhancing catalysis and in-situ surface enhanced Raman scattering monitoring. Nano Energy 2021, 81, 105585. [Google Scholar] [CrossRef]
  8. Zhao, X.; Liu, C.; Yu, J.; Li, Z.; Liu, L.; Li, C.; Zhang, C. Hydrophobic multiscale cavities for high-performance and self-cleaning surface-enhanced Raman spectroscopy (SERS) sensing. Nanophotonics 2020, 9, 4761–4773. [Google Scholar] [CrossRef]
  9. Tao, A.; Sinsermsuksakul, P.; Yang, P. Tunable plasmonic lattices of silver nanocrystals. Nat. Nanotechnol. 2007, 2, 435–440. [Google Scholar] [CrossRef] [Green Version]
  10. Cho, H.; Lee, B.; Liu, G.L.; Agarwal, A.; Lee, L.P. Label-free and highly sensitive biomolecular detection using SERS and electrokinetic preconcentration. Lab Chip 2009, 9, 3360–3363. [Google Scholar] [CrossRef]
  11. Qian, L.; Das, B.; Li, Y.; Yang, Z. Giant Raman enhancement on nanoporous gold film by conjugating with nanoparticles for single-molecule detection. J. Mater. Chem. 2010, 20, 6891–6895. [Google Scholar] [CrossRef] [Green Version]
  12. Ardini, M.; Huang, J.A.; Sanchez-Sanchez, C.; Ponzellini, P.; Maccaferri, N.; Jacassi, A.; Garoli, D. Nanoporous gold decorated with silver nanoparticles as large area efficient SERS substrate. In Proceedings of the SPIE Nanoscience + Engineering, San Diego, CA, USA, 25 August 2017. [Google Scholar]
  13. Kalachyova, Y.; Mares, D.; Jerabek, V.; Zaruba, K.; Ulbrich, P.; Lapcak, L.; Lyutakov, O. The Effect of Silver Grating and Nanoparticles Grafting for LSP–SPP Coupling and SERS Response Intensification. J. Phys. Chem. C 2016, 120, 10569–10577. [Google Scholar] [CrossRef]
  14. Burtsev, V.; Miliutina, E.; Erzina, M.; Kalachyova, Y.; Elashnikov, R.; Svorcik, V.; Lyutakov, O. Advanced Design of Microfluidic Chip Based on SPP-LSP Plasmonic Coupling for SERS Detection with High Sensitivity and Reliability. J. Phys. Chem. C 2019, 123, 30492–30498. [Google Scholar] [CrossRef]
  15. Li, Y.; Kang, M.; Shi, J.; Wu, K.; Zhang, S.; Xu, H. Transversely Divergent Second Harmonic Generation by Surface Plasmon Polaritons on Single Metallic Nanowires. Nano Lett. 2017, 17, 7803–7808. [Google Scholar] [CrossRef] [PubMed]
  16. Ding, S.Y.; You, E.M.; Tian, Z.Q.; Moskovits, M. Electromagnetic theories of surface-enhanced Raman spectroscopy. Chem. Soc. Rev. 2017, 46, 4042–4076. [Google Scholar] [CrossRef]
  17. Li, A.; Isaacs, S.; Abdulhalim, I.; Li, S. Ultrahigh Enhancement of Electromagnetic Fields by Exciting Localized with Extended Surface Plasmons. J. Phys. Chem. C 2015, 119, 19382–19389. [Google Scholar] [CrossRef] [Green Version]
  18. Yoon, J.K.; Kim, K.; Shin, K.S. Raman Scattering of 4-Aminobenzenethiol Sandwiched between Au Nanoparticles and a Macroscopically Smooth Au Substrate: Effect of Size of Au Nanoparticles. J. Phys. Chem. C 2009, 113, 1769–1774. [Google Scholar] [CrossRef]
  19. Maurer, T.; Adam, P.-M.; Lévêque, G. Coupling between plasmonic films and nanostructures: From basics to applications. Nanophotonics 2015, 4, 363–382. [Google Scholar] [CrossRef]
  20. Tserkezis, C.; Esteban, R.; Sigle, D.O.; Mertens, J.; Herrmann, L.O.; Baumberg, J.J.; Aizpurua, J. Hybridization of plasmonic antenna and cavity modes: Extreme optics of nanoparticle-on-mirror nanogaps. Phys. Rev. A 2015, 92, 053811. [Google Scholar] [CrossRef] [Green Version]
  21. Li, A.; Srivastava, S.K.; Abdulhalim, I.; Li, S. Engineering the hot spots in squared arrays of gold nanoparticles on a silver film. Nanoscale 2016, 8, 15658–15664. [Google Scholar] [CrossRef] [Green Version]
  22. Koya, A.N.; Zhu, X.; Ohannesian, N.; Yanik, A.A.; Alabastri, A.; Proietti Zaccaria, R.; Garoli, D. Nanoporous Metals: From Plasmonic Properties to Applications in Enhanced Spectroscopy and Photocatalysis. ACS Nano 2021, 15, 6038–6060. [Google Scholar] [CrossRef]
  23. Jahn, I.J.; Žukovskaja, O.; Zheng, X.S.; Weber, K.; Bocklitz, T.W.; Cialla-May, D.; Popp, J. Surface-enhanced Raman spectroscopy and microfluidic platforms: Challenges, solutions and potential applications. Analyst 2017, 142, 1022–1047. [Google Scholar] [CrossRef]
  24. Sil, S.; Chaturvedi, D.; Krishnappa, K.B.; Kumar, S.; Asthana, S.N.; Umapathy, S. Density Functional Theoretical Modeling, Electrostatic Surface Potential and Surface Enhanced Raman Spectroscopic Studies on Biosynthesized Silver Nanoparticles: Observation of 400 pM Sensitivity to Explosives. J. Phys. Chem. A 2014, 118, 2904–2914. [Google Scholar] [CrossRef]
  25. Nordlander, P.; Oubre, C.; Prodan, E.; Li, K.; Stockman, M.I. Plasmon hybridizaton in nanoparticle dimers. Nano Lett. 2004, 4, 899–903. [Google Scholar] [CrossRef]
  26. Törmä, P.; Barnes, W.L. Strong coupling between surface plasmon polaritons and emitters: A review. Rep. Prog. Phys. 2014, 78, 013901. [Google Scholar] [CrossRef] [PubMed]
  27. Abutoama, M.; Li, S.Z.; Abdulhalim, I. Widening the Spectral Range of Ultrahigh Field Enhancement by Efficient Coupling of Localized to Extended Plasmons and Cavity Resonances in Grating Geometry. J. Phys. Chem. C 2017, 121, 27612–27623. [Google Scholar] [CrossRef]
  28. Lakowicz, J.R. Plasmonics in biology and plasmon-controlled fluorescence. Plasmonics 2006, 1, 5–33. [Google Scholar] [CrossRef] [PubMed]
  29. El-Gohary, S.H.; Eom, S.; Lee, S.Y.; Byun, K.M. Dispersion curve-based sensitivity engineering for enhanced surface plasmon resonance detection. Opt. Commun. 2016, 370, 299–305. [Google Scholar] [CrossRef]
  30. Xu, B.B.; Ma, Z.C.; Wang, H.; Liu, X.Q.; Zhang, Y.L.; Zhang, X.L.; Sun, H.B. A SERS-active microfluidic device with tunable surface plasmon resonances. Electrophoresis 2011, 32, 3378–3384. [Google Scholar] [CrossRef]
  31. McPeak, K.M.; Jayanti, S.V.; Kress, S.J.; Meyer, S.; Iotti, S.; Rossinelli, A.; Norris, D.J. Plasmonic Films Can Easily Be Better: Rules and Recipes. ACS Photonics 2015, 2, 326–333. [Google Scholar] [CrossRef]
  32. Xiao, C.; Chen, Z.B.; Qin, M.Z.; Zhang, D.X.; Wu, H. SERS polarization-independent performance of two-dimensional sinusoidal silver grating. Appl. Phys. Lett. 2018, 113, 5. [Google Scholar] [CrossRef]
  33. Guselnikova, O.; Postnikov, P.; Kalachyova, Y.; Kolska, Z.; Libansky, M.; Zima, J.; Lyutakov, O. Large-Scale, Ultrasensitive, Highly Reproducible and Reusable Smart SERS Platform Based on PNIPAm-Grafted Gold Grating. ChemNanoMat 2017, 3, 135–144. [Google Scholar] [CrossRef]
  34. Abutoama, M.; Isaacs, S.; Ney, M.; Zhong, L.; Li, D.; Jiang, L.; Abdulhalim, I. Ultrahigh Field Enhancement Optimization Versus Rabi Splitting Investigated Using Au Nano-Bipyramids on Metal Films. J. Phys. Chem. C 2019, 123, 12984–12996. [Google Scholar] [CrossRef]
  35. Liu, B.; Tang, C.; Chen, J.; Yan, Z.; Zhu, M.; Sui, Y.; Tang, H. The Coupling Effects of Surface Plasmon Polaritons and Magnetic Dipole Resonances in Metamaterials. Nanoscale Res. Lett. 2017, 25, 12061–12068. [Google Scholar] [CrossRef]
  36. Huang, Y.; Liu, W.; Gong, Z.; Wu, W.; Fan, M.; Wang, D.; Brolo, A.G. Detection of Buried Explosives Using a Surface-Enhanced Raman Scattering (SERS) Substrate Tailored for Miniaturized Spectrometers. ACS Sens. 2020, 5, 2933–2939. [Google Scholar] [CrossRef]
  37. Jerez-Rozo, J.I.; Primera-Pedrozo, O.M.; Barreto-Caban, M.A.; Hernandez-Rivera, S.P. Enhanced Raman scattering of 2,4,6-TNT using metallic colloids. IEEE Sens. J. 2008, 8, 974–982. [Google Scholar] [CrossRef]
Figure 1. Schematic diagram of the composite SERS substrate.
Photonics 08 00415 g001
Figure 2. Reflection and absorbance spectra of AuSG as a function of excitation light wavelength. The subplot is the electric field distribution of the x–z plane (y = 0) at an SPP resonance wavelength of 786 nm. The Λ , amplitude, and thickness of AuSG are 570 nm, 20 nm, and 120 nm, respectively.
Photonics 08 00415 g002
Figure 3. The electric field distribution in the x–z plane (y = 0) at the resonance wavelength of SPPs at 786 nm, where AgNP is located at z = 200 nm. The area enclosed by the white curve represents an electric field greater than 10 V/m. The subplots are the Energy flux.
Photonics 08 00415 g003
Figure 4. Emax and EF on the x–y plane in water as a function of the distance L from AuSG. The subplot is the electric intensity distribution of x–y plane at L = 69.4 nm, that is, z = 200 nm.
Photonics 08 00415 g004
Figure 5. Emax and EF as a function of the distance between AgNPs and AuSG with water medium. The distance is from 5 nm to 305 nm. The subplot is the schematic of electric field enhancement.
Photonics 08 00415 g005
Figure 6. Electric field distribution and EF at resonance wavelength when the distance between AgNPs and AuSG or Au film is 2 nm; (A,B) AgNPs on AuSG; (C) AgNP dimer on AuSG. The gap of the dimer is also 2 nm. (D) AgNPs on Au film. The thickness of the film is 120 nm, and the incident light wavelength is about 573 nm.
Photonics 08 00415 g006
Figure 7. (A) Top-view AFM image of AuSG with a periodicity of about 570 nm; (B) surface profile scan of the AuSG; (C) TEM image of AgNPs.
Photonics 08 00415 g007
Figure 8. Example SERS spectra of (A) TNT; (B) RDX.
Photonics 08 00415 g008
Publisher’s Note: MDPI stays neutral with regard to jurisdictional claims in published maps and institutional affiliations.

