Article

Statistical Model and Performance Analysis of a Novel Multilevel Polarization Modulation in Local “Twisted” Fibers

by
Pierluigi Perrone
*,
Silvello Betti
and
Giuseppe Giulio Rutigliano
Department of Electronics Engineering, University of Rome “Tor Vergata”, Via del Politecnico 1, 00133 Rome, Italy
*
Author to whom correspondence should be addressed.
Photonics 2017, 4(1), 5; https://doi.org/10.3390/photonics4010005
Submission received: 6 November 2016 / Revised: 20 January 2017 / Accepted: 20 January 2017 / Published: 26 January 2017
(This article belongs to the Special Issue Optical Networks for Communications)

Abstract

:
Transmission demand continues to grow and higher capacity optical communication systems are required to economically meet this ever-increasing need for communication services. This article expands and deepens the study of a novel optical communication system for high-capacity Local Area Networks (LANs), based on twisted optical fibers. The complete statistical behavior of this system is shown, designed for more efficient use of the fiber single-channel capacity by adopting an unconventional multilevel polarization modulation (called “bands of polarization”). Starting from simulative results, a possible reference mathematical model is proposed. Finally, the system performance is analyzed in the presence of shot-noise (coherent detection) or thermal noise (direct detection).

1. Introduction

The optical fiber constitutes the optimal communication channel for its efficiency, capacity, and transmission rate. It forms the high-capacity transport infrastructure that enables global broadband data services and advanced Internet applications. For this reason, countless studies have focused their attention on how it could be possible to exploit all the characteristics of this medium in terms of the transmission capacity. As it often happens, certain features, initially considered as drawbacks, can be revealed to have advantages.
One of these natural characteristics of the optical fiber is the birefringence. It has been widely studied, especially for the negative effects that it causes, such as the PMD (Polarization Mode Dispersion). It is important to distinguish between linear and circular birefringence. Linear birefringence has several origins: bending, geometrical imperfections, and stress-induced anisotropies. All of them act randomly along optical fibers. Circular birefringence may be generated, instead, by an external magnetic field aligned with the axis of propagation, or by twisting the fiber itself [1,2]. Basic models of the optical fiber birefringence have been described in [3,4]. These works only take into account the linear birefringence, neglecting the circular one. This approach is justified by the fact that in most of the fibers used in optical communications, circular birefringence can be considered negligible. A successive work [5] focused on the development of a complete model of the birefringence that also included the circular component. In this general model, during the production phase, a twisting process of the fiber generates an induced circular birefringence. This production process has the advantage of a PMD decrease [6]. Another advantage of twisted fiber is the opportunity to better exploit the multilevel polarization modulations.
The multilevel polarization modulations (M-PolSK—Multilevel-Polarization Shift Keying) exploit the additional degrees of freedom provided by the use of the State of Polarization (SOP) of a fully polarized light wave as a “modulation parameter” in a three-dimensional [7] and a four-dimensional Euclidean space [8]. Birefringence causes SOP changes during the propagation of the signal along the optical fiber. Therefore, M-PolSK modulations, despite a better exploitation of the single channel bandwidth [9], require a complex receiver, able to track the birefringence for the correct estimation of the transmitted symbols. In [10] it is shown that by applying a novel M-PolSK modulation in a twisted fiber, it is possible to confine the SOP evolution of the transmitted symbols within specific physical “polarization bands” (on the surface of the Poincaré sphere). In this way, at the receiver end, there is no need to implement a complex mechanism for tracking the birefringence because it is sufficient to identify the band of polarization of the received SOP to estimate the transmitted symbol. This modulation also offers the advantage of a “fluid” constellation of symbols that no longer need to belong to a rigid geometric structure. The advantage of a “fluid” constellation lies in the fact that the decision regions may be associated directly with physical regions. The structure of the constellation is such that the modulator must only change the value of the S3 component. The drawback is the presence of a limited number of polarization bands (physical tracks), conditioned by the twisting process that is possible to be introduced in the optical fiber. Moreover, the performance of the proposed system is compatible with those systems with a similar number of symbols, but with the advantage of a simpler receiver structure.
This paper, starting from the model proposed in [10], analyzes the statistical properties of this novel multilevel polarization modulation for twisted fibers that can be used in a Local Area Network (LAN) environment. In fact, the proposed system would fit the LAN environment very well, such as the systems mentioned in [11,12]. In this case, the advantage is not related to the growth of the total throughput, but rather to the complexity reduction of the transmitter and receiver. Moreover, a mathematical model [13] for the evolution of the SOP along the twisted fiber is proposed and compared with the simulative results. Finally, the performance of this system is compared with that of the standard M-PolSK modulations both in the case of coherent detection (shot-noise limited) [7] and direct detection (thermal noise limited) [14].

2. Theoretical Background

2.1. Birefringence Models

In the past, many studies focused on a possible mathematical model that could be adopted to describe the phenomenon of birefringence in optical fibers. This physical feature of the fiber can be characterized by means of β = (β1, β2, β3)T, which represents the local birefringence vector in any point of the optical fiber propagation axis (z-axis).
The components β1 and β2 characterize the linear birefringence, while β3 takes into account the circular birefringence. The above-mentioned works [3,4] described models for optical fibers with linear birefringence (considering a negligible β3 component). This assumption is valid for most of the fibers used in telecommunications. Linear birefringence is a stationary stochastic process [15], and according to the Wai-Menyuk Model (WMM) [3], the components β1 and β2 are independent Langevin processes (i = 1, 2),
β i / z = ρ β i ( z ) + σ η i ( z )
with η1(z) and η2(z) as independent white noise processes with the following statistical properties (i = 1, 2)
  E   [ η i ( z ) ] = 0 ,   E [ η i ( z ) η i ( z + υ ) ] = δ ( υ )
with δ(ν) being the Dirac distribution. The terms ρ and σ represent the statistical properties of the birefringence [3,5]
ρ = 1 h fiber ,   σ = 4 L B π h f i b e r
where hfiber and LB are, respectively, the fiber autocorrelation length and the mean fiber beat length. The fiber autocorrelation length is the length over which an ensemble of fibers, all of which initially have the same orientation of the axes of birefringence, lose memory of this initial orientation (hfiber is the distance over which the autocorrelation of the birefringence vector decays to 1/e). The fiber beat length is the length required for a complete SOP rotation. Another important parameter is hE,local [3], equal to hfiber, which represents the length scale over which the field, measured with respect to the local axes of birefringence, loses memory of its own orientation with respect to those axes [16].
In [10], in order to study the spatial evolution of the birefringence (and, consequently, of the SOP), a model is presented in which the component β3 (induced circular birefringence) of the local birefringence vector β is no longer considered negligible. The simulations have been developed according to the assumption of using an optical fiber subjected to a twisting process, for distances that can be compared to those of a LAN. With this model, the local birefringence vector can be expressed in the following way [5]
β ( z ) = T ( z ) ( β 1 ( z ) β 2 ( z ) g τ ( z ) )
where T(z) is the rotation matrix of the cross-sectional plane z originated by the twisting process
T ( z ) = ( cos 2 τ ( z ) sin 2 τ ( z ) 0 sin 2 τ ( z ) cos 2 τ ( z ) 0 0 0 1 )
while τ(z) is the twist measured in radians and τ′(z) is the twist-rate expressed in rad/m. The parameter g refers to the optical fiber coupling parameters and represents the proportionality coefficient between the twist-rate and the induced circular birefringence, that is β 3 ( z ) = g τ ( z ) . Typically, experimental results lead to the value g 0 . 14 [5].

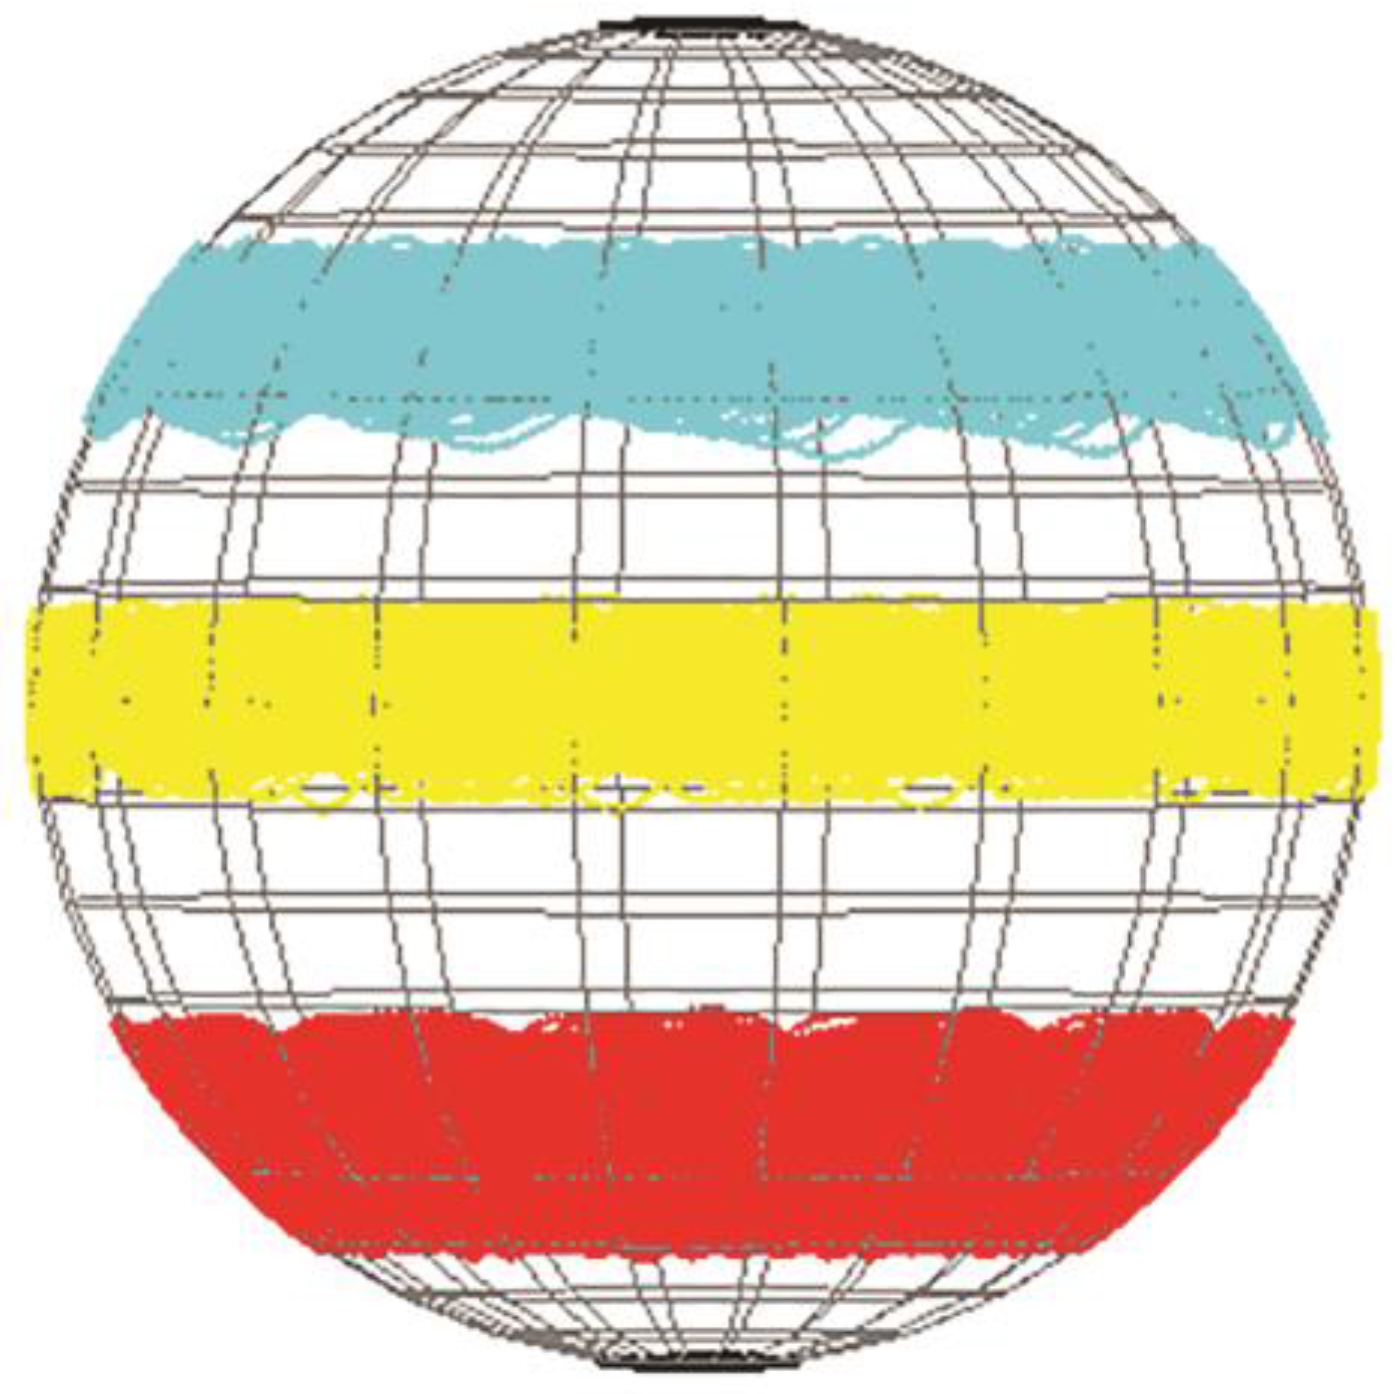
2.2. M-PolSK Modulations

It is known that the M-PolSK modulations use the SOP of a fully polarized light wave as a “modulation parameter”. Considering a reference plane (x, y), normal to the z propagation axis, the complex components of an electromagnetic field that travels along the z-axis are given by
E x = u ( x ,   y ) a x ( t ) e j ( ω t + ϕ x ( t ) ) x ^ = E x x ^ E y = u ( x ,   y ) a y ( t ) e j ( ω t + ϕ y ( t ) ) y ^ = E y y ^
where ω is the angular frequency, ax, ay, φx, and φy are respectively the amplitude and phase of the x, y field components, and u(x, y) is the transversal mode profile. It is possible to measure and to identify univocally the SOP of the signal through the Stokes parameters
S 0 = a x 2 + a y 2     S 1 = a x 2 a y 2 S 2 = 2 a x a y cos δ     S 3 = 2 a x a y sin δ
with S 0 2 = S 1 2 + S 2 2 + S 3 2 and δ = ϕ x ϕ y . S0 is proportional to the power of the optical field travelling along the fiber. A powerful way to visualize the SOP is represented by the Poincaré sphere of radius S0, in which any point represents a SOP with a different longitude (ψ) and latitude (χ)
tan 2 ψ = S 2 / S 1 ,   sin 2 χ = S 3 / S 0
In the Stokes space, the differential equation of motion, which describes the spatial response of the SOP to the local birefringence, is
S / z = β x S
where S = ( S 1 ,   S 2 ,   S 3 ) is the three-component Stokes vector. Equation (9) describes the spatial evolution of the Stokes vector at a fixed angular frequency. Therefore, for Equation (9), the birefringence causes random SOP fluctuations depending on the β behavior along the propagation z-axis. M-PolSK modulation formats are possible because the rate of polarization changes along the propagation in the optical fiber is very low and no significant variation can take place within a time interval comparable with the symbol time.
M-PolSK modulation schemes can be mapped onto the Stokes space. For higher order modulation schemes, M-PolSK shows an increased efficiency with respect to the more conventional coherent modulation schemes, based on amplitude and/or phase modulation [9]. These systems must provide at the receiver end a tracking mechanism of the polarization changes due to the birefringence. M-PolSK modulations are usually related to fixed and rigid constellations of symbols represented in the Stokes space. Symbol constellations can be regular and symmetric polyhedra [7] inscribed into the Poincaré sphere, or asymmetric polyhedra [9].
The M-PolSK modulator has to change the input SOP in such a way that the corresponding SOP point in the Stokes space matches one of the symbols belonging to the signal constellation.
The Stokes receiver, in addition to the Stokes parameters extraction, must be able to compensate the SOP fluctuations. Specific receiver schemes described in [7,9] are able to track time changes of the SOP due to fiber birefringence. In the presence of slow fluctuations, the reference SOPs, which are associated with the transmitted symbols, have to be updated every TUP seconds, with 1/W TUP TSOP, where W is the signal bandwidth and TSOP is the characteristic time of the SOP fluctuations.

3. Statistics of the Proposed Model

The work in [10] proposed a new type of multilevel-polarization modulation (“bands of polarization” modulation) that goes beyond the classical concept of symbols belonging to a rigid constellation in the Euclidean space. This modulation model takes advantage of an intrinsic characteristic of optical fibers such as the birefringence. As a matter of fact, with a suitable twisting process, the induced circular birefringence β3 becomes predominant with respect to the linear birefringence components β1 and β2. In this case, the evolution of the SOP during its spatial propagation along the fiber is confined latitudinally within specific physical tracks (called “bands of polarization”). Figure 1 shows the spatial evolution in the Poincaré sphere of five different SOPs in their own “bands of polarization”; the simulated twisted fiber has a twist rate of 6 rad/m (~1 turn/m).
A fundamental benefit of this system consists of the reduced complexity of the receiver. Its simplicity derives from the simple need to detect only the S3 component of the received SOP. Therefore, there is no need to implement a specific circuit to track the birefringence’s variations.

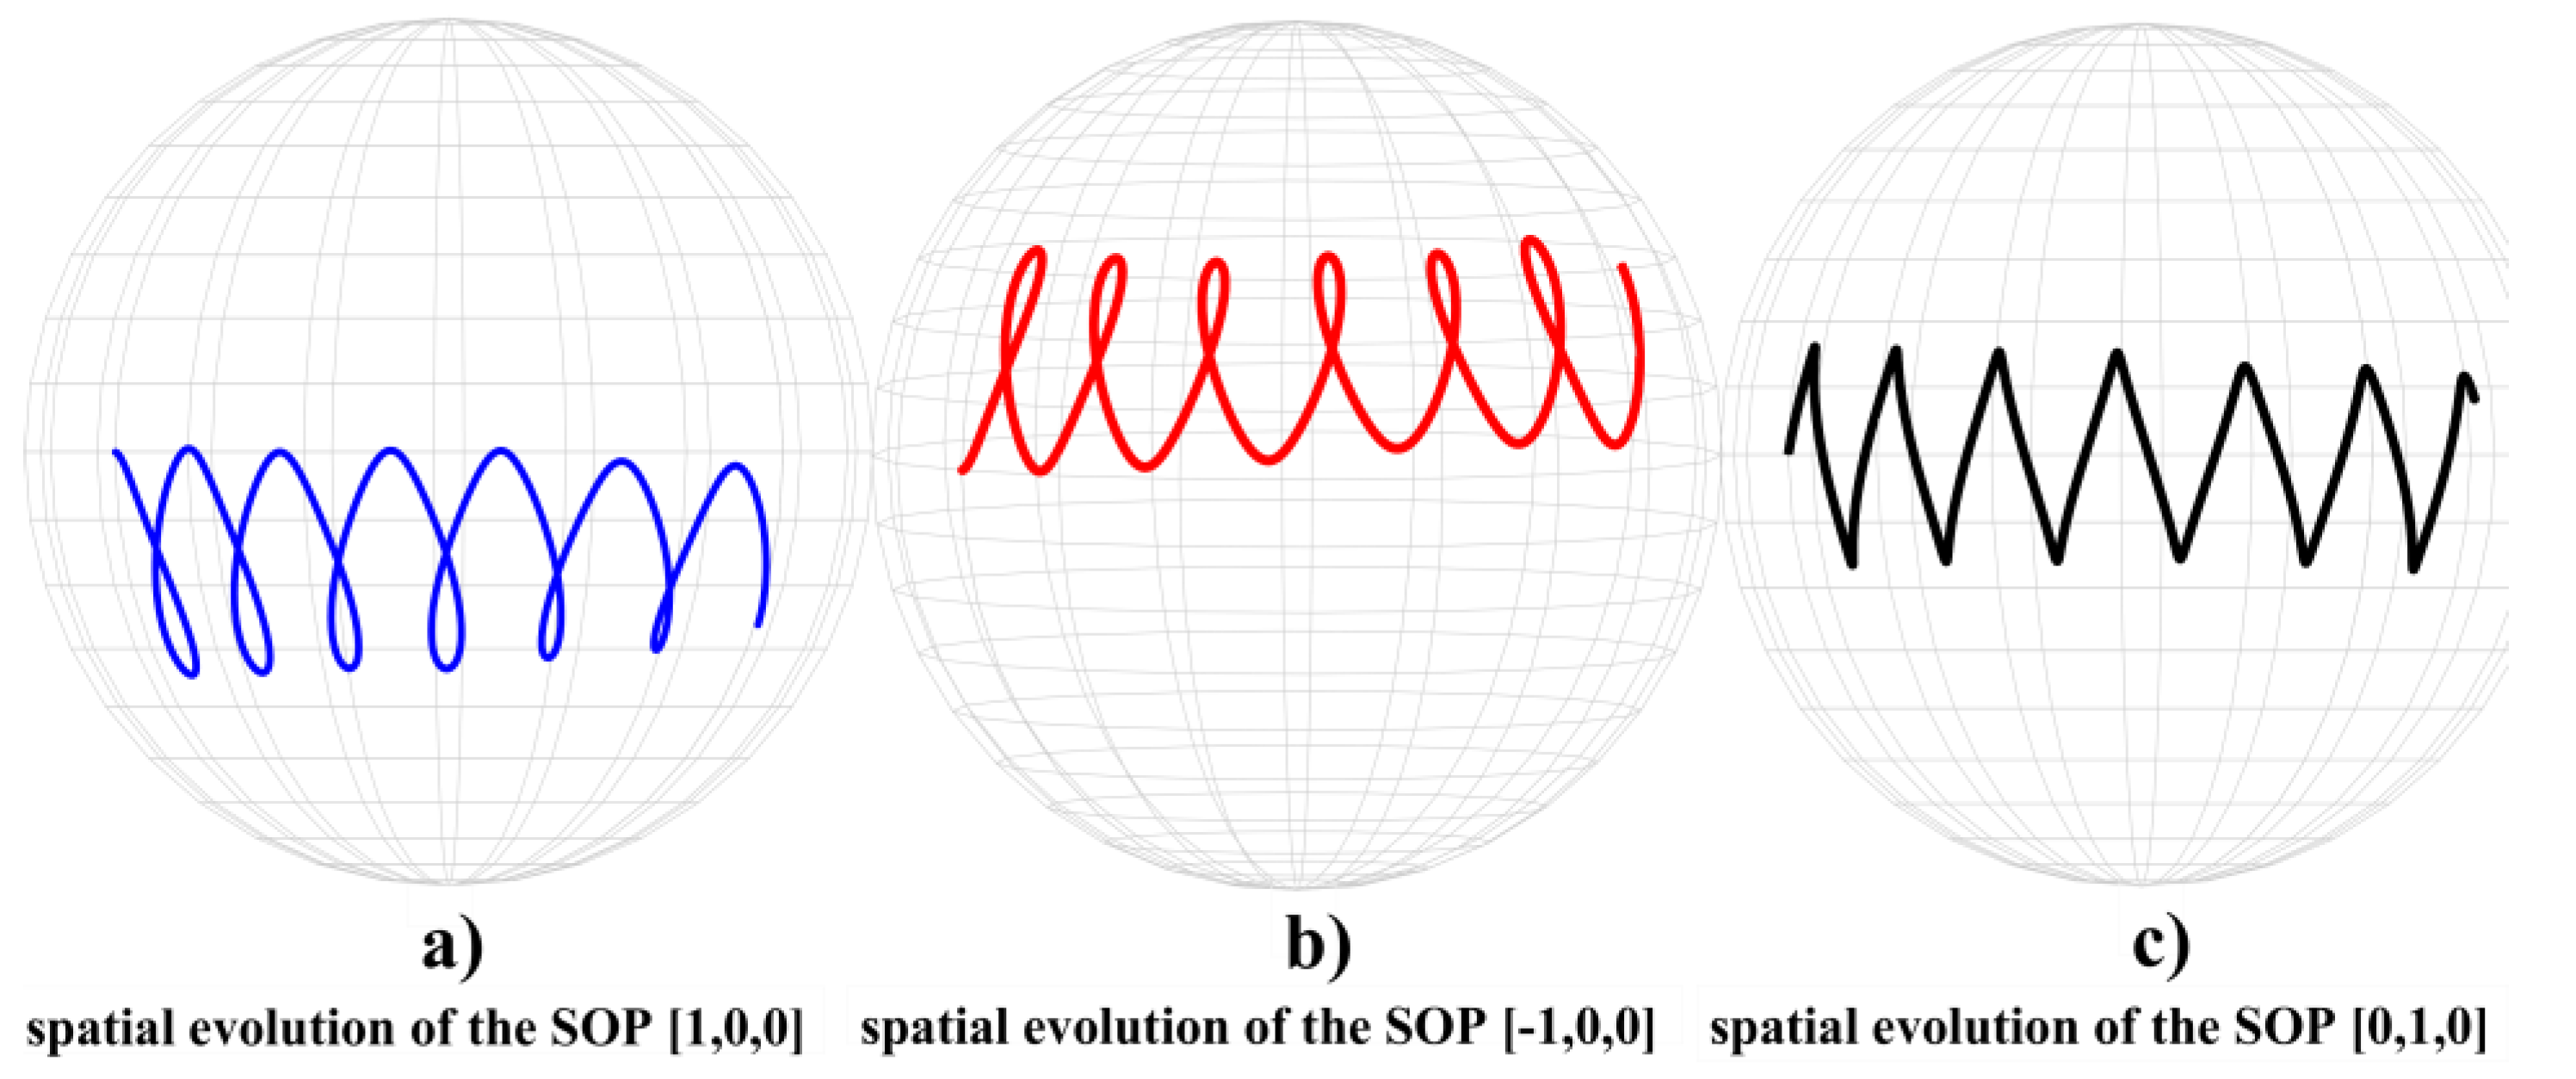
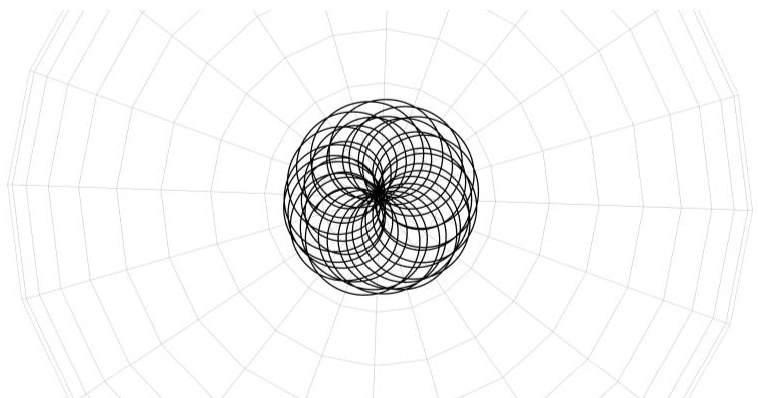
3.1. Simulation Model

Starting from the simulative results described in [10], we analyzed the statistical behavior of the different transmitted SOPs during their propagation along a twisted fiber. All of the statistical results shown in this paper have been obtained using the model and the physical parameters reported in [5]. In order to achieve statistically significant results, the simulations have been repeated 500 times (cycles), for each value of twist and for each distance of propagation.
The simulation software used was MATLAB R2016a with an Academic License. In order to perform, in a reasonable time, the onerous statistical calculations required by the adopted mathematical model, we implemented a software code that could exploit all the available hardware of the workstation dedicated to the simulations. Given the statistical independence of the parameters utilized in the different simulation cycles, the serial calculation method was replaced with a parallel computing method, thanks to the simultaneous use of eight independent logical processes that could run the 500 cycles in parallel. For this choice, the software code implemented in [10] was adapted and configured for an efficient use of parallel computing.

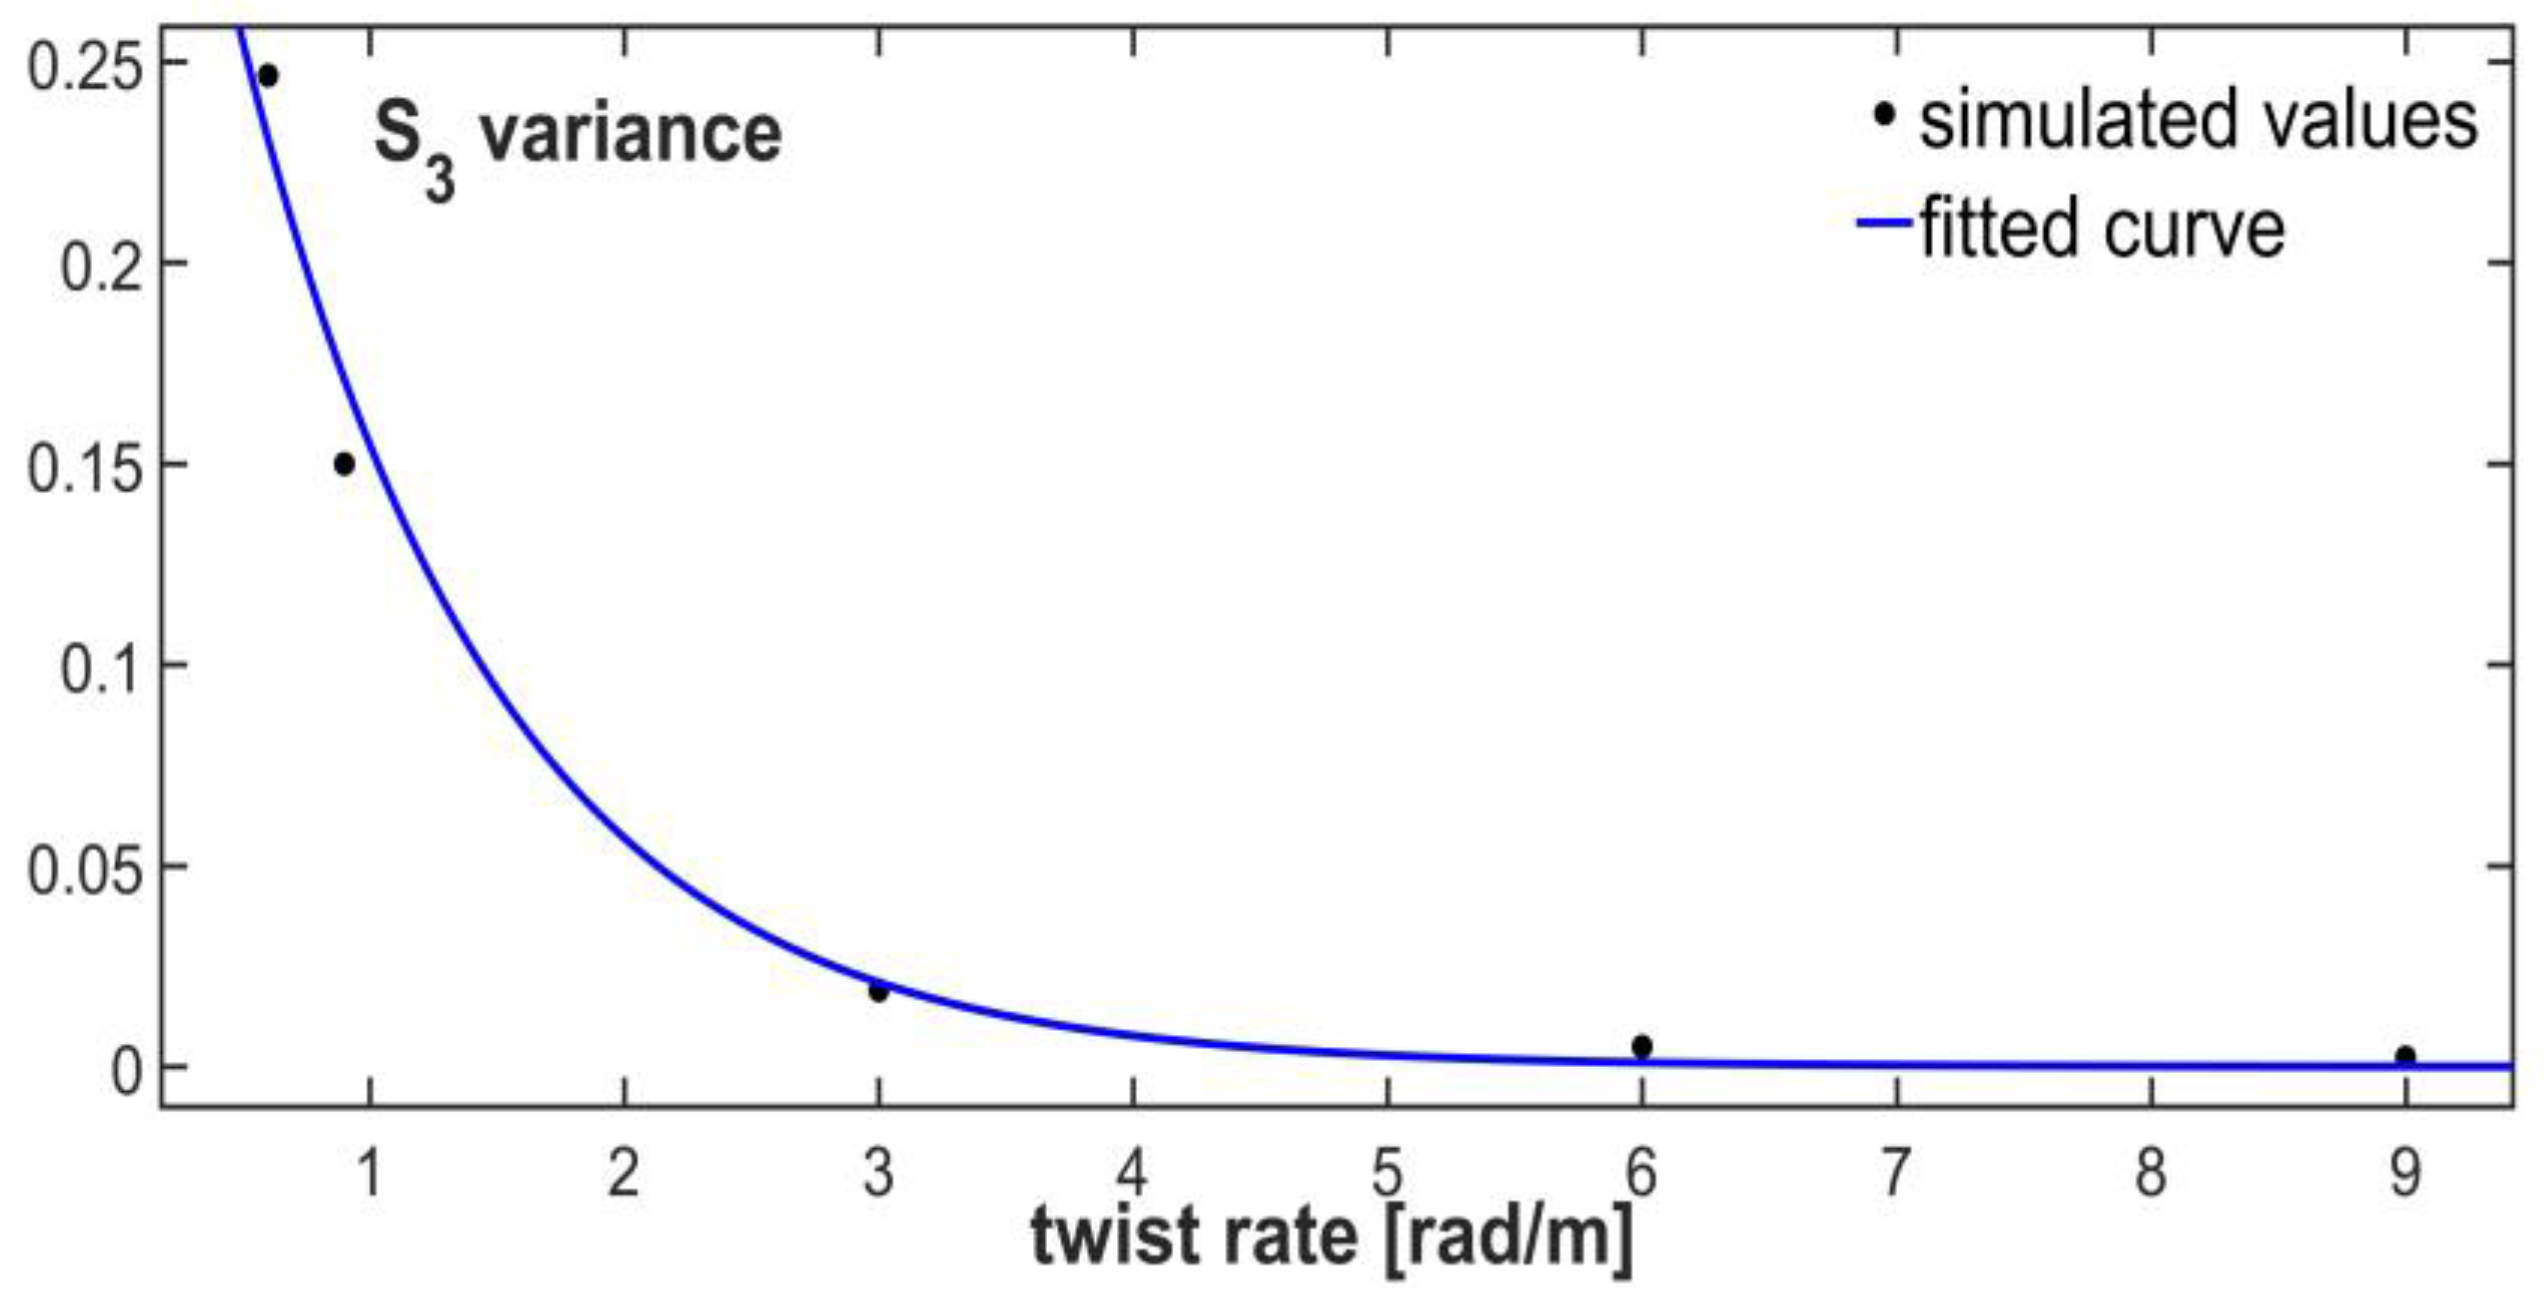
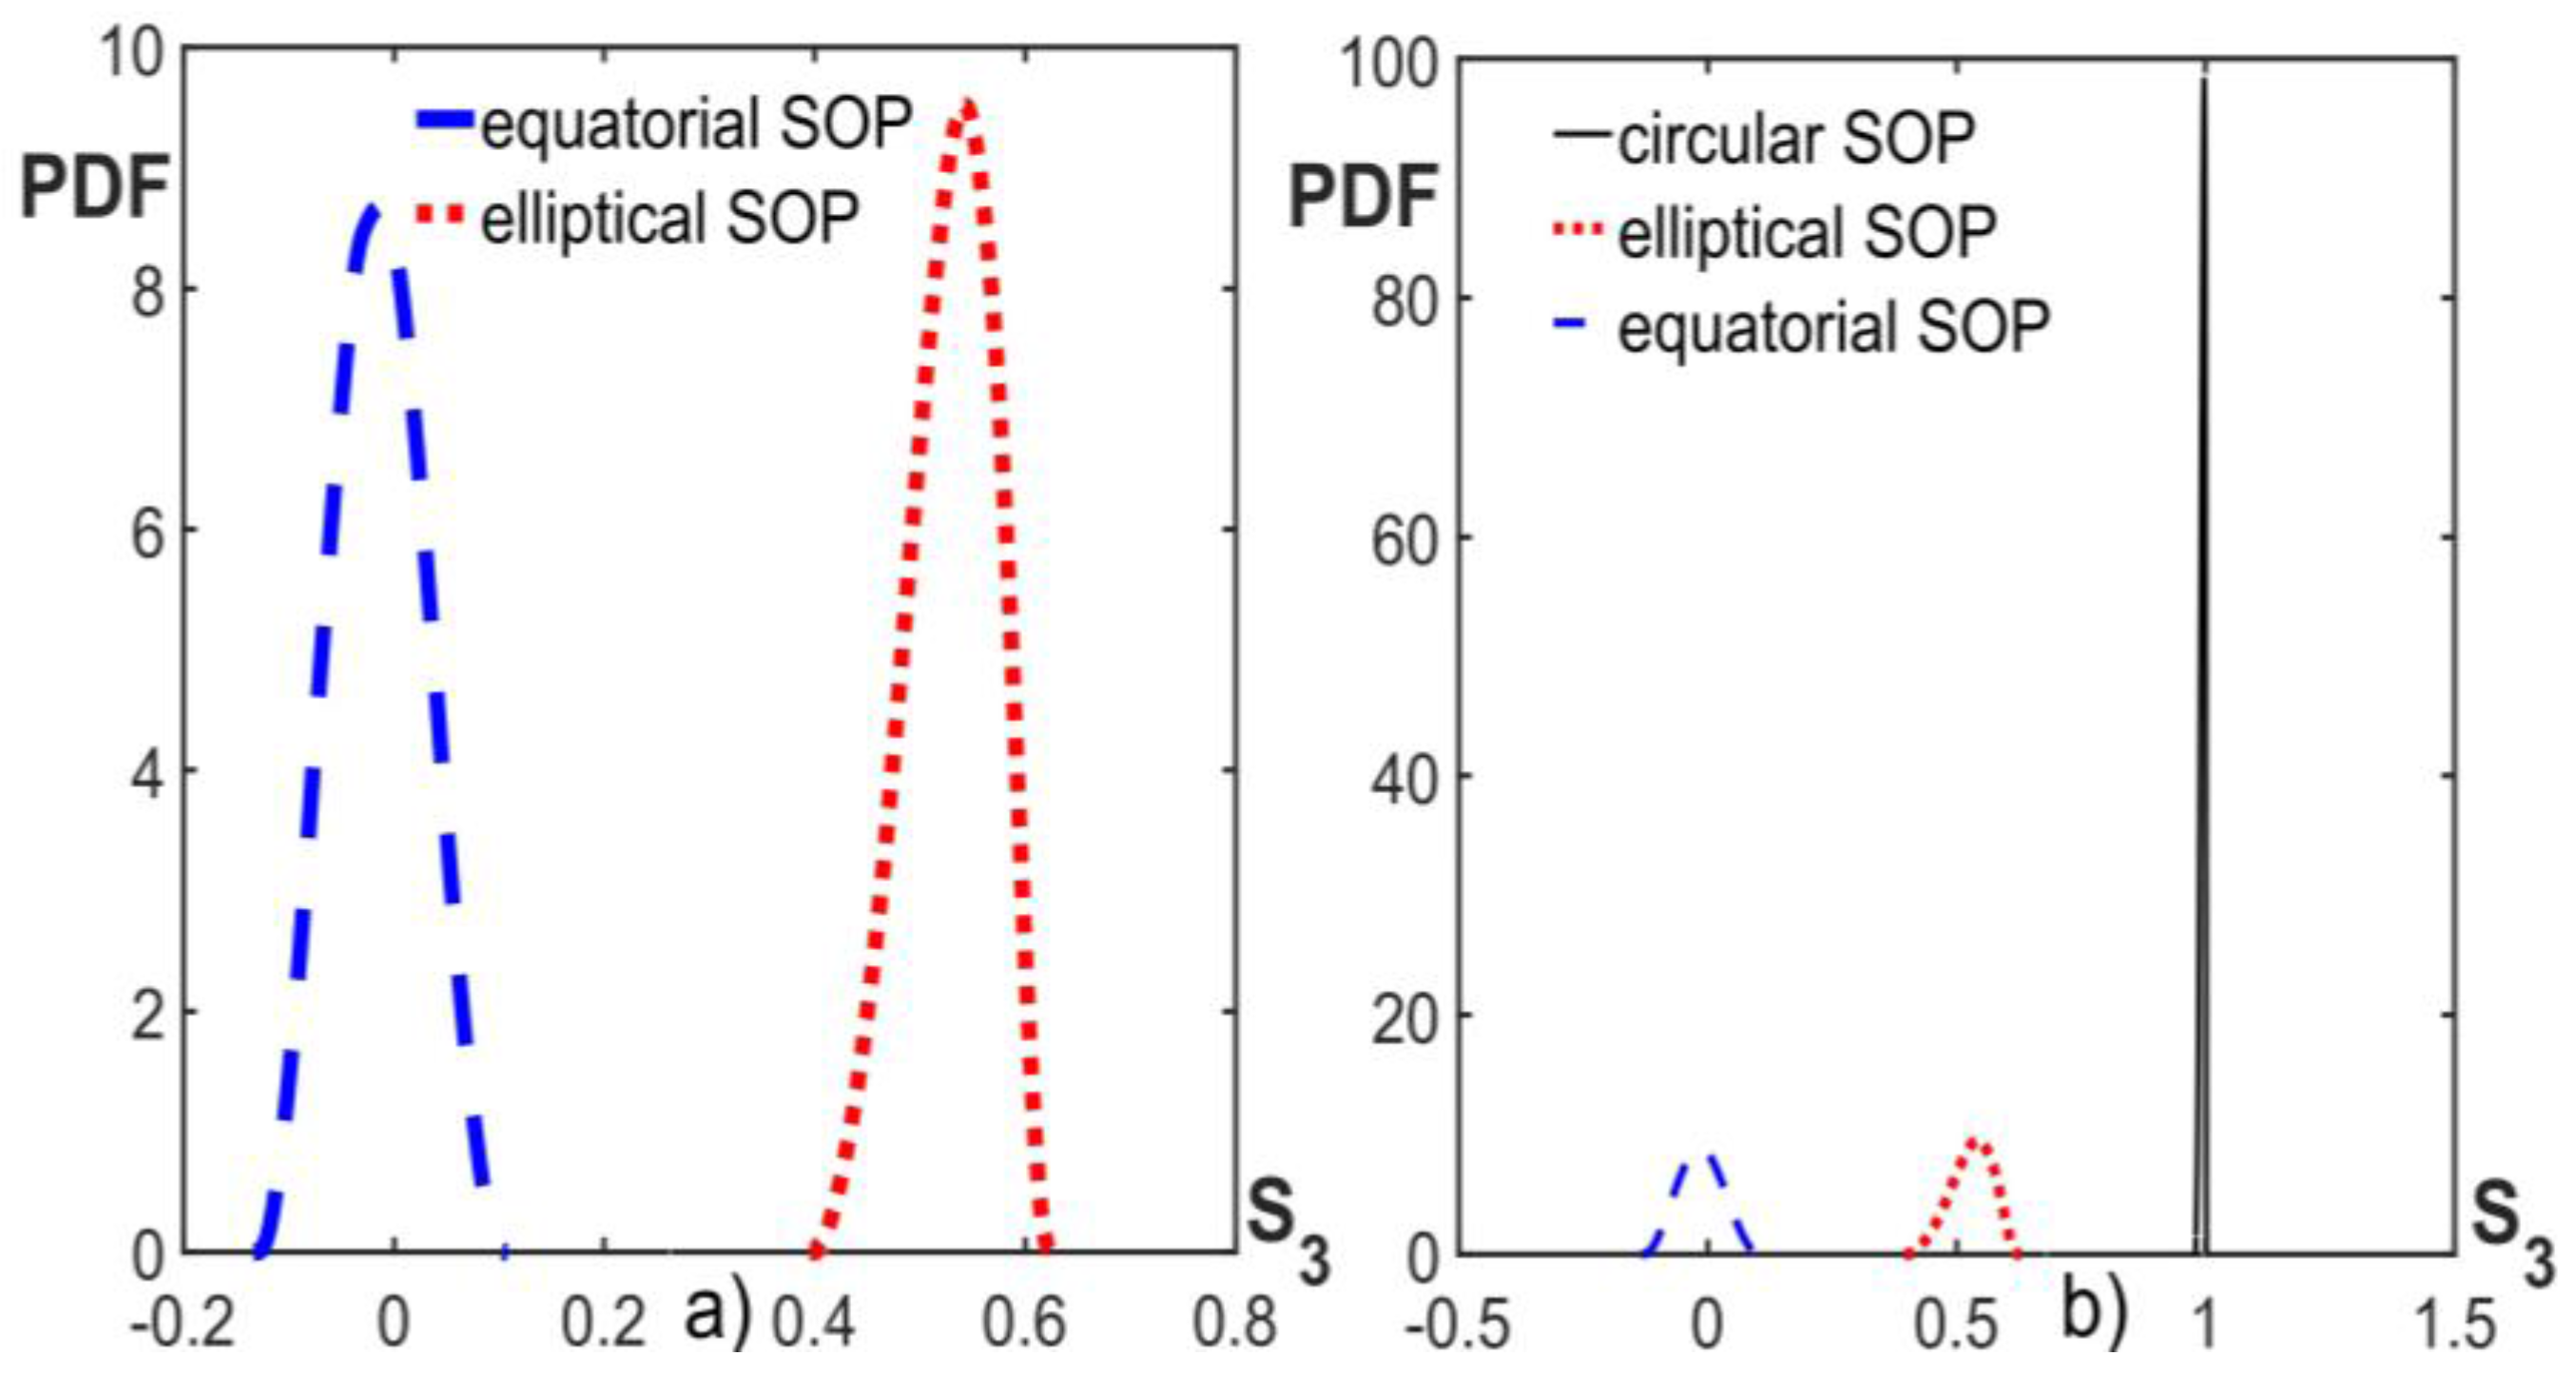
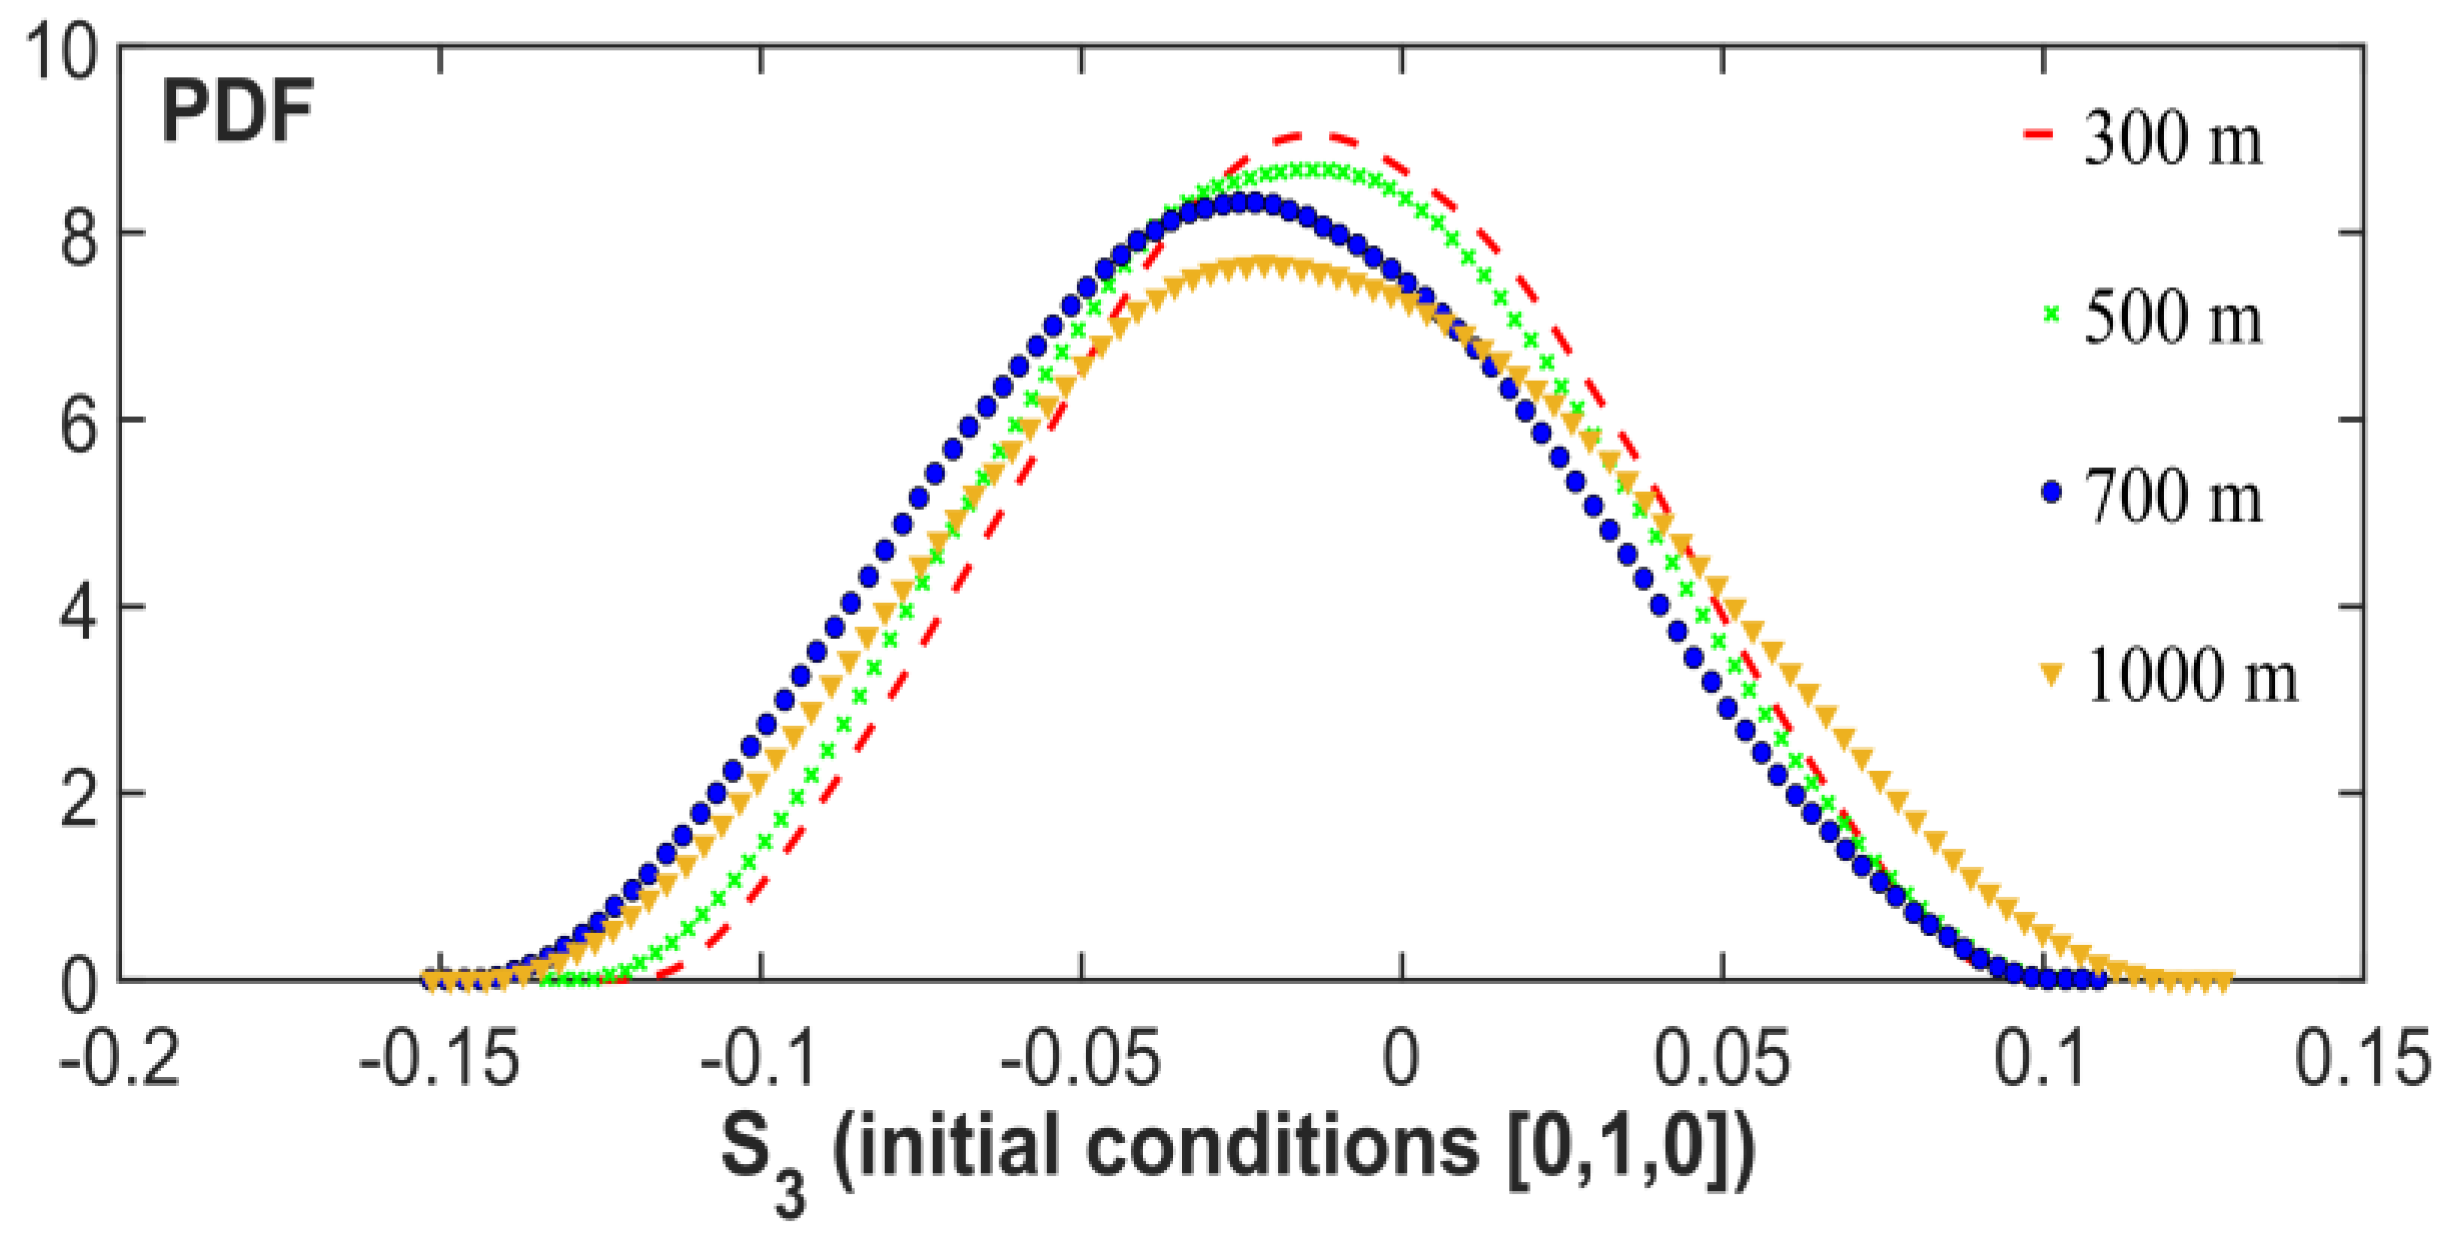
3.2. Statistical Analysis

The five transmitted symbols were chosen in such a way that the relative “bands of polarization” were symmetrical around the starting value of the latitude. To achieve this objective, we analyzed the behavior of different SOPs that belonged to the same band of polarization; the chosen test band was the equatorial band that included the linear polarizations. Figure 2 shows the spatial evolution of different linear polarizations. It can be seen that the cycloidal spatial trajectory of the SOP is not symmetrical with respect to the equatorial plane if the starting value of S2 is null, facing downwards if S1 is positive (Figure 2a) and upwards in the opposite case (Figure 2b); conversely, the trajectory is symmetrical with respect to the equatorial plane if the starting value of S2 is equal to one (Figure 2c). Moreover, the trajectories in Figure 2a,b are prolate cycloids while that in Figure 2c is a curtate cycloid.
To enhance the visualization of the cycloidal patterns, we chose a weak twist rate of 1.5 rad/m. In fact, with a low twist rate, the spatial trajectory is a prolate cycloid, while when increasing the twist rate, it becomes first an ordinary cycloid and then a curtate cycloid. The same behavior holds true for the elliptical polarizations. On the contrary, circular polarization is flattened towards the pole because of the presence of strong spatial constraints (Figure 3).
The first objective is to study the dependency of the transmitted SOP spatial evolution from the propagation distance of the optical field along the fiber for different values of the twisting process. For each simulation cycle, we calculated the probability density function (hereinafter referred to as the pdf) of the third Stokes vector component S3 relative to the transmitted symbols. In fact, as demonstrated by Equation (8), S3 depends directly on the latitude angle and its variance is closely related to the width of its associated “band” (Figure 1).
Afterwards, in order to consider all the cycles’ contributions, we derived the average pdf as the mean curve of all the executed simulations. In Figure 4, the behavior of the above-described mean pdf for different propagation distances is shown.
These plotted functions were obtained with different fiber distances but with the same value of the twist rate (6 rad/m). The transmitted symbol had a 45° linear polarization SOP with a Stokes vector equal to [0,1,0]. The S3 variance, and consequently the width of the bands of polarization, widens with increasing the distance of propagation. This variance growth has a linear dependence on the propagation distance as shown in Figure 5, which shows a comparison between the simulated values and a linearly fitted curve.
Figure 6, instead, shows the dependency of the S3 pdf on different values of the twisting process. These plotted functions were obtained by considering a fixed value of the propagation distance equal to 500 m. In this case, the transmitted symbol also had a 45° linear polarization SOP with a Stokes vector equal to [0,1,0]. The S3 variance, and consequently the width of the bands of polarization, narrows with increasing the twisting value. Therefore, an increase of the twisting process generates a potential throughput rise, with the same available bandwidth, for this type of multilevel polarization modulation, because it allows for the presence of a greater number of bands (and consequently, symbols) on the Poincaré sphere.
The variance decrease has an exponential dependence on the twist rate, as shown in Figure 7, which shows a comparison between the simulated values and an exponentially fitted curve. Therefore, the statistical results show how the width of the polarization bands has a dependence on the twisting process that is much stronger (exponential) than that of the propagation distance (linear).
The data originating from these simulations show that the twisting process gives rise to a physical track even tighter for circular polarization than for those equatorial and elliptical polarizations. Considering the same values of distance (500 m) and twist rate (6 rad/m), Figure 8a shows the comparison between a linear and an elliptical SOP, while in Figure 8b a circular SOP is added. It is clear from Figure 8b, how large the difference is between the pdf curves of circular polarization on one side and those of the equatorial and elliptical polarizations on the other side.
Another important result that can be deduced by Figure 8a,b is that the width of the “bands” decreases, starting from the equator to the pole. This behavior proves how a transmitted circular SOP is physically advantaged with respect to the other SOPs, in terms of a less probable deviation from its initial position, during the spatial propagation in a twisted optical fiber. It is reasonable to assume that this behavior is determined by the greater strength of the circular polarization with respect to the symmetry, also circular, of the fiber core.

4. Mathematical Model

The statistical analysis performed by simulation can be matched with the mathematical model proposed by Perrin [13], which characterizes the Brownian motion of a particle on the surface of a sphere. Perrin showed how the pdf of the colatitude angle θ as a function of time is given by:
f ( θ , t ) = k = 0 1 4 π ( 2 k + 1 ) e k ( k + 1 ) Rt P k ( cos θ )
where Pk is the Legendre polynomial of order k and R is the rotational diffusion coefficient (in rad2/s). This function is obtained by starting from the initial conditions f(0, 0) = ∞ and f(θ, 0) = 0 (initial conditions equivalent to a circular polarization). The pdf of Perrin has been manipulated using the methods described in [13] in order to calculate the pdf of S3 = cos θ, as a function of a random variable. Moreover, Equation (10) has been adapted to the various initial conditions that correspond to the SOP of the transmitted symbols. For example, for the linear polarizations (colatitude equal to π/2), it has been set to f(π/2, 0) = ∞ and f(θ, 0) = 0. In order to make a valid comparison between the simulated model and the mathematical model, we adopted the following assumption: it is not possible to use, in this case, the rotational diffusion coefficient R indicated by Perrin, so it has been deduced by simulation results through the diffusion equation
< θ 2 > 2 = R   t
in which the simulative values of 2> were used. An important result is that for the linear and elliptical polarizations, this mathematical model represents an upper limit (the dotted envelope in Figure 9) with respect to the pdf curves of S3.
In the case of circular polarization, the mathematical model has an asymptotic behavior (the dotted curve in Figure 10) with respect to the pdf curves of S3.
Simulated values in Figure 9 and Figure 10 were obtained for a fixed distance of 300 m and a constant twist rate of 6 rad/m. A general result is that the diffusion process studied by Perrin flattens (with a trend towards uniform distribution) the pdf of the colatitude with increasing time as well as increasing distance. The decrease of the twist rate instead flattens the pdf obtained from the simulation results. It seems that the constraint introduced by the twist process is able to create privileged physical channels for the spatial evolution of the transmitted SOPs. These channels resist as long as the twist constraint is stronger than the natural process of diffusion.

5. Performance Evaluation

As described above, the circular birefringence, induced by the twisting process, defines the physical bands. In order to analyze the system performances, these bands, which constitute the decision regions, have been chosen after an optimization process. The performance evaluation starts from the considerations described in [7], about the optimal decision regions for M-PolSK modulations as constellations of regular polyhedra inscribed in the Poincaré sphere. In particular, in [7] the decision regions, which are different for the various M-PolSK modulations, coincide with regular spherical polygons identified by all the spherical coordinates. Nevertheless, the topological concept of the proposed modulation is completely different because it creates a “fluid” constellation of symbols belonging to physical bands of polarization and is no longer anchored to rigid geometrical structures such as polyhedra. Therefore, only a spherical coordinate (colatitude) is involved in the definition of decision regions that, for this reason, present only a colatitude upper bound beyond which decision errors always occur. This limit is equal to π/(M − 1), where M is the number of symbols of the proposed system.
The system performance for the “bands of polarization” modulation was calculated with respect to the statistical properties of two different noises: shot-noise and thermal noise. Previous sections of this work show how the probability density functions are different depending on the transmitted SOP (narrower band of polarization and lower error probability for the circular SOP). This result is valid until the signal propagates along the fiber. At the receiver side, other noise sources must be considered. As a matter of fact, the birefringence effect is selective in its influence on SOP; on the contrary, noise processes such as shot and thermal noise have the same behavior against all the SOPs. Under the hypothesis of independent equiprobable symbols, the symbol error probability can be written as
P ( e ) = 1 M k = 1 M P ( e | S k ) = P ( e | S k )
where P ( e | S k ) is the error probability conditioned to the transmission of the symbol S k .

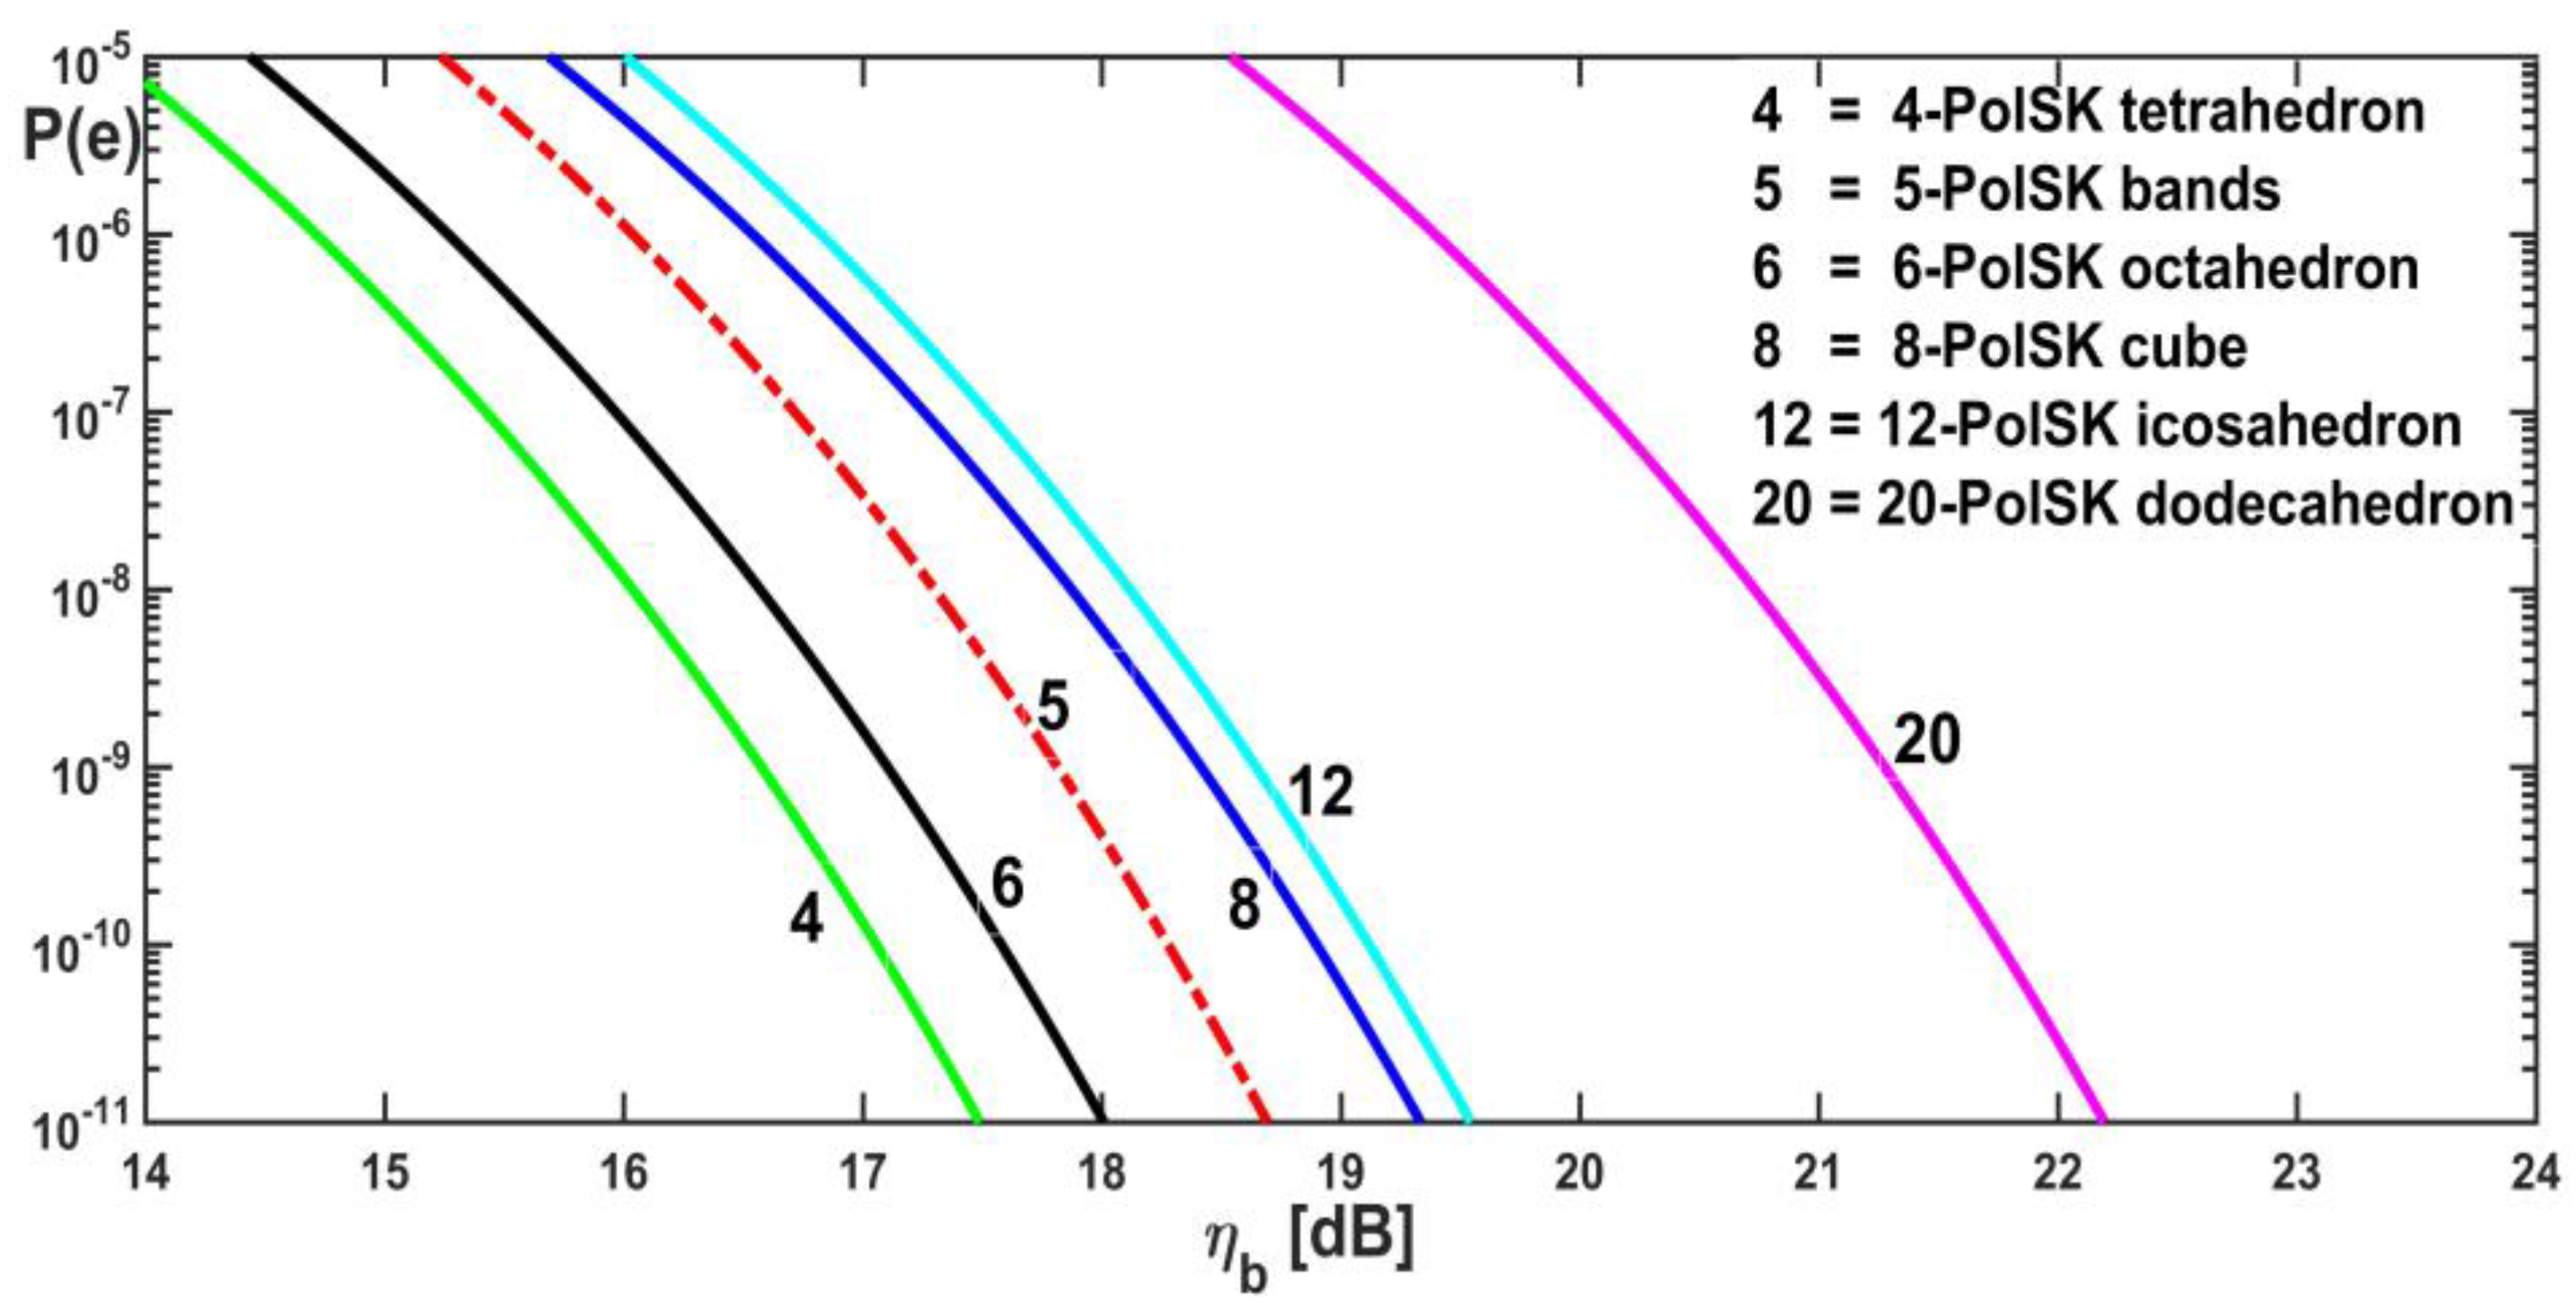
5.1. Coherent Detection Performance

In this case, we assumed the hypothesis of a receiver based only on the estimation of the Stokes parameter S3 of the received optical field by means of a coherent optical front end. Therefore, the dominant noise source is the shot-noise.
Coherent detection offers many benefits with respect to sensitivity, spectral efficiency, and equalization potential [17,18]. With the above described choice about the decision regions, only the colatitude θ is involved in the performance analysis. Starting from the results derived in [7] and after suitable manipulations due to the different considered decision regions, the conditional error probability can be expressed as
P ( e | S k ) = 1 F ϑ ( ϑ 1 ) ,
where θ1 = π/(M − 1) is the optimized colatitude upper bound of the decision regions and F ϑ is the cumulative density function (cdf). The cdf has the following expression [7]
F ϑ ( t ) = 1 1 2 e S 0 4 σ 2 ( 1 cos t ) ( 1 + cos t )
with t [0, π] and σ 2 as the noise variance. The resulting error probability was analyzed in a function of the signal to noise ratio per transmitted information bit η b [7]
η b = η s 1 log 2 M
where, for M-PolSK systems, the term η s is equal to S 0 / 2 σ 2 .
Figure 11 shows the comparison between the results reported in [7] and the performance relative to the proposed 5-PolSK bands polarization system.
The proposed system is located between the 6-PolSK octahedron and 8-PolSK cube curves. It is slightly better (~0.1 dB) than the optimum 8-PolSK non-regular polyhedron described in [7], not reported in Figure 11. The decision regions are calculated by means of a unique angle (colatitude), neglecting the longitudinal one. This choice from one side causes a penalty of less than 1 dB (~0.7 dB) with respect to the 6-PolSK octahedron, but from the other side it guarantees a simpler receiver based only on the knowledge of S3 and with no birefringence tracking circuit.

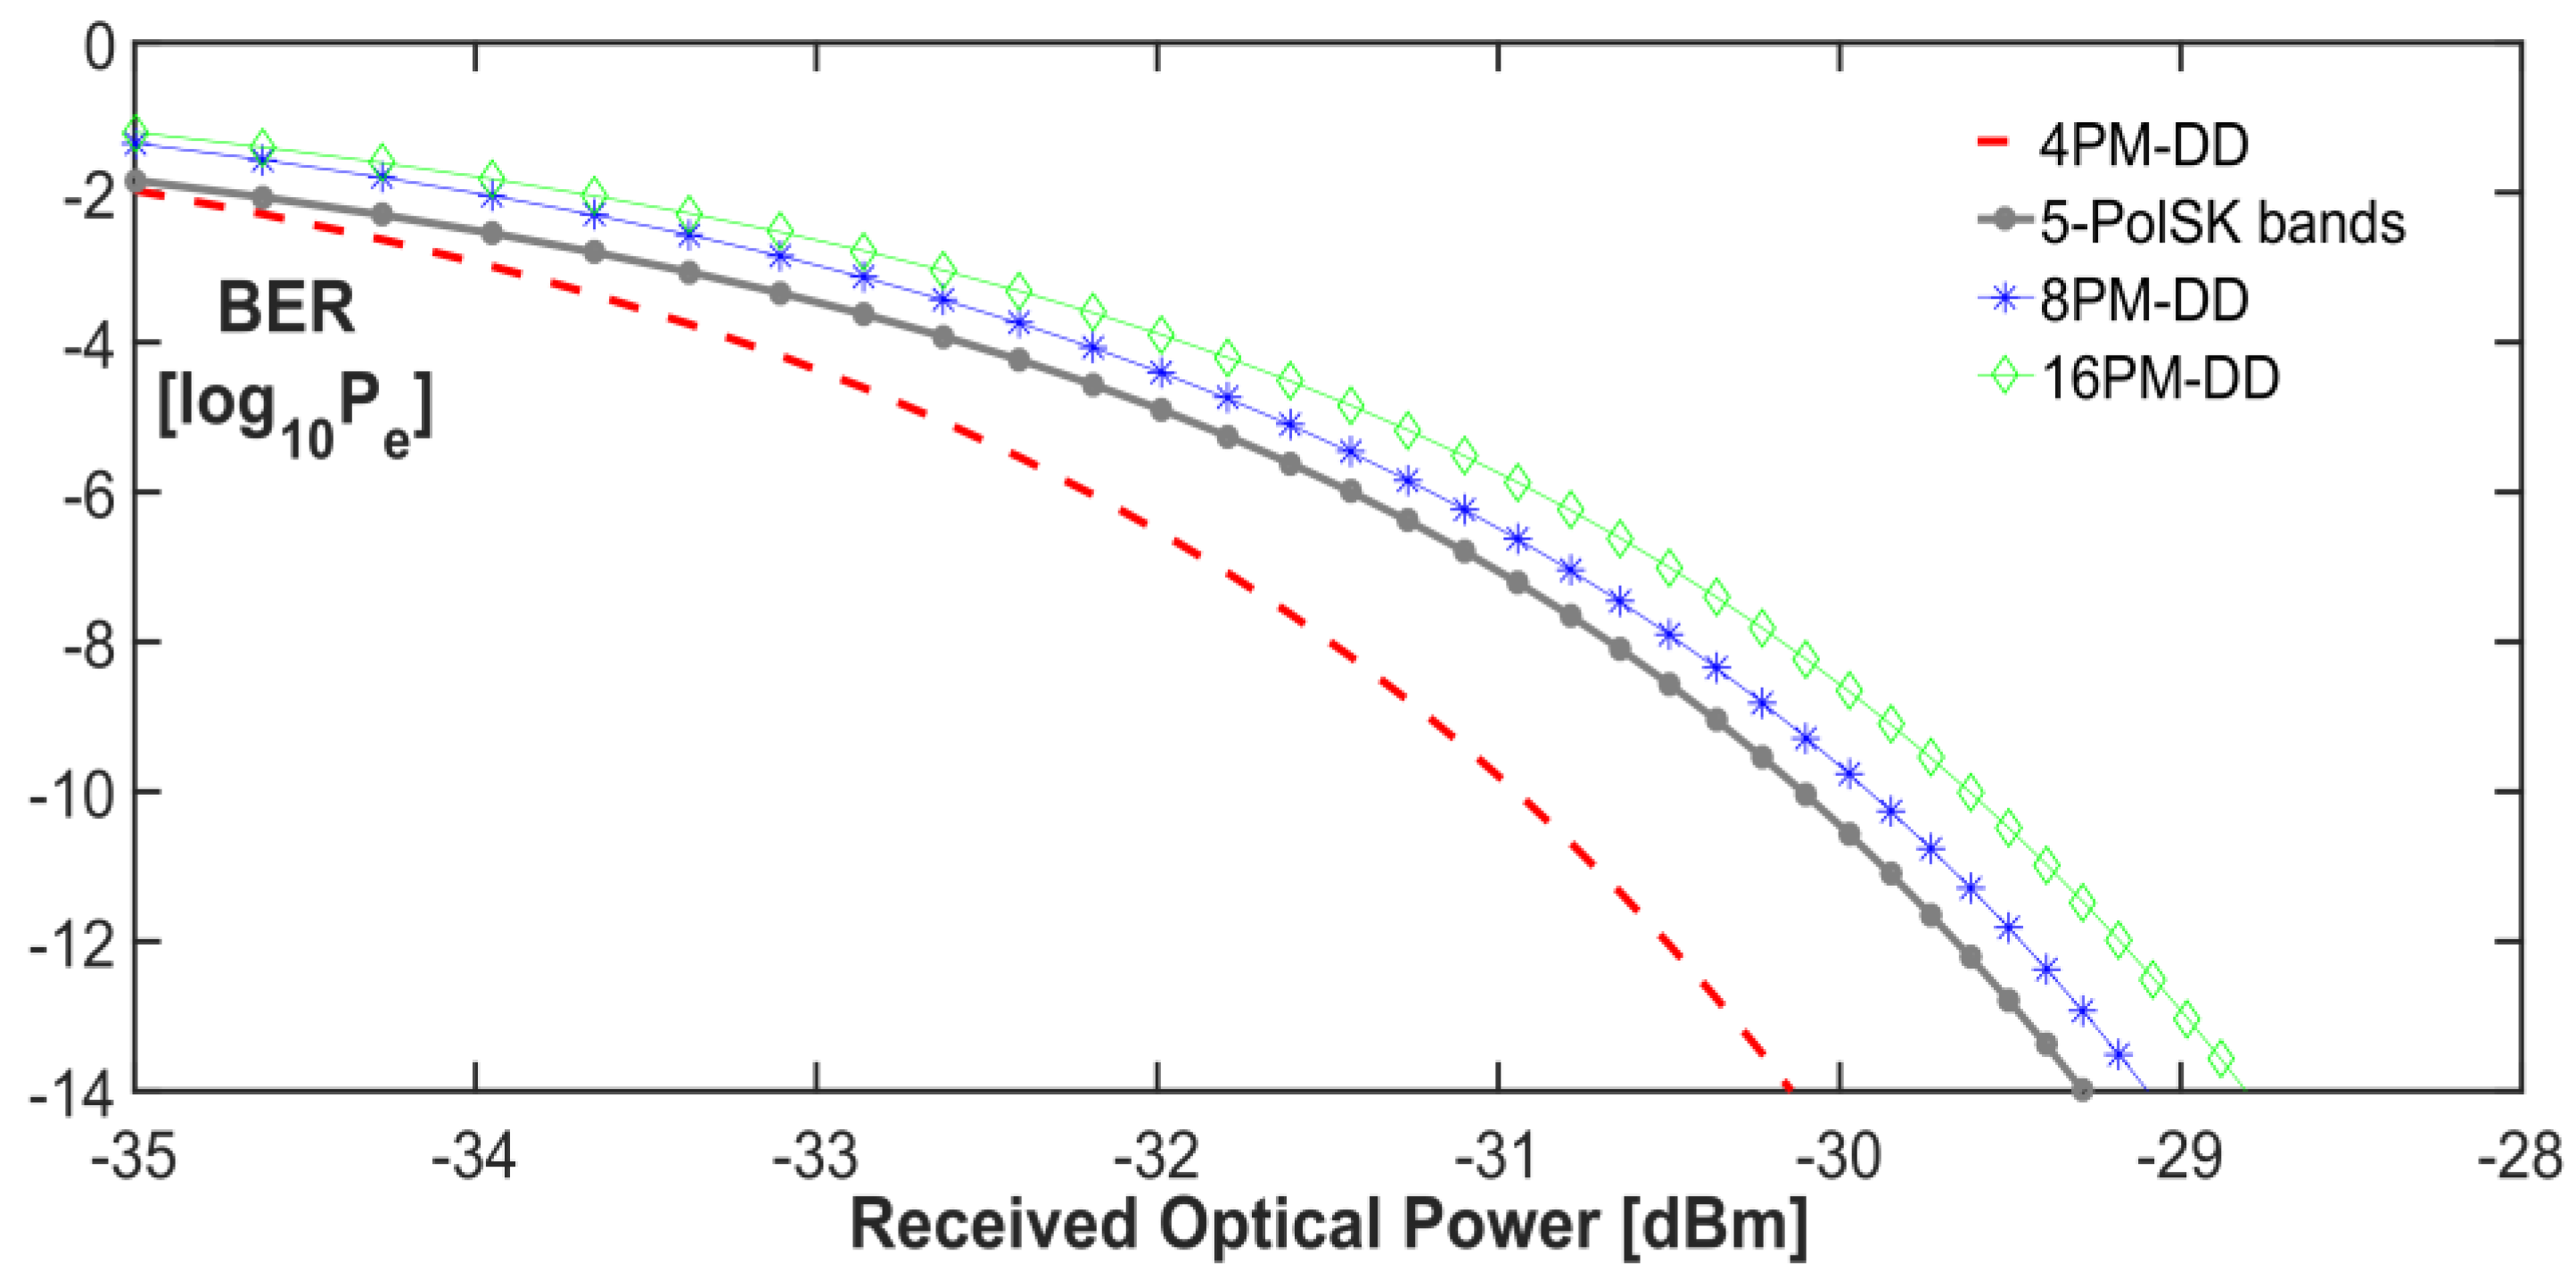
5.2. Direct Detection Performance

In this case, we assumed the hypothesis of a receiver based only on the estimation of the Stokes parameter S3 of the received optical field by means of a direct detection optical front end. Therefore, the dominant noise source is the receiver thermal noise. The objective was to compare the performances of the proposed system with the Polarization Modulated Direct Detection (PM-DD) systems described in [14]. In order to achieve a better comparison, the method used for the performance evaluation was the so-called union bound approximation utilized in [14] and described in [19,20].
As described in [10], this novel modulation model does not need fixed constellation symbols, but only the knowledge of the associated bands of polarization. Nevertheless, in order to evaluate the performance using the distance criterion, it is necessary to choose a reference constellation of symbols. The chosen coordinates for the constellation symbols in the Stokes space are listed in Table 1.
This choice fell on the symbols in Table 1 because it was considered the worst possible case with the minimum distance among all the nearest neighbors. Distances between the symbols of the proposed system are reported in Table 2.
Under the hypothesis of independent equiprobable symbols, the symbol error probability was written as in Equation (12). The conditional error probability was derived as in [14], by using the same receiver parameters. The system bit error probability Pbit was calculated as a function of the symbol error probability Psymbol by means of the expression P bit = ( e ¯ · P symbol ) / log 2 M , where M is the number of symbols and e ¯ is the average number of wrong bits in a wrong symbol [19]
e ¯ = 1 M 1 k = 1 log 2 M ( log 2 M k ) k = M log 2 M 2 ( M 1 )
Therefore, the bit error probability is given by
P bit = M 2 ( M 1 ) P symbol
The resulting bit error probability was evaluated in the function of the received optical power, measured in dBm. Figure 12 shows the comparison between the results described in [14] and the evaluated performance of the 5-PolSK bands polarization system in the presence of thermal noise.
The proposed system is located between the 4PM-DD and 8PM-DD curves, with a performance penalty of less than 1 dB (~0.9 dB) with respect to 4PM-DD.

6. Conclusions

This work has presented a novel scheme of a multilevel polarization modulation system. By exploiting the twisting process of an optical fiber, it is possible to create physical tracks, the so-called bands of polarization, within which the transmitted SOP can be confined.
A statistical theory, originating from simulative results, has shown the different behavior, with respect to the birefringence, of the linear and elliptical polarizations on one side and the circular polarization on the other side. In particular, it was shown how the circular polarization is favored in terms of a less probable deviation from its initial position, because of its peculiar geometric and physical features.
Another important result is the proof of the dependency of the width of the bands of polarization on the distance of propagation and on the strength of the twisting process. In particular, the dependency on the twisting process is exponential while that on the distance of propagation is linear.
This consideration is fundamental for the achievable throughput; in fact, by enhancing the twisting strength, the width of the bands of polarization decreases and more symbols can be transmitted. The twisting process becomes a project parameter together with the propagation distance.
Then, the mathematical model proposed by Perrin for describing the Brownian motion of a point on the surface of a sphere was adopted to check the simulation results. In conclusion, the system performance has been evaluated both for coherent and direct optical detection.

Author Contributions

P.P. presented the basic idea and carried out the analytical calculations and discussions. S.B. and G.G.R. contributed to developing the research ideas and were involved in the discussion of results. P.P. wrote the main manuscript and prepared the figures. All authors reviewed the manuscript and gave the final approval for publication.

Conflicts of Interest

The authors declare no conflict of interest.

References

  1. Ulrich, R.; Simon, A. Polarization Optics of twisted single-mode fibers. Appl. Opt. 1979, 18, 2241–2251. [Google Scholar] [CrossRef] [PubMed]
  2. Tentori, D.; Garcia-Weidner, A. Jones birefringence in twisted single-mode optical fibers. Opt. Express 2013, 21, 31725–31739. [Google Scholar] [CrossRef] [PubMed]
  3. Wai, P.K.A.; Menyuk, C.R. Polarization mode dispersion, decorrelation, and diffusion in optical fibers with randomly varying birefringence. IEEE J. Lightwave Technol. 1996, 14, 148–157. [Google Scholar] [CrossRef]
  4. Foschini, G.J.; Poole, C.D. Statistical theory of polarization dispersion in single mode fibers. IEEE J. Lightwave Technol. 1991, 9, 1439–1456. [Google Scholar] [CrossRef]
  5. Galtarossa, A.; Palmieri, L. Measure of twist-induced circular birefringence in long single-mode fibers: Theory and experiments. IEEE J. Lightwave Technol. 2002, 20, 1149–1159. [Google Scholar] [CrossRef]
  6. Tanemura, T.; Kikuchi, K. Circular-birefringence fiber for nonlinear optical signal processing. IEEE J. Lightwave Technol. 2006, 24, 4108–4119. [Google Scholar] [CrossRef]
  7. Benedetto, S.; Poggiolini, P.T. Multilevel Polarization Shift Keying: Optimum Receiver Structure and Performance Evaluation. IEEE Trans. Commun. 1994, 42, 1174–1186. [Google Scholar] [CrossRef]
  8. Betti, S.; Curti, F.; De Marchis, G.; Iannone, E. A Novel Multilevel Coherent Optical System: 4-Quadrature Signaling. IEEE J. Lightwave Technol. 1991, 9, 514–523. [Google Scholar] [CrossRef]
  9. Betti, S.; Curti, F.; De Marchis, G.; Iannone, E. Multilevel coherent optical system based on Stokes parameters modulation. IEEE J. Lightwave Technol. 1990, 8, 1127–1136. [Google Scholar] [CrossRef]
  10. Perrone, P.; Betti, S.; Rutigliano, G.G. Optical communication system for high-capacity LAN. Microw. Opt. Technol. Lett. 2016, 58, 389–393. [Google Scholar] [CrossRef]
  11. Bayvel, P.; Maher, R.; Xu, T.; Liga, G.; Shevchenko, N.A.; Lavery, D.; Alvarado, A.; Killey, R.I. Maximizing the optical network capacity. Philos. Trans. R. Soc. A 2016, 374, 20140440. [Google Scholar] [CrossRef] [PubMed]
  12. Semrau, D.; Xu, T.; Shevchenko, N.A.; Paskov, M.; Alvarado, A.; Killey, R.I.; Bayvel, P. Achievable information rates estimates in optically amplified transmission systems using nonlinearity compensation and probabilistic shaping. Opt. Lett. 2017, 42, 121–124. [Google Scholar] [CrossRef] [PubMed]
  13. Perrin, F. Etude mathématique du mouvement Brownien de rotation. In Annales Scientifiques de L’école Normale Supérieure; Gauthier-Villars et Cle, Editeurs: Paris, France, 1928; Volume 45, pp. 1–51. [Google Scholar]
  14. Betti, S.; De Marchis, G.; Iannone, E. Polarization modulated direct detection optical transmission systems. IEEE J. Lightwave Technol. 1992, 10, 1985–1997. [Google Scholar] [CrossRef]
  15. Papoulis, A. Probability, Random Variables and Stochastic Processes, 3rd ed.; McGraw-Hill: New York, NY, USA, 1991. [Google Scholar]
  16. Wai, P.K.A.; Menyuk, C.R. Polarization decorrelation in optical fibers with randomly varying birefringence. Opt. Lett. 1994, 19, 1517–1519. [Google Scholar] [CrossRef] [PubMed]
  17. Agrell, E.; Karlsson, M. Power efficient modulation formats in coherent transmission systems. IEEE J. Lightwave Technol. 2009, 27, 5115–5126. [Google Scholar] [CrossRef]
  18. Winzer, P.J.; Essiambre, R.J. Advanced optical modulation formats. Proc. IEEE 2006, 94, 952–985. [Google Scholar] [CrossRef]
  19. Proakis, J.G. Digital Communications, 2nd ed.; McGraw-Hill: New York, NY, USA, 1989. [Google Scholar]
  20. Simon, A.; Ulrich, R. Evolution of polarization along a single mode fiber. Appl. Phys. Lett. 1977, 31, 517–520. [Google Scholar] [CrossRef]
Figure 1. Spatial evolution of the States of Polarization (SOPs) in a twisted fiber.
Photonics 04 00005 g001
Figure 2. Spatial evolution of the SOPs in a twisted fiber.
Photonics 04 00005 g002
Figure 3. Top view of the spatial evolution of a circular SOP.
Photonics 04 00005 g003
Figure 4. Mean S3 pdf for different distances.
Photonics 04 00005 g004
Figure 5. S3 variance versus the propagation distance.
Photonics 04 00005 g005
Figure 6. Mean S3 pdf for different twisting values.
Photonics 04 00005 g006
Figure 7. S3 variance versus the twist rate.
Photonics 04 00005 g007
Figure 8. Mean S3 pdf: (a) comparison between equatorial and elliptical SOPs, (b) comparison between equatorial, elliptical and circular SOPs.
Photonics 04 00005 g008
Figure 9. Perrin’s pdf and simulated pdfs for a linear SOP.
Photonics 04 00005 g009
Figure 10. Perrin’s pdf and simulated pdfs for a circular SOP.
Photonics 04 00005 g010
Figure 11. Comparison between Multilevel-Polarization Shift Keying (M-PolSK) [7] and 5-PolSK.
Photonics 04 00005 g011
Figure 12. Comparison between Polarization Modulated Direct Detection (PM-DD) [14] and 5-PolSK.
Photonics 04 00005 g012
Table 1. Symbols in the Stokes Space.
N S 1 S 2 S 3
1001
20 2 / 2 2 / 2
3010
40 2 / 2 2 / 2
500−1
Table 2. Distance Matrix for the 5-PolSK Bands Modulation.
N12345
100.765 2 1.8472
20.76500.765 2 1.847
3 2 0.76500.765 2
41.847 2 0.76500.765
521.847 2 0.7650

