Article

Characterization of a Supersonic Plasma Jet by Means of Optical Emission Spectroscopy

1
Dipartimento di Fisica G. Occhialini, Università degli Studi di Milano-Bicocca, Piazza della Scienza 3, 20126 Milano, Italy
2
Department of Physics, Faculty of Education, Ain Shams University, Cairo 11566, Egypt
*
Author to whom correspondence should be addressed.
Photonics 2025, 12(6), 595; https://doi.org/10.3390/photonics12060595
Submission received: 1 May 2025 / Revised: 3 June 2025 / Accepted: 4 June 2025 / Published: 10 June 2025

Abstract

We discuss an innovative thin film deposition method, Plasma Assisted Supersonic Jet Deposition, which combines the chemistry richness of a reactive cold plasma environment and the assembly control of the film growth allowed by a supersonic jet directed at the substrate. Optical Emission Spectroscopy was used to characterize the plasma state and the supersonic jet, together with its interaction with the substrate. We obtained several results in the deposition of silicon oxide thin films from Hexamethyldisiloxane, with different degrees of organic groups retention. In particular we exploited the features of emission spectra to measure the plasma dissociation and oxidation degree of the organic groups, as a function of the jet parameters. If controlled growth is achieved, such films are nanostructured materials suitable for applications like catalysis, photo catalysis, energy conversion and storage, besides their traditional uses as a barrier or protective coatings.

1. Introduction

Optical Emission Spectroscopy (OES) is a powerful diagnostic for plasmas [1,2,3]. It takes advantage of the presence of energetic particles, which are needed for ionization processes and which sustain the plasma state. Excited states of atoms, molecules and their ions can be easily populated by collisions involving such energetic agents. Those states that can decay radiatively provide the photons that are observed by this technique. Their measurements provide an insight into plasma processes and plasma parameters. Since the lifetimes of many among those excited states can be very short, the method also has the capability of collecting observations in real time. Emissions in the range from the near-UV to the near-IR, broadly extending the visible spectral region, are easy to collect, with relatively simple, manageable and cheap experimental setups. Since plasma emission happens anyway, the diagnostics are inherently nonperturbative. It is also not affected by the presence of magnetic fields, high voltages or radiofrequency electric signals. The only limitation is the availability of transparent ports from which it is possible to collect the light from a suitable set of line-of-views through the plasma. Its main limitation lies in the fact that its information is somewhat indirect, since only a fraction of the plasma component is optically active, and the dynamics of the excitation mechanism can be quite complex.
The control at the nanoscale of the structure of thin films deposited and grown onto material surfaces is considered challenging although rewarding research because of the great relevance of applications, including in electronics, energy, health and the environment [4,5,6,7,8]. It is understood that morphology, structure and grain size of films lead to very different electronic, mechanical and optical properties, also compared with bulk materials [9,10]. So, the properties of many materials can be enhanced by optimizing the assembly process. In particular, an efficient control of the nanoparticle’s formation and interaction during the film growth is required to master complex deposition techniques aimed at a bottom-up approach [10].
Here we discuss the characterization of one such method, Plasma Assisted Supersonic Jet Deposition (PASJD) [11,12,13]. Such deposition techniques are capable of producing thin films with a desired morphology, without sacrificing the deposition process versatility and efficiency in terms of surface area, deposition rate and up-scalability. PASJD combines a reactive plasma for the dissociation of the precursor components with a supersonic jet expanding into vacuum and impinging onto the material surface. These two steps allow both fast deposition rates by using high density plasmas and control of the growth by calibrating the sizes of clusters. Vaporizable and stable monomers could be employed as the source of thin films of oxides, but also semiconductors or metals. The use of a supersonic jet allows tuning the kinetic energy of clusters. In particular, when molecular cluster deposition is performed with supersonic jets, we can have better collimation, stability and control of the crystallinity [11]. By changing the conditions during processing, it is also possible to obtain graded films. It is clear that direct measurements of pressure or velocity would strongly perturb the jet. Particle Image Velocimetry (PIV) [14], Schlieren diagnostics [15] and Mass Spectrometry (MS) [16] are distinct other analytical techniques used to characterize plasma jets. PIV is used to capture the velocity field, and the Schlieren method is used to record regions of different refractive index in a fluid, while the mass spectrometer is useful to determine the density profiles and the chemical composition of the sample [16,17]. The first two cannot collect information about the evolution of the plasma gas phase, whereas the third is quite strongly invasive. However, in the case of a plasma jet, we can take advantage of the fact that molecules in the jet are an intrinsic source of light ready to be collected. So, we can register information about excited states’ densities without disrupting the flow. Accurate measurements require stationary flow emission and minimal jet contamination. More advanced techniques to increase the emitted radiation collection, such as cavity ring-down spectroscopy, could be considered too [18,19].
The aim of this paper is to analyze the deposition process from the oxidation of the precursor in the plasma chamber to the transport within the jet of neutral and ionized molecules reaching the substrate. For this purpose, OES was used, and spectra were analyzed to extract quantitative relations aimed at a better understanding of the plasma and deposition process parameters. We aim to show and to point out the extended range of possibilities that could be exploited through such a diagnosis.

2. Materials and Methods

The PASJD process was performed in a suitable designed reactor. A layout of the relevant experimental setup is shown in Figure 1. A general description of the supersonic plasma jet reactor implementation can be found in our previous works [11]. Here the vacuum chamber consists of a stainless-steel cylinder (200 mm height, 300 mm diameter), which is evacuated by a pumping system (turbomolecular pump, Leybold TW250, S = 250 L/s, a zeolites trap and a rotary pump, Varian SD-300), which can be throttled by a CF100 gate valve, so acting as a variable conductance. The plasma source was a commercial radiofrequency source Copra-GTF (97 mm height, 205/245 mm inner/outer radius by CCR technologies) [20]. The source chamber is separated from the deposition chamber by a 4 mm thick plate where a converging nozzle (7 mm end diameter) was drilled. A quartz window allows one to look at the supersonic jet from one side.
Experiments described here were conducted using oxygen, whose flow is adjusted by using one of two mass-flow controllers (Qmax = 50/500 sccm by Aera), and Hexamethyldisiloxane (O[Si(CH3)3]2, HMDSO), whose flow is controlled by a micrometer graduated valve (EVN-116 by Pfeiffer). The pressures in the plasma and deposition chambers, in Figure 1, named, respectively, Pp and Pd, were monitored using two capacitance pressure gauges. A Pirani and a cold cathode gauge were also used to monitor the pressure inside the plasma and the deposition chamber, above and below the capacitance pressure range. The pressure ratio between the two chambers, R = Pp/Pd, can be varied from 25 to 1 to change the supersonic jet geometry, partially throttling the gate valve over the main pumping group, leaving the pressure in the plasma chamber almost unaffected.
A reactive plasma was generated inside the plasma chamber by using a 13.56 MHz radiofrequency power generator (Cesar 1310 by Advanced Energy). A more detailed description of the source and its operating mode can be found in our previous work [21]. Here we can recall that such inductively coupled plasma provides high and uniform charge densities and, since the electrodes are not in contact with the plasma, the contamination by sputtered products is kept low.
The main purpose of the reactor was the deposition of silica-like thin films aimed at industrial-scale deposition of high-quality, transparent and fitting coatings [22,23]. SiO2-like films deposited by plasma polymerization were first developed for microelectronics [24]. Since then, they have been applied also as protective coatings in packaging [25,26,27]. The most effective path was to start with organosilicon compounds as precursors, like HMDSO mixed with O2 and/or noble gases [28].
Polyethylene terephthalate (PET) in sheets (biaxial oriented, thickness 0.013/0.05/0.1 mm, by GoodFellows Gmbh) was used as a substrate. The choice was indicated since it is a suitable polymer, widely used and about which a rich literature in plasma processing already exists [29,30]. Thin films from HMDSO plasmas were easily deposited onto it, with adhesion that we have studied in the past [22]. During some experiments, these PET sheets were attached to a 2 × 4 cm2 tin surface acting as sample holder. The latter was located at different distances from the orifice (10 or 15 mm). However, most experiments have been conducted with no sample holder inside the deposition chamber.
Light emitted from the plasma jet axis was imaged with an achromatic lens (f = 200 mm, by Newport) onto the aperture of a UV enhanced optical fiber (UVIR600, 600 μm diameter, by Avantes). A movable micrometer scanner (by Newport) allows imaging different portions of the jet both radially and axially. Emission spectra were measured by means of a wide band, low-resolution spectrometer (AvaSpec-ULS4096CL by Avantes) equipped with a 10 μm slit, a holographic grating (UA, 300 lines/mm, blazed at 300 nm) and a 4096 pixel CMOS (HAMS-13496). The spectrometer has a resolution of about 0.3 nm and a spectral band extending from 200 to 1300 nm [31]. The spectrometer wavelength sensitivity was calibrated with both a deuterium and halogen lamp by Thorlabs. Calibration was checked against some well-known emitting plasmas, in particular argon discharges for the near-IR and molecular nitrogen for near-UV. This allows correcting for the device sensitivity and obtaining the real relative intensities of emission lines at different wavelengths. The exposure times have been optimized to match the sensitivity while avoiding saturation of the CCD counts. Dark spectra were routinely subtracted to remove noise and ambient light contamination [31].

3. Results and Discussion

3.1. The Supersonic Plasma Jet

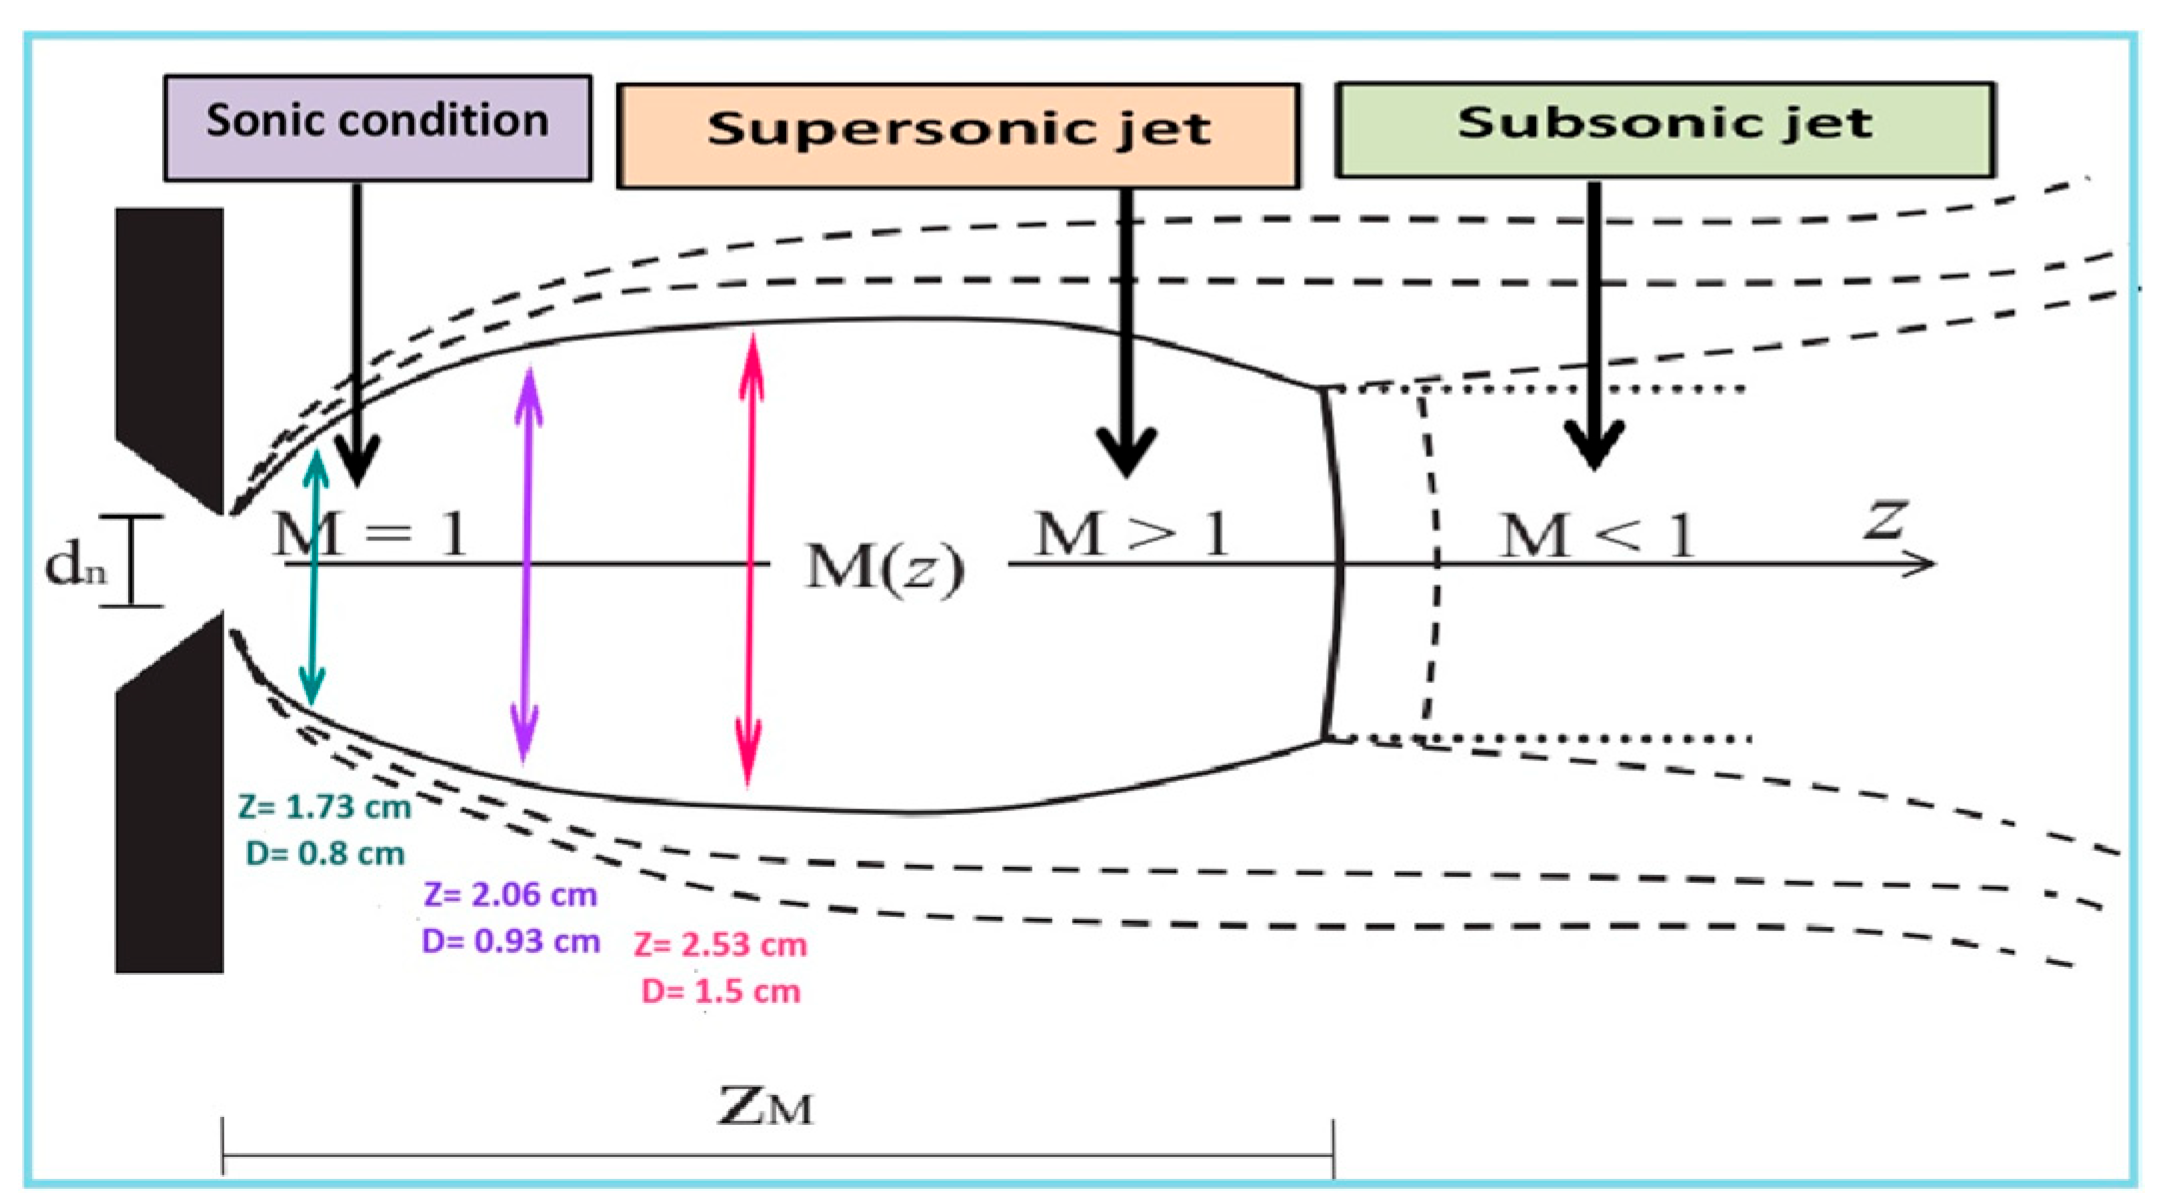
In this section, the theory describing the gas expansion in a supersonic jet is presented. When a gas expands into a vacuum chamber, a free expansion process can occur, which can be approximately modeled as isentropic or adiabatic. The moving gas can form a supersonic jet if specific conditions are met. This expansion happens also when a gas flows through an orifice from a reservoir (at constant temperature and pressure) into a partly evacuated vessel. In this case a supersonic jet is formed if a significant pressure drop occurs across the nozzle. Downstream, the gas thermal energy transforms into fluid flow, causing a decrease in temperature. At the same time, as the distance from the nozzle increases, density and pressure diminish quickly, while the Mach number M, defined by the gas velocity relative to the local speed of sound, rises. A shockwave is formed, separating the region inside the jet from the unperturbed residual gas in the vessel. For a circular orifice such a region is radially symmetric and extends to a few diameters downstream [32,33,34].
The pressure ratio R is the key parameter describing the free expansion of the jet. R signifies the ratio between upstream nozzle pressure (in our setup, the plasma chamber in the Copra source) and downstream pressure away from the jet (in our experiments, the deposition chamber); see Figure 1. According to gas dynamics theory, a supersonic jet is obtained provided that R has a value greater than
R c = γ + 1 2 γ γ 1
where γ is the gas specific heat ratio. The critical Rc value is small. In our experiments using oxygen, R ≥ 1.89 is sufficient. The gas reaches the speed of sound, so M = 1, at the nozzle exit. Then it enters the deposition chamber as an under-expanded free jet, expanding radially and axially. Along the jet, gas molecules accelerate up to a limit axial velocity Vlim, which can be derived from the energy conservation equation [35,36]
V lim = [ 2 γ R T p / ( γ 1 ) m ]
where Tp is the gas temperature in the plasma chamber. The limit velocity of oxygen gas at room temperature is about 730 m/s. The supersonic jet’s geometry is shown in Figure 2. It features a zone of silence where flow is supersonic, confined by oblique and normal shocks. It ends axially at the so called Mach disk. Gas density and speed peak along the symmetry axis (z axis in Figure 2) and decrease radially, separated from the surrounding subsonic region by oblique shocks.
The expansion geometry scales with pressure ratio R, the higher leading to longer jets. Empirical equations can be used to determine Mach disk position ZM and diameter DM, where dn is the orifice diameter [32].
  Z M = 0.67 d n R ,   D M = d n   ( 0.36 R 0.6 0.59 )
In high pressure systems, where the pressure before the Mach disk is lower than the background value, this shift can cause abrupt recompression, restoring background temperature, pressure and density values. For low-pressure conditions, the transition smoothens. If the gas parameters upstream of the nozzle are known, their values along the centerline of the expansion can be estimated. Analytical formulas for Mach number and pressure in the expansion region were obtained within the isentropic flow framework [32] and plotted in Figure 3a,b, valid for z > dn.
M ( z ) = A Z Z 1 d n γ 1 1 2 γ + 1 γ 1 [ A Z Z 1 d n γ 1 ]   1 + B [ Z Z 1 d n γ 1 ] 3
  P ( z ) P p = A 2 / ( γ 1 ) .       γ + 1 γ 1 γ / ( γ 1 ) .   γ + 1 2 γ 1 γ 1 .     ( z z 2 d n ) 2
where A = 3.65, B = 0.20, z1 = 0.4 × dn, z2= 0.13 × dn and γ = 1.4 for diatomic gases, like oxygen. If the upstream pressure is known, the centerline expansion pressure can be estimated using Equation (5). This equation is valid for z > dn, allowing derivation of a density relation with axial position z based on rapid and inviscid gas expansion. From the standard adiabatic relation, we can define the gas density profile [32]. In Figure 3 we show the plots of such formulas for our experimental setup. This description applies mainly to a continuum regime, where the gas is described using fluid equations. At very low pressures, limited gas particle interaction occurs along the jet, making shock regions smoother or vanish. A critical parameter, the Knudsen number Kn, compares gas mean free path to system length scale. Kn below 0.1 indicates continuum flow, and Kn above 1 signifies molecular flow, with transitional regimes in-between. For a plasma chamber with a height of 100 mm, Kn is estimated at 0.009. In the silence zone, Kn varies from 0.1 to 1 along the z axis due to different gas pressures, leading to a transitional regime and thickening of the Mach disk with longer gas mean free paths. The system length after the supersonic jet is around the vacuum vessel radius (160 mm), with a transitional regime where the Knudsen number ranges from 0.2 to 0.03, depending on the chamber pressure. After the Mach disk, if the gas is not fully expanded, the pressure/density trend toward background values through a quadratic trend as particles freely expand in all directions subsonically. The density along the z axis can be joined to that before the disk using a suitable coefficient.
n z = n d + C Z 2
where nd represents the background density in the deposition chamber [32].
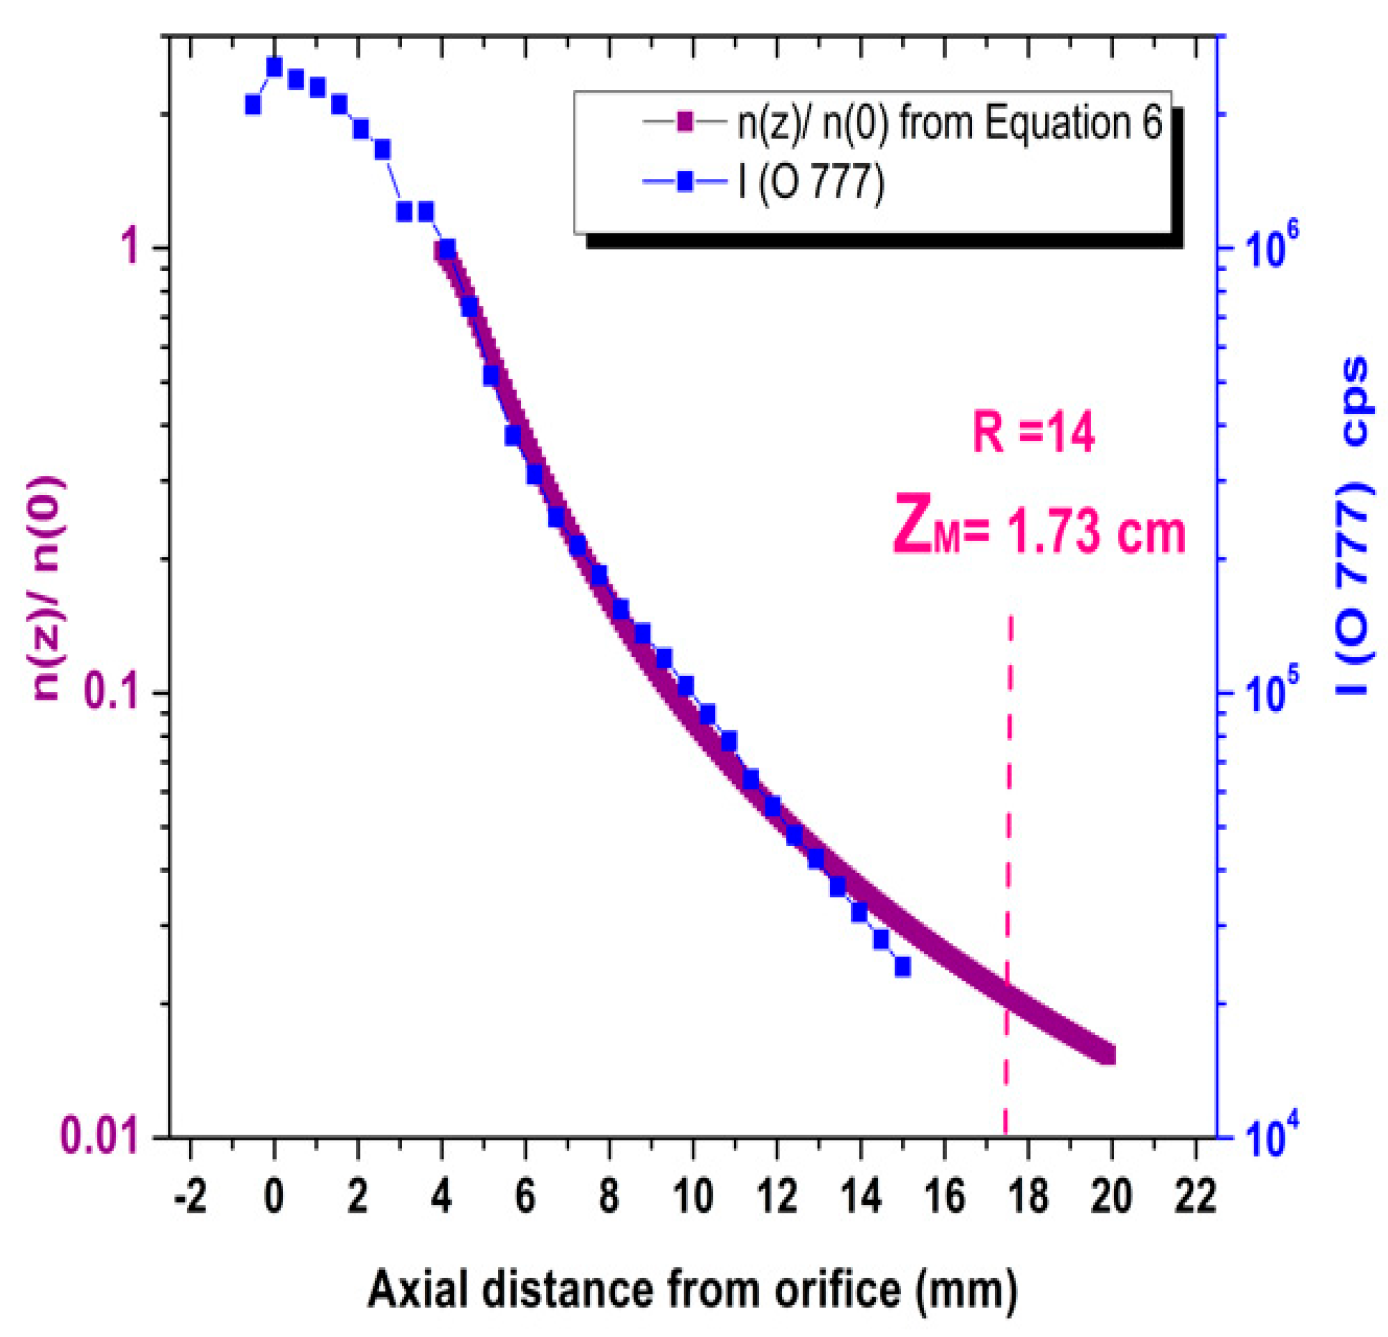
So, how does Optical Emission Spectroscopy (OES) enter into this? As explained above, we collected emission spectra of light coming from view lines focused on small spots along the jet axis. Figure 4 shows the result of such an exercise. Here the intensity of the atomic oxygen line at 777 nm is plotted. This is one of the most prominent features of oxygen plasma emission. It comes from the de-excitation of an excited state of atomic oxygen. It arises from a 2s22p33p/5P excited energy level with an energy of 10.74 eV. Its radiative lifetime is 2.71 × 10⁻⁸ s; so, even at the maximum jet speed locations, such atoms have moved only a few tens of microns. In this respect, the intensity profiles could be transformed easily into excited density profiles and, moreover, if the excitation mechanisms are understood, into profiles of the exciting agents. In such discharges this directly points to high-energy electrons and dissociated oxygen atoms in the plasma gas phase. Even though that could be a quite tantalizing if, this demonstrates the diagnostics power and the insight into the plasma that it could provide.
Figure 4 shows a comparison between the experimental measurements for the O 777 nm line intensity and the theoretical results for the oxygen density estimated from Equation (6). For the scale on the right of Figure 4, our experimental condition where a free expanding jet is created, the gas is expanding freely from the orifice into a partially evacuated vessel. So, the gas undergoes a supersonic free jet expansion, as discussed above. So, the molecules are isentropically accelerated, forming a two-dimensional jet structure. The gas thermal energy is quickly converted into fluid flow while the temperature decreases. It is clear that this formula is consistent with our experiment. From Figure 4, as we move 7 mm from the orifice, gas density from the left scale reduces to about one tenth. At 4 mm from the orifice on the right scale, the O 777 nm line intensity decreases more rapidly than theory predicts, showing stronger exponential decay. For atomic/ionic species not in Figure 4, intensity drops where the jet is supersonic, following the isentropic law. This finding aligns with prior research [16] analyzing the axial profile of O2/Ar plasma with a mass spectrometer.

3.2. The Copra Plasma Source

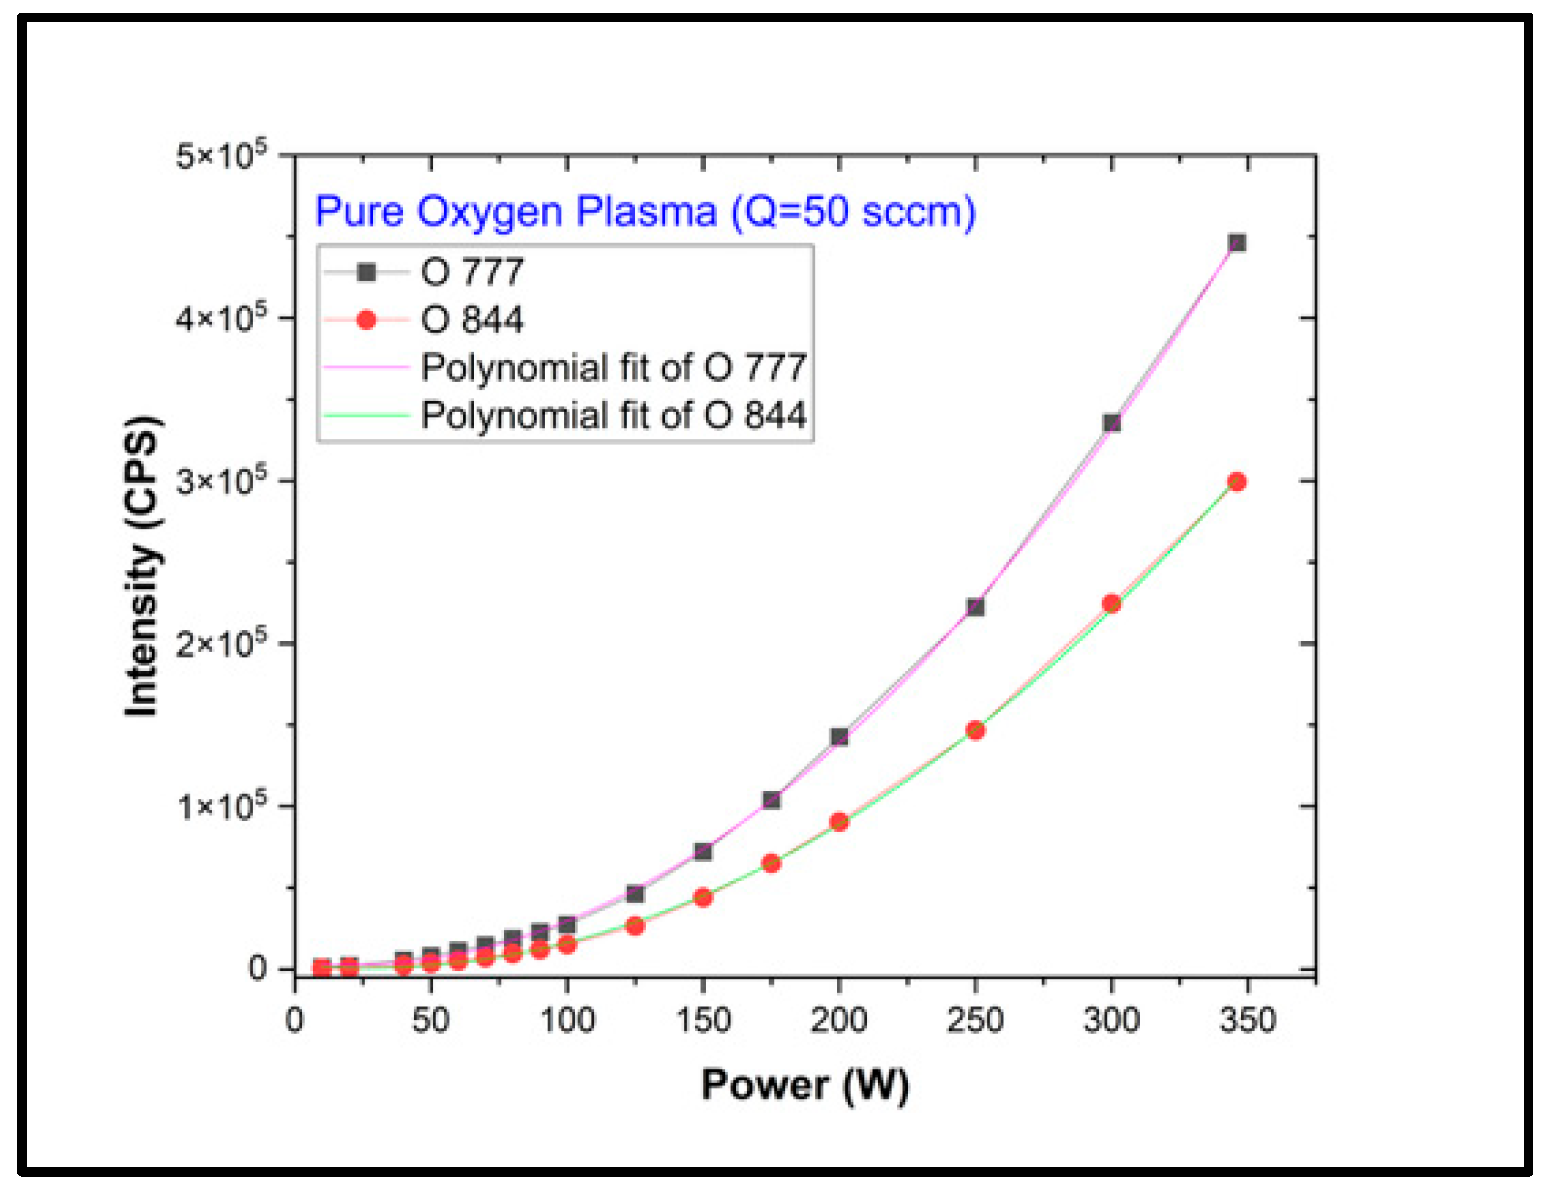
A preliminary analysis was performed collecting the spectra from the plasma region chamber using a fiber optics vacuum feed-through. The spectra embody emissions from a large portion of the plasma, and we have not undertaken the aim to study its uniformity or distribution with respect to the electrodes. More information about the plasma source can be found in our previous works [21]. Quantitative analysis was conducted on the intensity variations of specific emission lines associated with atomic and ion molecular oxygen species present in the plasma, which we discuss more specifically below [37,38,39,40]. In Figure 5 we present the intensities of two atomic oxygen lines as a function of RF power W up to the maximum of 350 W.
The rise appears as uniform, without any sharp transition, which is sometimes observed in the switch between the E/H modes [41,42]. A polynomial fit reproduces the growth well, which turns out to be nicely parabolic. As we stated above, such plots can be translated into excited state populations and mediately into exciting agent’s properties. For our purpose, it is sufficient to point out that the quadratic rise is consistent with a picture of the global discharge properties where electron density is somewhat proportional to the power level, as well as the density of atomic oxygen created by impact dissociation of the parent molecules. No strong changes to the high energy tail of the electron distribution could be assessed by the smooth rising curves. Details of the emission spectra however could and should be used to pin down the parameters of a suitable detailed model of such discharges. In fact, even at a quite basic level of analysis, the fits to the two-emission line intensity are similar but different, well above the experimental errors. A closer look reveals that their ratio is not constant, but the 844 nm line intensity growth gradually becomes steeper up to 250 W of power. At a higher power level, the ratio reaches its maximum, and it saturates. Since their photons come from two nearby but not coincident excited levels of the oxygen atoms, small details in their excitation pattern are changing, whether in the electron energy distribution or, more subtly, in the quenching power from other minority species. In the subsequent subsection we will discuss more extensively the handles that OES gives to the curious investigator of the plasma jet. A similar trend was reported for the other less intense emission lines in the spectra, identified as due to radiative de-excitation of other atomic oxygen and molecular oxygen ions.
The main alien component In the spectra is the well-known Hα emission line of atomic hydrogen. This possibly originates from the outgassing of water vapor and other contaminants from the reactor walls and electrodes. This could help explain this somewhat peculiar trend. Its intensity ratio with atomic oxygen lines rises at low power levels, then decreases and restarts, growing again up to the largest power.

3.3. The Plume

It is time to return to the main theme of our research. We investigated in more detail the shape and the emissivity distribution in the plasma jet. Visual inspection of the discharge outside the orifice shows a glowing plume extending from it, at first look symmetric around the axis perpendicular to the orifice plane. Figure 6 and Figure 7 display the intensity profile of the 777 nm emission line.
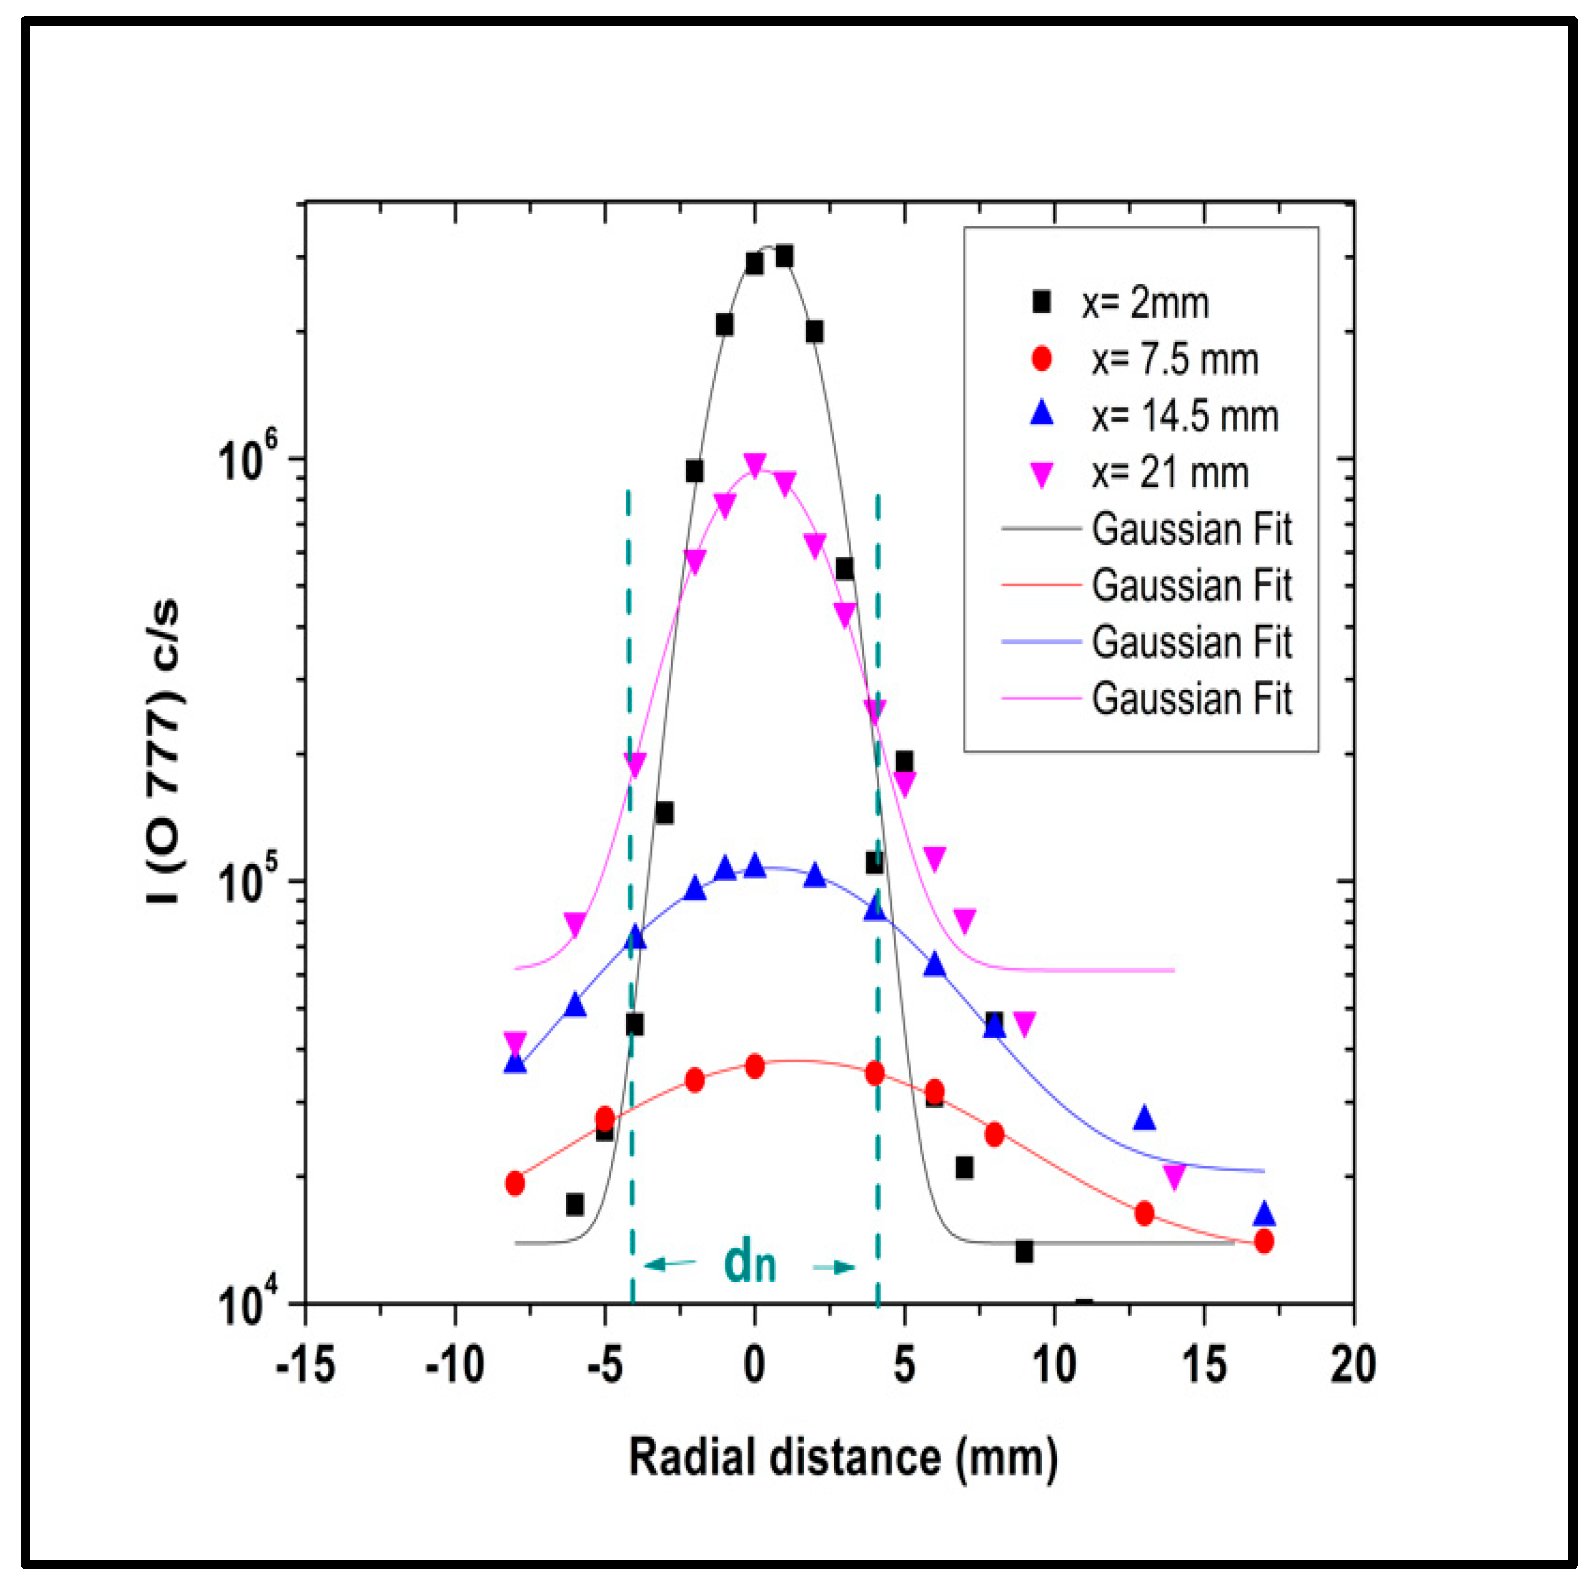
In Figure 6, three axial profiles are depicted under different conditions. The first profile shows the experiment conducted without the sample holder in the deposition chamber. The other two profiles were obtained using the sample holder at two distances (10 and 15 mm from the orifice) within the silence region before reaching the Mach disk in a free expanding jet. In Figure 4, a free expanding jet forms when no sample holder is used. This allows gas to expand freely from the orifice, leading to isentropic acceleration and the formation of a two-dimensional free jet structure. The emission line intensity decreases exponentially, appearing linear on the logarithmic scale in Figure 6, as it nears the Mach disk location. The sample holder interposition mainly flattens the profile near the orifice, followed by a sharp decay to a nearly flat step along the sample holder surface. The transition zone is located around two-thirds of the distance from the orifice, indicating the presence of an interposed surface creating a bow shock before impacting the main surface as expected [36,43]. Again, OES enables non-invasive study of plume shape and position. Figure 7 shows the emission line intensity radial distribution from the expanding jet plume at four different axial distances from the orifice (x = 2, 7.5, 14.5, 21 mm).
Although the farthest position lies outside the Mach disk location, the plume profile shows little difference, indicating a smooth transition beyond the silence zone. The fitted curves shown in Figure 7 demonstrate that the radial profiles of the O 777 nm emission line intensity exhibit a Gaussian distribution, with highest values aligned to the jet centerline. The profile widths (σ = 2.1, 3.0, 6.5 and 8.7 mm) increase outwards, while their maxima decrease. The literature offered limited insight on the radial profile under these plasma conditions. Based on past research, see Ref. [32], the peak impact pressure outside the shock barrel decreases compared to the centerline pressure. Finally, although data reported in Figure 4, Figure 5, Figure 6 and Figure 7 show the measured counting rate from the spectrometer, it could be possible to translate them into an absolute emissivity value. To this purpose we recall that after calibration, as discussed in Section 2, 1 count/s at 777 nm corresponds to 3.48 nW/m2.s. This is obviously the view-line integrated value. Assuming then a symmetry of the radial profile, for different directions perpendicular to the jet axis, it is possible to extract the emissivity along the axis and its radial profile by techniques such as Abel inversion [31,44].

3.4. Optical Emission Spectroscopy of Oxygen Plasma Jet

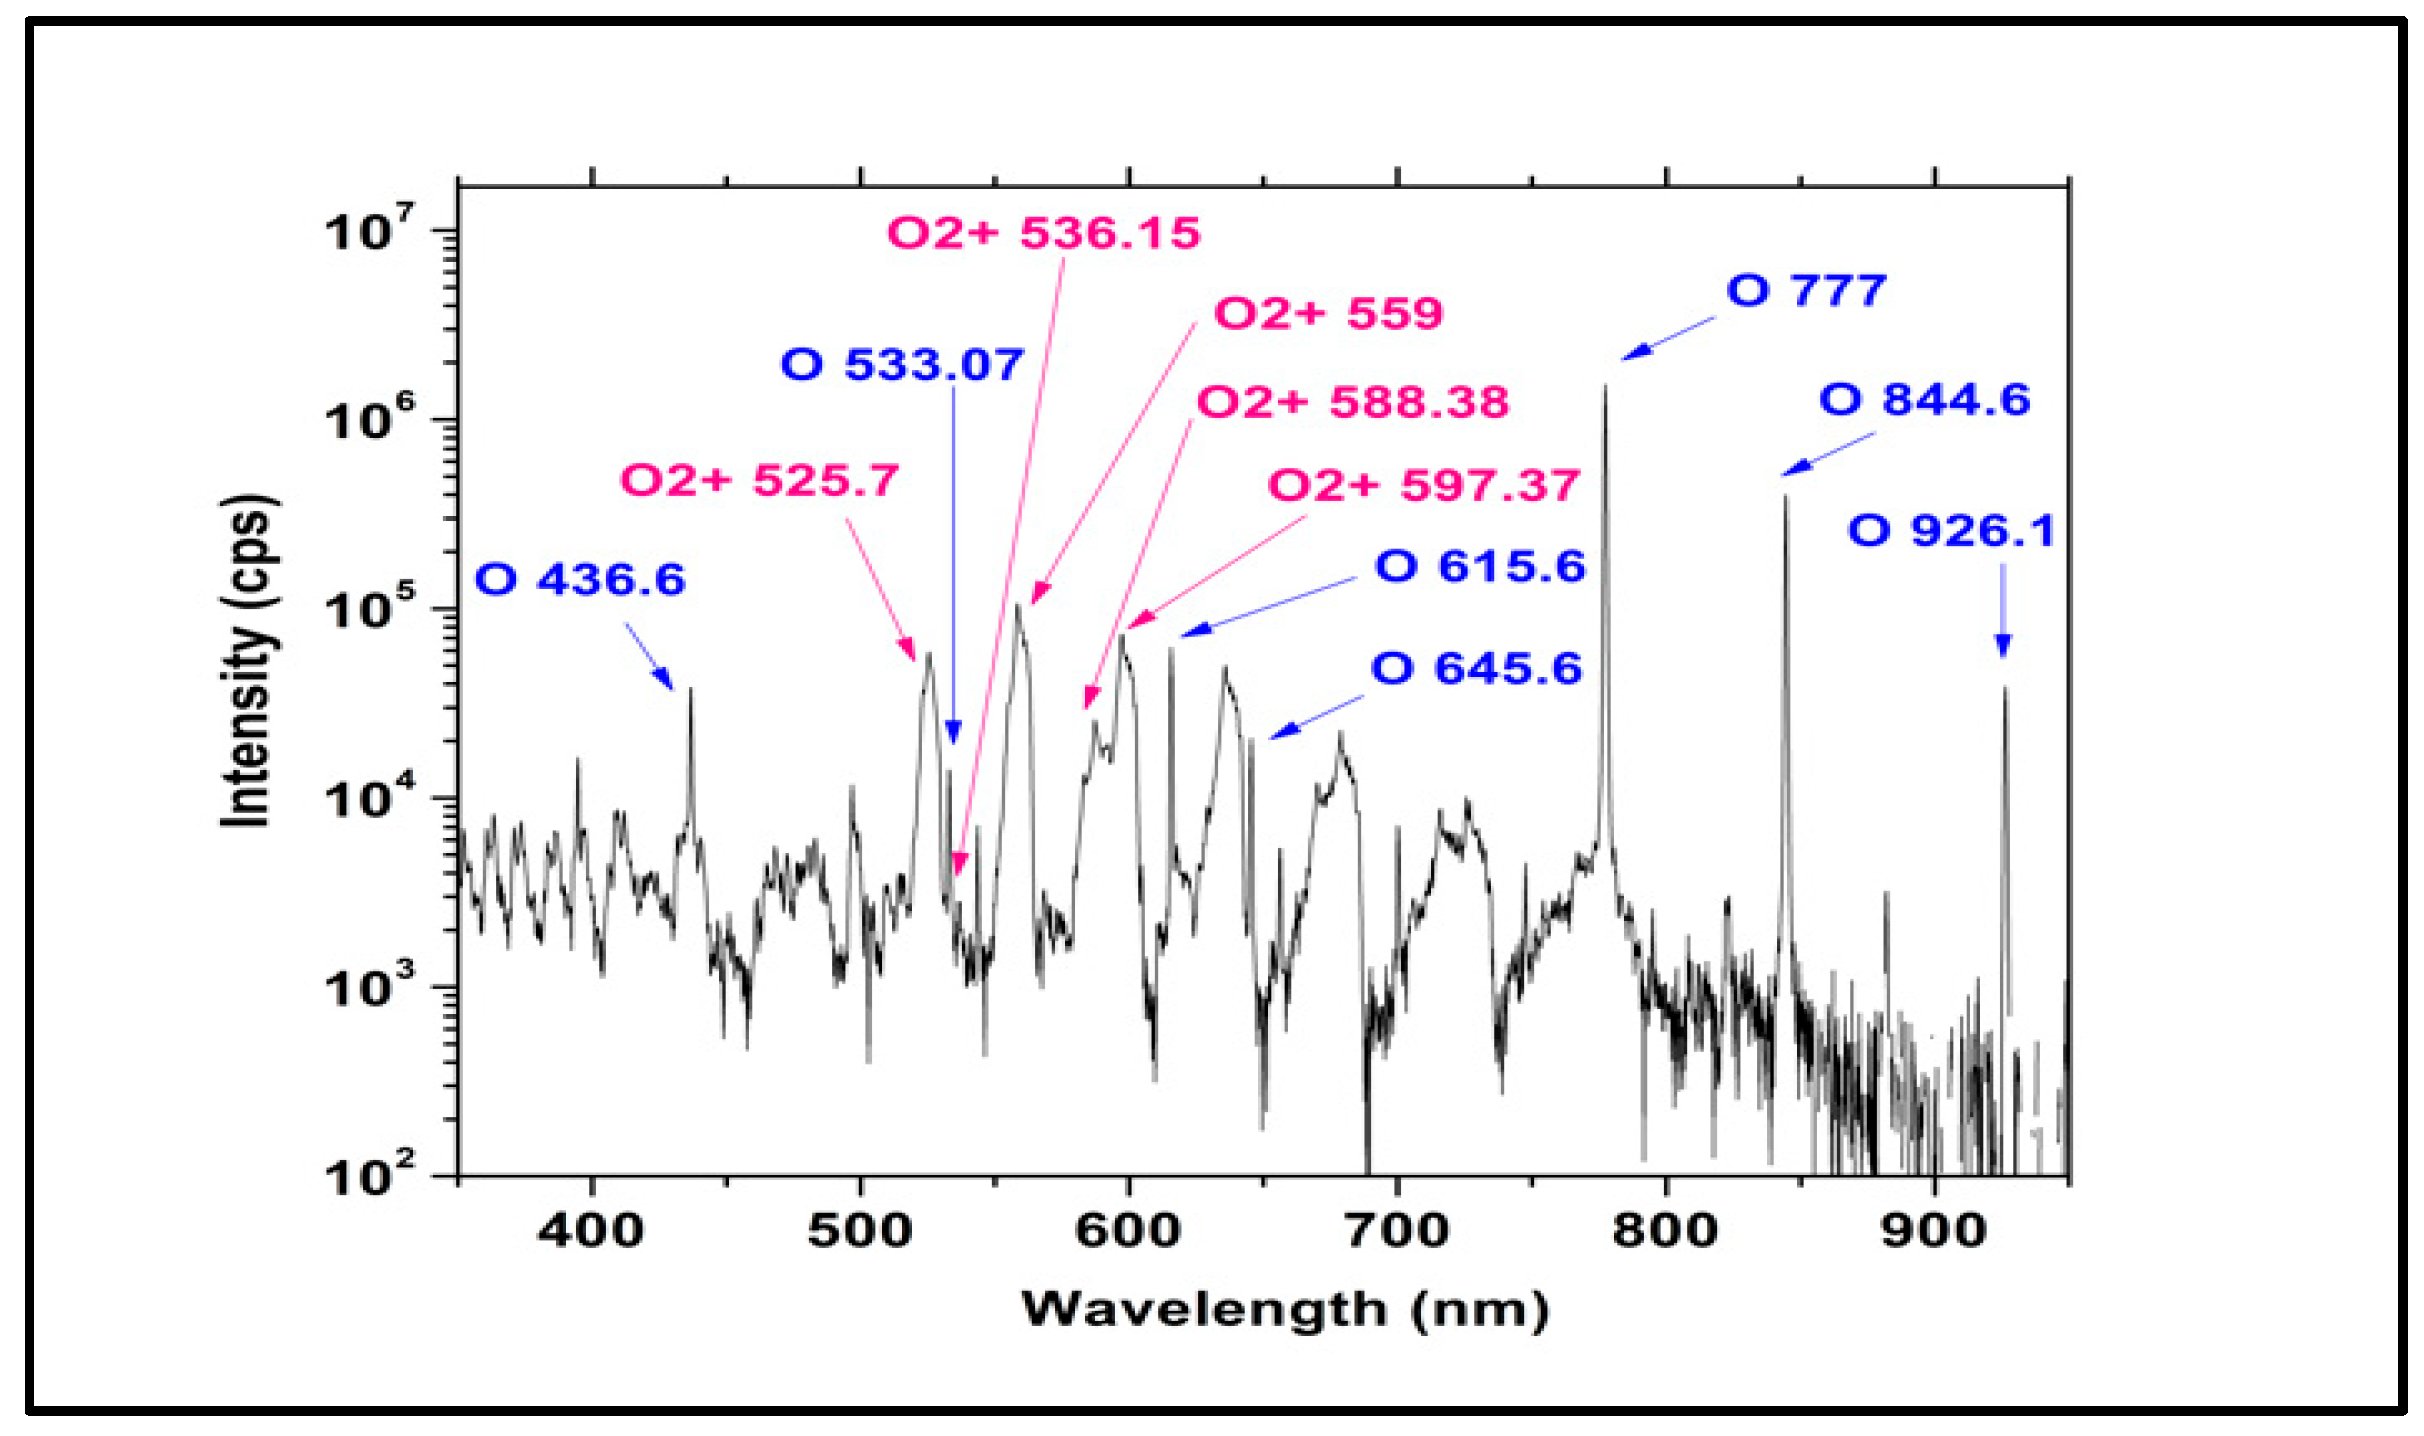
A typical UV/Vis/MIR emission spectrum collected by our OES detection system from an oxygen plasma jet is shown in Figure 8. Although it depicts the spectrum range from 180 to 1300 nm, the emissivity is limited to 300–930 nm. Thanks to the relatively simple gas plasma chemistry, the identification of the emission lines and bands is somewhat simplified, highlighting both atomic and molecular excited states optically active in oxygen discharges. The main feature of the spectra, with the highest intensities, corresponds to the emission lines at wavelengths of 777 nm and 844 nm, both emitted by atomic oxygen transitions (from 2s22p33p 5P and 3P states). The population of such relatively high energy levels, about 11 eV, indicates the presence of high-energy particles able to excite them. Their dominance indicates a substantial dissociation of molecular O₂ into atomic O. As we discussed above, they are excited very near to the emitting point, hinting at the transport and diffusion of the plasma state well within the plume. They could be excited from a ground state or lower lying atomic oxygen states or directly in the impact dissociation of the parent oxygen molecule. As discussed above, the emissivity dependence from the power level possibly favors the first mechanism. This should apply also for the plume, where, being outside the nozzle, the radiofrequency electric field heating electrons should be less intense and efficient. A better inspection of the spectra uncovers the weaker emission lines from several other atomic oxygen states, as reported in Table 1 [37]. In particular, we observe the decay from at least seven different excited levels of atomic oxygen, above 10 eV, with quite short lifetimes. The wavelengths of the electromagnetic radiation emitted in the decays span the Visible to NIR range.
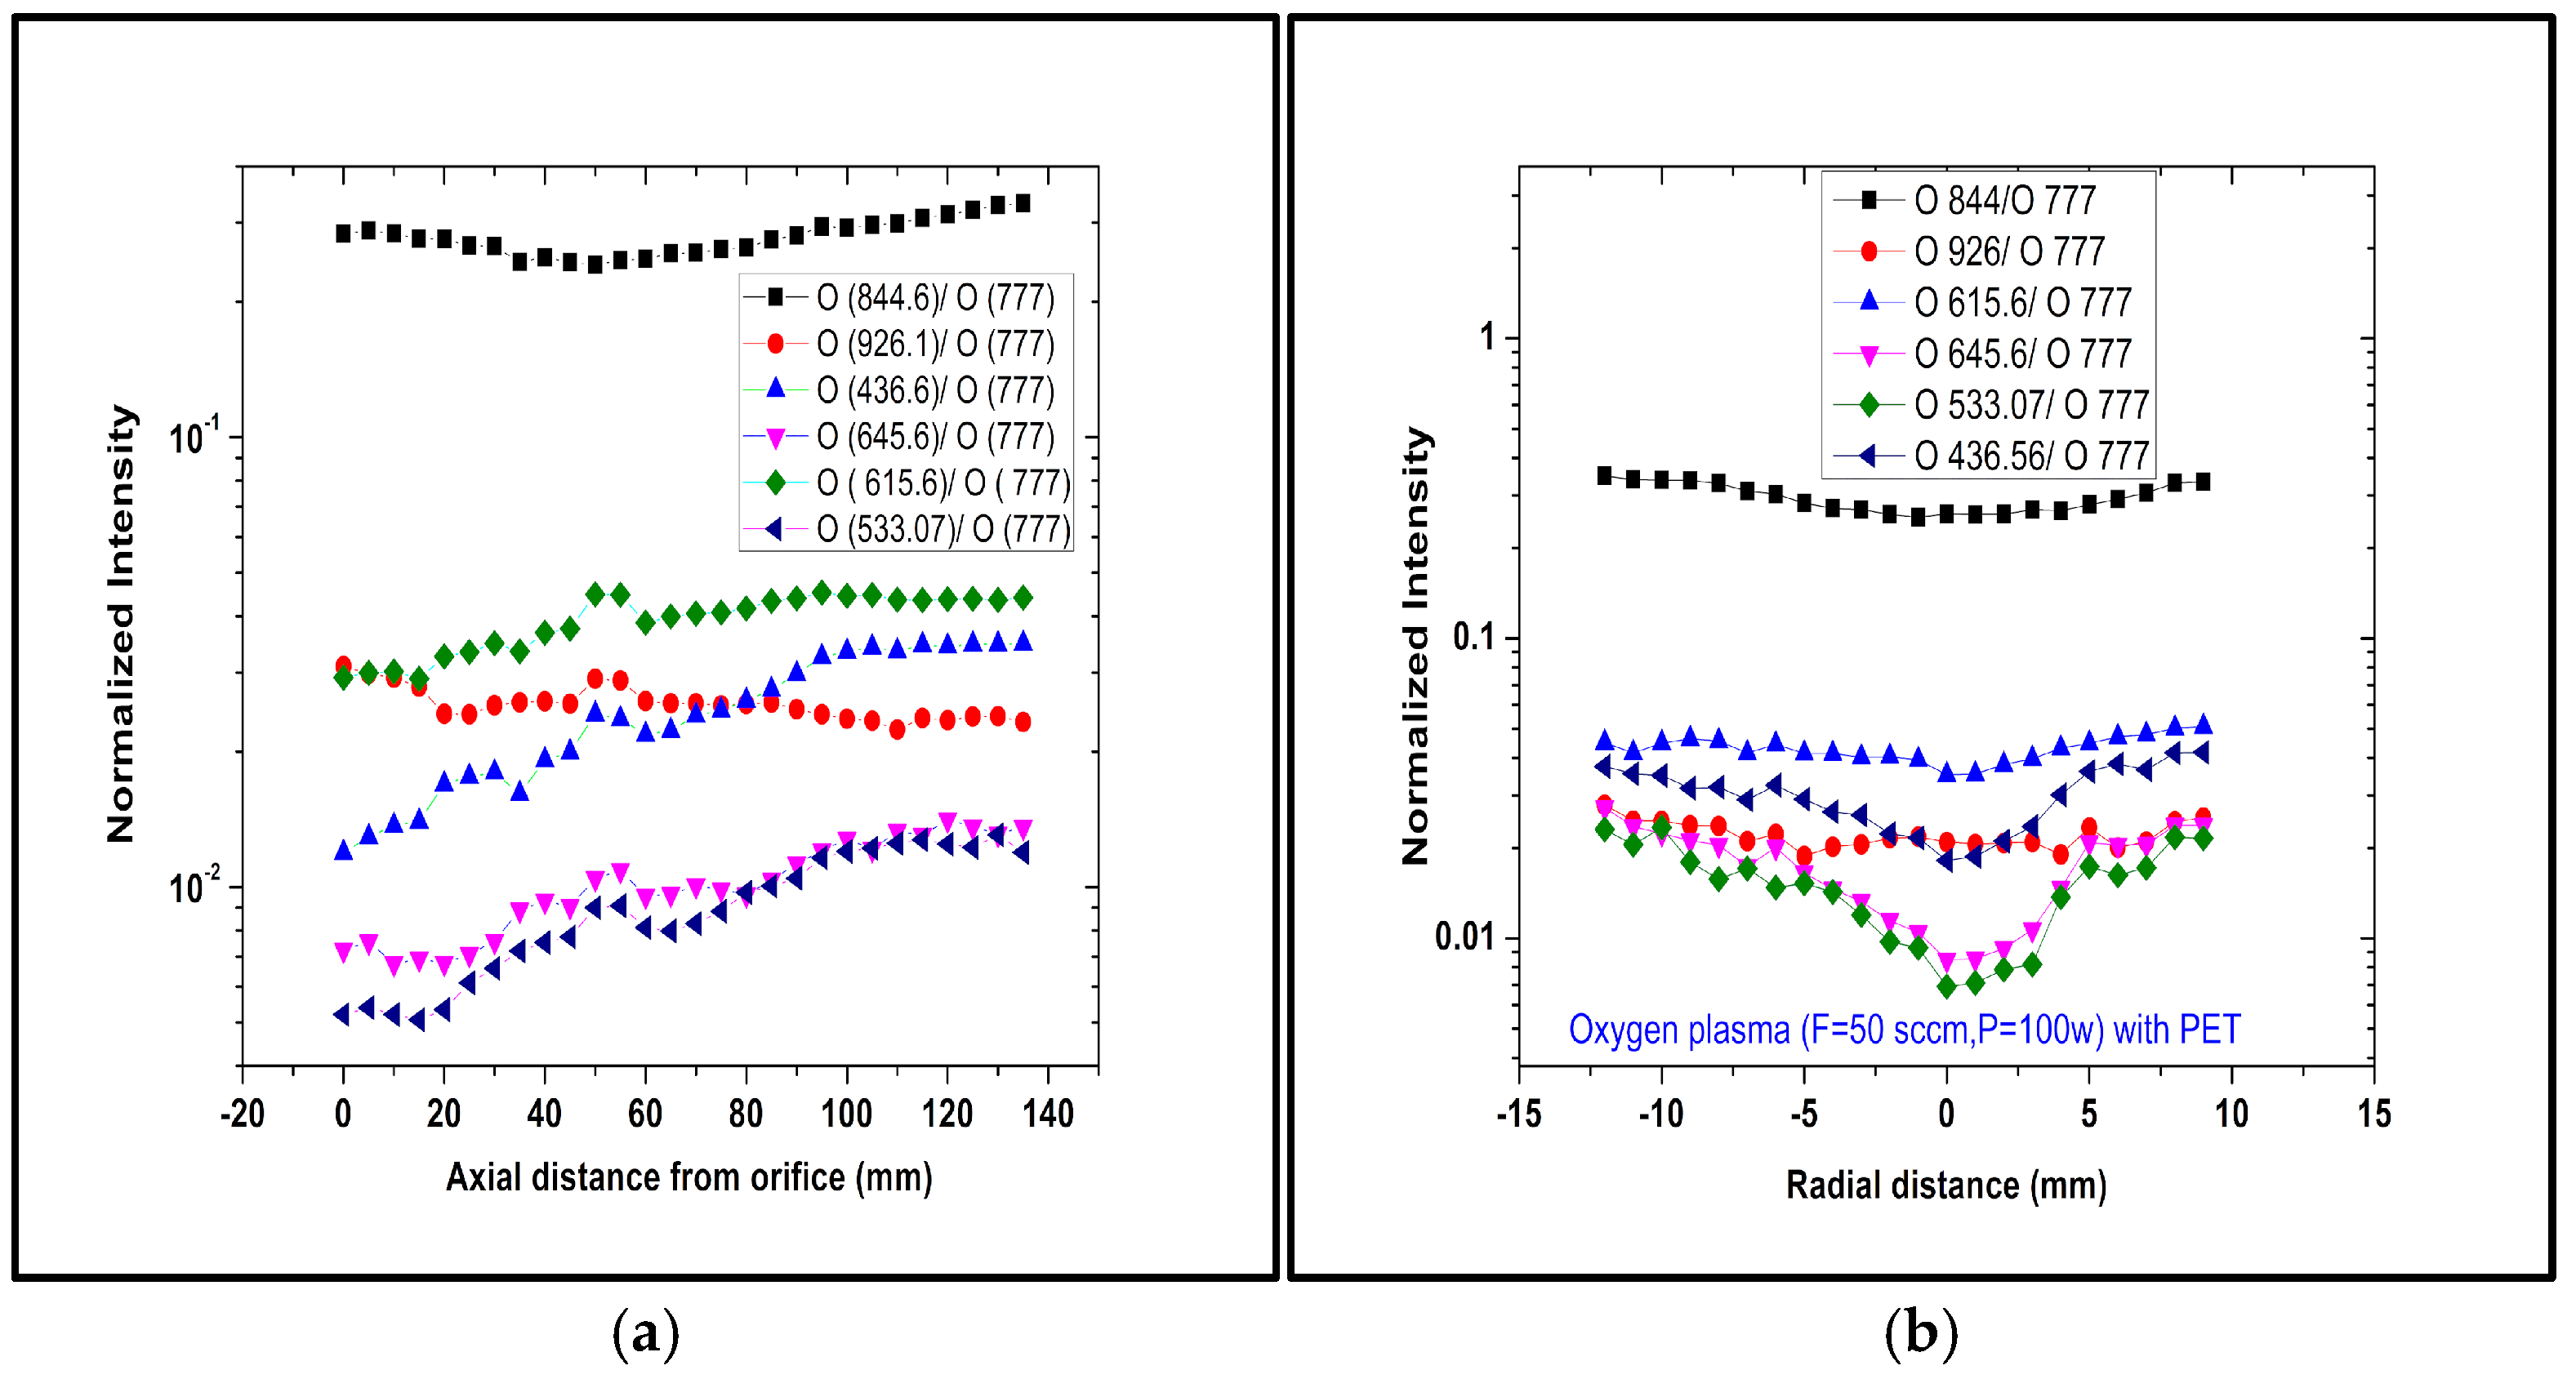
Again, data reported in Figure 8 show the measured counting rate from the spectrometer, and this was used to evaluate the intensity ratios displayed in Figure 9. They can be corrected to take into account the absolute calibration for each wavelength. After this, they can be used to extract the emissivity profiles, as well as the density of excited states (considering the different transition rates) along the jet axis, for each spectral line, as recalled above. This effort will be undertaken whether or not a radiative model becomes available, as we wish and strongly advocate for, through our present work. Figure 9 shows the normalized intensity of different atomic oxygen lines recorded in the spectra with respect to the main dominant one at 777 nm as a function of the plume’s axial and radial coordinates, respectively. For simplicity’s sake, what is provided here in these figures are the ratios calculated from our raw intensity data.
However, already from these data we get the information that the intensity of the atomic O (844.6) line is almost constant with respect to the O (777.4) through the axial and radial profiles. On the contrary, the normalized intensity for the other emission lines, O (926.3), O (615.7), O (645.6), O (533.1) and O (436.8) are changing both along the z and the r directions. For the axial profile, atomic ion weight increases almost linearly from the point at the orifice. Then the rise is interrupted and becomes somewhat smaller. For the radial profile, ratios are minimal when crossing the jet axis and somewhat symmetrical at both sides. The most evident trend corresponds to lines emitted from the highest-lying excited states. This clearly points towards some spatial structure also in the energy distribution of the exciting agents, presumably the high-energy electrons in the tail of the EEDF [45].
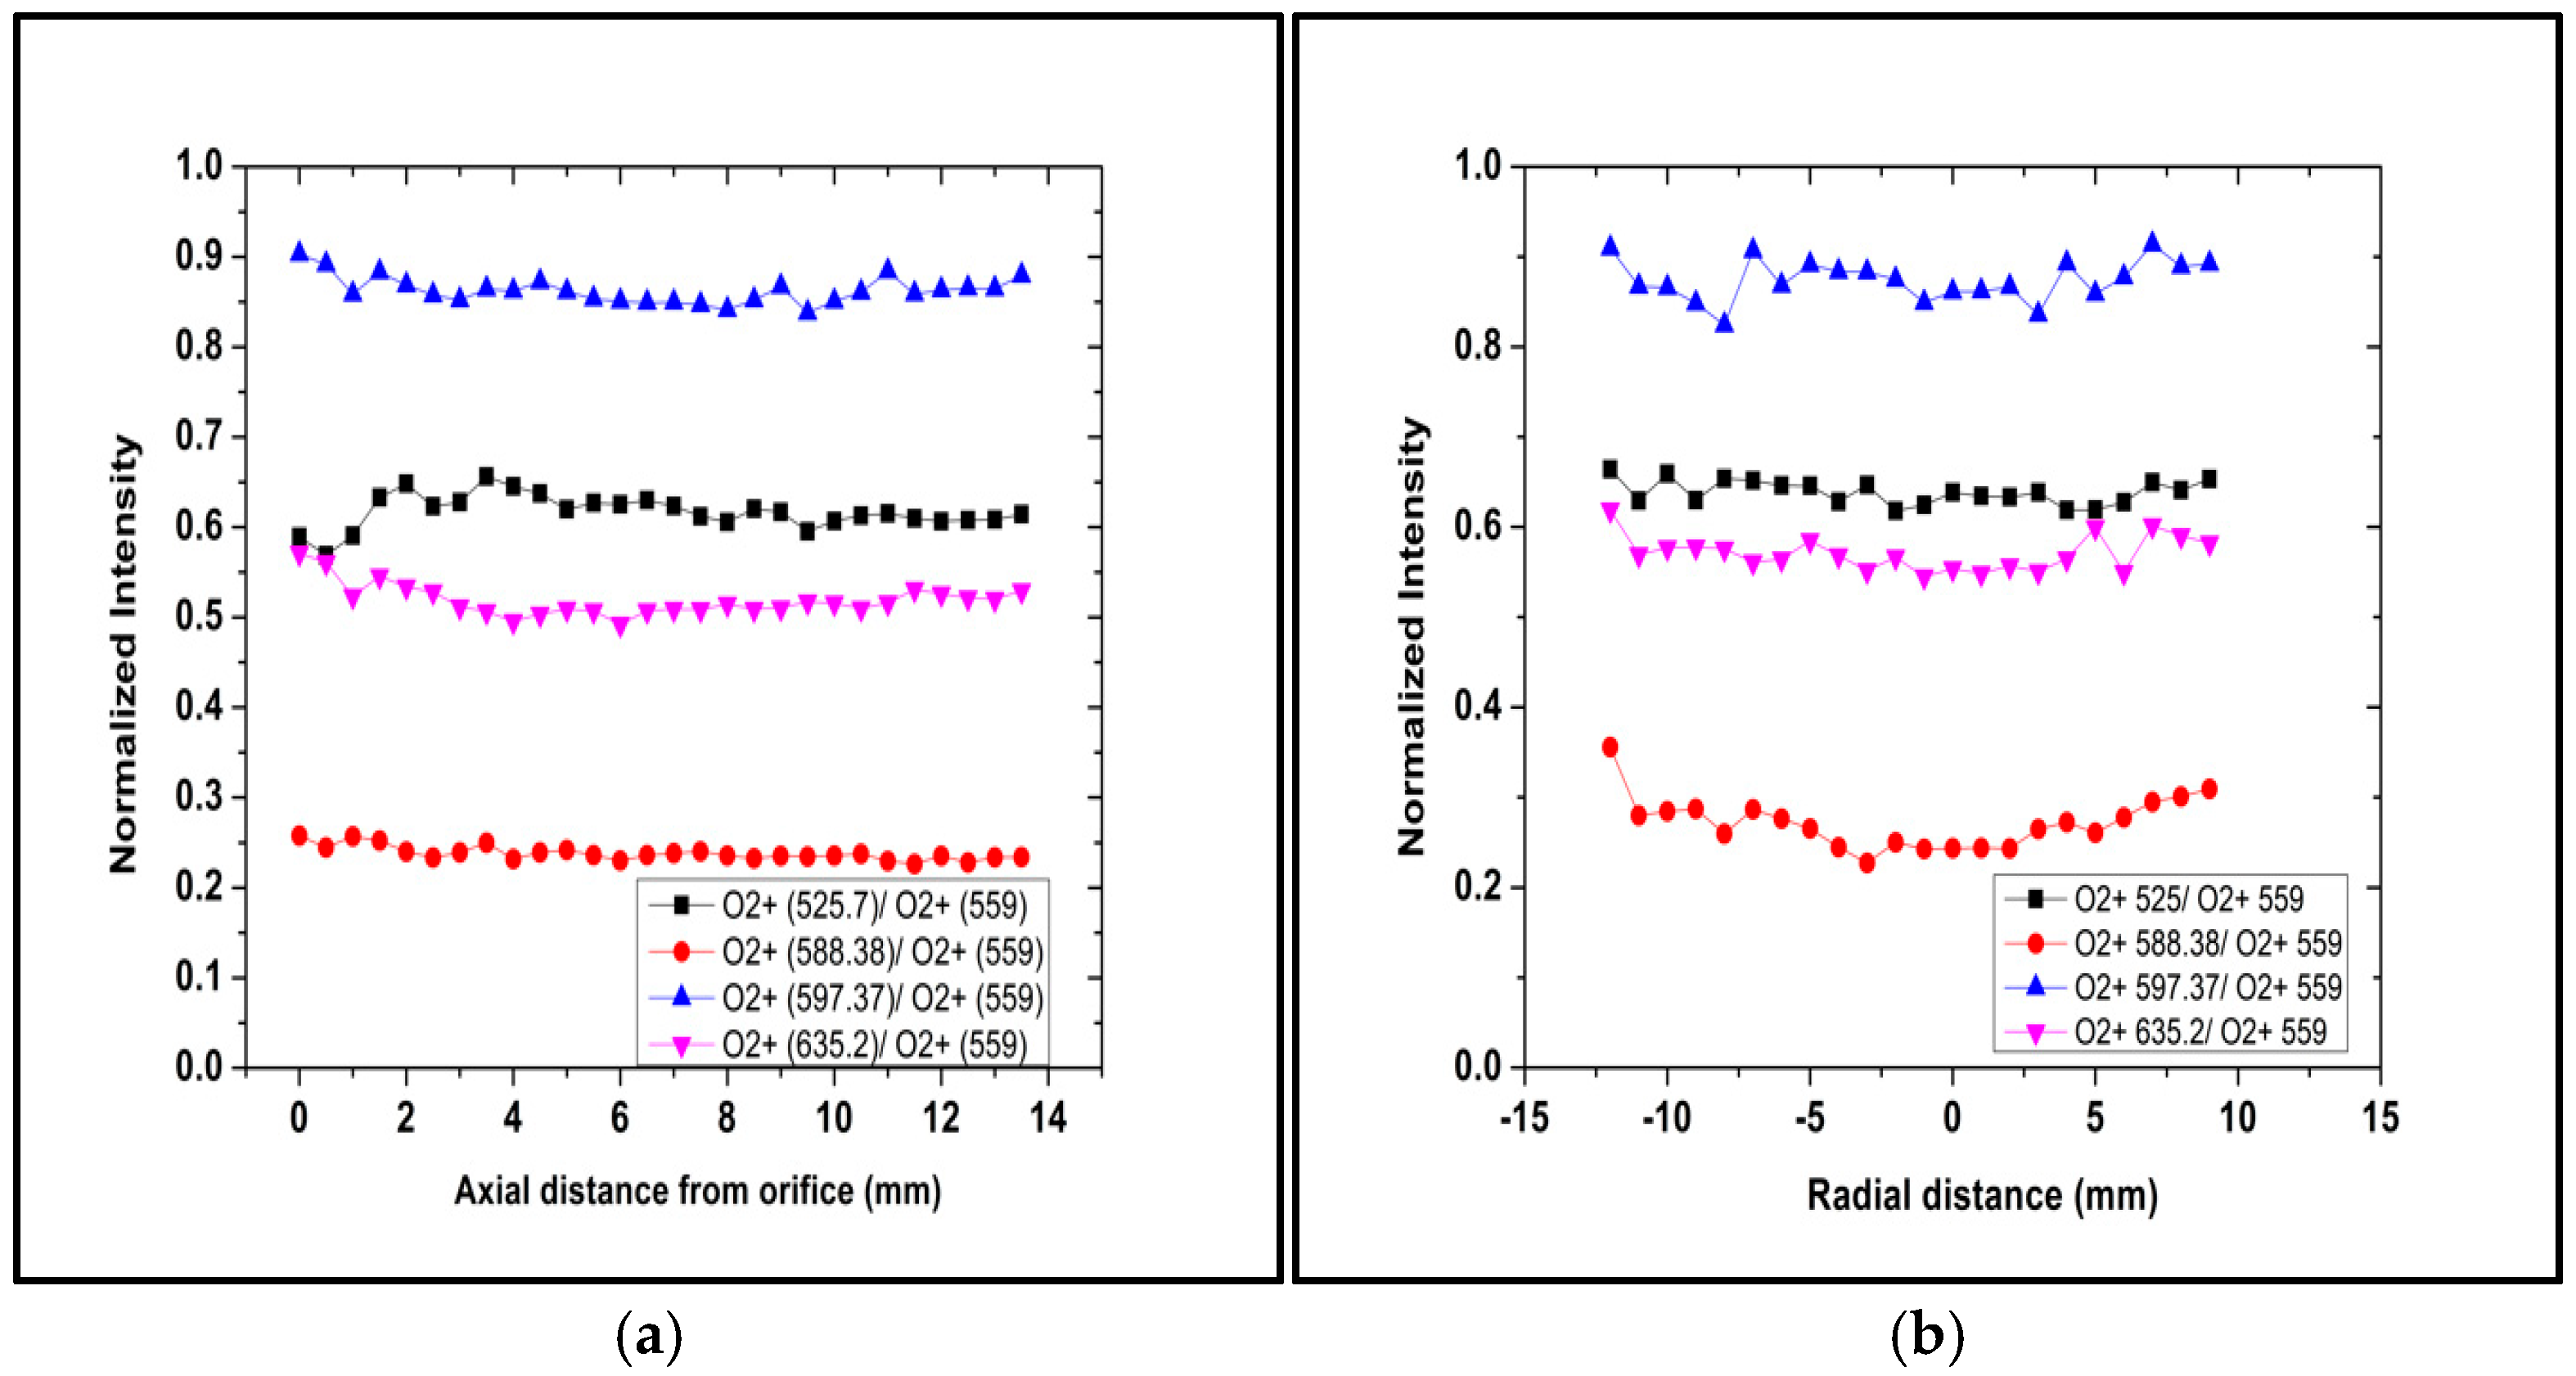
The Visible portion of the spectrum is dominated by a sequence of molecular bands. They appear in our wide-range, low-resolution spectrometers as large, jagged peaks, which are due to the non-resolved rotational structure. The main series is due to ionized molecular oxygen (O2+ 1st negative system, b 4Σg => a 4Πu transitions) [38], the sequence being related to the different vibrational states excited. Their presence is sufficient to affirm that plasma is transported into the plume. Since their lifetime is 1.12 μs [39], the excitation should have happened near to the emitting points. As for the excitation mechanism, we can repeat the considerations exposed above, which again favor excitation from the ion ground state rather than formation through direct impact ionization. A more quantitative analysis can be performed by considering the emission from individual vibrational levels. States with v = 1/2/3 and 5 are easily identified, and their relative weight is shown in Figure 10. After correcting for the spectrometer sensitivity and for their lifetimes and Frank–Condon coefficients [39], the relative populations of the different vibrational states can be assessed. This can be used to compare with plasma radiative model predictions or, at a more simplified level, to extract a vibrational temperature of the molecular ion [46,47]. The relative uniformity of the axial as well as radial profiles points towards a substantial constancy of the vibrational level distribution, apart from perhaps the radial dependence shown by the higher v = 5 level emission lines at 525 nm.
Another interesting fact comes from the comparison between atomic and molecular ion oxygen. The trend is very reminiscent of the behavior observed for the higher excited state of atomic oxygen. Molecular ion weight is larger in the side regions, both radially and axially, away from the jet orifice. The motivation could be similar to the one already mentioned, that is, the spatial differences in the fraction of high-energy electrons. However, it could also arise from a spatial structuring of the ionization degree within the free expanding plasma jet.
All the features observed in the spectra with enough intensity were identified. Some very weak bands were observed below 500 nm. The main impurity signal was detected from the atomic hydrogen lines from the Balmer series. Their intensity varies but does not correlate well with the oxygen’s. Its origins stem from the outgassing from walls and electrodes, especially during the discharge, tentatively from water vapor.

3.5. Plasma Assisted Supersonic Jet Deposition of HMDSO

A typical UV/Vis/MIR emission spectrum collected by our OES detection system from a pure HMDSO plasma jet is shown in Figure 11a. This is compared with the spectra from an O2/HMDSO plasma jet, shown in Figure 11b. The former was analyzed to identify the optical active state originating from the monomer dissociation. Discharges in pure from a pure HMDSO are generally poor because of stability and other inefficiencies and are generally mixed with noble gases, such as argon, in viable deposition processes [11]. The whitish weak plume spectrum shows two groups of closely spaced bands merging into an almost continuous emission with two broad maxima. Two strong bands dominate the spectrum, displayed in logarithm scale in the plot (Figure 11a). The strongest is associated with SiOx fragments [38]. The second corresponds to CH radicals. Both features support a view of a strong dissociation of the monomer as it reaches the plume; atomic lines of hydrogen (the Balmer series, here observable up to Hδ) can be distinguished too. Hydrogen abstraction from methyl groups should be its main source. However, their relative intensities could be used to infer information about the electron energy distribution, in particular its high-energy tail [31]. Radiative models for much simpler atoms are quite advanced, because of an interest in thermonuclear fusion research [48,49]. The full identification of the weaker bands is somewhat more complex, also because of some lack of interest in the literature. We positively recognized a few bands that could be ascribed to C2 radicals, which are commonly observed in hydrocarbon discharges [46], and SiH fragments [38]. Although their formation in a nonoxidizing plasma gas phase is not that surprising, their observation supports a picture of strong dissociation and well-developed interaction between the reactive species before they enter the supersonic jet. Again, the relatively short lifetimes of the relevant excited radicals imply that the excitation of radiatively active states has happened practically nearby their observed decays. On the contrary, the OES spectra of the oxygen and Hexamethyldisiloxane plasma exhibit a diverse set of emission peaks corresponding not only to the monomer dissociation but also to the reactions with oxygen. These optical active excited states operate as fingerprints for recognizing plasma-activated species and breakdown components of the HMDSO precursor. The key species found, and their related emission wavelengths, are discussed below. Indeed, the identification of emission lines in Figure 11b is somewhat more complex, as also discussed in the recent literature [50]. In the NIR, the emission peaks at 777 nm, 844 nm and 926 nm are due to atomic oxygen excited states. Their intensity indicates the equilibrium between dissociation of O2 molecules in the plasma and consumption in oxidation reactions with the monomer fragments. Another prominent line is emitted by hydrogen atoms (the Hα Balmer line, seen at 656.3 nm). Its presence is correlated, as in pure HMDSO plasma, to the abstraction of hydrogen from some of the methyl groups (-CH3) in the monomer or its fragments. The almost continuous spectrum in the Visible optical range is composed of closely spaced molecular bands. However, their positions and relative intensities reveal the drastic modification undergone by the plasma gas phase. Their sequence in the 450–600 nm region corresponds to transitions of excited states of CO and CO+, which likely result from the oxidation of the organic components of HMDSO. Different band systems of CO were visible (Angstrom B 1Σ => A 1Π, 3rd Positive b 3Σ => a 3Π, Asundi a’ 3Σ => a 3Π, Triplet d 3Π => a 3Π), whereas only the Comet-Tail system (A 2Π => X 2Σ) was identified for the carbon oxide ion. These features completely mask the C2 and SiO/SiH weaker lines seen in pure HMDSO discharges. A subdominant contribution from molecular oxygen ions could be detected anyways and could be used to study the balance of HMDSO and O2 in the plume plasma, as discussed above. As stated previously, their presence together with the few bands that could be positively assigned to molecular CO⁺ ions (in the blue–violet region of ~420–460 nm) supports a continuous ionization in the plume, producing such ions from parent’s neutral molecules by impact ionization and/or charge exchange reactions in the plasma gas phase.
On the other hand, the weak evidence of a residual CH emission band (~431 nm), which was observed as very strong in the high-flow condition of Ref. [51], indicates a higher degree of HMDSO oxidation reached in the plasma jet, which is required with the aim of pure silica thin film deposition. Some weak emission lines could be ascribed also to CO2 excited states. They are potentially of great interest for diagnostics purposes, since their relative weight offers a handle to a quantitative evaluation of the oxidation degree. Again, this will be relevant for whether conditions for pure SiO2 coatings are pursued.
For an insight into the diagnostics capability of OES, we have displayed in Figure 12 the axial profiles of the intensity ratios of a few selected emission lines, uncorrected for instrument sensitivity. As seen in Figure 12, all those ratios increase along the axis, flattening downstream for z > dn. This trend for CO/CO+ points towards continuous oxidation in the initial region of the plume, reducing the relative weight of atomic oxygen states. The same trend for H/CH is more puzzling. It could be ascribed possibly to a greater consumption of oxidizing agents, such as atomic oxygen, along the jet with respect to the level of monomer dissociation, which is tagged by H/CH emission lines. Again, the diagnostic’s potential will be strengthened by a suitable radiative model or at least a framework to evaluate the main excitation patterns.
It appears that, under the present experimental conditions, oxidation of the methyl groups develops within the first centimeter out of the nozzle. It seems to reach some definite, uncomplete level, since emission from unoxidized fragments continues to show up in the spectra. Our findings support an active involvement of atomic oxygen, whose emissivity contribution declines more with respect to other species. More detailed studies, changing the relative weight of O2 to HMDSO, and the global pressure and radiofrequency power would also help to pin down the fairly complicated fragmentation process in plasmas.
The same approach was shown in Figure 13, but using only excited states from the different band systems of a CO molecule. There, the axial profiles of the intensity ratios of a few selected emission lines, uncorrected for the instrument sensitivity, are displayed. Those ratios, however, remain practically unchanged along the axial profile. This points towards a substantial uniformity in the excitation pattern of such molecules, even if the overall emissivity is strongly depleted as the plasma jet propagates along its axis [46]. As a cross-check the measured ratio between two lines from the same band system was plotted too. Here the (B 1Σ, v = 0 => A 1Π, v’ = 0) and the (B 1Σ, v = 0 => A 1Π, v’ = 1) transitions are compared. Such a ratio is trivially independent from the plasma, as well as the excitation conditions, reflecting only the different branching ratios arising from the Frank–Condon factors of the two bands. The small level of fluctuation, despite the quite pronounced spatial profiles probed, supports the rather robust solidity of our measurements and in general the OES technique.

4. Conclusions

Within our somewhat limited perspective of investigating PASJD processing, we have analyzed in depth the capability of OES diagnostics. Although limited to some simplified environment, such as pure oxygen and oxygen/HMDSO binary mixtures, we have indicated several quantities that could be measured, with a sensible precision and a restricted effort. In particular the use of the full emission features allows us to control systematic errors as well as to constrain models and parameters of the plasma state. Physical quantities like the excitation temperatures or the vibrational distribution function of excited states could be extracted from such an analysis.
More generally these results could be used to gain insight into the overall conditions in the plasma gas phase in order to suitably choose the processing operating parameters to be used in thin film deposition applications. We have therefore taken some effort to evaluate the weight of emission line subsets and some extended band systems.
A step forward that we have not undertaken is to extract full emissivity profiles along the jet axis, as well as radially. As we discussed previously, this could be a useful benchmark for the formulation of suitable radiative models or for their validation. Such tools then will strongly benefit applicative research in thin film deposition and in general for the PECVD community.

Author Contributions

Conceptualization, R.B.; methodology, R.B.; software, R.B. and H.Z.; validation, H.Z., D.P. and I.A.; formal analysis, H.Z. and D.P.; investigation, H.Z., D.P. and I.A.; resources, C.R.; data curation, R.B. and H.Z.; writing—original draft preparation, H.Z.; writing—review and editing, H.Z., D.P., I.A. and R.B.; visualization, H.Z. and D.P.; supervision, C.R.; project administration, C.R.; funding acquisition, C.R. All authors have read and agreed to the published version of the manuscript.

Funding

We acknowledge the support from the “Centro Congiunto Eni-UNIMIB per lo sviluppo dell’energia da fusione” aimed at technological innovation towards fusion energy, where part of the experiments were performed.

Institutional Review Board Statement

Not applicable.

Informed Consent Statement

Not applicable.

Data Availability Statement

The data presented in this study are available on request from the corresponding author.

Acknowledgments

We are pleased to acknowledge the support of our technical staff at the PlasmaPrometeo Center, Alessandro Mietner and Alessandro Bau.

Conflicts of Interest

The authors declare no conflicts of interest. The funders had no role in the design of the study; in the collection, analyses, or interpretation of data; in the writing of the manuscript; or in the decision to publish the results.

Abbreviations

The following abbreviations are used in this manuscript:
PASJDPlasma Assisted Supersonic Jet Deposition
OESOptical Emission Spectroscopy
HMDSOHexamethyldisiloxane
PIVParticle Image Velocimetry
MSMass Spectroscopy
EEDFElectron Energy Distribution Function

References

  1. Griem, H.R. Principles of Plasma Spectroscopy; Cambridge University Press: Cambridge UK, 1997. [Google Scholar]
  2. Fantz, U. Basics of plasma spectroscopy. Plasma Sources Sci. Technol. 2006, 15, S137–S147. [Google Scholar] [CrossRef]
  3. Zaplotnik, R.; Primc, G.; Vasel, A. OES as a diagnostic tool for characterization of atmospheric plasma jets. Appl. Sci. 2021, 11, 2275. [Google Scholar] [CrossRef]
  4. Ohring, M. Materials Science of Thin Films; Academic Press: London UK, 2001. [Google Scholar]
  5. Mwema, F.M. Thin Film Coatings, 1st ed.; CRC Press: Boca Raton, FL, USA, 2022. [Google Scholar]
  6. Biederman, H. Plasma Polymer Films; Imperial College Press: London, UK, 2004. [Google Scholar]
  7. Sonnenfeld, A.; Bieder, A.; Rudolf von Rohr, P. Influence of the Gas Phase on the Water Vapor Barrier Properties of SiOxFilms Deposited from RF and Dual-Mode Plasmas. Plasma Process. Polym. 2006, 3, 606–617. [Google Scholar] [CrossRef]
  8. Ratsch, C.; Venables, J.A. Nucleation Theory and the Early Stages of Thin Film Growth. J. Vac. Sci. Technol. A 2003, 21, S96–S109. [Google Scholar] [CrossRef]
  9. Budida, J.; Srinavasan, K. Review of thin film deposition and techniques. Mater. Today 2023, 92, 1030–1033. [Google Scholar] [CrossRef]
  10. Von Keudell, A. Surface Processes during Thin-Film Growth. Plasma Sources Sci. Technol. 2000, 9, 455–467. [Google Scholar] [CrossRef]
  11. Kortshagen, U.R.; Bhandarkar, U.V.; Swihart, M.T.; Girshick, S.L. Generation and Growth of Nanoparticles in Low-Pressure Plasmas. Pure Appl. Chem. 1999, 71, 1871–1877. [Google Scholar] [CrossRef]
  12. Caldirola, S.; Barni, R.; Roman, H.E.; Riccardi, C. Mass Spectrometry Measurements of a Low Pressure Expanding Plasma Jet. J. Vac. Sci. Technol. A 2015, 33, 061306. [Google Scholar] [CrossRef]
  13. Huang, C.; Nichols, W.T.; O’Brien, D.T.; Becker, M.F.; Kovar, D.; Keto, J.W. Supersonic Jet Deposition of Silver Nanoparticle Aerosols: Correlations of Impact Conditions and Film Morphologies. J. Appl. Phys. 2007, 101, 064902. [Google Scholar] [CrossRef]
  14. Winter, J.; Brandenburg, R.; Weltmann, K.-D. Atmospheric Pressure Plasma Jets: An Overview of Devices and New Directions. Plasma Sources Sci. Technol. 2015, 24, 064001. [Google Scholar] [CrossRef]
  15. Mitsugi, F.; Kusumegi, S.; Nishida, K.; Kawasaki, T. Visualization of Plasma-Induced Liquid Flow Using KI–Starch and PIV. IEEE Trans. Plasma Sci. 2021, 49, 9–14. [Google Scholar] [CrossRef]
  16. Traldi, E.; Boselli, M.; Simoncelli, E.; Stancampiano, A.; Gherardi, M.; Colombo, V.; Settles, G.S. Schlieren imaging: A powerful tool for atmospheric plasma diagnostic. EPJ Tech. Instrum. 2018, 5, 4. [Google Scholar] [CrossRef]
  17. Willems, G.; Hecimovic, A.; Sgonina, K.; Carbone, E.; Benedikt, J. Mass spectrometry of neutrals and positive ions in He/CO2 non-equilibrium atmospheric plasma jet. Plasma Phys. Control. Fusion 2020, 62, 034005. [Google Scholar] [CrossRef]
  18. Barni, R.; Daghetta, M.; Piferi, C.; Riccardi, C. Mass Spectroscopy of Oxygen Plasmas with Energetic Ions. AIP Adv. 2023, 13. [Google Scholar] [CrossRef]
  19. Berden, G.; Engeln, R. Cavity Ring-Down Spectroscopy: Techniques and Apllications; Wiley: New York, NY, USA, 2009. [Google Scholar]
  20. Zhang, S.; Liu, W.; Zhang, X.; Duan, Y. Plasma-cavity ringdown spectroscopy for analytical measurement: Progress and prospectives. Spectrochim. Acta B 2013, 85, 1–12. [Google Scholar] [CrossRef]
  21. Weiler, M.; Lang, K.; Li, E.; Robertson, J. Deposition of Tetrahedral Hydrogenated Amorphous Carbon Using a Novel Electron Cyclotron Wave Resonance Reactor. Appl. Phys. Lett. 1998, 72, 1314–1316. [Google Scholar] [CrossRef]
  22. Barni, R.; Zanini, S.; Riccardi, C. Diagnostics of Reactive RF Plasmas. Vacuum 2007, 82, 217–219. [Google Scholar] [CrossRef]
  23. Zanini, S.; Riccardi, C.; Orlandi, M.; Grimoldi, E. Characterisation of SiOxCyHz thin films deposited by low-temperature PECVD. Vacuum 2007, 82, 290–293. [Google Scholar] [CrossRef]
  24. Siliprandi, R.A.; Zanini, S.; Grimoldi, E.; Fumagalli, F.S.; Barni, R.; Riccardi, C. Atmospheric Pressure Plasma Discharge for Polysiloxane Thin Films Deposition and Comparison with Low Pressure Process. Plasma Chem. Plasma Process. 2011, 31, 353–372. [Google Scholar] [CrossRef]
  25. Roussel, M.; Talbot, E.; Pratibha Nalini, R.; Gourbilleau, F.; Pareige, P. Phase Transformation in SiOx/SiO2 Multilayers for Optoelectronics and Microelectronics Applications. Ultramicroscopy 2013, 132, 290–294. [Google Scholar] [CrossRef]
  26. Plog, S.; Schneider, J.; Walker, M.; Schulz, A.; Stroth, U. Investigations of Plasma Polymerized SiOx Barrier Films for Polymer Food Packaging. Surf. Coat. Technol. 2011, 205, S165–S170. [Google Scholar] [CrossRef]
  27. Howells, D.G.; Henry, B.M.; Leterrier, Y.; Månson, J.-A.E.; Madocks, J.; Assender, H.E. Mechanical properties of SiOx gas barrier coatings on polyester films. Surf. Coat. Technol. 2008, 202, 3529–3537. [Google Scholar] [CrossRef]
  28. Li, N.; Wu, Y.L.; Hong, J.; Shchelkanov, I.A.; Ruzic, D.N. SiOx Deposition on Polypropylene-Coated Paper With a Dielectric Barrier Discharge at Atmospheric Pressure. IEEE Trans. Plasma Sci. 2015, 43, 3205–3210. [Google Scholar] [CrossRef]
  29. Creatore, M.; Palumbo, F.; D’Agostino, R. Deposition of SiOx Films from Hexamethyldisiloxane/Oxygen Radiofrequency Glow Discharges: Process Optimization by Plasma Diagnostics. Plasmas. Polym. 2002, 7, 291–310. [Google Scholar] [CrossRef]
  30. Shirtcliffe, N.; Thiemann, P.; Stratmann, M.; Grundmeier, G. Chemical Structure and Morphology of Thin, Organo-Silicon Plasma-Polymer Films as a Function of Process Parameters. Surf. Coat. Technol. 2001, 142–144, 1121–1128. [Google Scholar] [CrossRef]
  31. Blanchard, N.E.; Naik, V.V.; Geue, T.; Kahle, O.; Hegemann, D. Response of Plasma-Polymerized Hexamethyldisiloxane Films to Aqueous Environments. Langmuir 2015, 31, 12944–12953. [Google Scholar] [CrossRef]
  32. Barni, R.; Caldirola, S.; Fattorini, L.; Riccardi, C. Tomography of a Simply Magnetized Toroidal Plasma. Plasma Sci. Technol. 2018, 20, 025102. [Google Scholar] [CrossRef]
  33. Ashkenas, H.; Sherman, F.S. Structure and Utilization of Supersonic Free Jets in Low Density Wind Tunnels; Academic Press: Cambridge, MA, USA, 1966. [Google Scholar]
  34. Murphy, H.R.; Miller, D.R. Effects of Nozzle Geometry on Kinetics in Free-Jet Expansions. J. Phys. Chem. 1984, 88, 4474–4478. [Google Scholar] [CrossRef]
  35. Sanna, G.; Tomassetti, G. Introduction to Molecular Beams Gas Dynamics; Imperial College Press: London, UK, 2005. [Google Scholar]
  36. Otobe, Y.; Kashimura, H.; Matsuo, S.; Setoguchi, T.; Kim, H.-D. Influence of Nozzle Geometry on the Near-Field Structure of a Highly Underexpanded Sonic Jet. J. Fluids Struct. 2008, 24, 281–293. [Google Scholar] [CrossRef]
  37. Abouali, O.; Saadabadi, S.; Emdad, H. Numerical Investigation of the Flow Field and Cut-off Characteristics of Supersonic/Hypersonic Impactors. J. Aerosol Sci. 2011, 42, 65–77. [Google Scholar] [CrossRef]
  38. Kramida, A.; Ralchenko, Y.; Reader, J. NIST Atomic Spectra Database; National Institute of Standards and Technology: Gaithersburg, MD, USA, 2024. Available online: http://physics.nist.gov/asd3 (accessed on 13 March 2025).
  39. Pearse, R.W.B.; Gaydon, A.G. The Identification of Molecular Spectra; Wiley: New York, NY, USA, 1976. [Google Scholar]
  40. Krupenie, P.H. The Spectrum of Molecular Oxygen. J. Phys. Chem. Ref. Data 1972, 1, 423–534. [Google Scholar] [CrossRef]
  41. Bronold, F.X.; Matyash, K.; Tskhakaya, D.; Schneider, R.; Fehske, H. Radio-frequency discharges in Oxygen. J. Phys. D 2007, 40, 6583–6593. [Google Scholar] [CrossRef]
  42. Pattison, J.; Celotto, S.; Khan, A.; O’Neill, W. Standoff Distance and Bow Shock Phenomena in the Cold Spray Process. Surf. Coat. Technol. 2008, 202, 1443–1454. [Google Scholar] [CrossRef]
  43. Raizer, Y.P. Gas Discharge Physics; Springer: Berlin/Heidelberg, Germany, 1991. [Google Scholar]
  44. Lee, H.C.; Chung, C.W. Effect of Electron Energy Distribution on the Hysteresis of Plasma Discharge: Theory, Experiment and Modeling. Sci. Rep. 2015, 5, 15254. [Google Scholar] [CrossRef]
  45. Gornushkin, I.B.; Shabanov, S.V.; Panne, U. Abel inversion applied to a transient laser induced plasma: Implications from plasma modeling, J. Anal. At. Spectrom. 2011, 26, 1457–1565. [Google Scholar] [CrossRef]
  46. Barni, R.; Alex, P.; Ghorbanpour, E.; Riccardi, C. A Spectroscopical study of H2 emission in a simply magnetized toroidal plasma. Eur. Phys. J. D 2021, 75, 101. [Google Scholar] [CrossRef]
  47. Barni, R.; Alex, P.; Salanti, A.; Canevali, C.; Zoia, L.; Orlandi, M.; Riccardi, C. Characterization of the Electrical and Optical Properties of a Gliding Arc Tornado Device. Eur. Phys. J. D 2021, 75, 147. [Google Scholar] [CrossRef]
  48. Britun, N.; Gaillard, M.; Ricard, A.; Kim, Y.M.; Kim, K.S.; Han, J.G. Determination of the vibrational, rotational and electron temperatures in N2 and Ar–N2 rf discharge. J. Phys. D 2007, 40, 1022–1029. [Google Scholar] [CrossRef]
  49. Wünderlich, D.; Dietrich, S.; Fantz, U. Application of a Collisional Radiative Model to Atomic Hydrogen for Diagnostic Purposes. J Quant. Spectrosc. Radiat. Transf. 2009, 110, 62–71. [Google Scholar] [CrossRef]
  50. Phelps, A.V. Collisional kinetics of non-uniform electric field, low-pressure, direct-current discharges in H2. Plasma Sources Sci. Technol. 2011, 20, 043001. [Google Scholar] [CrossRef]
  51. Gosar, Ž.; Kovač, J.; Mozetič, M.; Primc, G.; Vesel, A.; Zaplotnik, R. Characterization of Gaseous Plasma Sustained in Mixtures of HMDSO and O2 in an Industrial-Scale Reactor. Plasma Chem. Plasma Process. 2020, 40, 25–42. [Google Scholar] [CrossRef]
Figure 1. Experimental setup of the plasma reactor.
Photonics 12 00595 g001
Figure 2. Schematic diagram shows jet expansion across the nozzle with supersonic areas (full lines) and gas streamlines (dashed lines). It indicates Mach number changes, Mach disk position (ZM) and the nozzle circular diameter (dn).
Photonics 12 00595 g002
Figure 3. (a) Mach number estimate along the jet axis according to Equation (4). The Mach disk location is indicated by a vertical bar over its position, with R the changing the pressure ratio. (b) Normalized density as a function of the jet axis, estimated according to Equations (5) and (6); the Mach disk is represented by a dashed bar over its position according to our experimental condition.
Photonics 12 00595 g003
Figure 4. OES axial profile for an oxygen plasma (Q = 50 sccm, W = 100 W, R = 14) free expanding jet. The right scale shows our experimental condition for the free expanding jet for the 777 nm atomic oxygen emission line, while the scale on the left is for the normalized density profile estimated from the theoretical calculations for the gas density in Equation (6).
Photonics 12 00595 g004
Figure 5. Diagram of the intensity of the λ = 777 and 844 nm emission lines, with changing the Forward-Power level of the RF supply. Plasma was ignited in the oxygen flow rate at Q = 50 sccm and Pp = 9.7 × 10⁻² mbar.
Photonics 12 00595 g005
Figure 6. OES axial profile for oxygen plasma (Q = 50 sccm, W = 100 W, R = 14).
Photonics 12 00595 g006
Figure 7. OES radial profile for oxygen plasma (Q = 50 sccm, W = 100 W, R = 14).
Photonics 12 00595 g007
Figure 8. A typical emission spectrum of an oxygen discharge plume (Q = 50 sccm, W = 100 W, R = 14, Pp = 9.7 × 10⁻² mbar).
Photonics 12 00595 g008
Figure 9. Uncorrected relative weight of the different atomic oxygen lines recorded in the spectra as a function of the plume axial (a) and radial (b) coordinates (Q = 50 sccm, W = 100 W, R = 14, Pp = 9.7 × 10⁻² mbar).
Photonics 12 00595 g009
Figure 10. Uncorrected relative weight of the different molecular oxygen ion bands recorded in the spectra as a function of the plume axial (a) and radial (b) coordinates (Q = 50 sccm, W = 100 W, R = 14, Pp = 9.7 × 10⁻² mbar).
Photonics 12 00595 g010
Figure 11. An OES measurement of discharge spectra with 100 W power in the plume of a pure HMDSO (Pp = 1.0 × 10⁻¹ mbar) plasma (a) and of a mixture of oxygen (Pp = 6.9 × 10⁻² mbar, Q = 40 sccm) and HDMSO (Pp = 8.3 × 10⁻² mbar) plasma (b).
Photonics 12 00595 g011
Figure 12. Uncorrected intensity ratios for some selected states from H, CH, CO and CO+ with respect to the atomic oxygen reference line at 777 nm along the axial distance.
Photonics 12 00595 g012
Figure 13. Uncorrected intensity ratios for some selected electronic excited states of the CO molecules with respect to the most easily observed Angstrom system line at 483 nm (B 1Σ, v = 0 => A 1Π, v’ = 1) along the axial distance.
Photonics 12 00595 g013
Table 1. Main optical and NIR lines observed in optical emission spectroscopy from transitions of atomic oxygen excited in the plasma state.
Wavelength (nm)Transition Rate (s−1)Excited LevelExcited Level Energy (eV)
777.373.69 × 1075P (3p)10.741 eV
844.643.22 × 1073P (3p)10.989 eV
926.282.97 × 1075D° (3d)12.079 eV
436.837.58 × 1053P (4p)12.359 eV
645.603.85 × 1065S° (5s)12.661 eV
615.717.62 × 1065D° (4d)12.754 eV
533.072.71 × 1065D° (5d)13.066 eV
Disclaimer/Publisher’s Note: The statements, opinions and data contained in all publications are solely those of the individual author(s) and contributor(s) and not of MDPI and/or the editor(s). MDPI and/or the editor(s) disclaim responsibility for any injury to people or property resulting from any ideas, methods, instructions or products referred to in the content.