1. Introduction
Optical coherence tomography (OCT) allows minimally invasive imaging deep inside biological tissue and has thus been widely adopted for biomedical imaging [
1]. Full-field OCT (FF-OCT) utilizes 2D detectors, such as CMOS cameras, for parallelized acquisition [
2,
3]. FF-OCT permits high-resolution imaging without the need for time-consuming transverse scanning, resulting in high data throughput and making it suitable for human eye in vivo en face imaging [
4,
5,
6]. However, unlike regular scanning OCT, FF-OCT lacks confocal gating, which leads to reduced sensitivity and a shallower imaging depth compared to confocal OCT. In the context of FF-OCT, confocal gating serves to reduce the amount of incoherent signals reaching the detector and thereby worsening the signal-to-noise ratio (SNR) [
7]. Sensitivity can be increased in FF-OCT by implementing, for example, dark-field detection [
8,
9] that can reject specular reflections, but it cannot reject multiple scattered light. The speed of transverse scanning in standard confocal OCT can be accelerated using more than one scanning spot on a sample [
10,
11]. Extreme parallelization in confocal microscopy can be achieved by employing a Nipkow disk for illumination and a camera for detection, resulting in 1 kHz confocal imaging rates [
12]. This approach has also been implemented in interferometric imaging [
13]. Digital micromirror devices (DMDs) have become another tool for extreme parallelization in microscopy owing to their accessibility and flexibility in rapidly generating arbitrary illumination patterns, including multiple spots [
14]. In confocal microscopy, DMDs are efficient in a “double path configuration”, where the micromirrors both illuminate the sample and act as pinholes [
15,
16] to achieve confocal effects. To implement scanning, the DMD can generate multiple spots (e.g., by activating every Nth micromirror) and display N
2 patterns per camera frame. While effective for fluorescence confocal microscopy, this technique faces challenges in the reflectance imaging of weakly reflecting samples. This is due to backscatter from the DMD itself [
17], which can be successfully filtered out spectrally in fluorescence but not reflectance microscopy. Nonetheless, a substantial signal, mainly from the sample’s surface, remains detectable, especially for highly reflective samples [
15,
18,
19]. However, imaging volumetric scattering samples might become challenging since backreflections from the DMD add shot noise to the images and bury the weakly reflecting structures of a sample.
Here, we present an FF-OCT system with confocal optical sectioning by employing a DMD to create an array of confocal illumination spots and a corresponding array of confocal pinholes to reject the out-of-focus light. The idea of the setup is that of a double pass [
5], except that different halves of the DMD chip are used to produce illumination spots and pinholes [
20]. The difficulty of utilizing a DMD in a regular double-pass geometry to acquire FF-OCT images is associated with the above-mentioned problem of backreflections from the DMD itself. In a regular double pass, the same micromirrors are used to form illumination spots and then serve as pinholes, and illumination light backreflected or scattered by DMD and probably originating from the vias and sub-structure of the micromirrors is of overwhelming intensity compared to the light intensity reflected from the sample. This was, perhaps, also the reason why DMD, although a flexible and convenient spatial light modulator, has not been utilized in such a capacity for FF-OCT microscopy before. In the present work, we resolve the issue by utilizing separate halves of the DMD chip to produce confocal illumination on the one hand and to spatially filter the resulting signal on the other.
To justify reintroducing confocal gating in FF-OCT for improved sensitivity, we first revisit how sensitivity depends on the amount of incoherent light reaching the detector. In FF-OCT, the signal intensity of a camera can be expressed as
where
N is the number of accumulations,
I0 is the intensity of the illumination,
Rinc is the incoherent sample’s reflectivity,
Rref is the reference reflectivity,
R is the coherent sample’s reflectivity,
Φp is the phase difference between the light from the sample and the reference, and
p is the index of the phase difference.
The OCT signal can be extracted from three phase-shifted images according to
with
Φ1,2,3 = 0°, 120°, and 240°. Combining Equations (1) and (2) yields
Assuming that the intensity of the illumination source is sufficient to exploit the whole dynamic range of the camera, the detected signal intensity is equal to the full well capacity (FWC) of the camera,
ξsat. Assuming also that
Rinc >>
R in Equation (1), which is normally the case in reality, resulting in
ξsat =
I0(
Rinc +
Rref)/4, the intensity of the illumination can then be expressed as
I0 = 4
ξsat/(
Rinc +
Rref). Inserting this expression in Equation (3) leads to
The shot-noise-limited background noise of the OCT signal is equal to the variance of
Ep times the number of summands in Equation (2) [
2]:
Eventually, from Equations (4) and (5), the SNR of FF-OCT can be derived as
By differentiating Equation (6) with respect to
Rref, it is straightforward to show that SNR is at the maximum if
Rref =
Rinc [
2]. If this condition is fulfilled, then
and the sensitivity that is defined as a reciprocal of the minimum detectable sample reflectivity (when SNR = 1) is
Expressions (7) and (8) demonstrate that the lower the Rinc, the higher the SNR and sensitivity. The way to increase SNR and sensitivity, therefore, is to decrease the amount of incoherent light reaching the detector.
2. Materials and Methods
The layout of the FF-OCT microscopy setup with implemented multi-spot scanning is shown in
Figure 1.
The system is based on a Linnik interferometer configuration, with identical objective lenses (10×/0.25, Plan N, Olympus, Tokyo, Japan) used in both the sample and reference arms. The lateral resolution was thus 1.6 µm. This configuration ensures good optical matching between the two arms, which is crucial for high-quality interference signals. A digital micromirror device (V-7001, Vialux, Chemnitz, Germany) is employed to control the illumination pattern. The DMD consists of an array of 1024 × 768 individually addressable micromirrors, each measuring 13.7 µm × 13.7 µm. These micromirrors can rapidly be switched between “on” (+12°) or “off” (−12°) states at a rate of 22.7 kHz (limited by a 44 µs dead time), enabling the dynamic control of the illumination pattern. The DMD is mounted on a holder at a 45° angle relative to the optical table. This arrangement ensures that both the incident light from the illumination source and the reflected light from the DMD propagate parallel to the optical table. To illuminate the DMD, a 660 nm LED (M660L4, Thorlabs, Mölndal, Sweden) is used with a spectral bandwidth of 20 nm (FWHM) in a Köhler illumination configuration (not shown in
Figure 1). Köhler illumination provides even illumination across the DMD surface and minimizes scattered light within the system, which is crucial for achieving high signal-to-noise ratios in FF-OCT. The axial resolution was primarily determined via temporal coherence gating, which follows the relation
, and in our system, it was estimated to be 9.6 µm. Illumination light is directed at a 24° angle relative to the normal of the DMD surface, and the normal relative to the surface of the micromirror is 12° relative to the direction of impinging or reflected light. In the multi-spot mode, a specific pattern of micromirrors is activated (“on” state) on one half (A in
Figure 1) of the DMD, while the remaining micromirrors are deactivated (“off” state). This creates an array of illumination spots. Lens L2 (
f = 200 mm) and the objective lens (
f = 18 mm) then image this multi-spot pattern onto the sample. A non-polarizing 50/50 beam splitter serves a dual purpose in the setup. First, it splits the light from the source into the sample and reference arms. Second, it recombines the light reflected from the reference mirror and the light scattered back from the sample. This combined light is then projected by lens L3 (
f = 200 mm) onto the second half (B in
Figure 1) of the DMD. On this half of the DMD, a pattern of digital pinholes is generated by switching specific micromirrors “off” (corresponding to the desired pinhole positions) and the remaining micromirrors “on”. This creates a confocal detection scheme where only the light originating from the illuminated spots on the sample can pass through the corresponding pinholes and reach the camera. Backreflections coming from DMD upon illuminating sector A with the LED will return to the light source and will not reach the camera like in alternative configurations.
To ensure optimal image quality, lenses L2 and L3 are each composed of two f = 400 mm achromatic doublets arranged in a Plössl configuration. This configuration minimizes off-axis aberrations, which is crucial for maintaining high resolutions across the entire field of view. The interference pattern formed on the DMD half with the digital pinholes is then relayed onto a CMOS camera (acA2040-180kmNIR, Basler, Ahrensburg, Germany) by lenses L4 (f = 150 mm) and L5 (f = 100 mm). The camera features 2048 × 2048 pixels of 5.5 µm size with a full well capacity (FWC) of 11.9 ke− and can be run at a maximum speed of 700 fps with a 512 × 512 pixel region of interest (ROI). Thus, the imaged field-of-view (FOV) was 380 µm × 380 µm. With the reference reflector’s reflectance of ~2%, which was chosen to match that of Rinc, using Equation (8), we can evaluate the sensitivity for regular FF-OCT as follows: . The sample was mounted on a 3D translation stage that can be moved by a stepper motor (T-NA08A25-S, Zaber, Vancouver, BC, Canada). The motor was utilized to acquire images at different focal planes, enabling depth scanning and 3D image reconstruction. The entire reference arm was mounted on a separate translation stage, which effectively acted as a time delay (time-gating) line. This allowed for the precise control of the optical path length difference between the sample and reference arms. Phase-shifted images were acquired by imparting a controlled amount of phase shift to the reference light using a reference mirror mounted on a piezo stack (STr-25, Piezomechanik, München, Germany). The FF-OCT image was then extracted from these phase-shifted images using Equation (2).
3. Results
The system could be operated in full-field illumination mode by turning all the micromirrors “on” on the illumination half of the DMD and “off” on the imaging half. This effectively created a uniform illumination field for imaging. To realize multi-spot illumination, a specific pattern of individual micromirrors was turned “on” on the illumination half of the DMD. The light reflected by the sample then passed through the imaging half of the DMD, where a corresponding pattern of micromirrors was turned “off” to create confocal pinholes and send the signal towards the detection. Precise alignment between the illumination spots and the pinholes was achieved by adjusting a mirror mounted on a tip–tilt stage (see
Figure 1). This ensured that the light from each illuminated spot passed through its corresponding pinhole, effectively rejecting out-of-focus light. To efficiently scan the entire sample’s field of view, the DMD sequentially displayed different micromirror patterns during a single CMOS camera exposure. This allowed for the rapid acquisition of multi-spot images without the need for synchronization between the camera and the DMD. Each illumination spot in the array pattern consisted of a single “on” micromirror, while the corresponding confocal pinholes were formed by the 2 × 2 blocks of “off” micromirrors on the imaging half of the DMD. We varied the spot/pinhole spacings (separation between illumination spots and detection pinholes) to optimize the system’s performance in terms of imaging speed, optical sectioning, and cross-talk. Specifically, we used 15, 7, and 4 micromirror spot/pinhole spacings, resulting in 225, 49, and 16 unique DMD patterns necessary to scan the sample, respectively. All patterns for a given pinhole spacing were displayed within a single camera exposure. Therefore, a larger number of patterns led to a shorter illumination time per pattern. Given the limited output of the light source, this resulted in a weaker signal for each individual pattern. This highlights a trade-off between the camera acquisition rate and the strength of the detected OCT signal.
In addition to multi-spot scanning, we also implemented a multi-line scanning approach. Instead of illuminating and detecting multiple discrete spots, different DMD patterns were used to generate line illumination and detection. Analogous to the multi-spot configuration, the illumination lines were one-micromirror-wide, while the detection lines were two-micromirror-wide. The lines were spaced 15 micromirrors apart. This line-scanning strategy offers shorter acquisition times because the pattern is periodic in only one direction and the required number of DMD patterns necessary to scan the sample is therefore significantly reduced. For example, we needed only 15 patterns compared to 225 for the corresponding multi-spot scanning with the same spacing. This smaller number of patterns allows for faster image acquisition within a single camera exposure time. However, line illumination and detection provide only a partial degree of confocal sectioning by rejecting out-of-focus light only along one direction.
To demonstrate the advantage of multi-spot/multi-line scanning in FF-OCT, we first measured the axial response, otherwise called the “optical sectioning curve” (
Figure 2), by stepping a mirror in the sample arm along the optical axis (with the blocked reference arm).
This was carried out with different pinhole spacings. The obtained intensity profile is a peak with a non-zero baseline that is due to the cross-talk between the adjacent spots/pinholes. The level of the baseline is higher for smaller pinhole spacing since the cross-talk sets in at a smaller value of defocusing. On the other hand, the shape and the FWHM at different pinhole spacing are similar and are about 12 µm. In the multi-line mode, the sectioning curve is somewhat wider and also does not fall off as much as in the multi-spot regime with the same pinhole spacing, which is expected and similar to that obtained with the line-scanning FF-OCT implemented with a rolling shutter camera [
7]. At the same time, in the regular full-field mode, there was barely any change in intensity over the same axial range, as can be seen in
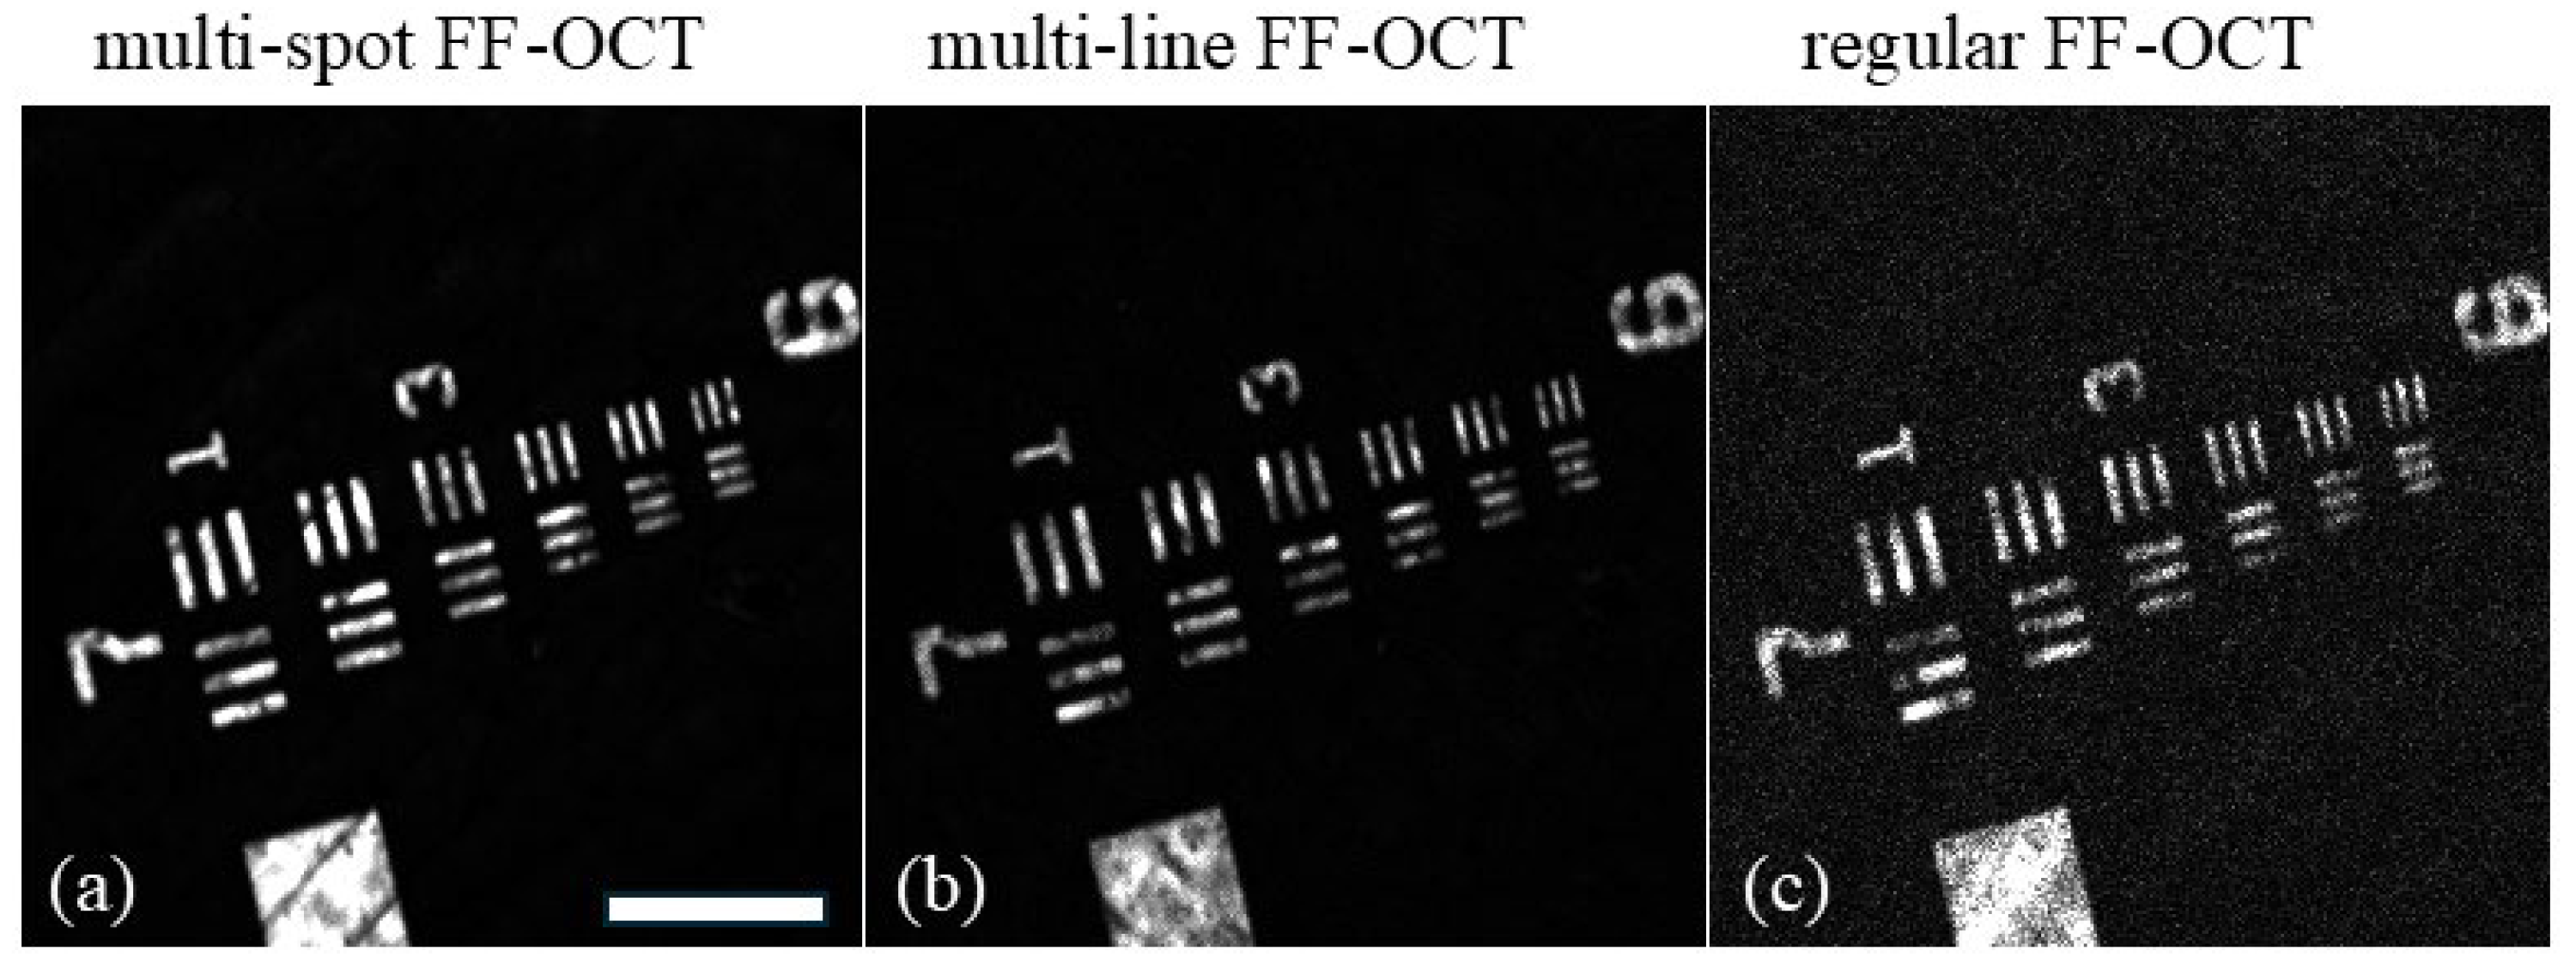
Figure 2. The effect of multi-spot scanning for FF-OCT imaging was demonstrated on a scattering sample composed of a US Air Force (USAF) target (R1DS1P, Thorlabs) mounted beneath a 160 µm thick scattering layer of polydimethylsiloxane (PDMS) with embedded TiO
2 nanoparticles (
Figure 3).
The PDMS film was fabricated by mixing a Sylgard 184 silicone elastomer thoroughly with a curing agent (Dow Corning, Midland, MI, USA) in a 10:1
v/
v ratio. TiO
2 (14027, Sigma-Aldrich, St. Louis, MO, USA) was added to the mixture at 1%
w/
v and mixed thoroughly. The mixture was centrifuged for 1 min at 20,238×
g to remove bubbles and additionally degassed in a vacuum for 30 min. The PDMS sheet was formed by placing 20 µL of the mixture in between two cover slides spaced by pieces of a coverslip and curing for 1 h at 80 °C. A comparison of FF-OCT images obtained in different modes is presented in
Figure 3. For demonstration purposes, in the multi-spot mode, the camera exposure time was set to a relatively long 200 ms, corresponding to a 5 Hz frame rate. In the multi-line and regular full-field modes, the exposure time was set to 20 ms, corresponding to a 50 Hz frame rate. To ensure a fair comparison between the different imaging modes, we carefully adjusted the measuring conditions as follows. First, as explained above, achieving the maximal SNR requires matching the reflectivity of the reference to the amount of incoherent light from the sample. Since the amount of detected incoherent light varies in different modes, we used different reference reflectors. To this end, we used an absorptive neutral density filter as a reference reflector in the regular full-field mode and a weaker reflectivity color filter for both the multi-spot and multi-line OCT modes. This allowed us to optimize the reference reflectivity for each mode. Second, to ensure that the detector was filled with the signal to the same extent in all modes, we adjusted the illumination intensity. To this end, we used the maximum available LED power in the multi-spot mode and reduced the illumination intensity in the multi-line and regular full-field modes so as to achieve the same signal intensity from the sample arm.
As shown in
Figure 3a, the intensity of the FF-OCT signal is significantly higher with confocal scanning (multi-spot mode) compared to the regular full-field mode. This is because the confocal gate effectively attenuates light originating from out-of-focus planes, such as the scattering layer. With a confocal gate of 12 µm (FWHM) positioned at the USAF target plane, light scattered from the scattering layer is strongly suppressed. This allows more of the illumination light to reach the target and more of the light scattered from the target to be detected. In the case of line scanning, the FF-OCT signal intensity falls between that of the multi-spot and regular full-field modes. This is due to the presence of confocal sectioning, although it is less pronounced than in the multi-spot regime. To quantify the improvement in image quality, we estimated the SNR in each recorded image. The SNR was calculated according to
, where the signal is the intensity of the OCT signal on the bars of the USAF target and the background is the signal intensity with a misaligned coherence gate. The SNR for the standard FF-OCT image (
Figure 3c) was 67, whereas the confocal scanning FF-OCT image (
Figure 3a) exhibited an SNR of 1914, demonstrating a 29-fold improvement. The line-scanning FF-OCT image showed an intermediate SNR of 529. The optical sectioning curve (
Figure 2) with an FWHM of 12 µm illustrates the confocal effect. For example, a signal originating 10 µm away from the focal plane would be attenuated by approximately 10 times in the confocal scanning mode while experiencing no attenuation in the regular FF-OCT mode. This reduction in scattered light explains the significant increase in SNR observed with confocal scanning.
In recent years, we have implemented confocal line scanning by exploiting the rolling shutter capability of the camera [
7]. Via this method, the minimum width of the detection strip was limited by the camera’s integration time. As a result, the effect of the optical sectioning was less pronounced, and the gain of the SNR was smaller than in the current work, where illumination spots could be set as small as one micromirror. The advantage of the current work is therefore a more flexible use of DMD capabilities and the resulting higher gain in the SNR.
For an additional demonstration of the advantage of multi-spot imaging, we also imaged a model biological sample at different depths in the sample volume.
Figure 4 shows the maximum intensity projections of the resliced stacks of images of a cucumber acquired in the multi-spot and regular modes. Images in the stack were acquired from 20 µm below the sample’s surface down to 1 mm inside the sample with a 1 µm step between the consecutive images. It can be seen that at all imaging depths, more sample details can be discerned in the multi-spot mode. At imaging depths greater than approximately 400 µm, no sample structures can be detected in the regular imaging mode, while some sample details can still be discerned up to about 800 µm relative to the volume in the multi-spot mode. Overall, this comparison clearly demonstrates how the advantage of higher SNR results in a qualitative difference in what can be observed when the confocal rejection of incoherent signals is involved.
4. Discussion
In summary, we present a multi-spot/line scanning confocal FF-OCT microscopy system that carries out confocal detection by employing a modified double-pass geometry for a digital micromirror device (DMD). We have shown that one way to improve the SNR is to reduce the amount of incoherent light reaching the detector. Multi-spot illumination in combination with digital pinholes reintroduced to full-field imaging effectively rejects out-of-focus light, leading to an enhanced signal-to-noise ratio. By utilizing separate halves of the DMD for generating illumination spots and confocal pinholes, we effectively mitigate unwanted backreflections that, in the past, prevented the efficient use of DMDs for FF-OCT imaging. This DMD-based approach improves the quality of FF-OCT imaging, particularly in the presence of scattering, given a sufficiently bright light source. This approach offers several advantages. The digital pinholes effectively reject out-of-focus light, leading to an enhanced signal-to-noise ratio. The programmable nature of the DMD enables the flexible adjustment of the spot’s and pinhole’s size and spacing, a feature not readily available in alternative confocal microscopy techniques like spinning disk systems. Furthermore, the system allows straightforward switching between regular wide-field and confocal imaging modes. Importantly, the setup avoids any large moving parts that could introduce vibrations and compromise image quality. While the DMD-based approach provides flexibility and improvement, it is currently limited by the intensity of the light source. Sparse multi-spot illumination patterns utilize only a small fraction of the available light for sample illumination. While denser patterns could improve light throughput, this comes at the expense of cross-talk. Therefore, we think that, in the future, alternative strategies, such as using a broadband laser in conjunction with a microlens disk/array, could enable the more efficient use of light sources and further enhance system performances. We expect that the system could be used to image more scattering samples, such as the brain, after more powerful light sources are implemented. These modifications should also introduce a way of using the system in in vivo settings, such as retinal imaging, in the future.

