Article

Optical Sensor Based on Carbon Nanomaterials for UGLU Detection

by
Talia Tene
1,*,
Marco Guevara
2,
Santiago López
3,
Diego Mayorga
4,
Alex Buñay Caizaguano
5,
Juan Carlos Chimbo Pilco
6 and
Cristian Vacacela Gomez
7,8,*
1
Department of Chemistry, Universidad Técnica Particular de Loja, Loja 110160, Ecuador
2
UNICARIBE Research Center, University of Calabria, 87036 Rende, Italy
3
Facultad de Informática y Electrónica, Escuela Superior Politécnica de Chimborazo (ESPOCH), Riobamba 060155, Ecuador
4
Facultad de Mecánica, Escuela Superior Politécnica de Chimborazo (ESPOCH), Riobamba 060155, Ecuador
5
Solca Manabí Núcleo de Portoviejo, AV. Valle Manabi Guillen, Manabí 130103, Ecuador
6
Terminal Portuario de Guayaquil (TPG), Av. Los Ángeles, Guayaquil 090114, Ecuador
7
Department of Environmental Engineering (DIAm), University of Calabria, Via P. Bucci, Cubo 42B, 87036 Rende, Italy
8
Universidad Ecotec, Km. 13.5 Samborondón, Samborondón 092302, Ecuador
*
Authors to whom correspondence should be addressed.
Photonics 2025, 12(11), 1089; https://doi.org/10.3390/photonics12111089
Submission received: 15 October 2025 / Revised: 28 October 2025 / Accepted: 31 October 2025 / Published: 4 November 2025

Abstract

This study develops an optical surface plasmon resonance (SPR) biosensing platform for non-invasive glucose detection directly in urine and examines how two-dimensional (2D) nanomaterials modulate sensing performance. Angular interrogation at 633 nm is modeled using a transfer-matrix framework for Au/Si3N4 stacks capped with graphene, semiconducting single-walled carbon nanotubes (s-SWCNTs), graphene oxide (GO), or reduced graphene oxide (rGO). Urine–glucose (UGLU) refractive indices spanning clinically relevant concentrations are used to evaluate resonance angle shifts and line-shape evolution. Sensor metrics—sensitivity, detection accuracy, figure of merit, quality factor, and limit of detection—are computed to compare architectures and identify thickness windows. Across all designs, increasing glucose concentration produces monotonic angle shifts, while the 2D overlayer governs dip depth and full width at half maximum. Graphene- and s-SWCNT-capped stacks yield the lowest limits of detection and the most favorable figures of merit, particularly at higher concentrations where narrowing improves the quality factor. rGO exhibits a thin, low-loss regime that provides large shifts with acceptable broadening, whereas thicker films degrade detectability; GO offers stable line shapes suited to metrological robustness. These results indicate that nanoscale optical engineering of 2D overlayers can meet practical detectability targets in urine without biochemical amplification, supporting compact, label-free platforms for routine glucose monitoring.

1. Introduction

Diabetes mellitus remains a leading cause of morbidity worldwide and demands continuous monitoring of glucose as a primary biomarker of metabolic control [1,2,3]. Accurate tracking of glucose dynamics enables timely therapy adjustments that mitigate risks of microvascular and macrovascular complications, supports lifestyle interventions, and improves quality of life [4,5,6]. Yet, routine self-monitoring is still dominated by invasive blood-based methods—finger-prick tests and many continuous glucose monitoring systems—that puncture the skin, cause pain or discomfort, and require disposables and frequent calibration [7]. These burdens erode patient adherence and limit uptake, particularly in resource-constrained settings and among populations sensitive to needle use.
Urine offers a practical, noninvasive sample matrix that can expand access to glycemic screening and longitudinal surveillance [8,9]. Collection is simple, painless, and compatible with point-of-care testing outside specialized clinics. Although urine glucose does not substitute for blood measurements in every clinical decision [10], it is a useful indicator for detecting hyperglycemia, triaging risk, and following trends in metabolic status when frequent blood sampling is impractical [11]. A robust urine-based assay that can resolve clinically relevant concentration changes with minimal user training would complement existing care pathways and enable broader community-level monitoring [12,13].
Optical surface plasmon resonance (SPR) sensing provides a compelling platform for such an assay [14,15,16,17]. In SPR, p-polarized light incident on a thin metal film at a prism interface excites a collective charge oscillation—the surface plasmon polariton—when momentum matching is satisfied [18]. The resonance condition depends sensitively on the refractive index at the metal–dielectric boundary, and minute changes at the surface shift the resonance angle or wavelength [19,20]. Because the probe is the evanescent field confined within a few hundred nanometers of the interface, SPR directly reports interfacial events without the need for labels or enzymatic reporters [21]. Measurements are real time, quantitative, and inherently compatible with flow or static sample formats, making SPR well suited for continuous or repeated urine analyses [22].
Compared with many electrochemical or colorimetric assays, SPR eliminates exogenous reagents and reduces susceptibility to label instability or batch variability [23]. It supports kinetic measurements, enabling discrimination between transient adsorption and stable binding, and it can be engineered for multiplexing across spots or channels. These features provide high analytical sensitivity, operational simplicity, and a path to miniaturization. However, conventional metal-film SPR sensors are not without limitations [24,25]. Bare noble-metal interfaces can exhibit modest field overlap with the analyte, leading to broader resonances and limited resolution [26]. Stability is challenged by drift from temperature and nonspecific adsorption, while specificity depends on surface chemistry that can degrade or foul in complex media like urine [27].
Advanced two-dimensional (2D) carbon materials offer a route to address these constraints by tailoring the optical and interfacial properties of the sensing surface [28,29]. Graphene, graphene oxide (GO), reduced graphene oxide (rGO), and semiconducting single-wall carbon nanotube (s-SWCNT) films present high surface area, well-defined electronic structure, and tunable functional groups [30,31]. When integrated above the metal and, where appropriate, separated by an ultrathin dielectric spacer, these layers can concentrate the evanescent field toward the analyte, increase effective optical path length, and sharpen the resonance through improved confinement. Their surfaces provide abundant sites for robust attachment of antifouling coatings or receptor chemistries, while π-conjugation and oxygenated functionalities modulate local refractive-index perturbations induced by glucose and matrix components [32]. In urine, where interferents and ionic strength vary, the combined optical and chemical versatility of 2D layers is particularly advantageous for maintaining sensitivity and stability [33].
Although numerous studies have advanced SPR for glucose detection, most platforms focus on blood or simplified buffers, and comparatively few examine multilayer architectures that leverage 2D nanomaterials specifically for noninvasive detection in urine [34]. The gap is twofold: first, a need to optimize heterostructures—metal, dielectric, and 2D layer thicknesses and optical constants—within the refractive-index window relevant to urine; second, a need to balance sensitivity with practical stability and specificity under realistic sample conditions. Addressing these needs requires a platform that enhances evanescent-field interaction with the analyte while providing a chemically amenable and low-fouling interface [35].
The present work responds to this gap by developing and analyzing multilayer SPR sensors in which graphene, GO, rGO, and s-SWCNT films serve as sensitivity-enhancing overlays tailored for urine glucose detection. By engineering the optical stack to maximize field–analyte coupling and by selecting 2D layers that support robust interfacial chemistry, the platform aims to elevate sensitivity, improve resonance quality, and sustain performance in complex samples. This strategy situates noninvasive urine monitoring not as a replacement for blood-based diagnostics in all contexts, but as a practical and accessible complement that can broaden screening and surveillance, reduce patient burden, and support timely management of metabolic health.

2. Materials and Methods

To point out, urine-glucose (UGLU) testing offers a non-invasive readout of glycemic control that complements blood measurements [8,9,10]. UGLU captures episodes of hyperglycemia that exceed the renal threshold, providing a practical screen for poor control or non-adherence without venipuncture. UGLU also reflects renal tubular handling of glucose, adding information relevant to early diabetic kidney involvement and to therapies that modulate glycosuria (e.g., SGLT-2 inhibitors). Because urine sampling is simple, low-cost, and amenable to frequent, point-of-care use, UGLU is well suited for community screening and longitudinal follow-up. We emphasize that UGLU is not a replacement for blood glucose or HbA1c; rather, it is a complementary indicator whose diagnostic value increases when interpreted alongside standard glycemic metrics and clinical context.

2.1. Theoretical Framework

The current modeling approach builds upon the theoretical frameworks established in previous works [36,37], with targeted extensions to accommodate the multilayer architectures and urine-relevant refractive-index range evaluated. Briefly, the reflective intensity of the proposed Nth-layer sensor model is calculated using the TMM (transfer matrix method). Then, the analysis of the sensor considers boundary conditions for the tangential component, with initial limit Z = Z1 = 0, and final limit Zn−1, giving the following expression:
E 1 H 1 = M i j E N 1 H N 1
In Equation (1), E1, EN−1, H1, and HN−1 represent the tangential components of the electric and magnetic fields for the initial and Nth layer, respectively. Mij indicates the transfer matrix characteristics of the Nth layer model. The transfer matrix can be computed as:
M i j = k = 2 N 1 M k i j = M 11 M 12 M 21 M 22
With M k denoting the characteristic matrix of the kth layer, as in conventional SPR calculations [36]:
M k = cos β k ( i   sin β k ) / q k i   q k sin β k cos β k
Showing
β k = 2 π d k λ 0 ε k n 1 2 sin 2 θ
And
q k = ε k n 1 2 sin 2 θ ε k
in Equations (3)–(5), λ 0 represents the wavelength of the incident light, n 1 is the refractive index, ε k represents the dielectric constant, β k represents the phase constant, θ represents the entrance angle, and d k represents the depth of the k t h layer. For comparison with experiments, we adopt the use of He-Ne laser with λ 0 = 633 nm.
After straightforward computations, the total reflection of the Nth-layer model can be expressed as:
R = M 11 + M 12   q N q 1 M 21 + M 22   q N M 11 + M 12   q N q 1 + M 21 + M 22   q N 2
By using Equation (6), the reflectance as a function of the angle of incidence (SPR curve) can be calculated.
We now move on to the primary performance metric of the proposed sensors. The first parameter is the sensitivity enhancement regarding the baseline sensors after/before pathogen adsorption, denoted as:
S R I a f t e r = ( S R I a f t e r S R I b e f o r e ) S R I b e f o r e
Then, the sensitivity to the refractive index change can be expressed as:
S R I = θ n
Here, θ represents the angle shift variation and n represents the refractive index variation.
The detection accuracy (DA) can be expressed as in terms of θ and the full width at half maximum (FWHM) of the SPR curve, as:
D A = θ F W H M
The Quality Factor (QF) can be expressed in terms of S R I and FWHM, as follows:
Q F = S R I F W H M
The Figure of Merit (FoM) can be expressed as:
F o M = S R I ( 1 R m i n ) F W H M
Here, R m i n represents the lowest normalized reflection value of the SPR curve.
The Limit of Detection (LoD) can be calculated as:
L o D = n θ × 0.005 °
Finally, the Combined Sensitivity Factor (CSF) ratio can be calculated:
C S F = S R I × ( R m a x R m i n ) F W H M
R m a x represents the maximum reflectance before resonance, typically at non-resonant wavelengths or angles. All computations in this investigation are performed with a data sampling of 5 × 10 4 points, assuming a TM-polarized light, as required for surface plasmon excitation at the metal–dielectric interface.
We first benchmarked the transfer-matrix solver by reproducing the angular SPR response of an Au/graphene stack in water at 633–634 nm from Ref. [38], matching the reported number of graphene layers (Figure S1). Agreement was quantified using (i) the absolute resonance-angle error and (ii) the root-mean-square reflectance residual within the resonance window. Simulations employed the same architecture and optical constants as Ref. [38] (BK7 prism/Au/graphene; aqueous medium). The fitted traces closely track the experimental dip and side wings, validating the optical model and dispersion inputs independently of glucose chemistry. Having established this baseline on Au/graphene/water, we then replaced the medium with the UGLU refractive-index ladder and carried out the SF6/metal/Si3N4/GO optimizations reported here.

2.2. Biosensor Structure and Initial Parameters

The biosensor operates in the Kretschmann configuration at 633 nm, using well-established experimental/theoretical optical constants and thickness values, including UGLU [39]. A p-polarized beam enters a SiO2 prism [40] and strikes a thin Au film [41] at an angle θ that excites surface plasmons at the metal–dielectric interface. An ultrathin Si3N4 spacer [42] separates the gold from a 2D nanomaterial overlay—graphene [43], semiconducting single-wall carbon nanotubes (s-SWCNT) [44], graphene oxide (GO) [45], or reduced graphene oxide (rGO) [45]—which contacts the urine–glucose sensing medium [39]. Figure 1 illustrates this optical path: the incident ray refracts into the prism, reflects off the metal film, and the reflected signal is captured by the detector while the stack order from the prism side to the sample is SiO2/Au/Si3N4/2D layer/urine. The figure also shows the four candidate 2D materials used in the study.
At the start of the analysis, we established the optical constants and nominal thicknesses for each layer, which define the baseline model used for later optimizations and concentration sweeps. The prism index was set to 1.4607 [40], gold to 0.1378 + 3.6196i [41], and the Si3N4 spacer to 2.0394 [42]. The urine medium used as the baseline sensing layer had a refractive index of 1.335 [39]. The 2D overlays had the following nominal thicknesses: graphene 0.34 nm, s-SWCNT 2.04 nm, GO 2.55 nm, and rGO 1.41 nm [43,44,45]. These parameters are detailed in Table S2 and form the initial multilayer stacks for Sys1–Sys4.

3. Results and Discussions

To start, we measure four key metrics that relate optical response to practical detectability. Resonance-angle shift ( Δ θ ) captures the main transduction for angular interrogation and directly links to a reader’s angular resolution. Relative sensitivity enhancement normalizes improvements against baseline systems, allowing fair comparisons between materials; its similarity to Δ θ reflects their shared origin in coupling changes, while the normalized form isolates material benefit from absolute scale. Dip attenuation (depth) determines usable contrast and dynamic range—being too shallow hampers tracking; being too deep risks detector saturation, especially in portable devices. FWHM defines linewidth and, therefore, slope at resonance, noise tolerance, and drift robustness.

3.1. Systems Considered in This Study

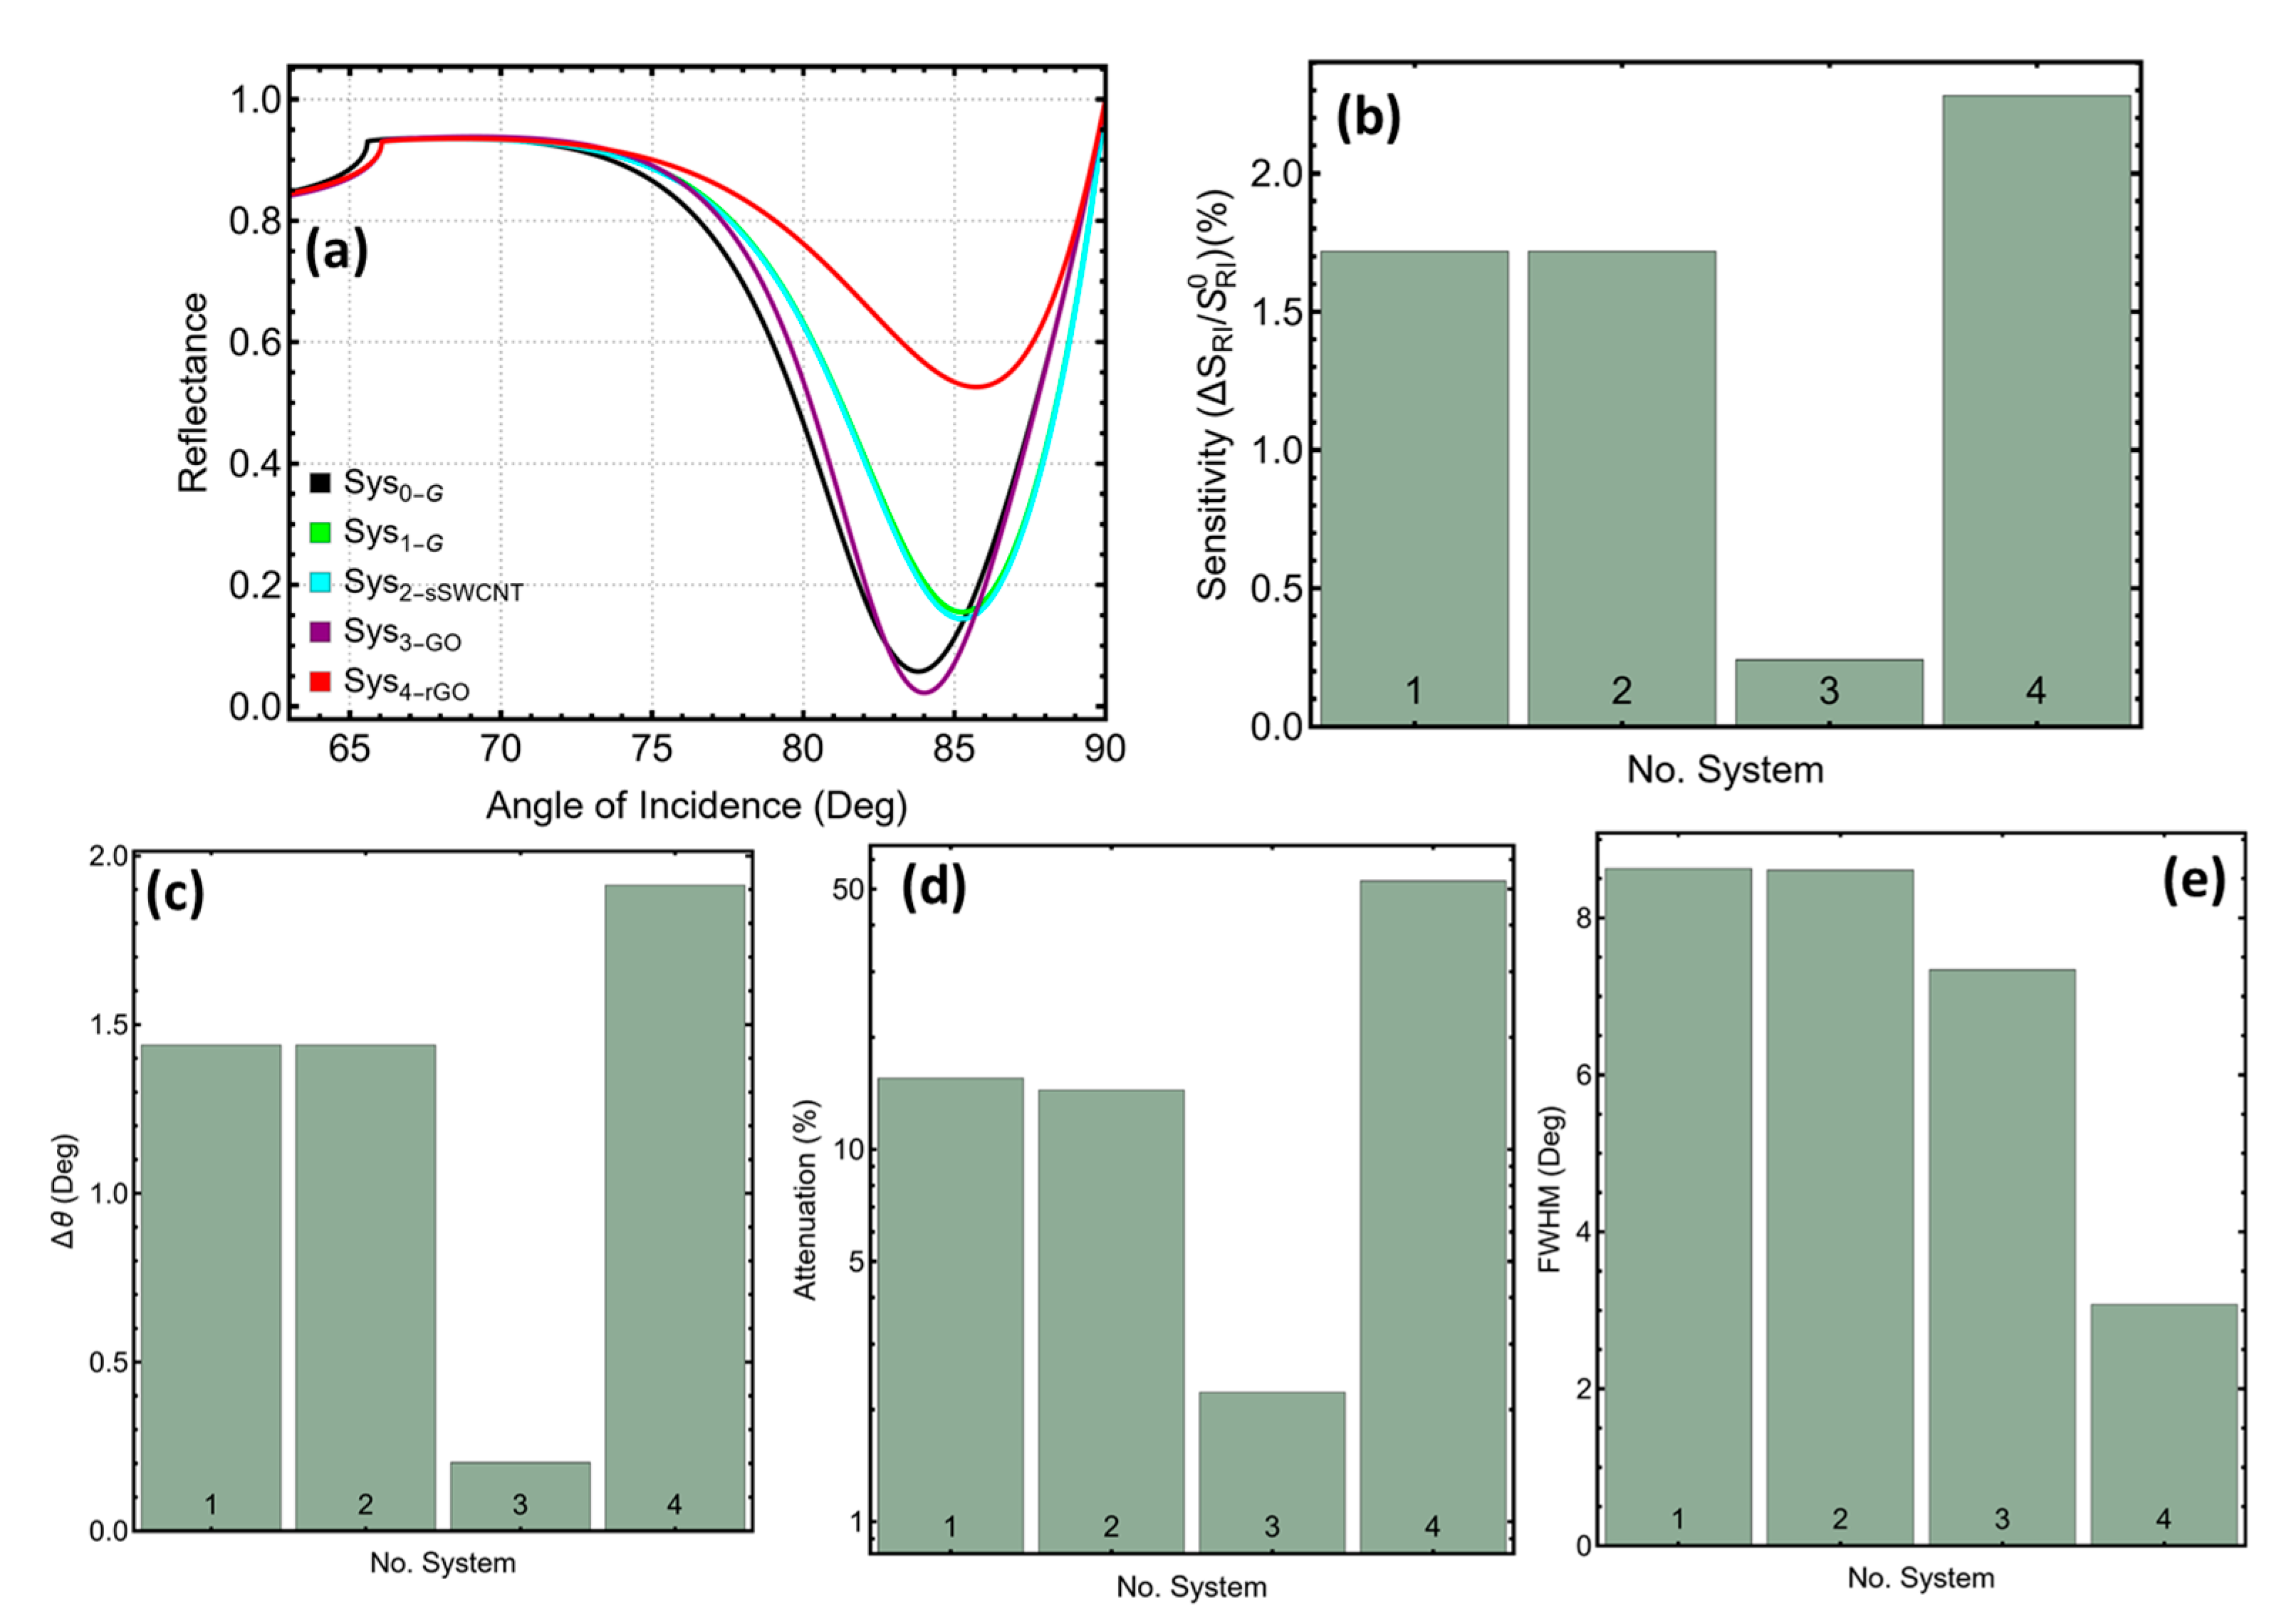
Figure 2 represents the baseline angular SPR response at 633 nm, showing how the four 2D overlayers reshape the resonance compared with the reference stack before any thickness optimization or glucose-induced index change.
Figure 2. Angular SPR performance of multilayer sensors at 633 nm. (a) Reflectance versus angle for the reference (Sys0) and 2D-material stacks (Sys1–Sys4: graphene, s-SWCNT, GO, rGO). (b) Sensitivity enhancement relative to Sys0. (c) Resonance shift Δθ. (d) Dip attenuation. (e) FWHM. Panels (be) plot the corresponding values listed in Table 1.
Photonics 12 01089 g002
Figure 2a compares the reflectance–angle curves for the reference stack (Sys0) and the four carbon-material stacks. The resonance minima are well separated regarding Sys0 and already show how the top layer sets the working point of the biosensor. The graphene and s-SWCNT curves dip at almost the same angle as each other and slightly to the right of the reference, while GO shifts the dip to a lower angle with a shallow minimum. rGO produces the largest rightward shift and the deepest minimum, indicating stronger coupling to the surface plasmon mode. These qualitative differences are quantified in Table 1 and in the bar plots of Figure 2b–e.
Table 1. Baseline angular SPR metrics at 633 nm for carbon-overlayer sensors (Sys1–Sys4). Listed are the peak angle, relative sensitivity enhancement, resonance shift, dip attenuation, and FWHM. These numerical values are the data plotted in Figure 2b–e.
Sys No.CodeSPR Peak PositionSensitivity Enhancement (%) θ (Deg)Attenuation (%)FWHM
1Sys185.251.711.4415.528.62
2Sys285.251.711.4414.428.60
3Sys384.010.240.202.227.33
4Sys485.722.281.9152.603.07
The sensitivity enhancement is reported in Figure 2b and Table 1. Graphene and s-SWCNT each increase sensitivity by 1.71% relative to the reference, GO offers only a 0.24% increase, and rGO provides the highest gain at 2.28%. This ordering mirrors how far each curve moves from the reference in Figure 2a: rGO shows the clearest separation, GO the least. Although these percentages are modest at the baseline, they establish that the choice of 2D overlayer can improve the response even before any thickness optimization.
The absolute resonance shifts are plotted in Figure 2c (numerical values in Table 1). Both graphene and s-SWCNT shift the peak by 1.44°, GO by only 0.20°, and rGO by 1.91°. The combination of a larger Δ θ and a distinct minimum in Figure 2a suggests that rGO can deliver a stronger angular signal per refractive-index change, whereas GO perturbs the mode only weakly. Graphene and s-SWCNT sit between these two cases and behave almost identically at this wavelength and baseline stack.
Figure 2d visualizes the dip attenuation. GO attenuates the reflectance by just 2.22%, giving a shallow minimum in Figure 2a that may be robust against noise but offers limited contrast. Graphene and s-SWCNT deepen the dip to 15.52% and 14.42%, respectively, which improves contrast without severely narrowing the resonance. rGO reaches 52.60% attenuation, creating a very pronounced minimum. While such depth improves detectability, it can also make the system more sensitive to scattering losses or alignment errors, a point to consider for a practical urine test.
In Figure 2e, the linewidths distinguish the four stacks in terms of angular precision. rGO (Sys4) exhibits the narrowest FWHM (3.07°), implying a steep local slope and high sensitivity to small angle changes; GO (Sys3) is 7.33°, while graphene (Sys1) and s-SWCNT (Sys2) are slightly broader at 8.62° and 8.60°, respectively. A smaller FWHM benefits angle-tracking precision but increases susceptibility to drift and alignment errors; conversely, broader lines are more tolerant but reduce slope. Thus, Figure 2e isolates the precision–robustness trade-off set by linewidth, independent of absolute shift or contrast shown in the other panels. Values correspond to Table 1.
Figure 2 and Table 1 show that material choice alone sets distinct starting points for the biosensor. rGO maximizes shift, contrast, and sharpness at the baseline; GO minimizes all three; and graphene and s-SWCNT form a matched pair with intermediate performance. These baselines define how each stack will respond when the urine refractive index increases with glucose concentration in the next analysis.

3.2. Gold Thickness Optimization

Figure 3 summarizes how the Au film tunes coupling across the four stacks at 633 nm, with panels reporting the resonance shift Δ θ , the percentage sensitivity enhancement relative to the bare-Au reference, the dip attenuation, and the FWHM as Au increases from 30 to 55 nm. The caption lists the four systems explicitly—Sys1 graphene, Sys2 s-SWCNT, Sys3 GO, and Sys4 rGO—and defines the plotted quantities. Table S3 provides the corresponding numerical sweep at Au = 30, 35, 40, 45, 50, and 55 nm for each metric and system, allowing a direct read-back from the curves.
Panels 3a and 3b show that graphene, s-SWCNT, and GO follow a similar U-shaped trend with a shallow minimum near 40 nm. The table places those minima at Δθ = 0.47° for Sys1 and 0.45° for Sys2 at 40 nm, increasing toward the sweep edges to 2.45° at 30 nm and 1.75° at 50–55 nm for Sys1, and 2.49° at 30 nm and 1.75° at 55 nm for Sys2. GO behaves likewise, dropping to Δ θ = 0.42° at 40 nm and rising to 2.02° at 30 nm and 2.83° at 55 nm. The associated sensitivity-enhancement values are modest near 40 nm—0.56% (Sys1), 0.53% (Sys2), and 0.51% (Sys3)—but grow as Au thickens, with Sys3 reaching 2.86% at 50 nm and 3.43% at 55 nm, mirroring the upward right-hand branches in Figure 3a,b.
Sys4 must be interpreted separately because rGO couples more sharply. In Figure 3a its Δ θ minimum sits at 45 nm; Table S3 reports Δ θ = 0.11° at 45 nm, flanked by larger shifts at the edges, 2.29° at 30 nm and 0.90° at 55 nm. The sensitivity enhancement is equally pronounced, from 0.13% at 45 nm to only 0.34% at 35 nm and 1.05% by 55 nm, matching the dashed blue valley in Figure 3b. These same rows list the resonance angles that underpin the trend, with θ SPR moving from 86.13° at 40 nm to 85.72° at 45 nm and then to 84.71° at 55 nm.
Panel 3c makes the principal trade-off explicit: the shallow-dip regime around 40–45 nm coincides with low attenuation, while thicker Au deepens the dip substantially. For Sys1 and Sys2 the attenuation bottoms out near 40 nm at 0.27% and 0.15% and then climbs to 42.28–63.58% and 41.05–62.77% at 50–55 nm, respectively. GO exhibits a similar valley, from 2.30% at 40 nm to 18.48% at 50 nm and 41.21% at 55 nm. Sys4 shows the steepest rise: attenuation is still modest at 35–40 nm—0.14% and 18.91%—but it jumps to 52.60% at 45 nm and exceeds 70% at 50–55 nm, consistent with the dashed-blue ascent in panel 3c.
The linewidths in Figure 3d clarify why those shallow-dip points are attractive for angular interrogation. Graphene and s-SWCNT contract from broad linewidths at 30 nm to about 8.6° near 40–45 nm, tightening further for graphene to 3.61° at 55 nm even as the dip deepens. GO remains in a stable 7.3–8.1° band between 40 and 55 nm, contrasting with the 130.00° breadth at 30 nm. Sys4 is again distinctive: it reaches its narrowest FWHM at 45 nm with 3.07°, but the table records a dramatic broadening to 349.81° at 55 nm, a signature of over-coupling that matches the rising dashed-blue trace in panel 3d.
The Au sweep maps practical operating windows. For Sys1–Sys2, the low-attenuation region spans 35–40 nm: attenuation at 35 nm is lower than at 45 nm, and both systems exhibit a shallow minimum in Δ θ and sensitivity near ~40 nm, with FWHM ≈ 8–9° that eases alignment and thermal tolerance. We therefore emphasize 40 nm as a pragmatic compromise where attenuation remains low, Δ θ and sensitivity sit at their minima, and the linewidth is modest. Sys3 (GO) benefits from slightly thicker Au, where sensitivity increases while FWHM stays within ~7–8°, accepting a deeper dip as a trade-off. Sys4 (rGO) behaves distinctly: Δθ and FWHM narrow near ~45 nm, but attenuation grows rapidly beyond this point; the combination motivates keeping rGO-based stacks close to ~45 nm and avoiding the thick Au limit. This clarified description aligns the qualitative trends in Figure 3 with the numerical sweep in Table S3.

3.3. Silicon Nitride Thickness Optimization

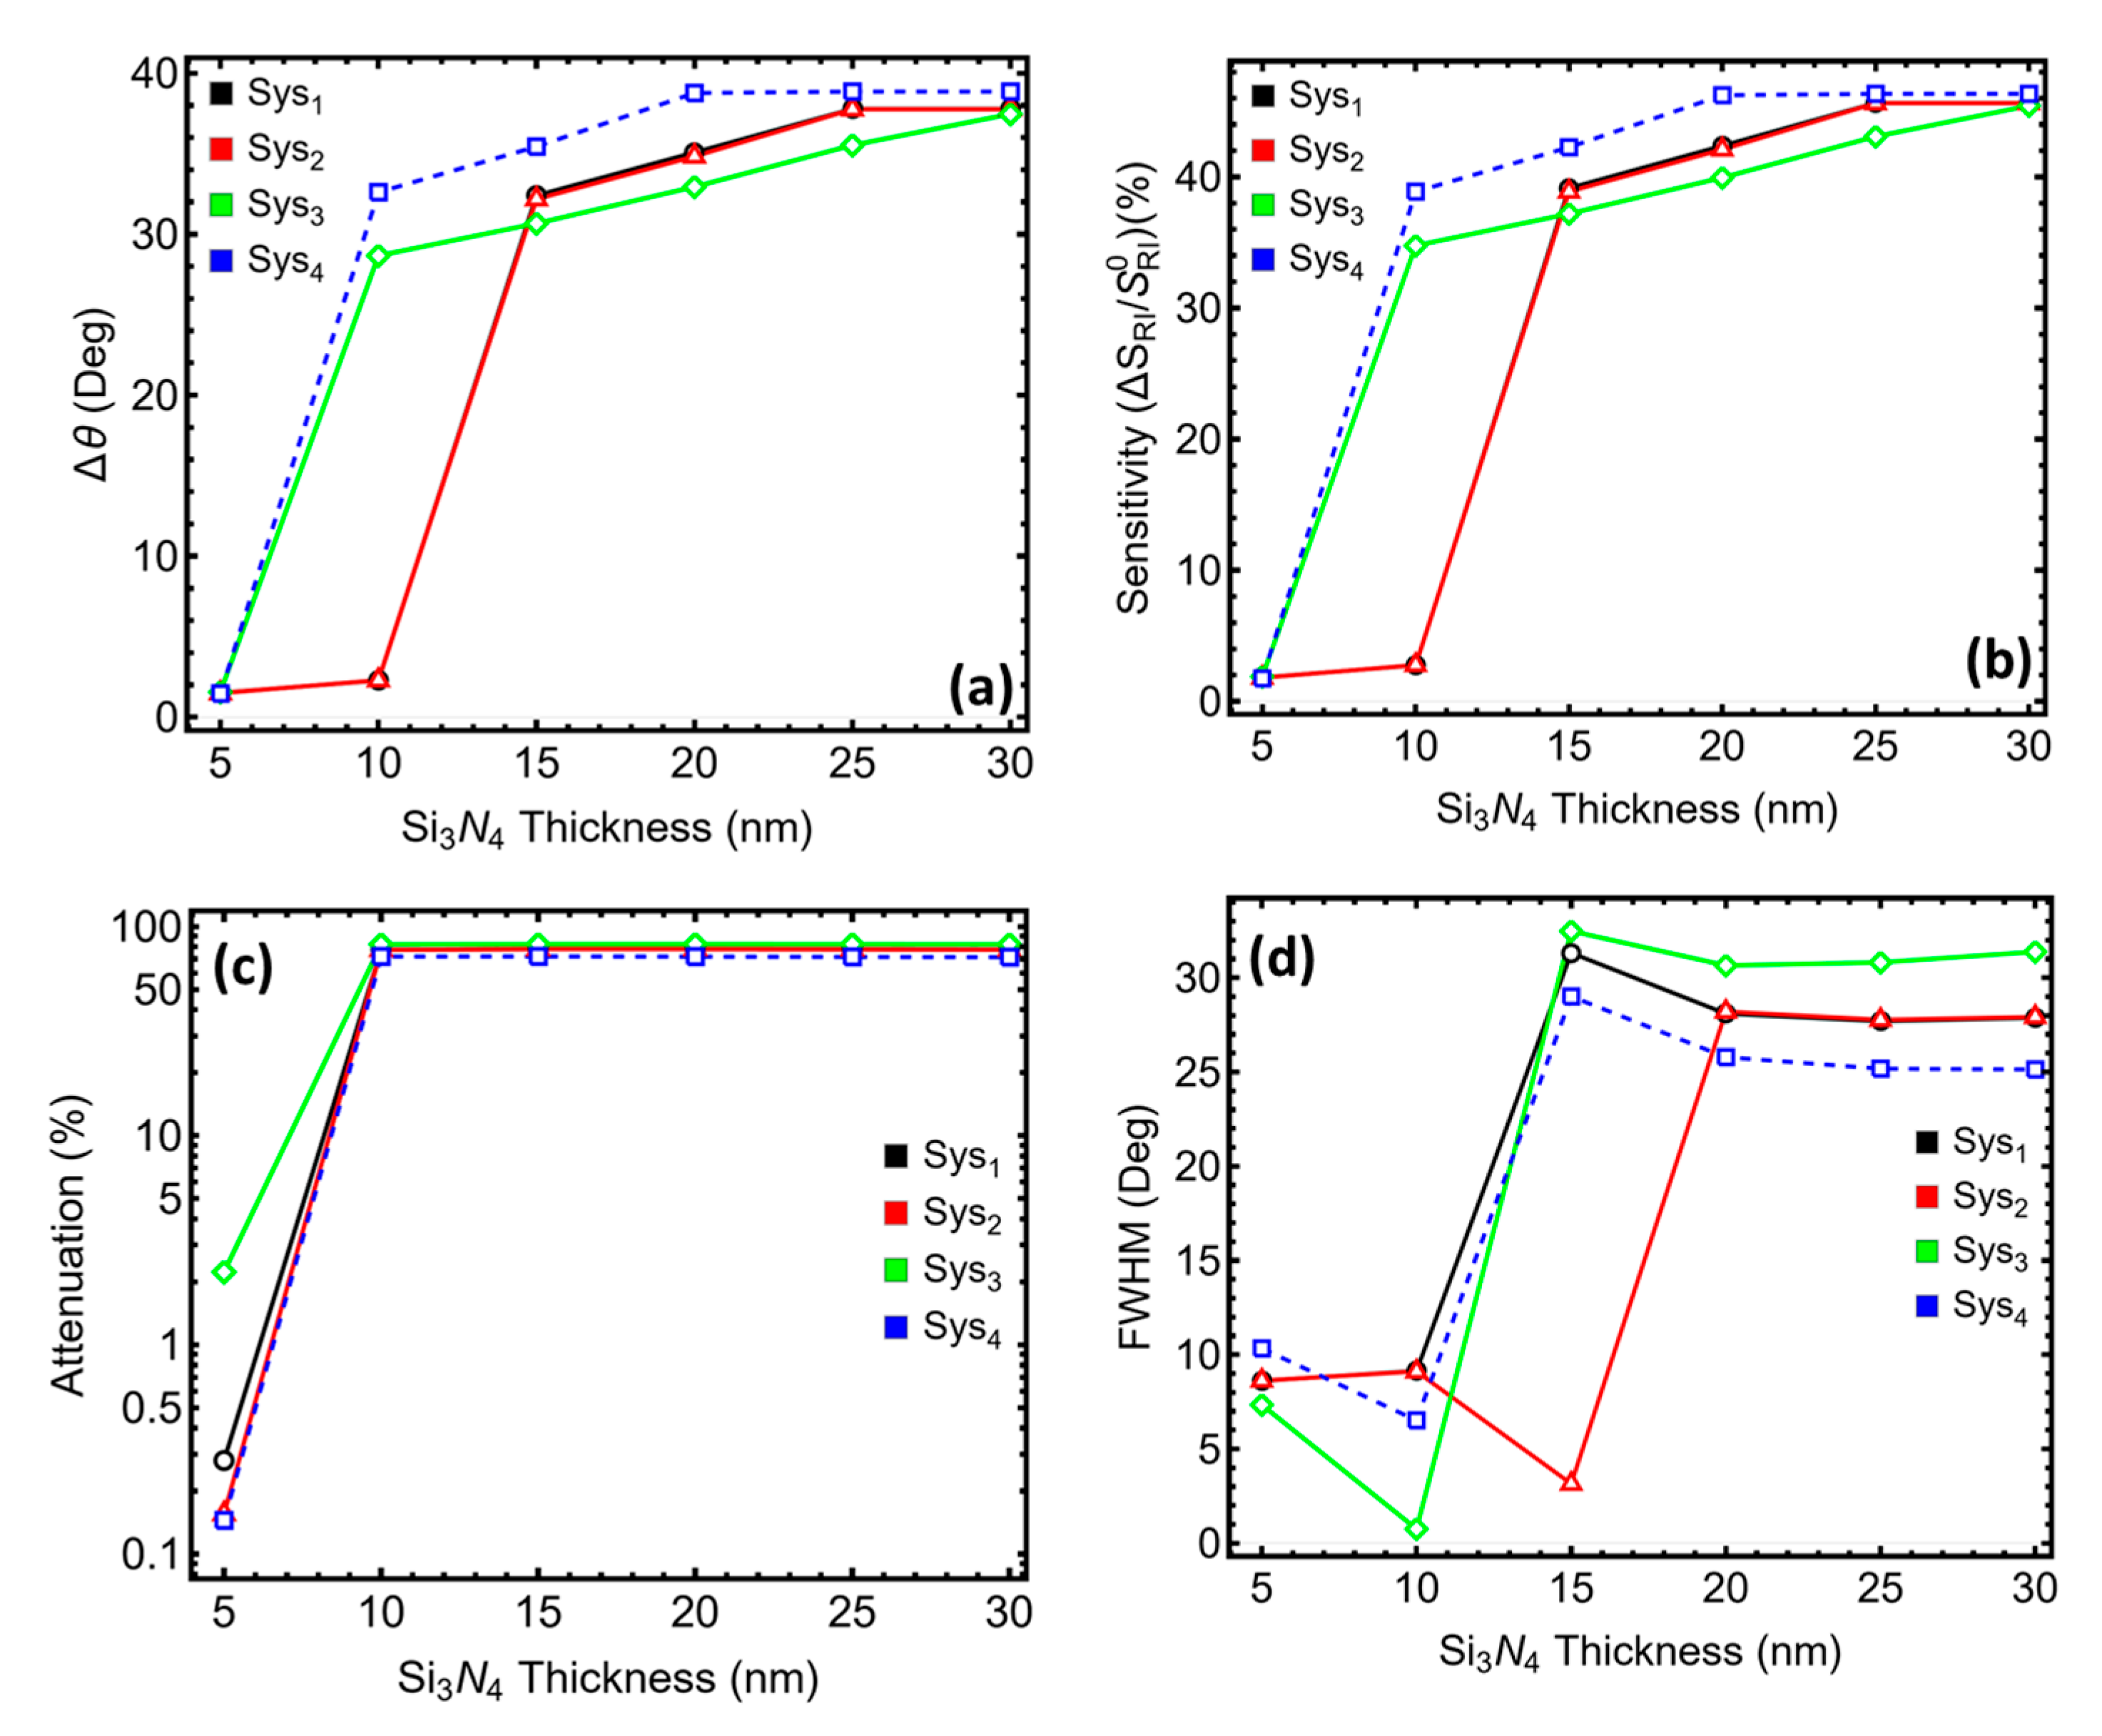
Figure 4 examines the Si3N4 spacer as the coupling knob, plotting resonance shift Δθ, percentage sensitivity enhancement relative to the Sys0 reference, dip attenuation, and FWHM versus spacer thickness for the four stacks at 633 nm; the caption also notes that thicker spacers strengthen the evanescent field and push Δθ and sensitivity toward saturation while deepening the dip and broadening the linewidth. Table S4 lists the same sweep numerically from 5 to 30 nm for Sys1–Sys4, reporting θSPR, Δθ, sensitivity enhancement, attenuation, and FWHM at each thickness.
Across panels 4a and 4b, Δθ and sensitivity climb rapidly once the spacer exceeds ~10 nm and then approach plateaus by ~20–30 nm, with system-specific onsets that are reproduced in the table. For graphene (Sys1), Δθ grows from 1.50° at 5 nm to 32.40° at 15 nm and 37.77° by 25–30 nm, while sensitivity enhancement rises from 1.82% to 39.14% at 15 nm and 46.63% at 30 nm. s-SWCNT (Sys2) follows the same trajectory, with Δθ = 1.48° at 5 nm, 32.17° at 15 nm, and 37.75° at 25–30 nm; its sensitivity enhancement increases from 1.79% to 38.87% at 15 nm and 45.62% at 25–30 nm. GO (Sys3) behaves similarly but with a slightly delayed rise: Δθ = 1.55° at 5 nm, then 28.66° at 10 nm and 35.52° at 25 nm, with sensitivity enhancement moving from 1.88% to 34.76% at 10 nm and 45.42% at 30 nm. The rGO stack (Sys4) shows the same step-up and saturation: Δθ = 1.46° at 5 nm, 32.60° at 10 nm, 35.43° at 15 nm, and 38.85° by 25–30 nm; sensitivity enhancement grows from 1.74% at 5 nm to 38.87% at 10 nm and 46.33% at 25–30 nm. These numerical trends mirror the near-vertical rises and subsequent flattening in panels 4a–b and are consistent with the caption’s saturation remark.
Panel 4c visualizes the cost of stronger coupling: the reflectance minimum deepens sharply around the same thickness where Δθ saturates. For graphene, attenuation jumps from 0.27% at 5 nm to 77–78% at 10–30 nm. s-SWCNT shows an almost identical increase from 0.15% to about 77–78% across 10–30 nm. GO moves from 2.22% at 5 nm to 82–83% from 10 to 30 nm. rGO displays the same deepening, rising from 0.14% to roughly 71–72% once the spacer reaches 10–30 nm. The collective picture is the trade-off emphasized in the caption: thicker spacers boost signal but drive the dip into a high-attenuation regime that may limit dynamic range in reflectance-based readout.
The linewidth evolution in panel 4d completes the trade-off. For graphene, FWHM broadens from 8.61° at 5 nm to 31.31° at 15 nm and remains near 28° at 20–30 nm, tracking the black curve’s rise. s-SWCNT displays a similar pattern but with a narrow point at 15 nm (3.15°) followed by broadening to 28.20° at 20 nm and about 27–28° at 25–30 nm. GO starts narrow at 5 nm (7.33°), dips to 0.75° at 10 nm, then broadens to ~30–31° from 15 to 30 nm, matching the green trace that collapses and then expands. rGO begins at 10.33° for 5 nm, tightens at 10 nm to 6.51°, then widens to 29.00° at 15 nm and settles around 25–26° from 20 to 30 nm, reproducing the blue curve’s kink and plateau.
Figure 4 and Table S4 show that increasing the Si3N4 thickness reliably amplifies Δθ and sensitivity across Sys1–Sys4 but at the expense of deeper minima and broader resonances once the spacer exceeds roughly 15–20 nm, precisely as claimed in the caption. For practical sensing, the low-thickness end (around 5–10 nm) preserves manageable attenuation and moderate FWHM, whereas the high-thickness end provides large Δθ and percentage gains but demands careful optical power budgeting and angular tracking. The rGO system is notable for combining an early rise in Δθ and sensitivity with comparatively moderate high-thickness FWHM (~25–29° at 20–30 nm), while GO reaches similar Δθ and sensitivity but incurs slightly higher broadening in the same range; graphene and s-SWCNT fall between these cases with nearly overlapping metrics, so downstream choices can prioritize either headroom in reflectance or raw angular response depending on the operating point suggested by Figure 4.

3.4. Low-Dimensional Thickness Layer Optimization

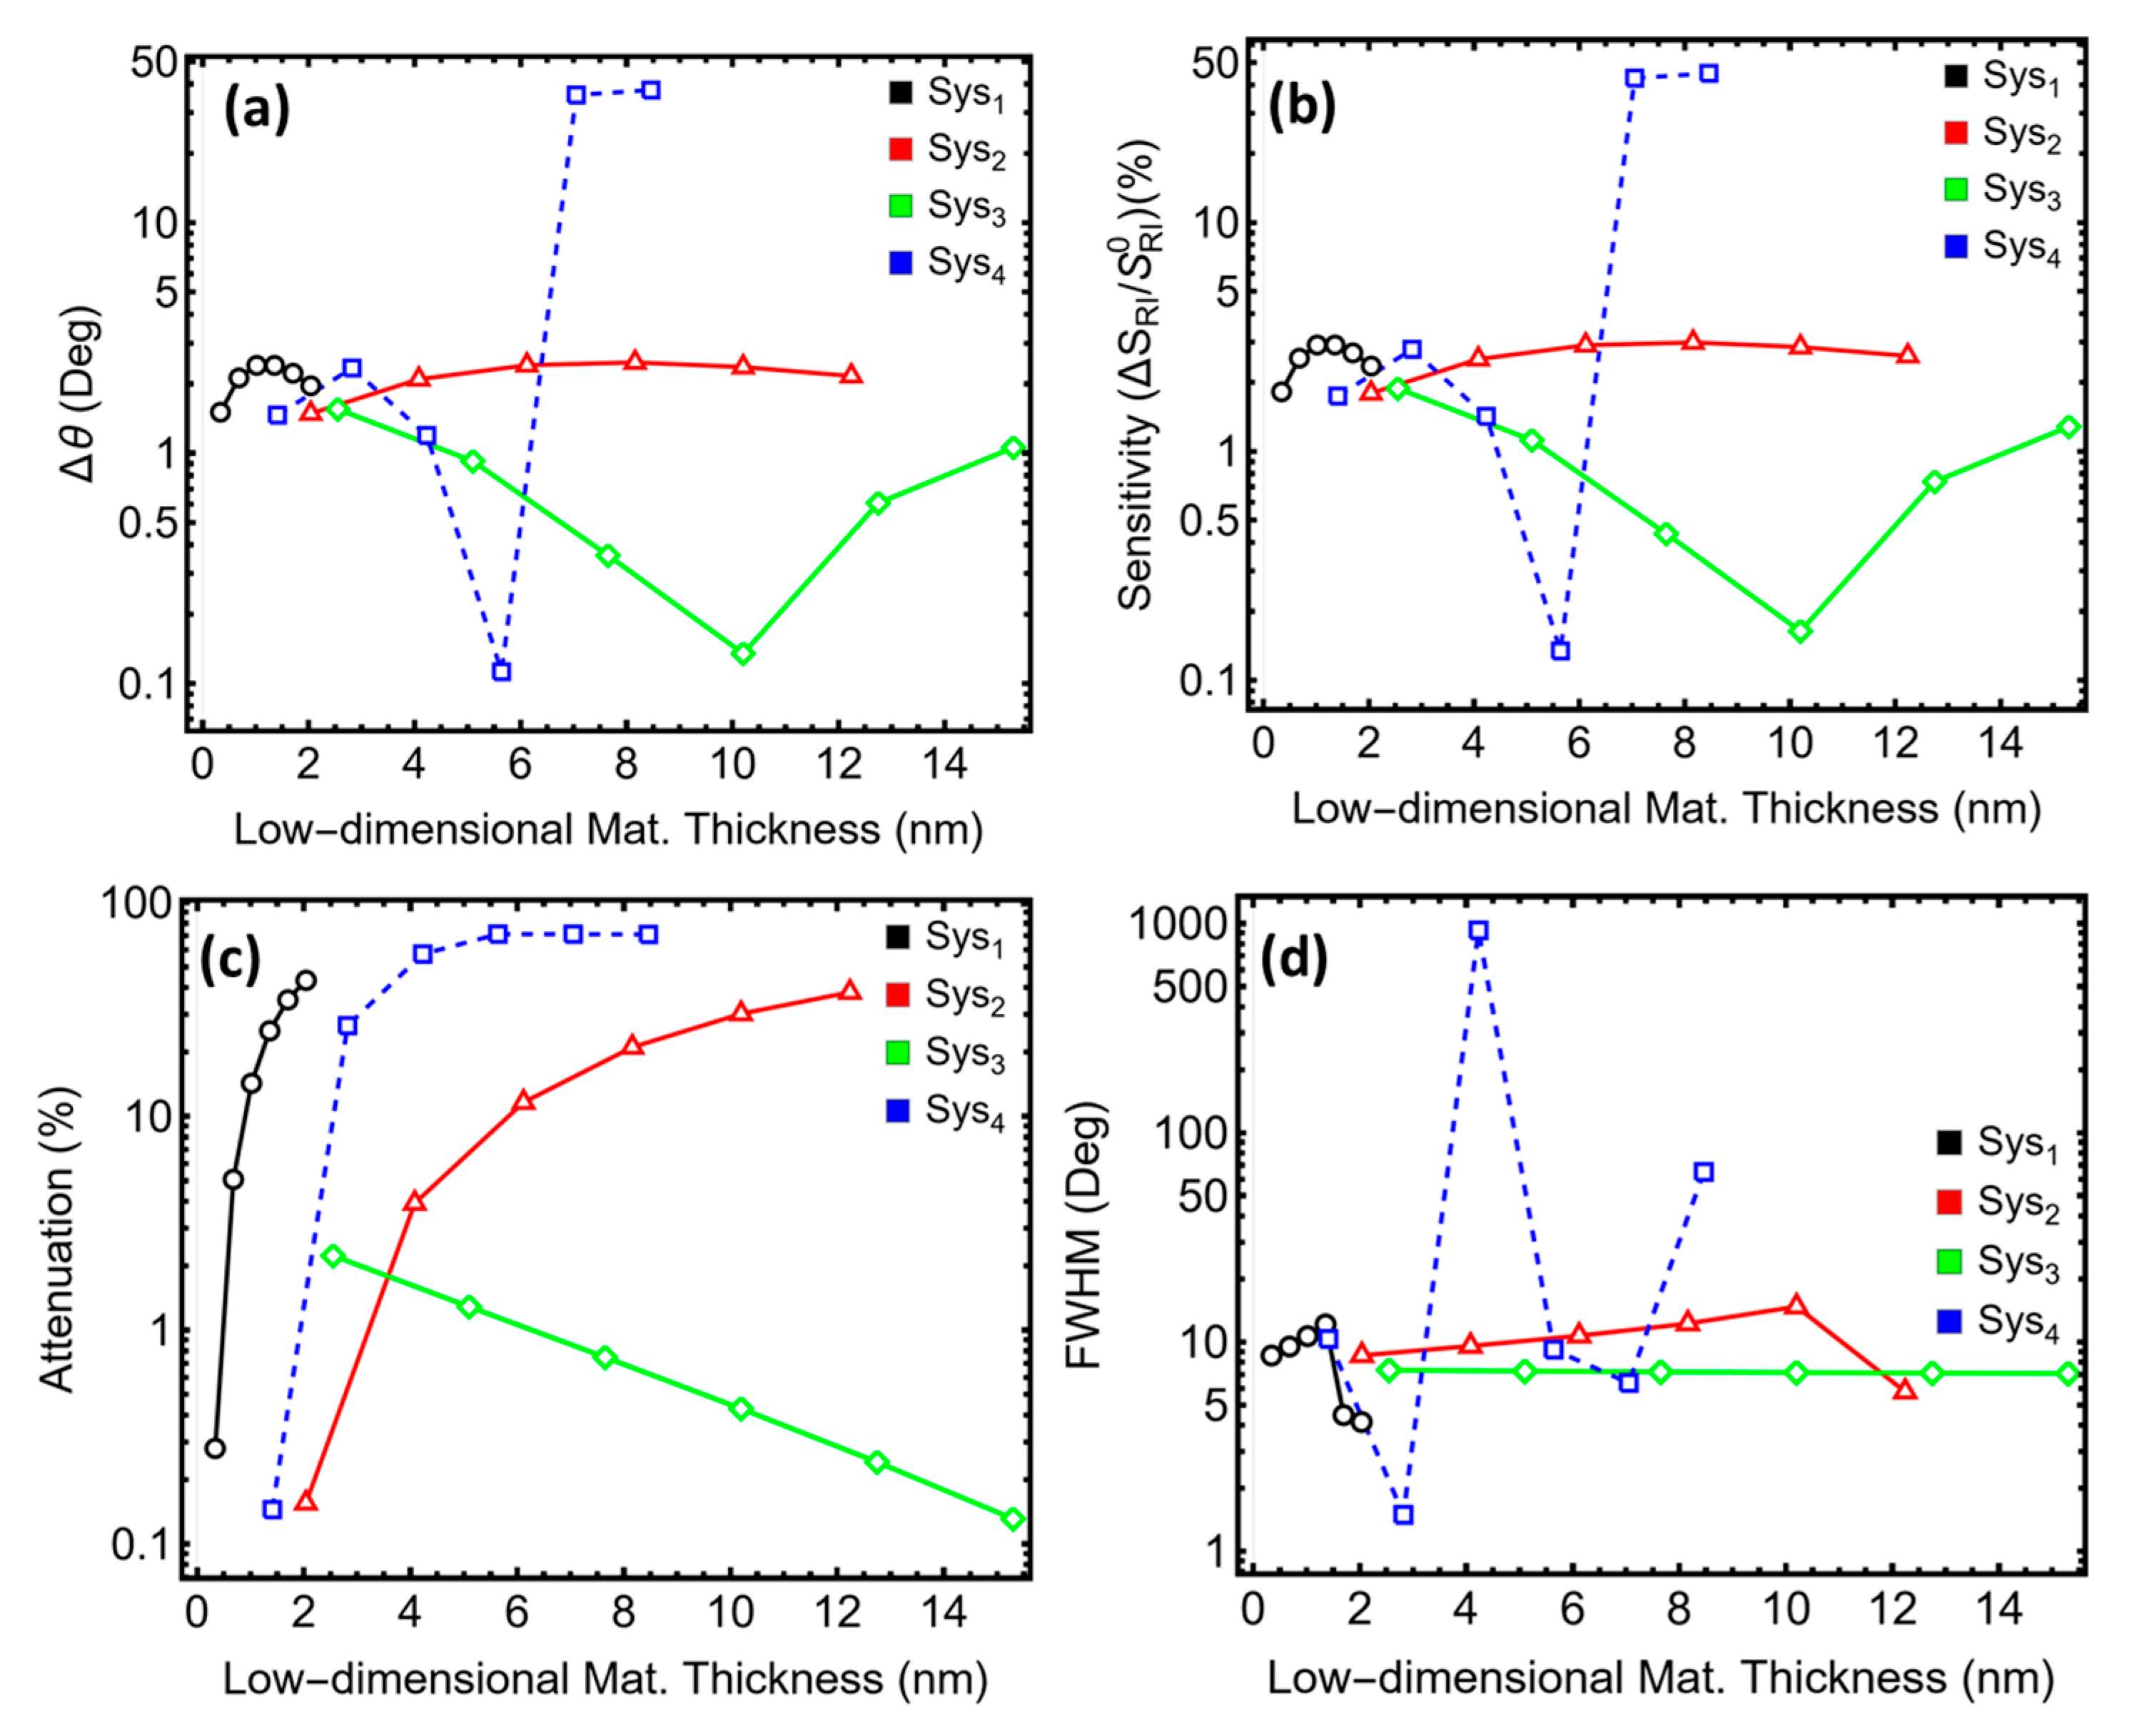
We resolved how the reduced graphene oxide overlayer governs the optical operating point of the rGO-based stack (Sys4) by sweeping its thickness and reading out the four canonical responses in Figure 5, with the corresponding values compiled in Table S5. The resonance-shift panel in Figure 5a reveals the hallmark behavior of rGO: the angle shift stays modest near the monolayer limit and then undergoes a threshold-like jump when the film exceeds roughly 7 nm. At 1.41 nm the shift is about 1.46°, rises slightly at 2.82 nm to 2.34°, collapses around 4.23–5.64 nm to 1.19° and 0.11°, and then surges to 35.84° and 37.62° at 7.05 and 8.46 nm, respectively, far exceeding the shifts attained by graphene, s-SWCNT, or GO in the same panel (Table S5). The sensitivity enhancement in Figure 5b tracks this nonlinearity: Sys4 begins gently at 1.74% and 2.79% for 1.41 and 2.82 nm, dips around 4–6 nm, and then leaps to 42.74% and 44.86% once the film is thick enough to re-establish strong coupling, whereas the other stacks change gradually with thickness in this range (Table S5).
Line-shape metrics explain why the extreme-shift regime is not automatically the best sensing regime. The attenuation plot in Figure 5c shows that rGO remains exceptionally low-loss at 1.41 nm (0.14%) but climbs steeply to tens of percent beyond 2–3 nm, plateauing around 70% once the high-shift branch is reached; graphene and s-SWCNT follow a slower rise and GO remains the most benign. The linewidth panel in Figure 5d provides the decisive constraint: the rGO resonance is reasonably narrow at 1.41 nm (10.33°), broadens at 2.82 nm, and then exhibits a catastrophic blow-up near 4.23 nm where the full width at half maximum explodes to 925.64°, consistent with an overcoupled, ill-defined minimum; the line partially recovers at 5.64 nm (9.19°), sharpens at 7.05 nm (6.36°), and broadens again by 8.46 nm (64.90°), signaling an increasingly lossy interface as the rGO film thickens (Table S5). In contrast, GO holds a nearly thickness-independent, narrow linewidth near ~7° over the whole sweep, and the carbon allotropes without oxygenated defects show only moderate broadening.
These coupled trends define a practical optimum for Sys4. Although the largest angular shifts in Figure 5a occur for rGO ≥7 nm, Figure 5c,d demonstrate that this regime exacts a severe penalty in attenuation and linewidth, which would propagate as higher uncertainty in angle picking and degraded detectability. The balanced point therefore lies at the thin-film end of the curve, where the shift is smaller but the line remains well-formed and the dip is shallow enough for stable interrogation. The values at 1.41 nm—Δθ ≈ 1.46°, sensitivity enhancement ≈ 1.74%, attenuation ≈ 0.14%, and FWHM ≈ 10.33°—capture this balance and rationalize why the optimized stack in subsequent sections uses an ultrathin rGO overlayer rather than the thicker, high-shift alternative (Table S5). In short, Figure 5a–d and Table S5 together show that rGO introduces a thickness-driven bifurcation between a low-loss, metrology-friendly regime at ≲2 nm and a high-shift, high-loss regime beyond ~7 nm; choosing the former underpins the optimized system’s stability in the urine-glucose experiments that follow.

3.5. Glucose at Different Concentrations and Related Refractive Index

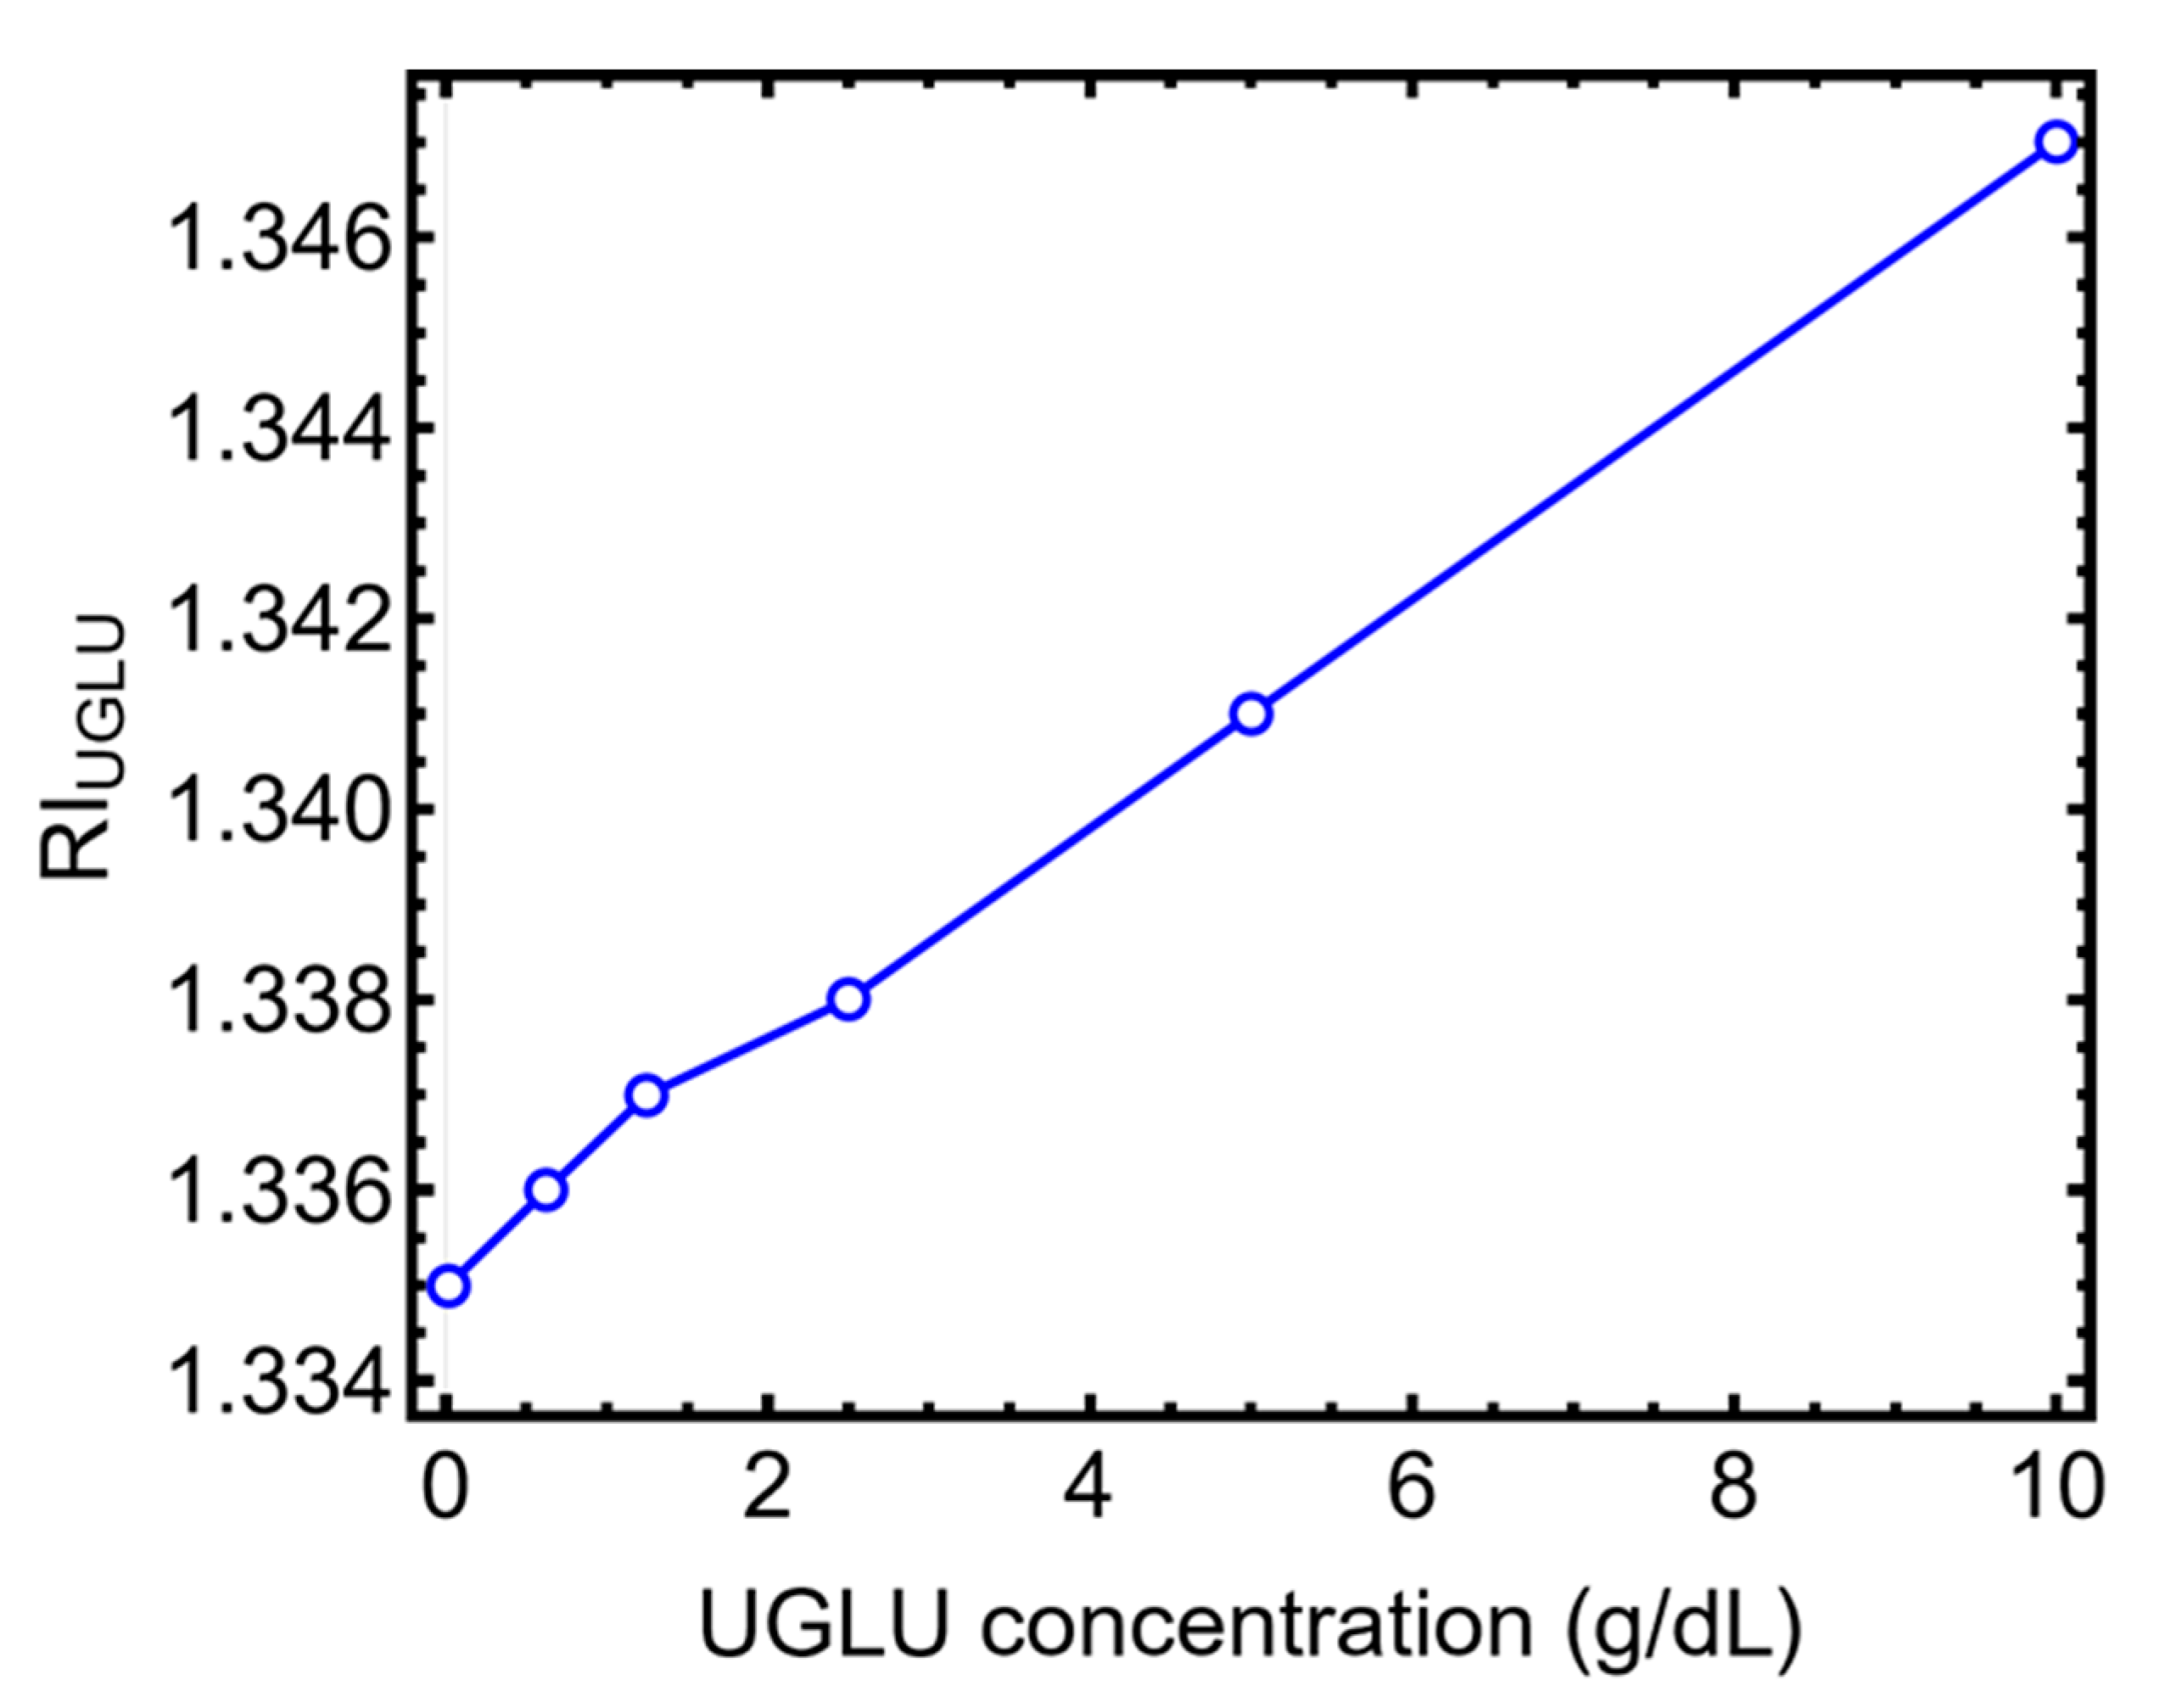
Figure 6 establishes the analyte model by plotting the refractive index of the urine–glucose mixture RIUGLU against glucose concentration from 0 to 10 g dL−1, and it states that these values constitute the refractive-index ladder used in all SPR simulations, increasing nearly linearly over the clinically relevant range. The ladder itself is tabulated in Table S7: the baseline “up to 0.015 g dL−1” case is assigned RI = 1.335, after which the index rises in roughly 0.001 steps through 0.625 g dL−1 (RI = 1.336), 1.25 g dL−1 (RI = 1.337), and 2.5 g dL−1 (RI = 1.338). The higher anchors used for the upper half of the plot are 5.0 g dL−1 with RI = 1.341 and 10.0 g dL−1 with RI = 1.347.
Interpreted together, the figure and the table define six calibration points that map concentration in g dL−1 to discrete RI values; the markers in the figure trace a broken line through these tabulated RIs, which is why the caption emphasizes the near-linear trend. Because the increments are not perfectly uniform—note the larger step between 1.341 and 1.347 from 5.0 to 10.0 g dL−1—the linearity is an approximation that nevertheless provides a convenient working model for converting concentration changes into ΔRI for the angular simulations. The table format also clarifies the units used in the plot axes: concentration is expressed in g dL−1 and the refractive index is unitless, matching the axis labels RI and UGLU concentration in the figure.
This ladder underpins all downstream sensing curves: each simulated point at a given concentration is effectively a calculation at one of the tabulated RIs. As a result, the resolution of any fitted sensitivity or limit-of-detection curve is tied to the spacing of these RI anchors, especially at the high end where the 5.0→10.0 g dL−1 step corresponds to ΔRI = 0.006, larger than the 0.001 steps used at low concentrations.

3.6. UGLU Sensing

The sensing behavior was quantified on the four optimized stacks defined in Table S6—Sys1 with graphene, Sys2 with s-SWCNT, Sys3 with GO, and Sys4 with rGO—using angle interrogation at 633 nm across urine–glucose levels from 0.01 to 10 g dL−1.
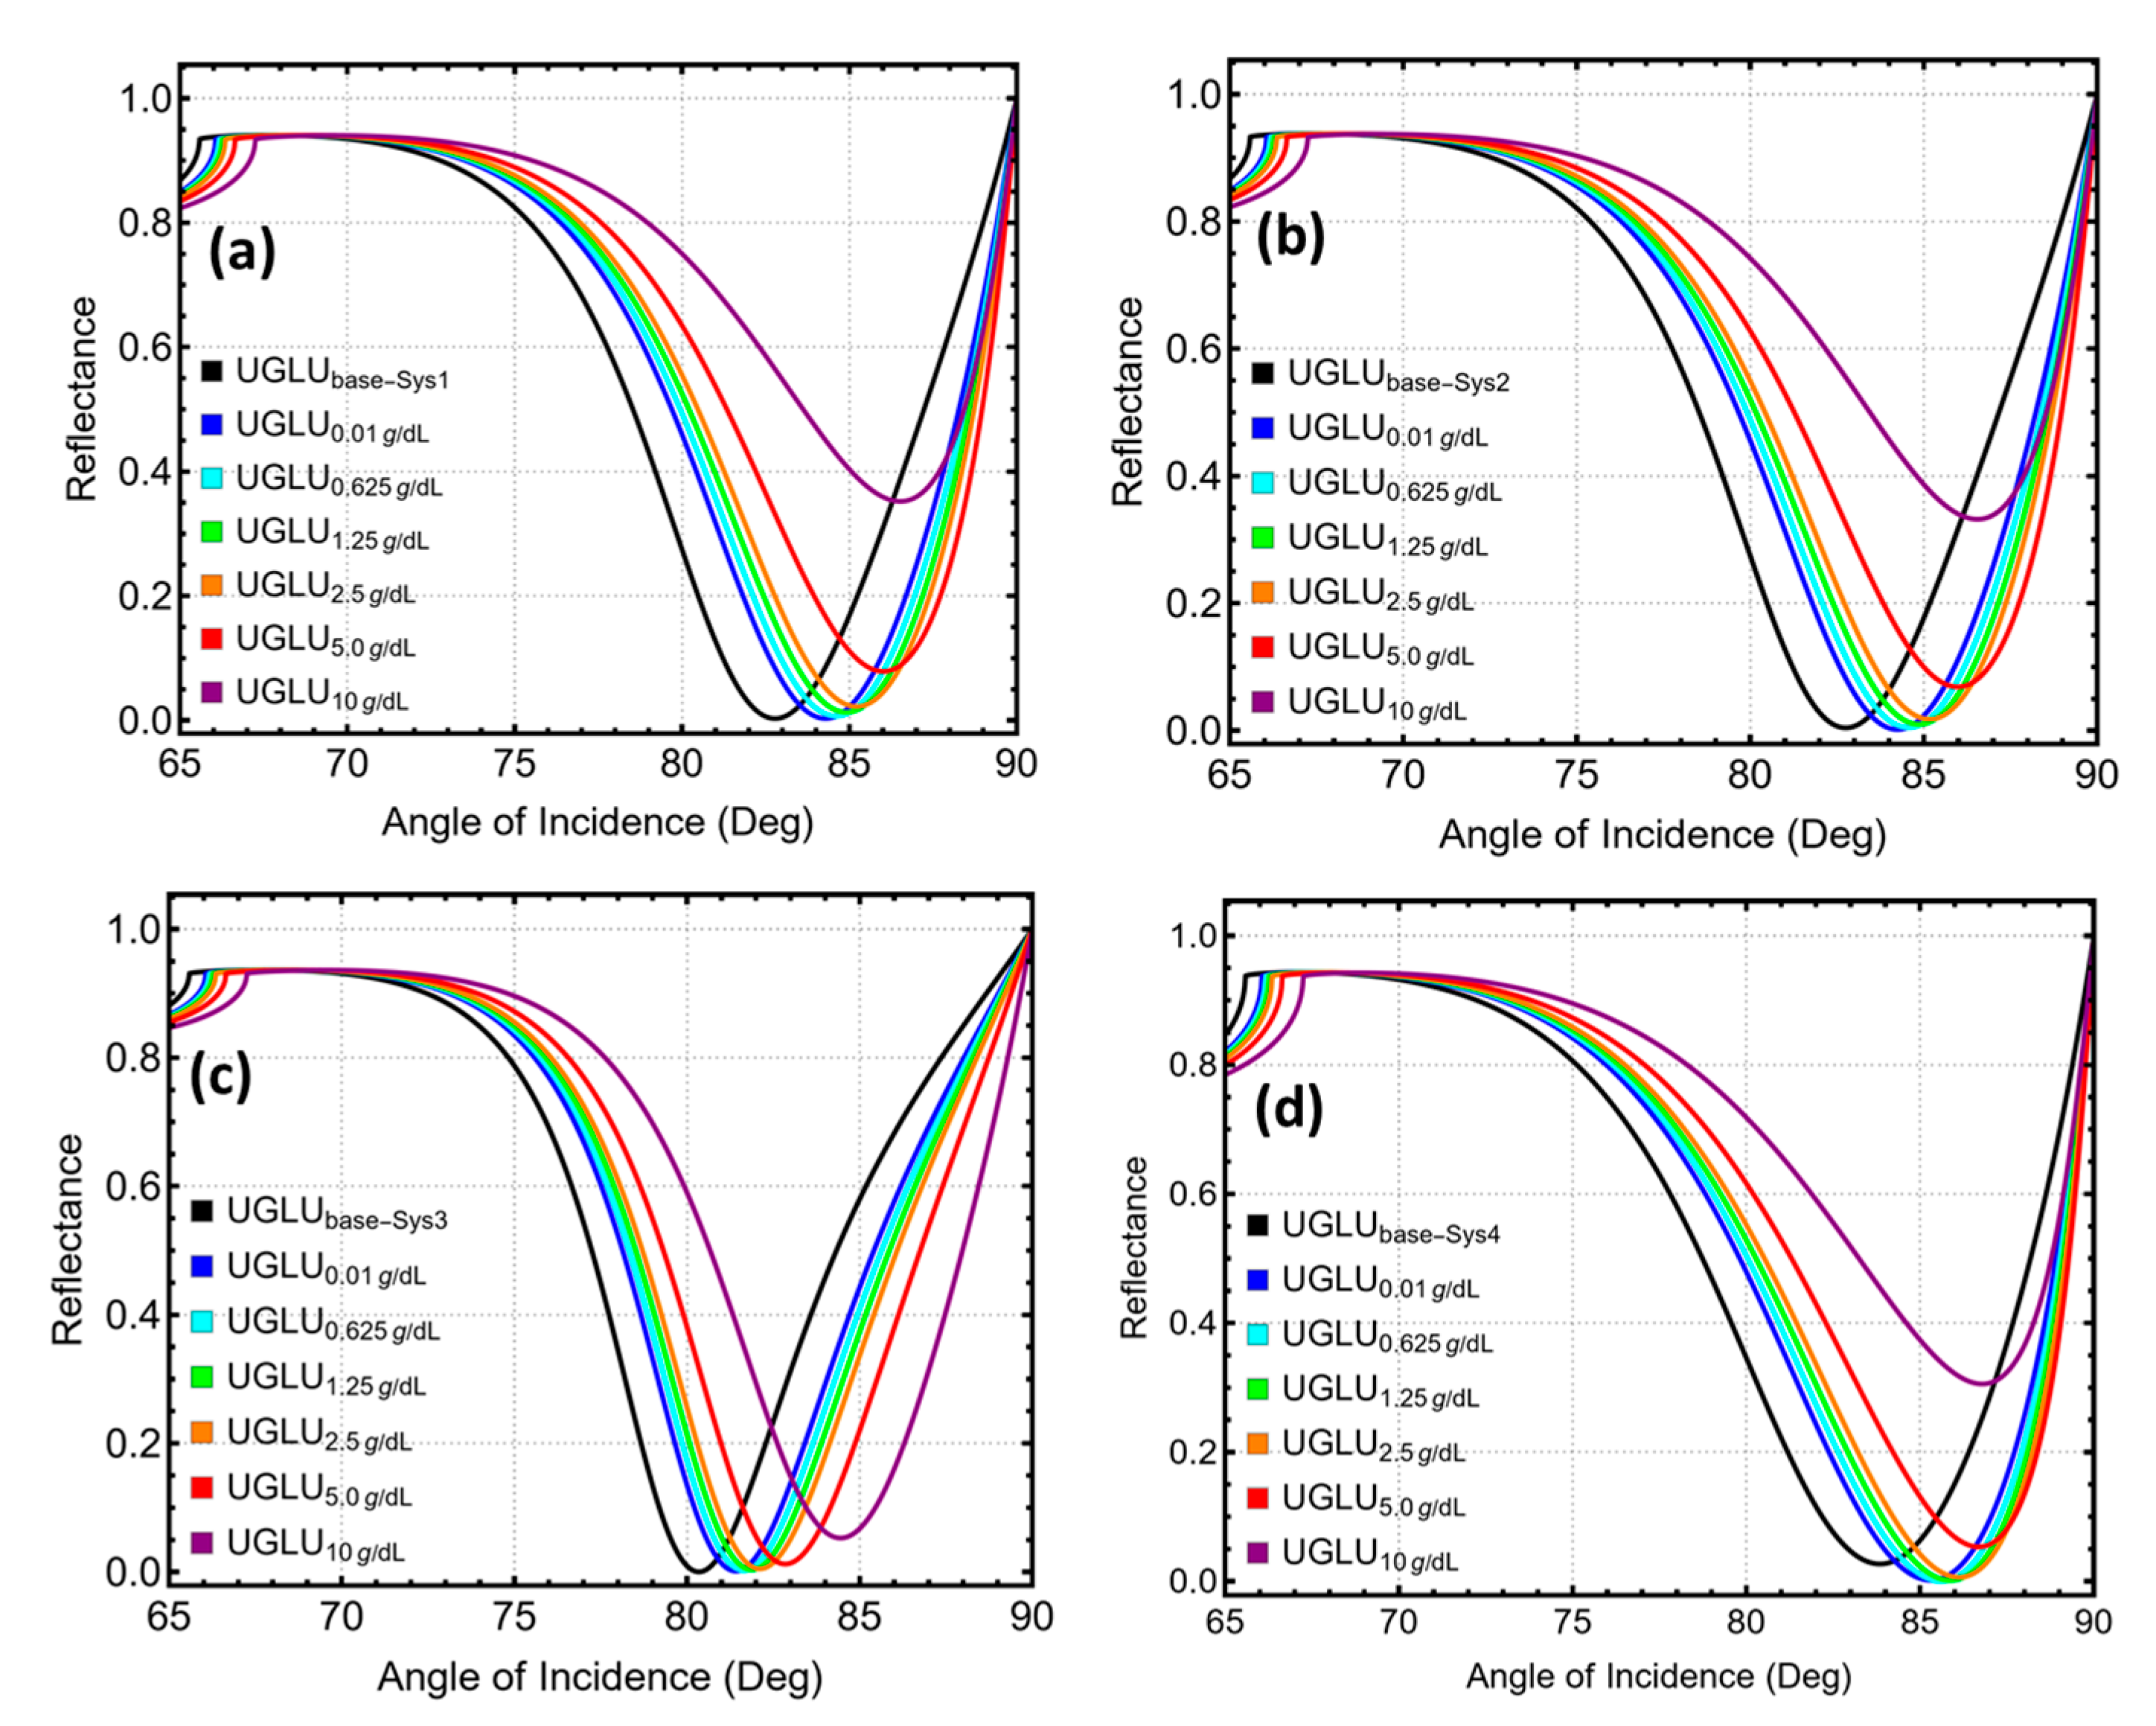
For all architectures, the analyte causes a rightward migration of the reflectance minimum, consistent with the increase in bulk refractive index. In Figure 7a the graphene overlayer in Sys1 produces a clean, monotonic displacement of the dip as concentration rises, with little distortion of the line shape over most of the range. The s-SWCNT device in Figure 7b follows the same systematic shift and exhibits a slightly deeper minimum at intermediate concentrations before partial recovery at the highest level, indicating modest changes in coupling as the external index grows. Figure 7c shows that the GO stack maintains a narrow, symmetric resonance that translates smoothly with concentration and displays minimal broadening, pointing to a favorable balance of field confinement and loss at the chosen GO thickness. The rGO configuration in Figure 7d displays the strongest evolution of both depth and linewidth with concentration: the resonance is broader at the low end, then sharpens markedly as UGLU approaches 10 g dL−1, while maintaining a sizable angular displacement.
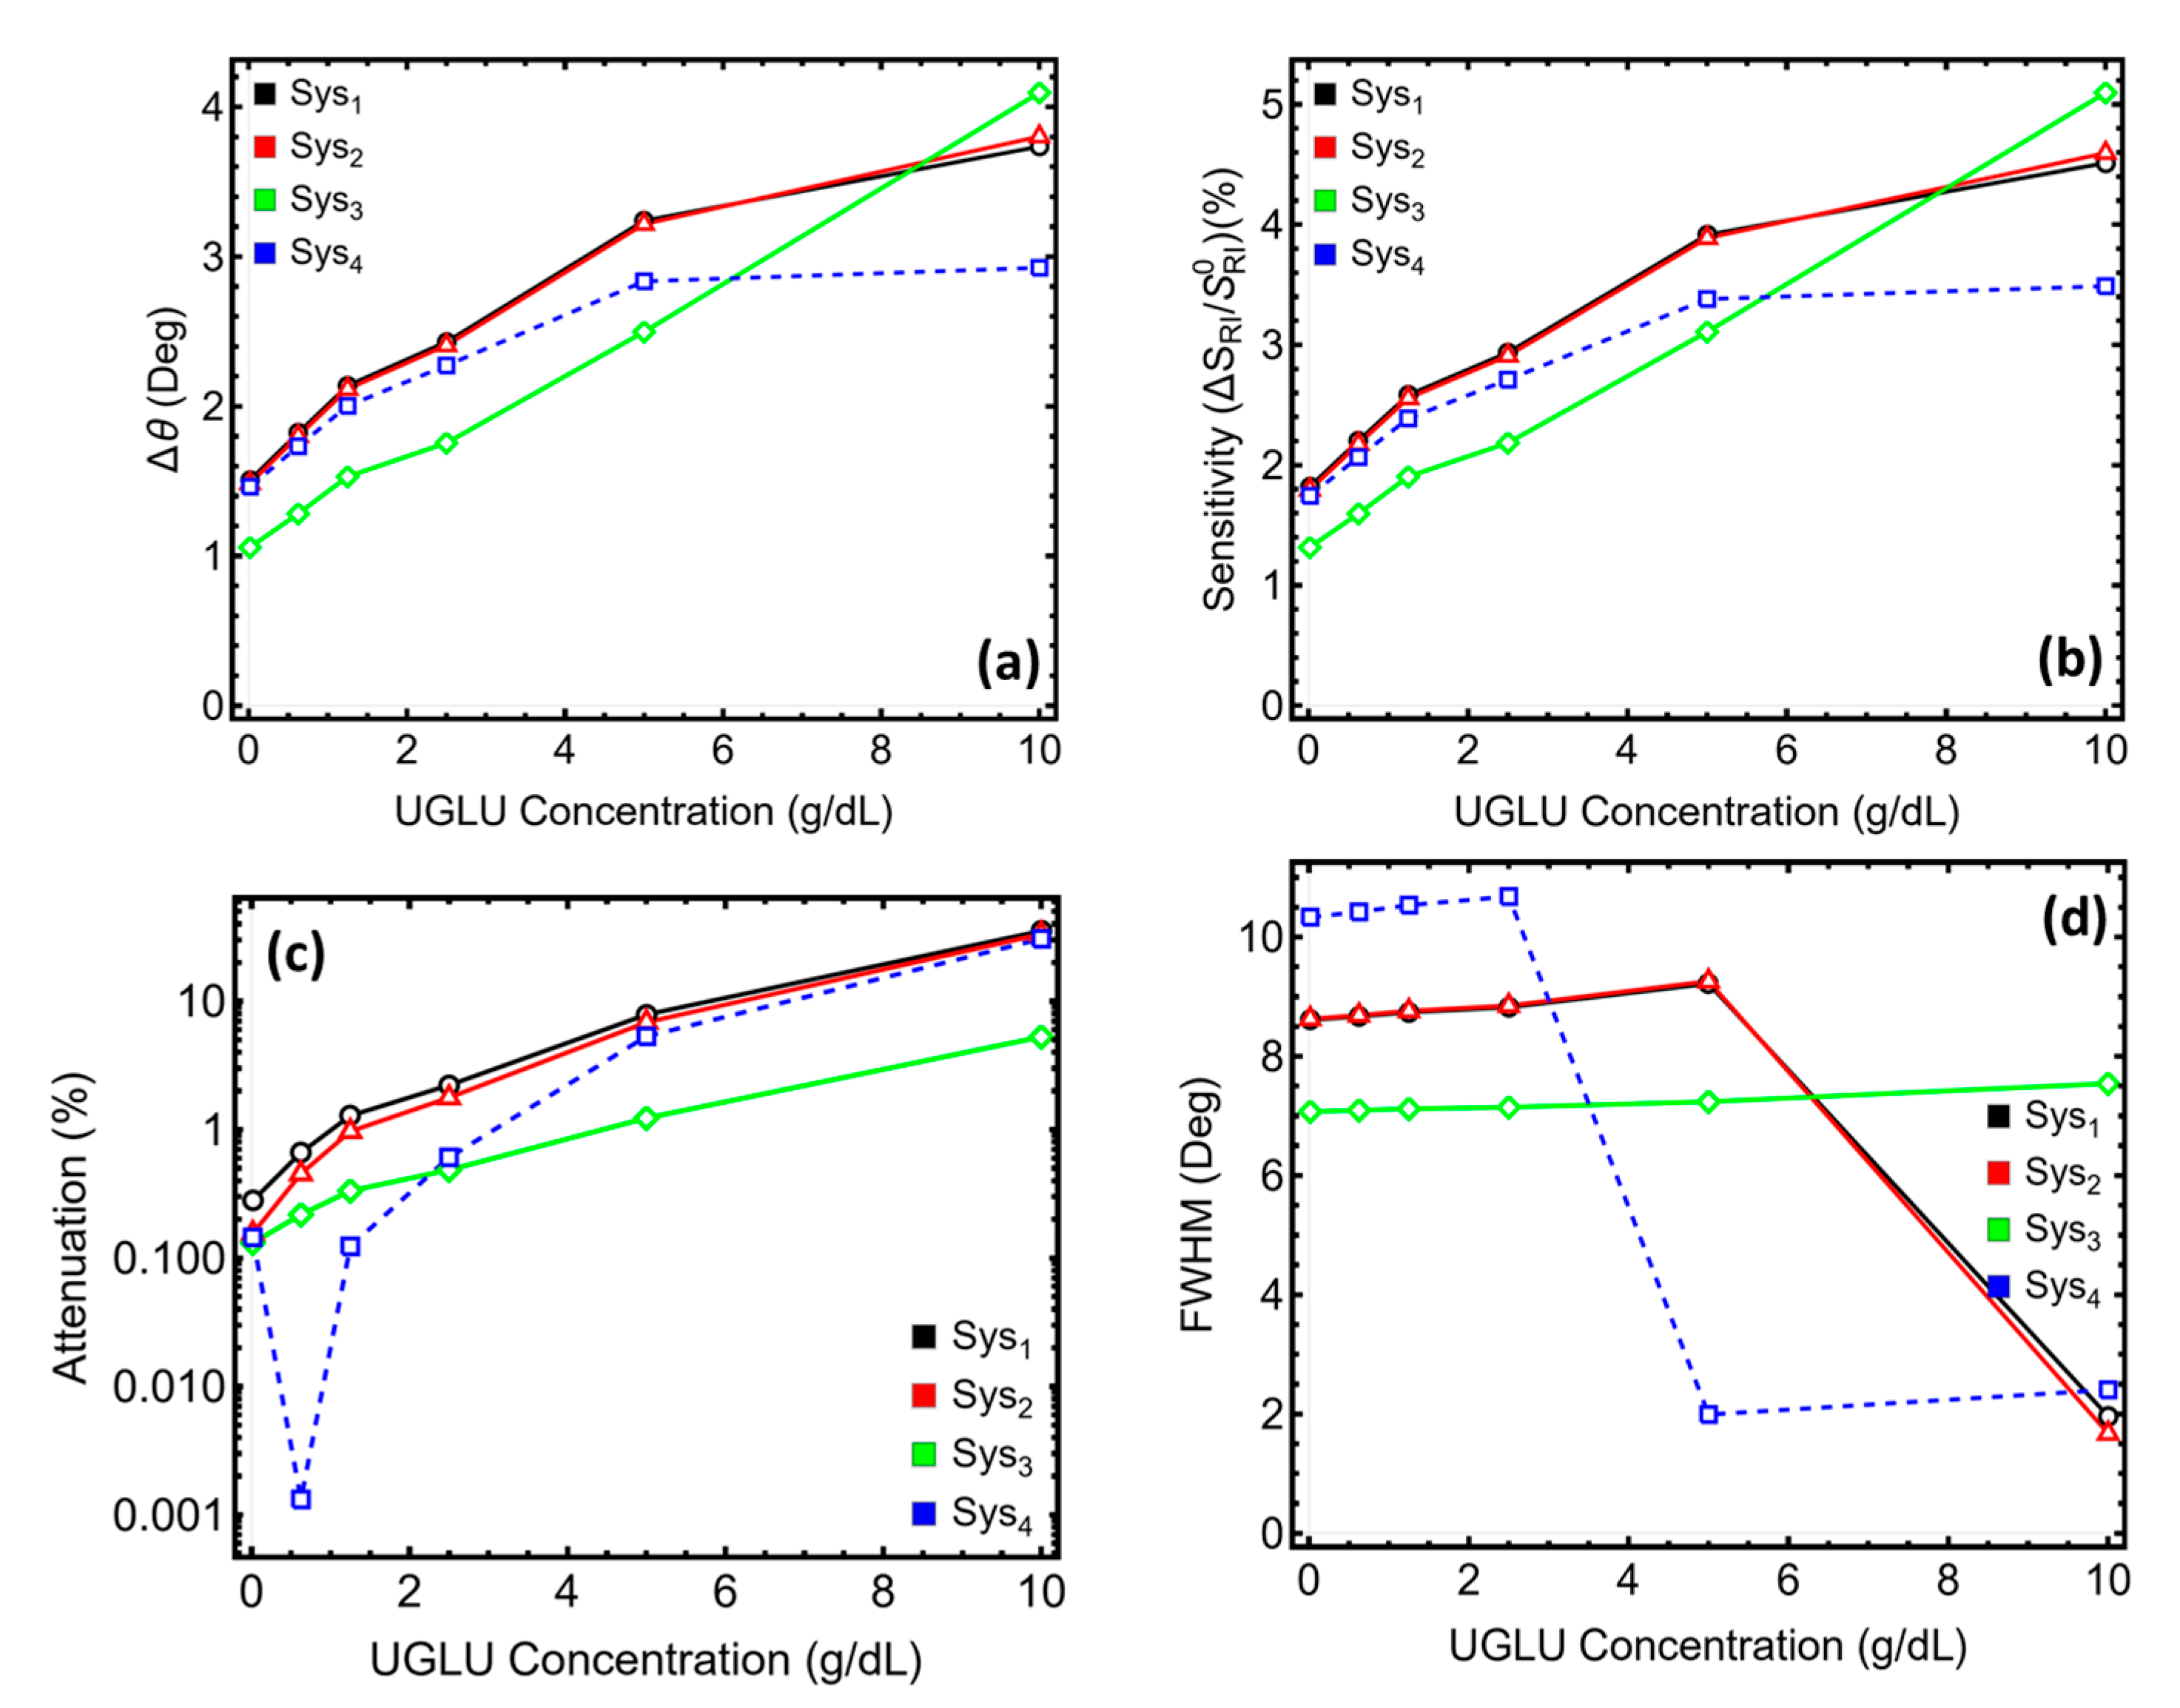
These qualitative observations are captured by the concentration-dependent metrics in Figure 8 and enumerated in Table S8. The angular shift Δθ increases with UGLU for all systems in Figure 8a, with Sys1 and Sys2 tracing near-linear trends and attaining the largest shifts at the upper bound of the tested range, Sys3 following a gentler slope, and Sys4 rising steadily but remaining below the graphene and s-SWCNT responses at high concentration. Table S8 confirms the growth of Δθ across the ladder; for example, Sys1 advances from about 1.5° at the lowest level to about 3.7° at 10 g dL−1, and Sys2 progresses from about 1.5° to about 3.8° over the same span. The sensitivity enhancement in Figure 8b mirrors these trends: graphene and s-SWCNT yield the strongest fractional response with concentration, GO provides moderate but consistent gains, and rGO shows a weaker yet monotonic enhancement, in agreement with the line-shape evolution seen in Figure 7d.
The interplay between signal amplitude and spectral quality is made explicit by the attenuation and linewidth panels. On the semilog scale of Figure 8c, attenuation grows with concentration for all devices, yet the growth mode differs: GO stays at the lowest and most stable attenuation, graphene and s-SWCNT increase to mid-single-digit and then to tens of percent at the highest level, and rGO transitions from very low attenuation at the smallest concentration to values comparable to graphene and s-SWCNT at the top of the range. Table S8 reproduces these patterns numerically; for instance, Sys1 rises from well below one percent to roughly the mid-thirties by 10 g dL−1, and Sys2 follows closely with a comparable end-point value, while Sys4 approaches the low-thirties at the highest concentration. Linewidth behavior in Figure 8d underscores the metrological implications. GO keeps an almost concentration-independent full width at half maximum centered around the high-single-degree range, enabling stable angle picking across the ladder. Graphene and s-SWCNT maintain broader plateaus at low and mid concentrations and then tighten abruptly at the highest level; the entries in Table S8 show that Sys1 and Sys2 collapse from initial FWHM near 8–9° to about 2° at 10 g dL−1. rGO exhibits the strongest concentration dependence: its linewidth is widest at the low end and narrows progressively to approach a few degrees by the highest level, consistent with the sharpening seen in Figure 7d.
Figure 7a–d and Figure 8a–d with Tables S6 and S8 demonstrate that all four optimized 2D-augmented SPR stacks resolve the clinically relevant UGLU range by robust angle shifts, but each does so with a distinct signature that can be matched to use-case priorities. Graphene and s-SWCNT maximize the angular response and fractional sensitivity at high concentration while ultimately delivering narrow resonances that benefit angle resolution. GO offers the most measurement-friendly line shape across the entire range—low attenuation and a stable, narrow linewidth—making it attractive when precision and repeatability outweigh absolute shift. rGO provides sizeable shifts with strong late-range sharpening, favoring upper-range screening provided the instrument resolves the broader dips at the low end. These results motivate a practical selection rule: for instruments prioritizing maximum shift at high concentration, Sys1 or Sys2 are advantageous; for platforms requiring uniform, low-uncertainty angle determination across the ladder, Sys3 is preferred; and for applications targeting elevated UGLU levels with tolerance for broader low-concentration lineshapes, Sys4 is a viable option.

3.7. Performance Sensing Metrics

The optimized architectures from Table S6 were benchmarked using the composite metrics in Figure 9 and Figure 10, with the full numerical values compiled in Table S9. The angular sensitivity S in Figure 9a establishes the baseline performance hierarchy. Sys1 and Sys2 start in the same high-sensitivity regime, near three hundred degrees per refractive index unit at the lowest urine–glucose level, and they retain this level through the mid-range before a gradual decline at 10 g dL−1. Sys4 also begins high but decays steadily with concentration, while Sys3 grows only modestly over the ladder and remains the least steep. The table mirrors these trends: S for graphene and s-SWCNT remains clustered around 300° RIU−1 up to a few grams per deciliter and then drops to about two hundred at the upper bound, whereas GO stays in the ~210–240° RIU−1 band and rGO transitions from ~290 to ~170° RIU−1 by 10 g dL−1. This establishes that the graphene and s-SWCNT stacks deliver the strongest raw sensitivity across most of the range, with rGO and GO bracketing lower effective slopes.
Beyond raw S, the figures disentangle how line-shape quality affects metrology. Detection accuracy in Figure 9b climbs with concentration for all stacks but does so at different rates. Sys1 and Sys2 rise sharply at the high end, indicating that the combination of sizable angle shift and narrowing linewidth improves angular pickoff as the analyte index increases. Sys4 shows an intermediate profile with an earlier rise and a softer tail, consistent with its strong line-shape evolution seen previously. Sys3 increases only gradually, reflecting its stable but lower-slope response. The quality factor in Figure 9c consolidates these features: Sys1 and Sys2 transition from values in the mid-thirties at the low end to three-digit levels by 10 g dL−1, a jump that is echoed in Table S9 where QF passes the 100 RIU−1 mark at the highest concentration for both stacks. Sys4 peaks in the mid-range and then softens slightly, while Sys3 remains nearly concentration-independent near ~30 RIU−1. Together, Figure 9 shows that graphene and s-SWCNT not only deliver the highest S but also convert the late-range line-shape improvement into better detection accuracy and quality factor, whereas GO provides consistent but lower absolute values and rGO offers a tunable intermediate.
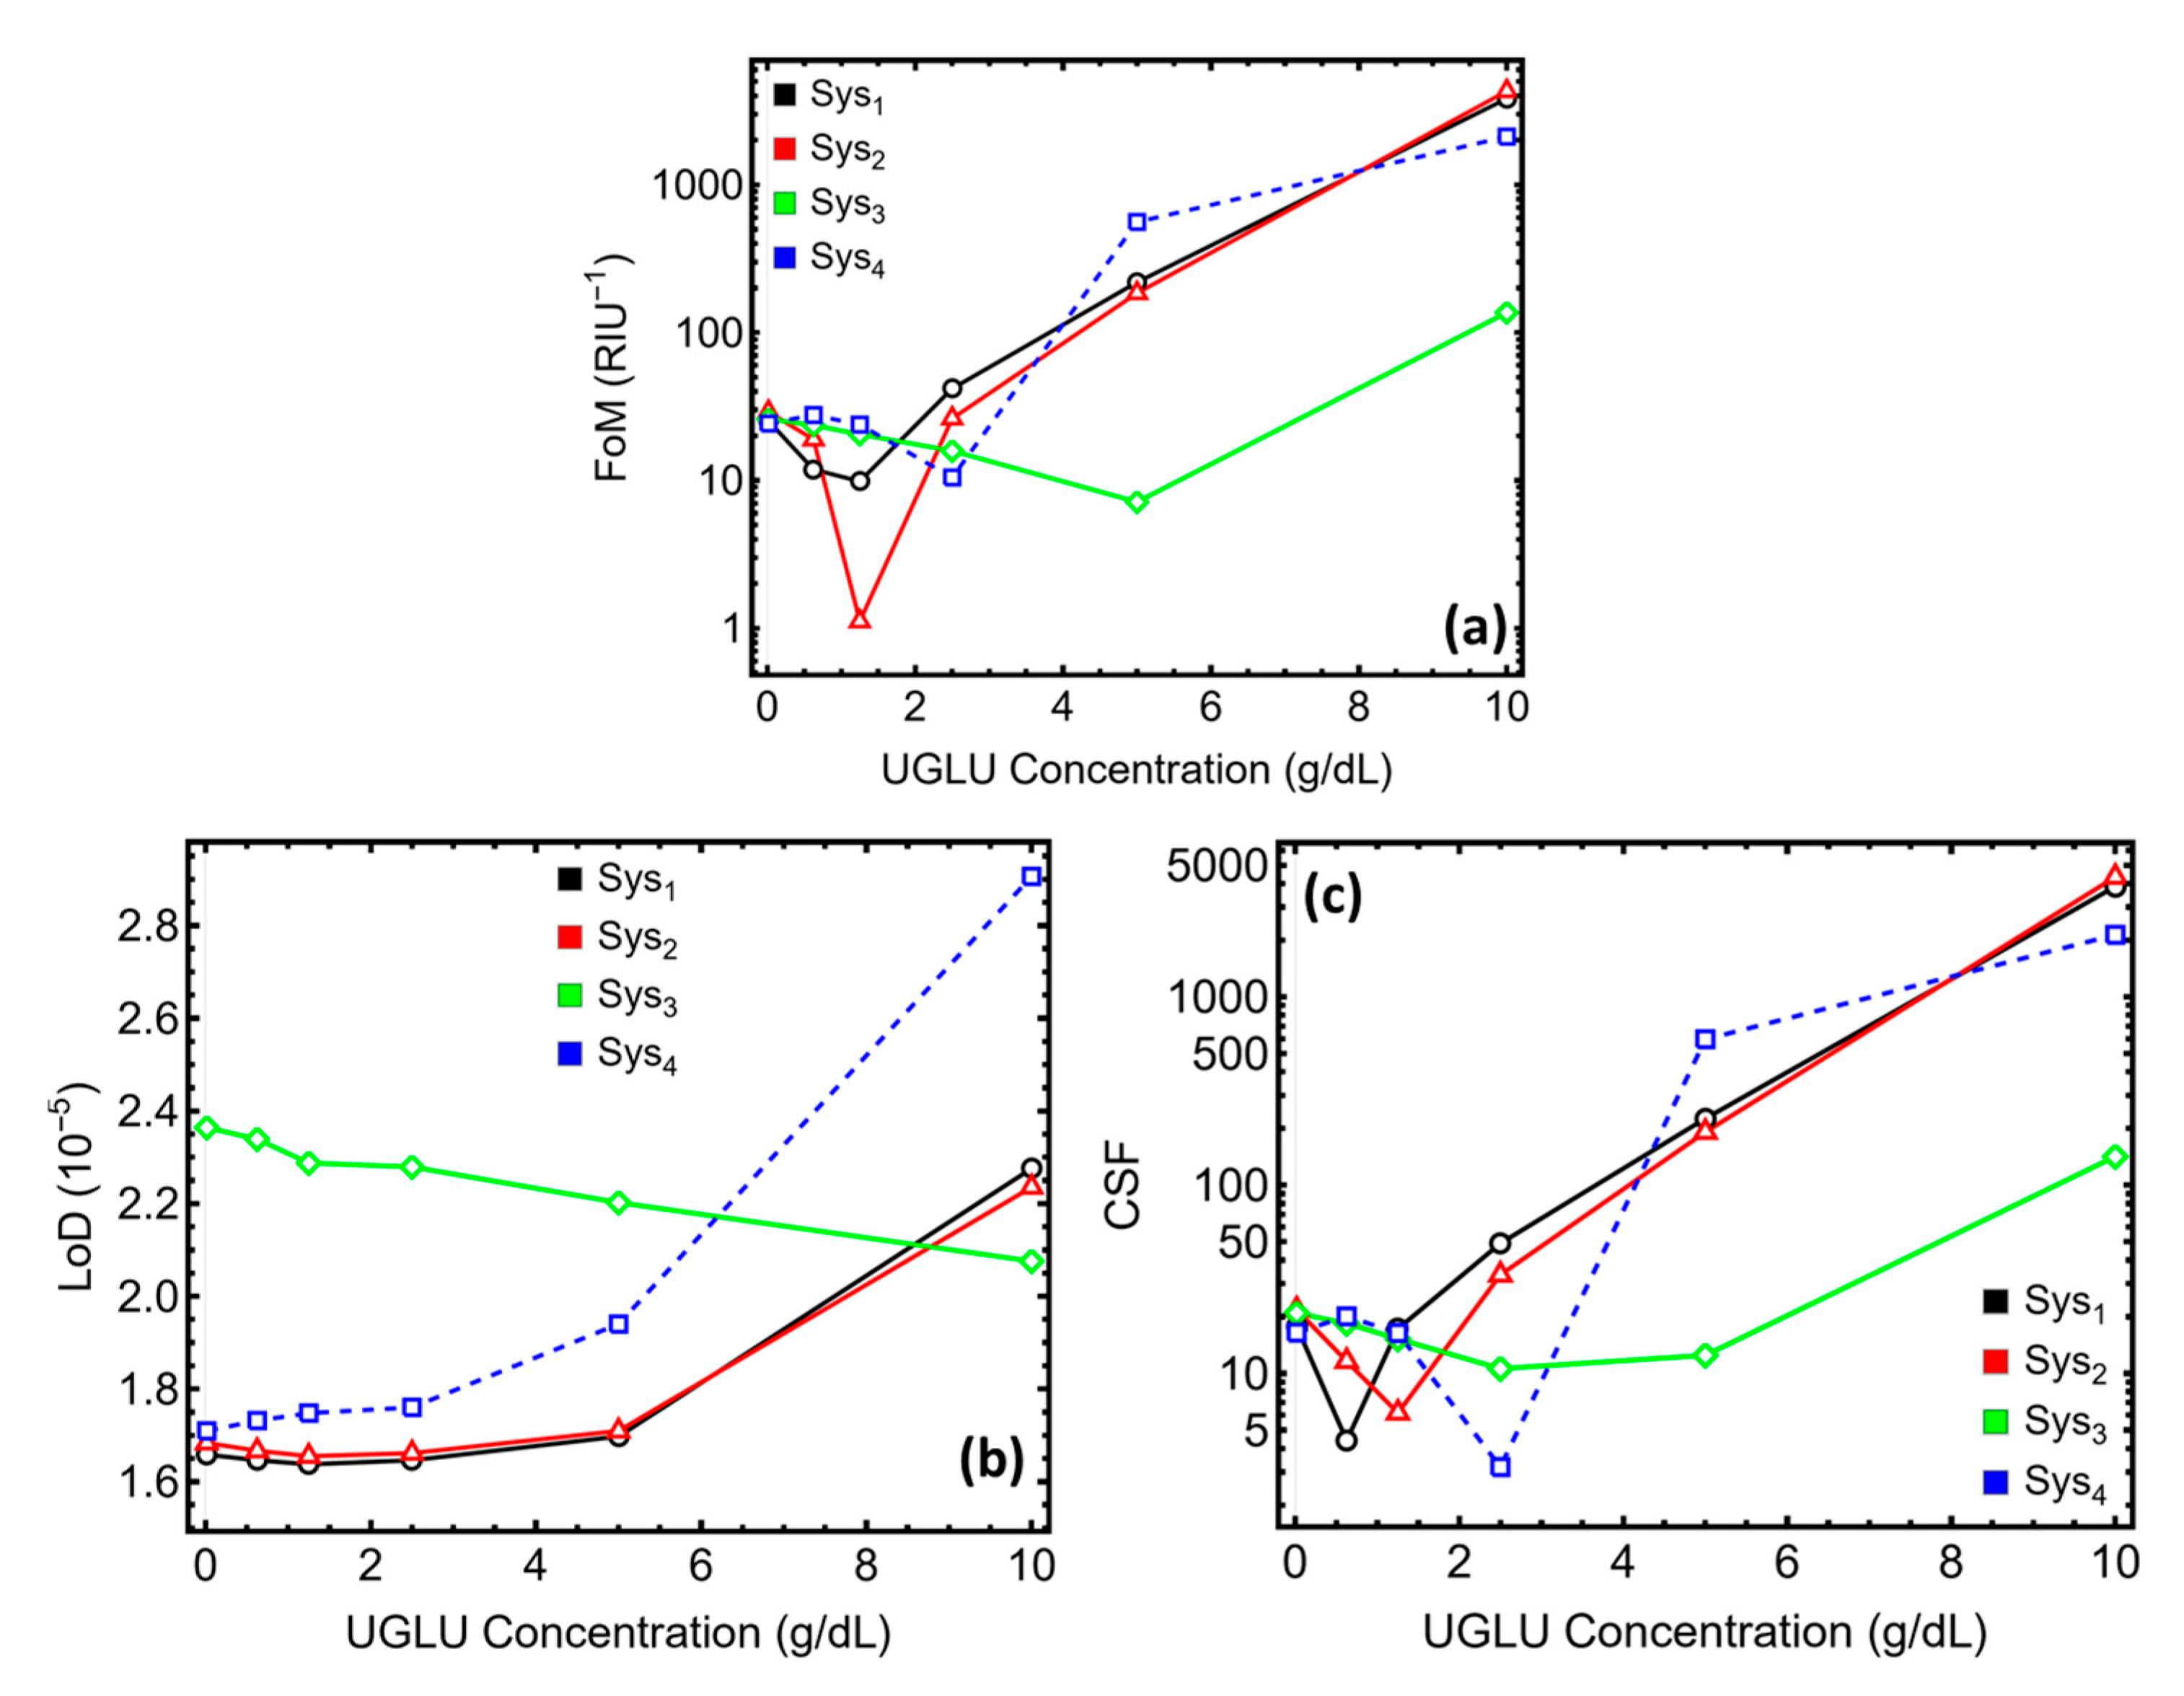
Figure 10 reframes performance in terms of detection practicality. The figure of merit in panel 10a grows by orders of magnitude for Sys1 and Sys2 across the concentration ladder. Values move from tens at the lowest rung to the multi-thousand RIU−1 range at 10 g dL−1 in Table S9, reflecting the concurrent increase in QF and the preserved angle shift. Sys4 also exhibits a strong rise in FoM with concentration, though it does not reach the graphene/s-SWCNT levels; Sys3, in contrast, shows a relatively flat-to-declining FoM through the mid-range with only a minor recovery at the highest level. The limit of detection in Figure 10b follows the inverse pattern expected from the combined noise-and-slope picture. Sys1 and Sys2 maintain the lowest LoD values across the ladder, with Table S9 reporting numbers around 1.6 × 10⁻⁵ RIU at the low end and remaining near or below ~2.3 × 10⁻⁵ RIU at the top. Sys3 sits at the higher LoD end of the cohort, hovering near ~2.1–2.4 × 10⁻⁵ RIU, while Sys4 begins close to ~1.7 × 10⁻⁵ RIU and degrades toward ~3 × 10⁻⁵ RIU at 10 g dL−1, consistent with its declining S and evolving linewidth. The concentration sensitivity factor in Figure 10c condenses these behaviors into a single scale that rewards both shift magnitude and resonance sharpness. Sys1 and Sys2 increase by more than two orders of magnitude across the range, culminating in the multi-thousand band in Table S9; Sys4 follows the same rising trajectory but saturates lower; Sys3 advances only moderately.
Figure 9a–c and Figure 10a–c, read alongside Table S9, highlight three practical conclusions for the optimized stacks. First, graphene and s-SWCNT are the most balanced performers: they couple high angular sensitivity at low concentrations with steadily improving resonance quality at high concentrations, yielding the highest quality factors, the largest figures of merit, and the lowest detection limits over the clinically relevant span. Second, rGO provides a flexible option when large angle shifts are desired but the instrument can tolerate a higher LoD at the upper end; its metrics improve strongly with concentration but remain below those of graphene and s-SWCNT. Third, GO offers measurement stability—nearly concentration-independent linewidth and modest, predictable changes in S—resulting in consistent detection accuracy and QF, albeit with smaller FoM and higher LoD than the other high-shift stacks. In practice, the choice among Sys1–Sys4 should therefore be guided by the targeted operating window and the angular resolution of the readout: if minimal LoD and maximal FoM at elevated UGLU are prioritized, Sys1 or Sys2 is preferred; if uniform line shape and repeatable metrology across the ladder are paramount, Sys3 is attractive; if late-range amplification with acceptable LoD is sufficient, Sys4 is suitable.

3.8. Evanescent-Field Distribution of the Optimized Stacks

Figure 11 visualizes the evanescent-field amplitude, normalized to its maximum, as a function of distance from the prism for the four optimized stacks at 633 nm. The shaded regions identify the stratigraphy common to the study—Au in green, Si3N4 in yellow, the specific two-dimensional overlayer in pink, and the semi-infinite urine analyte. Across all traces, the six urine-glucose (UGLU) concentrations from 0.015 to 10.0 g dL−1 separate monotonically near the metal/analyte boundary and then relax toward a shared decay envelope over roughly 100–200 nm, linking bulk-refractive-index increments directly to the angular shifts reported elsewhere.
Figure 11a shows the graphene overlayer at its optimized thickness. The field decays smoothly with only a slight, concentration-dependent fanning just beyond the graphene, indicating that graphene perturbs phase and amplitude where the surface plasmon is most intense while leaving the distal penetration depth essentially unchanged. This near-interface leverage with preserved decay length explains the large but well-behaved angle shifts and the strong figure of merit achieved for graphene in the performance metrics.
Figure 11b presents the semiconducting SWCNT stack and exhibits the tightest bundle of field profiles among the four configurations. The perturbation is concentrated at the immediate boundary, and the analyte-side decay remains nearly invariant with concentration. This compact reshaping is consistent with narrow resonance line shapes and high sensitivity at elevated UGLU, implying that the s-SWCNT layer acts as an impedance-matching film that strengthens coupling without sacrificing penetration depth.
Figure 11c corresponds to the GO stack, where the thicker overlayer introduces a visible attenuation step within the pink region before the analyte. Despite this damping, the analyte-side decays for different concentrations remain evenly spaced over distance, mirroring the concentration-independent linewidth and measurement stability observed for GO. The figure, therefore, rationalizes GO’s role as a metrology-friendly option that prioritizes uniformity and precision over maximal shift amplitude.
Figure 11d displays the rGO stack at its thin-film optimum and reveals a stronger local modulation than graphene, with the UGLU curves diverging more sharply immediately past the overlayer before converging toward a common decay tail. This behavior aligns with the larger shifts recorded for rGO at higher concentrations, while also foreshadowing the linewidth and attenuation penalties that appear when coupling is pushed beyond the optimum by film-thickness or metal-thickness deviations.
Panels 11a–11d map material choice to field-level mechanisms that drive the sensor’s quantitative performance. Graphene and s-SWCNT concentrate influence at the boundary while preserving penetration depth, GO imposes a uniform and stable decay at the expense of smaller absolute shifts, and rGO provides strong near-interface leverage that boosts shift magnitude but demands careful tuning to avoid excess loss. The consistent, monotonic separation of the traces with UGLU across all panels explains the strictly monotonic angular response and the stack-dependent differences in linewidth and attenuation.

3.9. Linearity and Overall Sensitivity of the Optimized Stacks

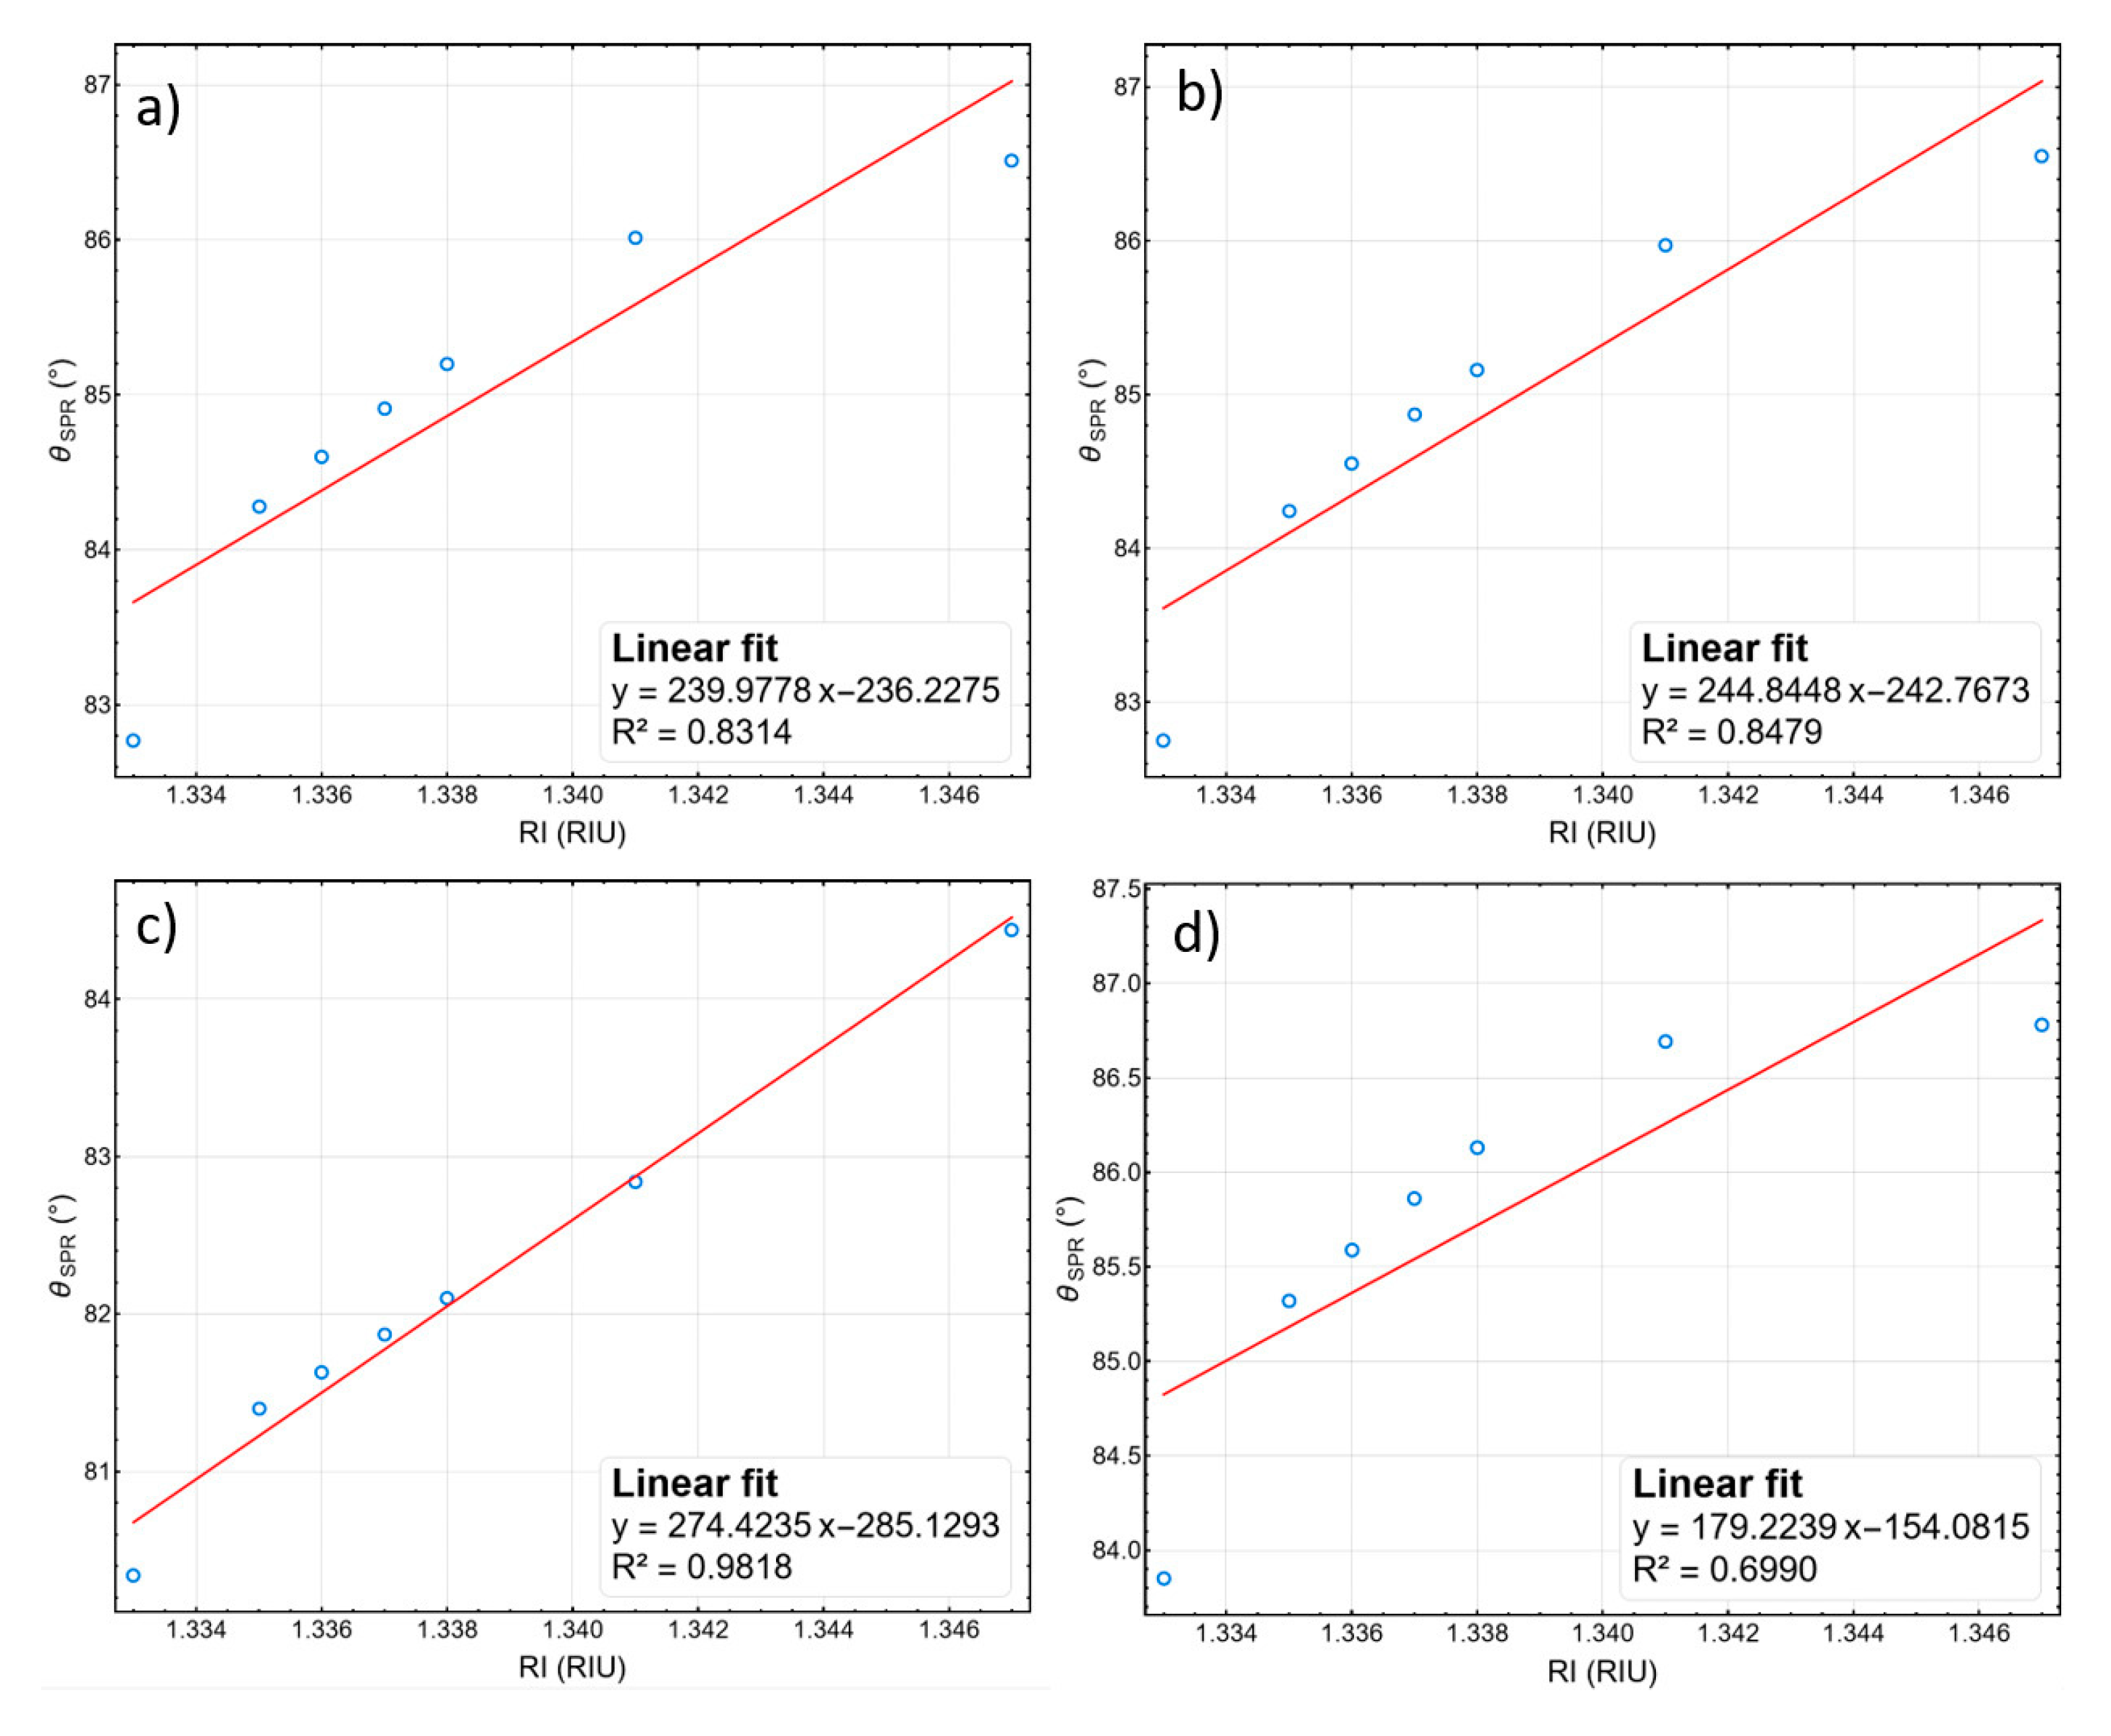
The linear regression of resonance angle versus analyte refractive index consolidates the sensing behavior of the four optimized stacks. In Figure 12a, the graphene device (Sys1) traces a clear, ascending trend of θSPR with RI across the UGLU ladder; the least-squares line captures the progression well, so the fitted slope is a faithful proxy for the angular sensitivity within this window. The s-SWCNT device in Figure 12b follows the same linear tendency; the points advance nearly collinearly with the fit, reflecting the strong angle response already evident in the concentration sweeps. Figure 12c, corresponding to GO (Sys3), is the most aligned with strict linearity: the cloud of points adheres closely to the regression line across the entire RI span, implying that a single calibration coefficient can represent the device over the urine range without additional linearization. The rGO system in Figure 12d also climbs with RI and the fitted line offers a meaningful descriptor of the trend; the data suggest a near-linear relationship and thus support straightforward calibration, consistent with the late-range sharpening seen in the angular spectra.
The θSPR entries in Table S10 mirror these plots numerically and enable an aggregate readout of performance. For Sys1, θSPR increases from about 84.28° at RI 1.335 to 86.51° at RI 1.347, yielding an overall sensitivity of 239.97° RIU−1 over the modeled urine window. Sys2 advances from roughly 84.24° to 86.55° across the same RI span and reaches an overall sensitivity of 244.84° RIU−1. Sys3 covers the widest angular rise among the four, from about 81.40° to 84.44°, corresponding to an overall sensitivity of 274.42° RIU−1. Sys4 progresses from approximately 85.32° to 86.78° within the window and attains an overall sensitivity of 179.22° RIU−1. These values align with the qualitative impressions from Figure 12: GO shows the steepest linear slope, s-SWCNT and graphene cluster closely behind, and rGO follows a gentler but still useful grade.
The current benchmark landscape in Table 2 places these results among representative multilayer SPR glucose sensors [39,45,46,47,48,49]. Within our platform family, the overall sensitivities derived from the calibrated θSPR–RI relations identify Sys3 as the top performer, followed by Sys2 and Sys1 with very similar levels, and Sys4 providing a strong yet more moderate response. The accompanying quality factor and detection accuracy entries support this: the optimized stacks combine predictable linear angle–index behavior with a resonance quality sufficient for practical interrogation. Overall, the four calibrated lines in Figure 12 and the summary values in Table S10 and Table 2 show that the optimized designs operate in a regime where a single linear coefficient describes the response across the urine-relevant refractive-index range, with GO offering the steepest slope, s-SWCNT and graphene maintaining high sensitivity with simple calibration, and rGO sustaining a linear trend suitable for straightforward deployment.

4. Limitations and Perspectives

To note, this study employs a transfer-matrix framework to model SPR biosensors with 2D nanomaterial overlayers for UGLU detection. Predictions were anchored to clinically reported UGLU concentration ranges (Refs. [39,40,41,42,43,44]) to ensure physiological relevance, but they reflect idealized conditions: plane-wave illumination, nominal layer thicknesses and literature optical constants, and omission of instrumental constraints (angular resolution, spectral width, polarization purity, mechanical stability). Real urine is compositionally variable (ionic strength, pH, urea/protein content), and unmodeled factors such as temperature drift, film roughness, interfacial chemistry, and surface fouling can shift and broaden resonances, affecting figures of merit and practical detection thresholds. To translate these results, future works will execute a staged validation: (i) measurements in synthetic urine with controlled ionic strength and pH across the clinically reported UGLU ranges (Refs. [39,40,41,42,43,44]); (ii) material metrology (ellipsometry/AFM) to bind the model to as-built optical constants and roughness; (iii) instrument characterization to quantify angular resolution, stability, and noise floor; and (iv) clinical sample testing under approved protocols with replicate measurements and reference assays. These steps then can calibrate the model to experimental conditions, quantify matrix effects, and determine achievable limits of detection and reproducibility.
From an application standpoint, the 2D overlayer choice reflects a balance between optical figures of merit and practical deployability. Graphene offers narrow resonances and high FOM after thickness tuning, which benefits precise angular tracking and long-term calibration stability; however, CVD growth/transfer can introduce cracks, wrinkles, and batch variability, and the atomically clean surface is susceptible to contamination without robust antifouling chemistry [50]. GO/rGO are attractive for scalable, solution-based processing and yield large raw angular shifts that can relax angular-resolution demands in portable readers, but increased damping in typical rGO films broadens the dip and reduces FOM, making referencing and temperature control more critical. s-SWCNT networks provide a middle ground: tunable porosity can enhance analyte access and functionalization, and optimized films can maintain reasonably narrow linewidths; yet percolation, chirality dispersion, and substrate interactions can vary optical constants across batches. In practice, high-precision benchtop instruments will benefit most from graphene or well-optimized s-SWCNT films (prioritizing FWHM and calibration stability), whereas cost-sensitive or compact devices with moderate angular resolution may tolerate rGO’s broader dips in exchange for larger absolute shifts and simpler fabrication—provided antifouling layers and referencing schemes are implemented.
Finally, a natural extension of this modeling approach is to transition-metal dichalcogenide (TMDC) overlayers (e.g., MoS2, WS2) [51]. Our transfer-matrix framework, figures of merit, and thickness-optimization workflow translate directly to TMDCs, where their strong dispersion and excitonic features could further tailor resonance depth and linewidth. The current work thus provides a baseline and methodology for systematic TMDC optimization under identical assumptions and performance metrics.

5. Conclusions

This work establishes an SPR sensing platform for direct UGLU quantification by integrating 2D nanomaterial overlayers on Au/Si3N4 stacks and modeling angular interrogation at 633 nm. Across graphene, s-SWCNT, GO, and rGO architectures, increasing UGLU produced monotonic resonance-angle shifts, while the overlayer controlled dip depth and FWHM. Graphene and s-SWCNT yielded the lowest limits of detection and the highest figures of merit, aided by late-range line narrowing; rGO offered significant raw shifts within a thin, low-loss window (which could depend on instrument noise and angular resolution); GO maintained stable, narrow line shapes suited to repeatable metrology. These materials-dependent responses provide design rules linking composition and thickness to quantitative metrics and indicate a viable path to compact, label-free urine glucose screening. Future work will (i) validate calibration curves in synthetic urine under controlled ionic strength and pH, (ii) measure as-built optical constants and roughness (ellipsometry/AFM) for model locking, (iii) characterize angular resolution, stability, and noise of the readout, and (iv) test clinical specimens with reference assays and antifouling surface chemistry to quantify matrix effects and establish practical detection limits. These steps operationalize translation of the modeled performance into portable instrumentation.

Supplementary Materials

The following supporting information can be downloaded at: https://www.mdpi.com/article/10.3390/photonics12111089/s1, Figure S1. Validation of a Numerical Modeling Approach Using Experimental Results from Ref. [38]; Figure S2. SPR reflectance versus incidence angle at 633 nm for varying Au film thickness in the multilayer stacks: (a) Sys1—graphene, (b) Sys2—s-SWCNT, (c) Sys3—GO, and (d) Sys4—rGO. Curves illustrate how gold thickness tunes the resonance position, dip depth, and linewidth, with strongest coupling occurring at intermediate thicknesses; Figure S3. SPR reflectance versus incidence angle at 633 nm for Si3N4 spacer thickness sweeps in the multilayer stacks: (a) Sys1—graphene, (b) Sys2—s-SWCNT, (c) Sys3—GO, and (d) Sys4—rGO. Increasing the spacer progressively shifts the resonance and modulates dip depth and linewidth, evidencing the spacer’s role in tuning evanescent field coupling to the analyte; Figure S4. Angular reflectance at 633 nm for increasing urine–glucose (UGLU) concentration, illustrating resonance shifts with analyte refractive index. Curves L1–L6 denote progressively higher UGLU levels defined in the UGLU model. Panels show optimized stacks: (a) Sys1—graphene, (b) Sys2—s-SWCNT, (c) Sys3—GO, and (d) Sys4—rGO. Increasing concentration drives the resonance to larger angles and modulates dip depth and linewidth in a system-dependent manner; Table S1. System nomenclature used throughout the study. The table lists each configuration (Sys0–Sys4) with its full multilayer description and shorthand nickname: SiO2 prism/Au film/Si3N4 spacer/2D overlayer (graphene, s-SWCNT, GO, or rGO) with either water (Sys0) or urine as the sensing medium (Sys1–Sys4); Table S2. Optical constants and layer thicknesses used in the SPR simulations at 633 nm. The table lists the prism (SiO2), metal (Au), spacer (Si3N4), 2D overlays (graphene, s-SWCNT, GO, rGO) with complex refractive indices and nominal thicknesses, and the sensing media (water and urine) used as baselines; Table S3. Thickness-dependent SPR metrics for the four 2D-overlayer stacks at 633 nm. For Sys1–Sys4 (graphene, s-SWCNT, GO, rGO) with Au varied from 30 to 55 nm, the table reports θSPR, Δθ, sensitivity enhancement versus the reference, attenuation, and FWHM, showing how gold thickness tunes coupling strength and resonance linewidth; Table S4. Effect of silicon nitride thickness (5–15 nm) on resonance behavior for prism systems Sys1–Sys4. For each thickness, the table reports the resonance angle (SPR peak position), the angle shift Δθ induced by a refractive-index change from 1.330 to 1.335, the associated percentage gain in angular sensitivity relative to the Sys0 reference, the minimum reflectance at the dip (attenuation), and the full width at half-maximum (FWHM); Table S5. Thickness-series metrics for the four multilayer sensors (Sys1–Sys4: graphene, s-SWCNT, GO, rGO) at 633 nm. For each system, rows 1–6 correspond to increasing 2D-overlayer thickness in the optimization sweep. Listed are the SPR peak angle (θSPR), resonance shift (Δθ), sensitivity enhancement versus the reference sensor, dip attenuation, and FWHM; Table S6. Optimized layer parameters for the four multilayer SPR sensors at 633 nm. For each system (Sys1–Sys4), the table lists the prism (SiO2), metal film (Au), spacer (Si3N4), and the selected 2D overlayer—graphene, s-SWCNT, GO, or rGO—together with the refractive indices (complex where applicable) and the optimized thicknesses used in simulations; Table S7. Urine–glucose (UGLU) refractive-index ladder used in simulations. The table lists the concentration levels (g dL−1) and corresponding refractive indices adopted for the analyte model, with source citation shown in the rightmost column; Table S8. Concentration-dependent SPR metrics for the optimized stacks at 633 nm. For each system (Sys1–Sys4: graphene, s-SWCNT, GO, rGO), the table lists urine–glucose (UGLU) levels from ≤0.015 to 10 g dL−1 with the corresponding SPR peak angle, resonance shift Δθ, sensitivity enhancement relative to the reference sensor, dip attenuation, and FWHM, illustrating the rise in θSPR and sensitivity with concentration and system-specific linewidth changes; Table S9. Comprehensive sensing metrics across the urine–glucose (UGLU) ladder for the optimized SPR stacks at 633 nm. For each system (Sys1–Sys4: graphene, s-SWCNT, GO, rGO) and modeled RI case, the table reports angular sensitivity S (° RIU−1), detection accuracy (DA), quality factor (QF, RIU−1), figure of merit (FoM, RIU−1), limit of detection (LoD, ×10−5 RIU), and concentration sensitivity factor (CSF), summarizing performance trade-offs over the clinically relevant range; Table S10. Computed refractive index (RI, at 633 nm) and corresponding SPR resonance angle θspr (°) for glucose-in-water (UGLU) calibration solutions from 0 to 10 g dL−1, evaluated for four configurations Sys1–Sys4, using the optimized stack under TM interrogation at 633 nm. “Overall” denotes the cumulative discrimination score across the concentration range. H2O (RI = 1.330) serves as the baseline.

Author Contributions

T.T., Conceptualization, investigation, funding acquisition. M.G., software. S.L., formal analysis. D.M., formal analysis. A.B.C., formal analysis. J.C.C.P., formal analysis. C.V.G., Conceptualization, software, investigation. All authors have read and agreed to the published version of the manuscript.

Funding

Universidad Técnica Particular de Loja has supported the publication fee of this work under grant No. POA_VIN-54.

Institutional Review Board Statement

Not applicable.

Informed Consent Statement

Not applicable.

Data Availability Statement

Data will be made available on request.

Acknowledgments

The authors are very thankful to Richard Pachacama from the School of Physics at ESPOCH for his very useful discussions.

Conflicts of Interest

The authors declare no conflicts of interest. Specifically, J.C.C.P. was employed by Terminal Portuario de Guayaquil (TPG), and he declares that the research was conducted in the absence of any commercial or financial relationships that could be construed as a potential conflict of interest.

References

  1. Alam, S.; Hasan, M.K.; Neaz, S.; Hussain, N.; Hossain, M.F.; Rahman, T. Diabetes mellitus: Insights from epidemiology, biochemistry, risk factors, diagnosis, complications and comprehensive management. Diabetology 2021, 2, 36–50. [Google Scholar] [CrossRef]
  2. Ehtewish, H.; Arredouani, A.; El-Agnaf, O. Diagnostic, prognostic, and mechanistic biomarkers of diabetes mellitus-associated cognitive decline. Int. J. Mol. Sci. 2022, 23, 6144. [Google Scholar] [CrossRef]
  3. Yadav, S.D.; Singh, N. Mechanistic insight of innovative biomarkers for screening of type II diabetes mellitus. Curr. Indian Sci. 2024, 2, E2210299X257270. [Google Scholar] [CrossRef]
  4. Kumar, R.; Saha, P.; Kumar, Y.; Sahana, S.; Dubey, A.; Prakash, O. A review on diabetes mellitus: Type 1 & type 2. World J. Pharm. Pharm. Sci. 2020, 9, 17336. [Google Scholar] [CrossRef]
  5. Rukundo, B. Useful interventions in treating diabetes: A comprehensive review. IAA J. Appl. Sci. 2025, 13, 6–13. [Google Scholar] [CrossRef]
  6. Zakir, M.; Ahuja, N.; Surksha, M.A.; Sachdev, R.; Kalariya, Y.; Nasir, M.; Kashif, M.; Shahzeen, F.; Tayyab, A.; Khan, M.S.M.; et al. Cardiovascular complications of diabetes: From microvascular to macrovascular pathways. Cureus 2023, 15, e45835. [Google Scholar] [CrossRef]
  7. Pullano, S.A.; Greco, M.; Bianco, M.G.; Foti, D.; Brunetti, A.; Fiorillo, A.S. Glucose biosensors in clinical practice: Principles, limits and perspectives of currently used devices. Theranostics 2022, 12, 493–511. [Google Scholar] [CrossRef]
  8. Kight, E.C. Advancements in Point-of-Care Diagnostic Assays for Non-Invasive Samples in Resource Constrained Settings. Ph.D. Thesis, Vanderbilt University, Nashville, TN, USA, 12 May 2023. [Google Scholar]
  9. Dhindsa, S. Evaluating Saliva Based Glucose Testing for Accessible Diabetes Care in Tanzania. Master’s Thesis, Yale School of Public Health, New Haven, CT, USA, 2025. [Google Scholar]
  10. Eerdekens, G.-J.; Rex, S.; Mesotten, D. Accuracy of blood glucose measurement and blood glucose targets. J. Diabetes Sci. Technol. 2020, 14, 560–567. [Google Scholar] [CrossRef]
  11. Sacks, D.B.; Bruns, D.E.; Goldstein, D.E.; Maclaren, N.K.; McDonald, J.M.; Parrott, M. Guidelines and recommendations for laboratory analysis in the diagnosis and management of diabetes mellitus. Clin. Chem. 2002, 48, 436–472. [Google Scholar] [CrossRef] [PubMed]
  12. Lepowsky, E.; Ghaderinezhad, F.; Knowlton, S.; Tasoglu, S. Paper-based assays for urine analysis. Biomicrofluidics 2017, 11, 051501. [Google Scholar] [CrossRef] [PubMed]
  13. Rehan, I.; Ullah, R.; Rehan, K.; Ullah, R. Noninvasive monitoring of urine glucose using phase lock-in rotating analyzer polarimeter. Laser Phys. 2025, 35, 086201. [Google Scholar] [CrossRef]
  14. Zhang, J.; Mai, X.; Hong, X.; Chen, Y.; Li, X. Optical fiber SPR biosensor with a solid-phase enzymatic reaction device for glucose detection. Sens. Actuators B Chem. 2022, 366, 131984. [Google Scholar] [CrossRef]
  15. Sheheryar, T. Next-generation hybrid multi-material surface plasmon resonance biosensor for non-invasive glucose detection with machine learning optimization. Plasmonics 2025, 1–17. [Google Scholar] [CrossRef]
  16. Zheng, W.; Han, B.; E, S.; Sun, Y.; Li, X.; Cai, Y.; Zhang, Y. Highly-sensitive and reflective glucose sensor based on optical fiber surface plasmon resonance. Microchem. J. 2020, 157, 105010. [Google Scholar] [CrossRef]
  17. Yuan, H.; Ji, W.; Chu, S.; Qian, S.; Wang, F.; Masson, J.-F.; Han, X.; Peng, W. Fiber-optic surface plasmon resonance glucose sensor enhanced with phenylboronic acid modified Au nanoparticles. Biosens. Bioelectron. 2018, 117, 637–643. [Google Scholar] [CrossRef]
  18. Bužavaitė-Vertelienė, E. Strong Coupling of Hybrid Tamm and Surface Plasmon Polaritons States. Ph.D. Thesis, Vilnius University, Vilnius, Lithuania, 2022. [Google Scholar] [CrossRef]
  19. Karki, B.; Jha, A.; Pal, A.; Srivastava, V. Sensitivity enhancement of refractive index–based surface plasmon resonance sensor for glucose detection. Opt. Quantum Electron. 2022, 54, 595. [Google Scholar] [CrossRef]
  20. Rahman, K.M.; Nayan, F.; Ahmed, R.; Rahman, M. Design and development of high sensitive surface plasmon resonance biosensors for glucose detection. Plasmonics 2025, 20, 2305–2319. [Google Scholar] [CrossRef]
  21. Puiu, M.; Bala, C. SPR and SPR imaging: Recent trends in developing nanodevices for detection and real-time monitoring of biomolecular events. Sensors 2016, 16, 870. [Google Scholar] [CrossRef]
  22. Vinay, B.K.; Ganesan, S.; Suranjan, T.R. Portable and miniaturized optical surface plasmon resonance systems: Progress in label-free detection for on-site and real-time sensing. Plasmonics 2025, 1–14. [Google Scholar] [CrossRef]
  23. Butt, M.A. Surface plasmon resonance-based biodetection systems: Principles, progress and applications—A comprehensive review. Biosensors 2025, 15, 35. [Google Scholar] [CrossRef]
  24. Hojjat Jodaylami, M.; Masson, J.-F.; Badia, A. Surface plasmon resonance sensing. Nat. Rev. Methods Primers 2025, 5, 47. [Google Scholar] [CrossRef]
  25. Das, C.M.; Kong, K.V.; Yong, K.-T. Diagnostic plasmonic sensors: Opportunities and challenges. Chem. Commun. 2022, 58, 12031–12045. [Google Scholar] [CrossRef]
  26. Wang, Q.; Ren, Z.H.; Zhao, W.M.; Wang, L.; Yan, X.; Zhu, A.S.; Qiu, F.M.; Zhang, K.K. Research advances on surface plasmon resonance biosensors. Nanoscale 2022, 14, 564–591. [Google Scholar] [CrossRef]
  27. Manickam, P.; Senthil, R. Numerical investigation of side-polished SPR PCF sensor for urine analysis. Plasmonics 2022, 17, 2023–2030. [Google Scholar] [CrossRef]
  28. Yadav, P.K.; Kumar, A.; Upadhyay, S.; Kumar, A.; Srivastava, A.; Srivastava, M.; Srivastava, S.K. 2D material–based surface plasmon resonance biosensors for applications in different domains: An insight. Microchim. Acta 2024, 191, 373. [Google Scholar] [CrossRef] [PubMed]
  29. Pandey, P.S.; Raghuwanshi, S.K.; Kumar, S. Recent advances in two-dimensional materials-based Kretschmann configuration for SPR sensors: A review. IEEE Sens. J. 2022, 22, 1105–1119. [Google Scholar] [CrossRef]
  30. Hasnat, M.A.; Hossain, M.I.; Ahsan, M.; Islam, M.F. Recent Developments in the Utilization of Nanomaterials for Sensing Platforms. In Recent Developments in Green Electrochemical Sensors: Design, Performance, and Applications; ACS Symposium Series; American Chemical Society: Washington, DC, USA, 2023; Volume 1437, Chapter 4; pp. 61–99. [Google Scholar] [CrossRef]
  31. Dutta, T.; Llamas-Garro, I.; Velázquez-González, J.S.; Bas, J.; Dubey, R.; Mishra, S.K. A New Generation of Satellite Sensors Based on Graphene and Carbon Nanotubes: A Review. IEEE Sens. J. 2024, 24, 31645–31657. [Google Scholar] [CrossRef]
  32. Yadav, A.; Kumar, A. Surface Plasmon Resonance [SPR]-Based Biosensor for Sugar Monitoring via Urine Samples. In Photonic Sensors for Biomedical Applications; Sharon, P., Gowda, P.B., Chaudhary, A., Eds.; Apple Academic Press: Waretown, NJ, USA, 2025; pp. 1–20. [Google Scholar] [CrossRef]
  33. Eddin, F.B.K.; Fan, H.; Liu, Z.; Donati, P.; Amin, Y.; Fen, Y.W.; Liang, J.; Pompa, P.P.; He, S. Progress in Surface Plasmon and Other Resonance Biosensors for Biomedical Applications. Adv. Mater. Technol. 2025, 10, 2500536. [Google Scholar] [CrossRef]
  34. Hinman, S.S.; McKeating, K.S.; Cheng, Q. Surface Plasmon Resonance: Material and Interface Design for Universal Accessibility. Anal. Chem. 2017, 90, 19–39. [Google Scholar] [CrossRef]
  35. Xu, Y.; Zhang, Z.; Yi, R.; Guo, X.; Qi, Z. Single-layer graphene-based surface plasmon resonance sensor with dynamic evanescent field enhancement for biomarker study. J. Mod. Opt. 2020, 67, 671–681. [Google Scholar] [CrossRef]
  36. Wu, L.; Chu, H.S.; Koh, W.S.; Li, E.P. Highly sensitive graphene biosensors based on surface plasmon resonance. Opt. Express 2010, 18, 14395–14400. [Google Scholar] [CrossRef] [PubMed]
  37. Tene, T.; Guevara, M.; Caicedo, I.; Granizo Jara, J.L.; Borja, M.; Gahramanli, L.; Vacacela Gomez, C.; Bellucci, S. MoS2–Si3N4-Based SPR Biosensor for the Detection of Malaria at Different Stages: A Theoretical Insight. Biosens. Bioelectron. X 2025, 26, 100655. [Google Scholar] [CrossRef]
  38. Cheon, S.; Kihm, K.D.; Kim, H.G.; Lim, G.; Park, J.S.; Lee, J.S. How to Reliably Determine the Complex Refractive Index (RI) of Graphene by Using Two Independent Measurement Constraints. Sci. Rep. 2014, 4, 6364. [Google Scholar] [CrossRef]
  39. Mudgal, N.; Saharia, A.; Agarwal, A.; Ali, J.; Yupapin, P.; Singh, G. Modeling of Highly Sensitive Surface Plasmon Resonance (SPR) Sensor for Urine Glucose Detection. Opt. Quantum Electron. 2020, 52, 307. [Google Scholar] [CrossRef]
  40. Shoshi, M.S.; Huraiya, M.A.; Raj, V.R.; Jawad, A.; Kong, C.Y.; Tabata, H.; Ramaraj, S.G.; Razzak, S.M.A. Revolutionary barium titanate–BlueP/TMDCs SPR sensor: Ultra-sensitive detection of urine glucose levels. Talanta Open 2025, 11, 100401. [Google Scholar] [CrossRef]
  41. Rahman, K.M. Modeling of a BK7 prism/Ag/Ni/ZnSe/SM-based sensor for maintaining optimum performance in glucose level detection. Biosens. Bioelectron. X 2025, 24, 100604. [Google Scholar] [CrossRef]
  42. Mostufa, S.; Paul, A.K.; Chakrabarti, K. Detection of hemoglobin in blood and urine glucose level samples using a graphene-coated SPR based biosensor. OSA Contin. 2021, 4, 2164–2176. [Google Scholar] [CrossRef]
  43. El-Assar, M.; Taha, T.E.; El-Samie, F.E.A.; Fayed, H.A.; Aly, M.H. ZnSe-based highly-sensitive SPR biosensor for detection of different cancer cells and urine glucose levels. Opt. Quantum Electron. 2022, 55, 76. [Google Scholar] [CrossRef]
  44. Houari, F.; El Barghouti, M.; Mir, A.; Akjouj, A. Nanosensors Based on Bimetallic Plasmonic Layer and Black Phosphorus: Application to Urine Glucose Detection. Sensors 2024, 24, 5058. [Google Scholar] [CrossRef]
  45. Akib, T.B.A.; Rana, M.M.; Mehedi, I.M. Multi-Layer SPR Biosensor for In-Situ Amplified Monitoring of the SARS-CoV-2 Omicron (B.1.1.529) Variant. Biosens. Bioelectron. X 2024, 16, 100434. [Google Scholar] [CrossRef]
  46. Kumar, A.; Kumar, A.; Srivastava, S.K. Silicon Nitride–BP-Based Surface Plasmon Resonance Highly Sensitive Biosensor for Virus SARS-CoV-2 Detection. Plasmonics 2022, 17, 1065–1077. [Google Scholar] [CrossRef]
  47. Tene, T.; Svozilík, J.; Colcha, D.; Cevallos, Y.; Vinueza-Naranjo, P.G.; Vacacela Gomez, C.; Bellucci, S. The Tunable Parameters of Graphene-Based Biosensors. Sensors 2024, 24, 5049. [Google Scholar] [CrossRef]
  48. Song, B.; Liu, F.; Wang, H.; Miao, J.; Chen, Y.; Kumar, P.; Zhang, H.; Liu, X.; Gu, H.; Stach, E.A.; et al. Giant Gate-Tunability of Complex Refractive Index in Semiconducting Carbon Nanotubes. ACS Photonics 2020, 7, 2896–2905. [Google Scholar] [CrossRef]
  49. Xue, T.; Cui, X.; Chen, J.; Liu, C.; Wang, Q.; Wang, H.; Zheng, W. A Switch of the Oxidation State of Graphene Oxide on a Surface Plasmon Resonance Chip. ACS Appl. Mater. Interfaces 2013, 5, 2096–2103. [Google Scholar] [CrossRef]
  50. Li, S.; Wang, J.; Huang, M. Direct CVD Growth of Twisted Graphene: Unveiling Mechanisms and Prospects for Future Applications. Small 2025, 21, 2500628. [Google Scholar] [CrossRef]
  51. Neupane, T.; Tabibi, B.; Seo, F.J. Spatial self-phase modulation in WS2 and MoS2 atomic layers. Opt. Mater. Express 2020, 10, 831–842. [Google Scholar] [CrossRef]
Figure 1. Kretschmann-geometry SPR sensor used in this work. A p-polarized beam enters a SiO2 prism at an incidence angle θ to excite surface plasmons in the Au film; an ultrathin Si3N4 spacer and a 2D nanomaterial overlayer (graphene, s-SWCNT, GO, or rGO) are placed above the metal to enhance evanescent-field coupling with the urine-glucose (UGLU) sensing medium. The reflected signal is recorded at the detector to quantify resonance shifts with refractive-index changes.
Photonics 12 01089 g001
Figure 3. Effect of gold film thickness on SPR performance for multilayer sensors with 2D overlays. Curves show Sys1–Sys4 (graphene, s-SWCNT, GO, rGO) at 633 nm: (a) resonance shift Δθ, (b) sensitivity enhancement (ΔSR/SR0), (c) dip attenuation, and (d) FWHM, all plotted versus Au thickness.
Photonics 12 01089 g003
Figure 4. Influence of Si3N4 spacer thickness on SPR performance at 633 nm for multilayer sensors with 2D overlays (Sys1–Sys4: graphene, s-SWCNT, GO, rGO). Plots show (a) resonance shift Δθ, (b) sensitivity enhancement (ΔSR/SR0), (c) dip attenuation, and (d) FWHM as functions of Si3N4 thickness. Increasing the spacer strengthens evanescent-field coupling, yielding larger Δθ and sensitivity that approach saturation beyond ~15–20 nm, while attenuation deepens and FWHM broadens, reflecting a trade-off between resonance depth and angular sharpness across the four stacks.
Photonics 12 01089 g004
Figure 5. Effect of 2D overlayer thickness on SPR performance at 633 nm for the four multilayer sensors (Sys1–Sys4: graphene, s-SWCNT, GO, rGO). Plots show (a) resonance shift Δθ, (b) sensitivity enhancement (ΔSR/SR0), (c) dip attenuation (note the logarithmic y-axis), and (d) FWHM versus overlayer thickness. Increasing the 2D layer generally strengthens evanescent-field coupling and boosts Δθ and sensitivity, with system-dependent trade-offs between resonance depth and broadening.
Photonics 12 01089 g005
Figure 6. Refractive index of the urine–glucose (UGLU) model versus glucose concentration (0–10 g dL−1). These values define the analyte refractive-index ladder used in the SPR simulations, showing a near-linear increase across the clinically relevant range.
Photonics 12 01089 g006
Figure 7. SPR reflectance versus incidence angle at 633 nm for increasing urine–glucose (UGLU) concentration in the optimized multilayer stacks: (a) Sys1—graphene, (b) Sys2—s-SWCNT, (c) Sys3—GO, and (d) Sys4—rGO. Curves correspond to UGLU levels from 0.01 to 10 g dL−1 as indicated, showing systematic resonance shifts to larger angles and concentration-dependent changes in dip depth and linewidth.
Photonics 12 01089 g007
Figure 8. Concentration-dependent SPR response of optimized multilayer sensors at 633 nm. UGLU concentration (0–10 g dL−1) versus (a) resonance shift Δθ, (b) sensitivity enhancement (ΔSR/SR0, %), (c) dip attenuation (semilog scale), and (d) FWHM for Sys1–Sys4 (graphene, s-SWCNT, GO, rGO). Increasing UGLU generally raises Δθ and sensitivity, with system-specific trade-offs between resonance depth and linewidth.
Photonics 12 01089 g008
Figure 9. Concentration-dependent sensing metrics for the optimized multilayer SPR stacks at 633 nm. UGLU concentration (0–10 g dL−1) versus (a) angular sensitivity (deg RIU−1), (b) detection accuracy, and (c) quality factor for Sys1–Sys4 (graphene, s-SWCNT, GO, rGO). Curves highlight how each 2D overlayer modulates performance across the urine-relevant range, revealing distinct trade-offs between raw sensitivity and resonance quality.
Photonics 12 01089 g009
Figure 10. Figure of merit and detection limits for optimized multilayer SPR sensors at 633 nm. UGLU concentration (0–10 g dL−1) versus (a) figure of merit, FoM (RIU−1), (b) limit of detection, LoD (×10−5 RIU), and (c) concentration sensitivity factor, CSF, for Sys1–Sys4 (graphene, s-SWCNT, GO, rGO). The trends summarize how each 2D overlayer balances sensitivity with practical detectability across the urine-relevant range.
Photonics 12 01089 g010
Figure 11. Evanescent field profiles for urine–glucose sensing with 2D overlayers (λ = 633 nm). Normalized electric field ∣E∣/∣E∣max vs. distance for six urine-glucose (UGLU) concentrations (0.015–10.0 g dL−1). Shaded bands mark layers (Au: green; Si3N4: yellow; 2D overlayer: pink). Panels: (a) graphene, (b) s-SWCNT, (c) GO, (d) rGO—each at its optimized thickness. UGLU produces a monotonic change at the metal/analyte interface while the 2D layer modulates the near-interface profile without altering the far-field decay.
Photonics 12 01089 g011
Figure 12. Linearity of resonance angle with analyte refractive index for the optimized multilayer sensors. Plots show θSPR versus RI for Sys1–Sys4 (graphene, s-SWCNT, GO, rGO) with least-squares linear fits (red). The fitted slopes correspond to angular sensitivity, and high coefficients of determination confirm near-linear response across the UGLU refractive-index window used in this study. Insert figures show the linear fit and related values.
Photonics 12 01089 g012
Table 2. State-of-the-art comparison of SPR glucose sensors based on low-dimensional materials versus the current results.
Ref.StructureConc. g dL−1Sensitivity (°/RIU)QFDA
Mudgal et al. [39]BK7/Au/MoS2/h-BN/Graphene10194.1216.040.27
Shoshi et al. [45]BK7/Ag/BaTiO3/BlueP-WS210435.0082.700.19
Rahman et al. [46]BK7/Ag/Ni/ZnSe10348.00102.660.30
Mostufa et al. [47]BK7/Au/PtSe2/Graphene10166.67------
El-Assar et al. [48]BK7/Ag/ZnSe10366.6066.410.18
Houari et al. [49]BK7/TiO2/SiO2/Ag/Au/BP10240.0029.281.09
This workSys1Overall Sensitivity239.989.300.15
This workSys2Overall Sensitivity244.8512.610.21
This workSys3Overall Sensitivity274.4210.370.17
This workSys4Overall Sensitivity179.229.870.16
Disclaimer/Publisher’s Note: The statements, opinions and data contained in all publications are solely those of the individual author(s) and contributor(s) and not of MDPI and/or the editor(s). MDPI and/or the editor(s) disclaim responsibility for any injury to people or property resulting from any ideas, methods, instructions or products referred to in the content.