1. Introduction
Visible light communication (VLC) is currently one of the most promising research fields in wireless communication [
1], which has significant advantages in high-speed data transmission and spectrum utilization [
2], but due to the limited coverage of visible light communication access points (APs), it often faces frequent communication interruptions during user movement. This makes it a key challenge to ensure stable user connectivity in dynamic environments, especially in multi-AP environments; efficient selection of the appropriate AP is crucial for maintaining stable communication quality. In recent years, extensive research has been conducted on AP selection in VLC systems, with a primary focus on position-based prediction [
3,
4]. This approach aims to predict the user’s movement trajectory in advance and determine the next target AP by continuously collecting real-time user’s position data.
Dayrene et al. proposed a classification model to predict the type of user’s trajectory and assist a reinforcement learning (RL) algorithm to make handover decisions that are automatically adapted to new network conditions [
3]. Similarly, Rong et al. proposed an anticipatory association algorithm in indoor VLC networks [
4]. By considering the user’s future position and transmission traffic, the algorithm prepares the APs for users in advance. Additionally, Mishra et al. proposed a handover algorithm based on position prediction to realize seamless switching between APs [
5]. Furthermore, Yang et al. proposed a novel VLC and positioning (VLCP) network for indoor Internet of Things (IoT) devices [
6]. By considering the light-path blockage and position prediction, the algorithm achieves robust handover of IoT devices among APs. Notably, previous research focused on indoor VLC positioning and prediction of user behavior trajectories, typically adopting a fixed scheduling period for position prediction and AP selection. While it is capable of predicting the user’s future position, using a uniform prediction interval at varying speeds may impact the real-time effectiveness of AP selection. Adjusting the prediction interval based on the user’s movement speed to ensure timely response to positional changes remains an unsolved challenge in the existing literature. Thus, optimizing the prediction period to account for movement speed becomes imperative. At different movement speeds, the real-time performance of AP selection is primarily influenced by two factors: the collection period of position information and the prediction period of position information.
For the collection period of position information (PI), a longer collection period cannot capture the user’s position changes in time, while a shorter collection period results in increased signaling overhead and energy consumption. Thus, an appropriate period of PI collection is crucial. Mishra et al. used the length of the superframe as a collection period to obtain the user’s position information [
5]. Peppino et al. analyzed the relationship between the collection period and the iterative steps of the predictor [
7]. They found that when the collection period increases, the autocorrelation of position information decreases, and the predictor’s dependence on historical data will increase. Katsikouli et al. discovered that when the sampling interval is constant, the average error of the reconstructed trajectory from periodic samples scales linearly with the sampling interval. It is important to note that if the acquisition period is excessively long, the error in the predicted trajectory will significantly increase in comparison to the actual trajectory. Therefore, dynamically adjusting the sampling frequency based on user mobility and target accuracy levels can further reduce energy consumption [
8]. Fazio et al. discussed the relationship between speed and mobility sampling frequency in dynamic urban networks, emphasizing the importance of adjusting the sampling frequency based on mobility patterns to prevent oversampling, which results in prediction errors [
9]. These studies indicate that selecting an appropriate sampling period is crucial. At present, the setting of the PI collection period for different movement speeds has not been studied in indoor VLC networks.
For the position-predicted period (PP), the research on this problem has not been published. The prediction period of position information will affect the transmission quality of mobile users. A longer prediction period will lead to delayed handover. A shorter prediction period will produce frequent predictions and increase the computational workload of the system. Therefore, it is crucial to reasonably adjust the period of PI prediction to minimize unnecessary predictions.
To solve the above problems, this paper will study the adjustment algorithm of the position-predicted period under different movement speeds to enhance prediction accuracy, minimize unnecessary predictions, and ultimately improve the transmission quality of mobile users.
3. PP Adjustment Algorithm Adaptive to Movement Speed
When the user enters the indoor model, the coordinator will associate with the UE of this user. The UE encapsulates received power and movement speed in an uplink data packet and transmits data to the coordinator through the GTS time slot. The coordinator uses received power to locate the user’s position. Through analysis, it can be known that the PI collection period is equal to the BI. In the VLC network applying position-prediction-based AP selection, the coordinator predicts the next position of the UE and makes an AP selection process every prediction period. However, the differential setting of the prediction period is widely ignored and is instead equated by default to the PI collection period. Furthermore, both the PI collection period and the prediction period were set to be fixed in the existing studies and were not matched to the user’s movement speed. This will affect the real-time performance of the AP selection. As an illustrative example, consider a simple two-user scenario in which two users are assumed to move at different speeds. The scenario, along with the users’ movement paths and PI collection and position-prediction points, are depicted in
Figure 3. Each user is originally associated to AP 3 and is moving toward AP 2. It is assumed that the unified PI collection period and prediction period are used at different movement speeds. Moreover, the prediction period is set to be twice the PI collection period, i.e.,
=
.
A unified PI collection period may not be able to capture the user’s position change in time, thus affecting the real-time AP selection. This has two main aspects. On the one hand, a unified PI acquisition period may lose critical position information. As shown in
Figure 3, user B is moving faster and misses the critical position information in the coverage area of AP 4. If the AP selection method based on position prediction is adopted, user B will switch from AP 3 to AP 2 in the coverage area of AP 3. As a result, the data rate is degraded in the coverage area of AP 4. On the other hand, a unified PI collection period affects the accuracy of position prediction. When the autocorrelation between continuous PI decreases, the position-predicted accuracy will decrease. So, more complex algorithms predicting position are needed [
7]. When the prediction algorithm remains unchanged, the autocorrelation between the continuous PI obtained at different movement speeds must remain stable. Only in this way, the prediction accuracy can be guaranteed under different movement speeds. Furthermore, the matching degree between the prediction period and the user’s movement speed will directly affect the user’s transmission quality. As shown in
Figure 3, when the prediction period is long, the system may not be able to respond to the actual position change of the user in time, which will cause the handover delay caused by the failure of user A to switch in time when moving to the next AP coverage, resulting in signal interruption or a data transmission rate drop. When the prediction period is short, the system needs to frequently update and predict the position information, resulting in an increase in the computing workload of the system, and the system may trigger AP handover too frequently, even when the actual position of the user does not change significantly. This excessive handover (ping-pong effect) will affect the stability of communication, cause fluctuations in transmission rates, and increase the burden of handover management [
15]. The speed at which the user moves is a key factor in determining the length of the prediction period. For slower-moving users, the prediction period can be relatively long to reduce system overhead; for fast-moving users, the prediction period needs to be shortened to ensure the continuity and speed of transmission. Therefore, proper adjustment of the PI collection period and prediction period for different movement speeds is essential to improve the transmission quality and efficiency for mobile users. Next, this paper will respectively model the PI collection period and the prediction period.
3.1. Speed-Adaptive PI Collection
It is assumed that the step length remains unchanged when the user is moving. The step length is expressed as
. When the user’s movement speed is
m/s, the time length of each step (
) during the user’s movement can be expressed as:
From the above content, . In order to obtain real-time PI, the coordinator collects the user’s PI by the user’s mobile characteristics.
Let
. The value of the corresponding BO can be obtained through Formula (4). The value of the corresponding BO is as follows:
The
is given by Formula (10):
Among them, the [x] function represents the rounding function, and the output result is the largest integer that does not exceed the real number x.
3.2. Speed-Adaptive PP Adjustment
The coverage area of each AP is divided into two parts: the coverage area of high received power () and the coverage area of low received power (). is the center area of the AP coverage area. Because the influence from other APs is small, the handover probability is small in the . is the edge area of the AP coverage area. Because the influence from other APs is big, the handover probability is relatively high in the .
The calculation model of the user’s stay time in the
is shown in
Figure 4. Among them, R represents the radius of the
.
represents the user’s crossing distance in the
(
).
represents the angle between the user’s movement direction and the
(
).
represents the distance between the user and the
, and h represents the vertical distance between the
and the path of movement.
In the calculation model of stay time, it is assumed that the user’s movement speed is constant. The user enters the
from the edge, moves in a straight line, and can change the movement direction at any time. From
Figure 4, the distance that the user traverses in the
is [
16]:
The user’s stay time in the
can be expressed as follows:
When the user enters the indoor model, the UE sends received power and movement speed to the coordinator every . The handover probability is relatively high in the . The PI collection and PI prediction are basically completed at the same time to estimate the user’s position in time. When the user enters the of , the PI prediction period is equal to the PI collection period. That is, =.
The handover probability is small in the . The predictive period can be increased appropriately. When the user enters the of , the coordinator calculates the stay time of the user. When the is relatively large, the user will stay in the coverage area of high received power for a long time. The user does not need to switch to a new AP in a short time. So, the coordinator can increase the predictive period. is selected as the threshold for the period adjustment of PI prediction in this paper. Because , the stay time is relatively short. The increase of the predictive period may lead to untimely handover. According to the above content: when , =. When , =.
Assuming the current position of the user is (,), two positions before the current position can be expressed as (,), (,). When , it means that the user has not changed the movement direction at . When , the user changes the movement direction at . When the user’s movement direction changes in the , the coordinator will recalculate the user’s stay time and determine the predictive period.
Based on the above, the PP adjustment Algorithm 1 adaptive to movement speed is as follows.
| Algorithm 1: The PP adjustment algorithm adaptive to movement speed |
Input parameters: , ;
Phase 1: Speed-adaptive PI collection
Step 1:
Step 2: ;
Step 3: ;
Phase 2: Speed-adaptive PP adjustment
Situation 1: User enters the of
= ;
Situation 2: User enters the of
();
Step 2: Adjust position-predicted period
If ()
=;
If ()
=;
If the direction changes ()
Step 1 is performed;
Output parameters: , |
4. Simulation Analysis
This paper uses the random waypoint model (RWP) to generate user movement data and uses Python to realize the simulation process. The setting of simulation parameters is shown in
Table 1.
4.1. Simulation of Speed-Adaptive PI Collection
In order to maintain the stability of the autocorrelation between continuous PI obtained at different movement speeds, the speed-adaptive PI collection is realized. Next, this article will demonstrate the effectiveness of speed-adaptive PI collection through simulation.
- (1)
Measuring index of PI autocorrelation
The autocorrelation function is used to measure the correlation between observations every K time units (
,
) in a time series. The autocorrelation coefficient is an indicator of the correlation degree between variables. The calculation formula of the autocorrelation coefficient can be expressed by:
Among them, k is the order, u is the mean value of the sequence, and the denominator
is the variance.
and
respectively correspond to the
item of the two split sequences [
17].
In order to express the autocorrelation of position information more conveniently, this paper uses the pairing function (PF) to associate the position coordinates with a value. The autocorrelation of the position information can be obtained by observing the autocorrelation of the value. The formula of the PF is as follows [
18]:
- (2)
Autocorrelation of PI obtained under different collection periods and movement speeds
In simulation, it is assumed that the user’s movement speed is constant during the entire movement. The PI collection period (
) can be obtained through Formula (11). The autocorrelation coefficients of PI obtained under different movement speeds will be calculated. The result is shown in
Figure 5. It can be seen from this figure that when the collection period is
, the autocorrelation coefficients of PI obtained under different movement speeds remain between 95% and 98%. The result shows that the autocorrelation of PI can still be kept stable under different movement speeds. So, the prediction accuracy can be guaranteed under different movement speeds.
Next, the PI autocorrelation obtained under different collection periods will be discussed. The UE sends received power and movement speed in cycles of , 2, and 3, respectively. The coordinator locates the user’s position according to the received power. So, the PI collection period is , 2, and 3, respectively. The autocorrelation coefficients of PI obtained under three collection periods are calculated separately.
It can be seen from
Figure 5 that the autocorrelation coefficient of PI decreases with an increase in the collection period. When the collection period is
, the autocorrelation coefficient of PI is higher than 95% under different speeds. The result shows that when the collection period is approximately equal to the movement time of the user’s single step, the autocorrelation of PI can be well guaranteed. According to above analysis, the optimal collection period of PI at a given movement speed can be determined.
4.2. Simulation of the PP Adjustment Algorithm Adaptive to Movement Speed
In order to improve the transmission quality of mobile users under different movement speeds, the PP adjustment algorithm adaptive to movement speed is proposed. Next, this article will demonstrate the effectiveness of the PP adjustment algorithm through simulation.
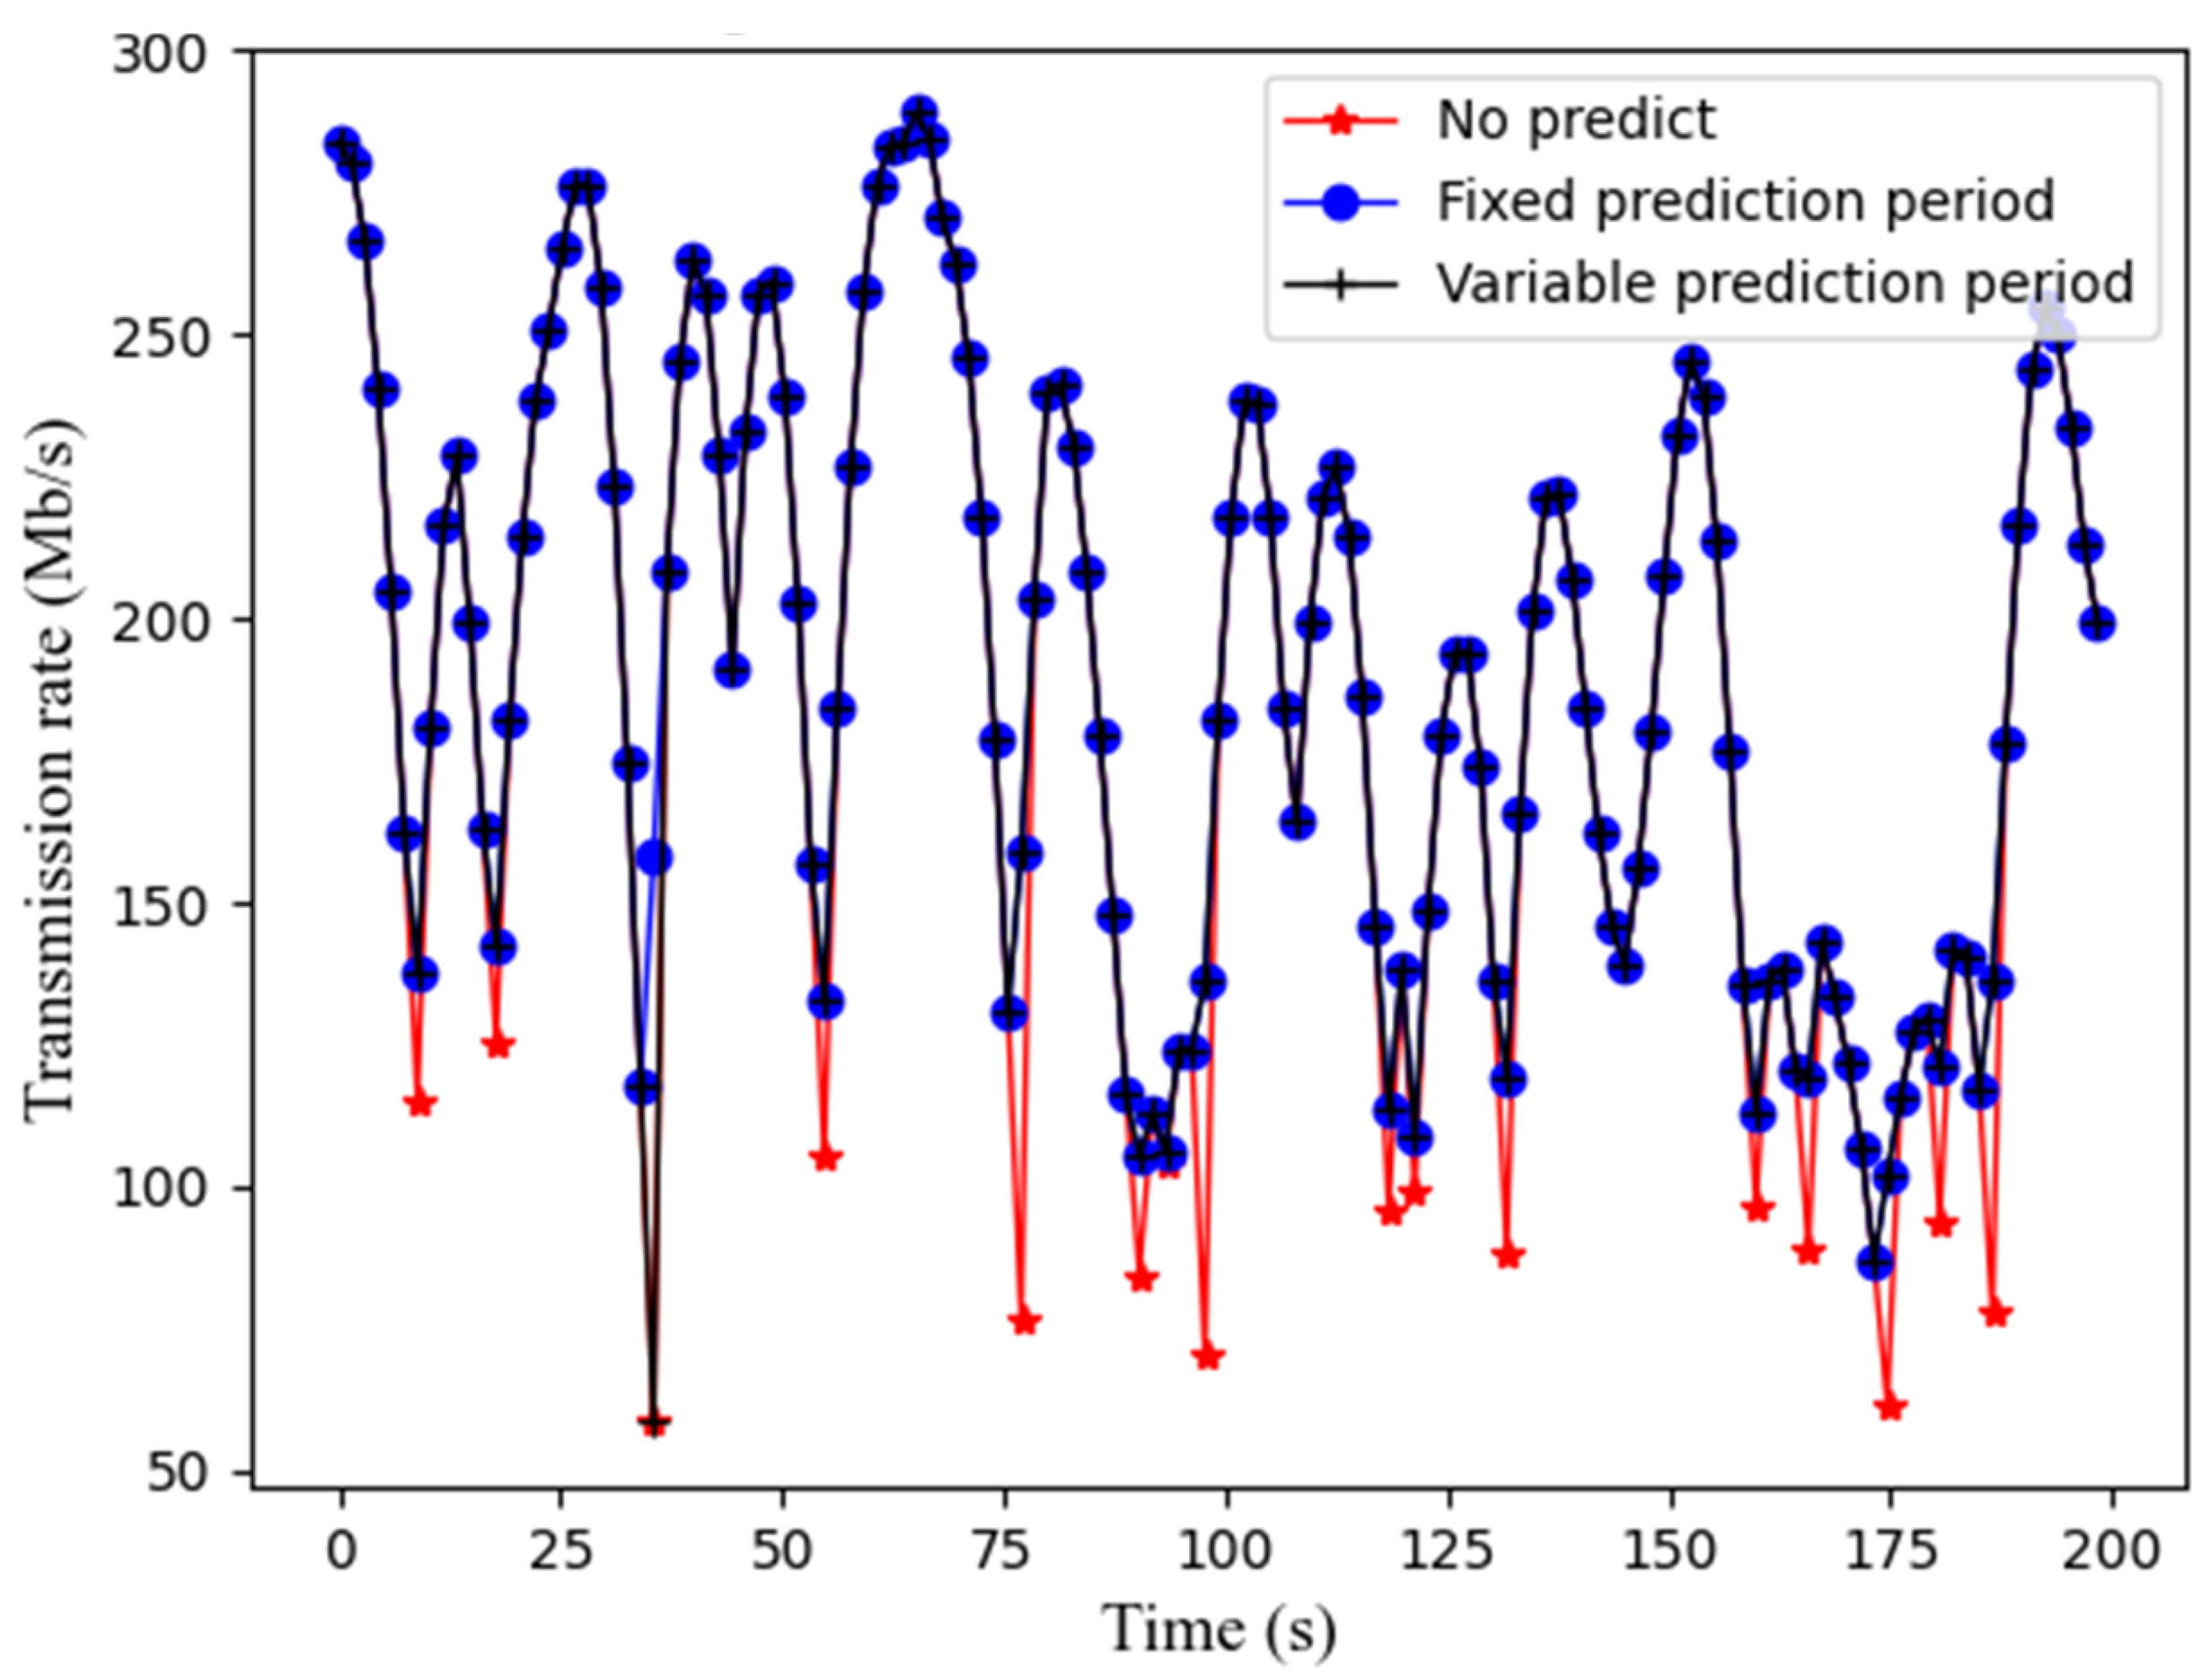
Through the RWP model, the user’s movement data when the movement speed is 0.5 m/s, 1.0 m/s, and 1.5 m/s can be obtained separately. The duration of each movement process is 200 (s). The transmission rates obtained in the three cases are compared by simulation. The three cases are:
- (1)
Traditional AP selection. This case does not perform position prediction.
- (2)
AP selection with fixed prediction period. This case is based on position prediction and uses a fixed prediction period ( = ). can be obtained by the speed-adaptive PI collection proposed in this paper.
- (3)
AP selection with variable prediction period. This case is based on position prediction and uses a variable prediction period ( = ). The value of can be obtained by the speed-adaptive PP adjustment proposed in this paper.
In order to show the performance of the PP adjustment algorithm adaptive to movement speed, the changes of the transmission rate in different movement speeds are simulated, as shown in
Figure 6,
Figure 7 and
Figure 8. First of all, it can be seen from these figures that the PP adjustment algorithm can well guarantee the user’s data rate under different movement speeds. For traditional AP selection, the user’s data rate will be greatly reduced when the user connects to a new AP, as shown in the red parts of these figures. This is because the traditional AP selection cannot predict the change in the target AP in time. The AP selection based on position prediction can connect to the appropriate AP in advance, thus avoiding the degradation in the user’s data rate when the user connects to a new AP. Furthermore, it can be seen from the comparison of these three pictures that the PP adjustment algorithm can well guarantee the user’s data rate under different movement speeds. Through the speed-adaptive PP adjustment, the AP selection based on position prediction can predict the change in the target AP in time under different movement speeds. As the moving speed increases, the number of AP handovers of the entire process increases. In this case, the role of AP selection based on position prediction is more significant. Especially shown in
Figure 6, during the entire moving process, the number of untimely predictions is 1 in the AP selection using the variable prediction period. The performance of AP selection using the variable prediction period is basically the same as that of AP selection using the fixed prediction period.
The performance comparison between the AP selection using the variable prediction period and the AP selection using the fixed prediction period is shown in
Figure 9. With the increase in the number of moving steps, the number of untimely predictions increases for the AP selection using the variable prediction period. But this increase is on a small scale. The ratio of untimely predictions is less than 0.2. The ratio of untimely predictions is defined as follows:
Among them, represents the number that the change in the target AP has not been predicted in time. represents the number that the target AP changes during the whole process.
But the AP selection using the variable prediction period can effectively reduce the number of predictions. The ratio of predicted times between the two methods for AP selection is close to 60% under different movement speeds. The ratio of predicted times is defined as follows:
Among them, represents the number of predictions for the AP selection using the variable prediction period. represents the number of predictions for the AP selection using a fixed prediction period.
The reduction in the predicted time can reduce the computational intensity of the system. The system efficiency can be improved.
5. Conclusions
Now, a PP adjustment algorithm adaptive to movement speed in an indoor VLC network has been proposed. It contains two key parts: speed-adaptive PI collection and speed-adaptive PP adjustment. Firstly, by the user’s mobile characteristics, self-adaptive adjustment of the PI collection period has been realized. The simulation results show that the autocorrelation coefficient of PI obtained under different movement speeds remains at 95~98%. The prediction accuracy under different movement speeds is guaranteed by self-adaptive PI collection. Next, by distribution characteristics of received power, speed-adaptive PP adjustment has been achieved. Simulation results show that the number of the position prediction has been reduced by 40%. The number of unnecessary predictions is reduced effectively. Finally, by the AP selection based on position prediction and the PP adjustment algorithm adaptive to movement speed, the user’s transmission quality under different movement speeds is improved.


