Abstract
Phase measurement profilometry (PMP) is primarily employed to analyze the morphology of a functional surface with precision. Historically, one of the most complex and persistent challenges in PMP has been reducing errors stemming from inconsistent indicators at the edges of a surface. In response to this challenge, we propose an optimized error compensation methodology specifically designed to handle edge artefacts. This methodology introduces the Hilbert transform and object surface albedo as tools to detect the edges of the artefact region that need to be compensated. Moreover, we analyze the characteristics of the sinusoidal fringe waveform propagation direction and investigate the reconstruction results of the fringe vertical to the current directions to compensate for edge artefacts. The experimental results for various objects show that the optimized approach can compensate for edge artefacts by projecting in two directions and reducing the projection by half. The compensated root mean square error (RMSE) for planar objects can be reduced by over 45%.
1. Introduction
There are growing demands and applications for fringe projection profilometry in the field of precise three-dimensional (3D) shape measurement [1,2,3,4,5,6]. A typical monocular fringe profile projection system consists of a projector and a camera. In this system, the projector casts coded fringes onto the surface of an object, with these fringes carrying pre-encoded phase information. Subsequently, the camera triggers synchrously to capture the fringes as they are modulated by the object. Finally, the PMP algorithm is applied to obtain the depth information according to the phase information in the fringes. However, detecting the details of an object with edge artefacts is difficult, and this is especially true when dealing with defective objects.
Edge artefacts refer to the error phenomenon arising from inconsistent indicators at the surface edges, particularly significant in areas with varying height and color values. These artefacts lead to a well-known problem of misidentification in the field of X-ray scanning, hindering doctoral assessments of pathogenic conditions. To address this issue, various algorithms have been proposed to mitigate the effects of edge artefacts. For example, Laloum et al. [7] presented a method to constrain the absorption edge effect applied to a microelectronic context to suppress the dark streaks between interconnections. However, most approaches mainly concentrate on two-dimensional (2D) shapes and fail to handle 3D measurements.
Compared with X-ray scanning studies, the edge artefact effect in PMP has been researched to a lesser degree, while many research works have paid attention to enhancing processing speed. Zuo et al. [8] proposed Micro Fourier Transform Profilometry (μFTP) in 2018, achieving a remarkable measurement rate of 10,000 frames per second. This approach enables the precise reconstruction of high-speed scenes that are challenging to capture using conventional methods. Additionally, to address saturation results from highly reflective surfaces, Chen et al. [9] introduced an adaptive projection fringe intensity adjustment method. This method codes fringe intensity from corresponding saturated fringe pixels, effectively reducing the impact of object surface reflection. Recently, researchers have also investigated deep learning-based fringe projection methods; for instance, Zhang et al. [10] designed a high-speed and high-dynamic-range 3D profile measurement using a specifically tailored convolutional neural network (CNN) to extract high-dynamic-range object phase information. These studies demonstrate that PMP has applications in many fields.
In terms of the edge artefact effect, a tuner is employed to remove the background and eliminate areas with a low signal-to-noise ratio (SNR) [11]. Brakhage et al. [12] treated the edge contour by cutting the sample edge to reduce the influence of the edge artefacts, hence enhancing measurement precision. In measurement applications, edge contours are of importance. Yue et al. [13] conducted a theoretical analysis of the artefact phenomenon around the standard circle, and the results showed that differing reflectivity causes fringe contour error, which eventually resulted in less detailed artefacts.
In the PMP experiment conducted for this study, it was determined that the edge artefact of a surface significantly influences the measurement result [14]. This effect can be demonstrated using various examples, such as a checkerboard, where edge artefacts may be formed by the ladder block at certain angles or during the scanning measurement of cultural relics with the damaged surfaces. Figure 1 illustrates a checkerboard affected by edge artefact effects and presents its corresponding phase map. Figure 1a shows a standard checkerboard image, while Figure 1b indicates the absolute phase map where edge artefacts at the black and white junction are identified. The phase error caused by this effect can seriously affect the final 3D reconstruction results, increasing system errors and reducing measurement accuracy.
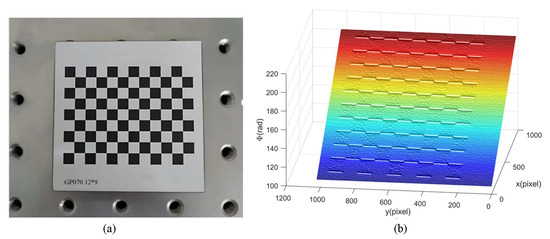
Figure 1.
A checkerboard with discontinuous surface reflectivity. (a) Checkerboard image; (b) absolute phase rendered in mesh plot.
To this end, this study introduces a novel compensation method that aims to reduce the error effect of edge artefacts in PMP. Unlike the compensation from the phase stage mentioned above, this method compensates the reconstruction results directly. The experiment showed that the effect of edge artefacts on the fringe distribution direction is different, i.e., the effect of edge artefact in the row direction is greater than in the column direction, as shown in Figure 1. This effect will also transfer to 3D reconstruction results. To tackle this problem, this study projects horizontal and vertical fringes onto the object, respectively, where the reconstruction of vertical fringes is compensated for the reconstruction of horizontal fringes. However, there are twice the number of fringes due to the bidirectional projection, which brings with it high computational costs and time-consuming processing. To this end, the Hilbert transform is integrated to calculate the wrapped phase of the object surface so that only half-projected fringes are required, and the number is the same as the unidirectional projection. In the meantime, to better identify edge artefact regions, this study also applied the albedo of the object surface for fine detection based on the traditional edge detection results so that the compensation area can be more accurate and improve the overall measurement accuracy. Furthermore, a local phase correction method is proposed to reduce the phase jump and error. It corrects the phase error of different positions in multiple degrees, which is an essential improvement for compensating dense error areas. Moreover, the minimum error phase correction method is investigated to compensate for the sinusoidal errors.
2. The Proposed Method
The framework of the proposed method is illustrated in Figure 2. The proposed method consists of four steps: Step 1 involves the calculation of the absolute phase of the projected fringes. Step 2 focuses on the extraction of the calibration data and the reconstruction of the surface. Step 3 entails establishing a mask matrix to identify edge artefacts utilizing the object surface’s albedo, and, finally, Step 4 involves undertaking error compensating for edge artefacts by using the output of the previous steps. The sub-sections below explain the relevant operations in detail.
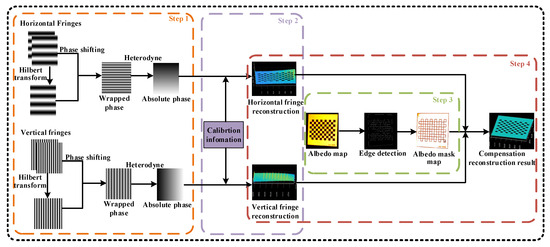
Figure 2.
The framework of the proposed method.
2.1. Wrapped Phase Retrieval
Fourier Transform Profilometry (FTP) [15,16] and Phase-Shifting Profilometry (PSP) methods [17,18] are often used to obtain phases, and PSP was selected for this study. PSP uses a set of sinusoidal fringe patterns, and the intensity distribution of each fringe pattern can be expressed as follows:
where is the coordinate of the pixel point under the projector, the subscript represents the number of phase-shift steps, N represents the total number of phase shift steps; a(x, y) represents the temporal DC value, b(x, y) indicates the amplitude of the temporal AC signal, fx represents the frequency of the fringe, and is the amount of phase shift. These generated fringe patterns are projected by the projector, and the images are obtained via synchronization with the camera.
Due to the presence of the ambient light, the fringe image obtained by the camera is subject to two beams of projected ambient light and ; then, the fringe image captured by the camera can be expressed as the following [19]:
where represents the coordinate of the pixel, and represents the albedo of the photographed object. In general, Equation (2) can be simply rewritten as follows:
where represents the average intensity, and represents the intensity modulation. Then, the wrapped phase of the object can be calculated by using the following:
With the arctangent function, phase values are wrapped in the range . Therefore, it is necessary to unwrap the phase by using the multi-frequency heterodyne method to obtain the absolute phase. If the four-step phase-shift method and the three-frequency heterodyne are utilized, then a total of 24 fringe patterns need to be projected, which is time-consuming. In order to reduce the projected patterns, this study takes inspiration from the efficient intensity-based fringe projection profilometry method proposed by Deng et al. [20]. By using the Hilbert transform characteristics, only two phase-shift patterns are required to obtain the wrapped phase. The complete measurement requires a total of 12 patterns to complete the acquisition of the absolute phase.
The intensity of the sinusoidal patterns can be expressed by the following:
The two projected fringe patterns, i.e., and , can be subtracted to obtain :
Then, the Hilbert transform can be applied to Equation (6) to obtain the fringe pattern with the phase shift of :
where represents the Hilbert transform. The phase shift pattern can be used to calculate the wrapped phase and the albedo of the object:
where represents the wrapped phase of the object, and represents the albedo of the object.
2.2. Phase Unwrapped
The main reason for the wrapping phase is that the arctangent function is employed in the phase-shifting method to solve the phase; hence, the calculated phase is wrapped in the range . Therefore, phase unwrapping is required to obtain the absolute phase [21,22]. This study applies an improved multi-frequency phase heterodyne method for unwrapping the phase. The multi-frequency phase heterodyne method combines several beams of similar phase-shift light with various periods into a group of coded frames by using the principle of beat frequency. By subtracting the phases of different periods, the small wrapped phase is amplified into the large period of phase difference until the period of the signal covers the entire measured field of view.
As shown in Figure 3, and are the periods of the phase functions occurring at different frequencies, while is the period of the low-frequency functions resulting from the heterodyne of these two functions [23]. The final frequency of the heterodyne function is 1, which means that the span of the fringe is the width of the whole image. The phase value after processing is unique across the entire image span; therefore, the absolute phase value of each pixel can be determined.
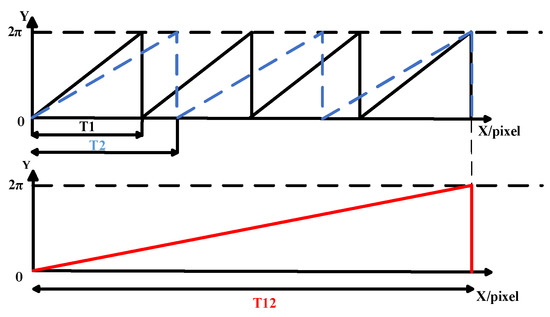
Figure 3.
Schematic diagram of multi-frequency heterodyne.
The phase of the new fringe obtained does not need to be unwrapped since the low-frequency phase heterodyne image obtained by phase difference covers the entire field of view, as shown in the following:
where is the absolute phase at , and is the wrapped phase at .
Since the position of the same pixel in the phase diagram of the image is the same and the relative position of the measuring camera, projector, and the measured object is the same, the relationship between the absolute phases at different periods can be obtained by using the following:
where is the absolute phase of the phase diagrams at a given frequency, and is the period of phase diagrams at different frequencies. After the absolute phase of the low-frequency phase is obtained, the absolute phase of two high frequencies can be calculated by the number of fringe steps, and the low-frequency phase is then generated by the phase superposition of two high frequencies. In practice, the fringe order needs to be rounded, and the calculation Equation for the fringe order is as follows:
where is the number of fringe orders, and is the phase difference. After obtaining the fringe order from the phase difference, the absolute phase of the initial grating can be calculated by using the following:
where is the absolute phase of the phase function of the highest frequency.
2.3. System Calibration
After obtaining the absolute phase information of the object, it is necessary to reconstruct the object from its calibration parameters. This step calculates calibration parameters that determine how the phase is converted into the corresponding 3D coordinate. Therefore, system calibration is crucial to fringe projection systems because it arbitrates the accuracy of the final 3D reconstruction. Calibration models are usually divided into the phase-height models and the triangular stereo models [24]. The phase-height model imposes high constraints on the geometric relationship between the camera and the projector; thus, the flexible triangular stereo model is chosen for system calibration. Figure 4 demonstrates the phase-height model and the triangular stereo model, respectively. In the triangular stereo model, the projector is used as a pseudo camera, enabling the projector to capture images. Reconstruction is performed using triangulation by matching the same points pairs of the camera and the projector.
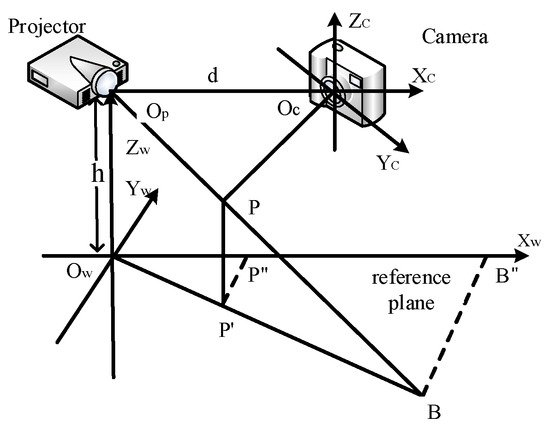
Figure 4.
System calibration model.
Firstly, the camera needs to be calibrated. The intrinsic camera matrix Ac, rotation matrix Rc, and translation matrix tc are obtained by using Zhang’s calibration method [25], and then the homography matrix Hc of the camera can be calculated by the following:
The next step is to calibrate the projector. If the projector is regarded as a virtual camera in the trigonometric model, the projector can be calibrated by way of calibrating the camera. The method proposed by Zhang [25] is first used to find out the marker points in the camera coordinate system corresponding to the coordinate in the projector coordinate system, as shown in the following:
where and represent the horizontal and vertical coordinates of the corner point in the projector coordinate system, respectively, V indicates the projector resolution, T is the stripe frequency, H represents the phase values under the vertical direction, and and are horizontal stripes of the point corresponding to the camera coordinate system, respectively.
After obtaining the coordinates of the corresponding marker points, the projector can be calibrated by using the method of camera calibration. The intrinsic projector matrix Ap, rotation matrix Rp, and translation matrix tp can be used to calculate the homography matrix Hp of the projector, as shown in the following:
After obtaining the homography matrix Hc and Hp for the camera and projector, respectively, phase coordinate conversion can be performed. For a given pixel point and the horizontal coordinate of the projector, the corresponding 3D point information can be calculated by using the following:
2.4. Edge Artefacts Compensation
Figure 5 shows how the sinusoidal waveform of the vertical fringe varies in rows and the sinusoidal waveform of the horizontal fringe varies in columns, respectively. These waveforms from the edge artefacts on the surface of the object have different distributions. Generally, the effect of the edge artefacts on the column direction is greater than the row direction, and the effect of the edge artefacts on the row direction is also greater than the column direction. In terms of 3D reconstruction, the coordinate system established by the horizontal fringe and vertical fringe is consistent. Therefore, the corresponding points of the same object are consistent when reconstructed under the projection of the horizontal fringe and vertical fringe. Therefore, the height value at the edge artefacts of the vertical fringe in the column direction can be compensated by the less severely affected height value of the horizontal fringe in the column direction, and the value of the vertical fringe in the row direction corresponding to the horizontal fringe in the row direction remains unchanged. Similarly, the vertical fringe can also be selected to compensate for the resulting reconstruction result of the horizontal fringe.
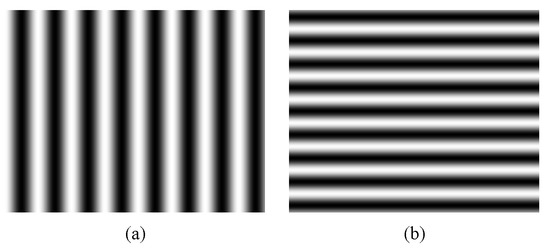
Figure 5.
Fringe patterns with phase information. (a) A vertical fringe pattern; (b) a horizontal fringe pattern.
Because the contrast is inconsistent and the reflectance of the object at the junction is different, the albedo of the objects at these positions is significantly different in different places. Therefore, to better extract the coordinate points of the edge artefacts, this study proposes a method to extract the masked image of edge artefacts by combining albedo image processing, and the mask image M is established by using the following:
Firstly, coarse detection is performed by using the Canny edge detection method, and the segmentation thresholds T1 and T2 are established by combining the results obtained from coarse detection with the albedo. The thresholds are then used to determine whether the current point belongs to edge artefacts, and if the point is marked as 1, and other points are marked as 0. Based on this strategy, Figure 6a shows the albedo of the object surface, and Figure 6b demonstrates the surface albedo at the edge artefacts extracted through the mask .
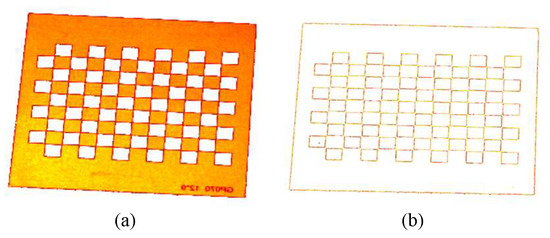
Figure 6.
Albedo image and mask image. (a) The albedo of a checkerboard surface; (b) the albedo of the mask image.
By combining the calibration information of the system, the absolute phase of the horizontal fringe and the vertical fringe were reconstructed, respectively. In this study, the corresponding 3D coordinate information was stored by matrixes X, Y, and Z to simplify the compensation operation of the edge artefacts. The horizontal fringe matrix and the vertical fringe matrix with the height value compensated. A new compensation matrix is obtained by compensating for the results of the vertical fringe reconstruction.
However, the detected boundary is not distributed in a single direction, so Equation (20) cannot be directly used for compensation. To this end, this study combines the domain judgment to find the average number of width pixels of edge artefacts and in the row and column direction, respectively. In terms of compensating the reconstruction results of the vertical fringe, this study judges whether the upper, lower, and left points of the current point are mark points, i.e., if the pixels are only in the left and right directions, then there are mark points and the current point is not compensated; if the pixels are only in the upper and lower directions, then there are mark points, and the current point is the compensation point. This study stores the identified points in the matrix Q.
After combining the point matrix Q, a new compensation matrix can be obtained by using the following:
3. Experiments
To verify the availability of the proposed phase correction algorithm in the multi-frequency phase heterodyne method, experiments were first carried out using a computer-generated standard stripe pattern with varying intensities of noise added. The results were then applied to the metal workpiece surfaces to verify the feasibility of the algorithm in practical applications. To validate the method proposed in this study, we constructed an experimental system (see Figure 7) that consisted of a computer, a projector (DLP LightCrafter 4500 with a resolution of 912 × 1140), and a camera (MV-CA050-11UM with a resolution of 2048 × 2448, produced by HIKROBOT, China). The system was located 300 to 400 mm above the object.
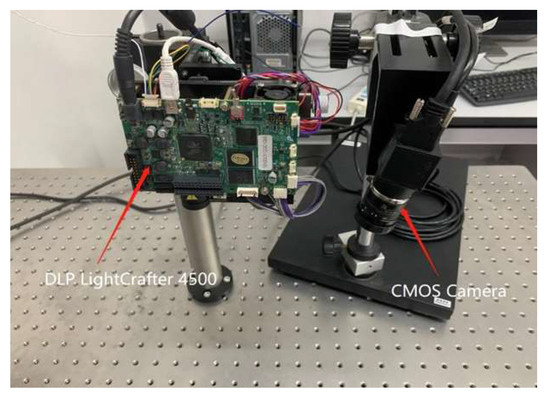
Figure 7.
Experimental devices.
We used sinusoidal stripes with frequencies from 70 to 64 and 59 for projection, respectively, and the triangle model was used to calibrate the established system [26]. Eleven sets of calibration plate images in different poses were employed to calibrate the system, and the camera homography matrix and projector homography matrix were obtained as follows:
3.1. Reconstruction of Checkerboard
The first experiment involved reconstructing a black and white checkerboard plane to calibrate the camera. Figure 8a,b show the vertical and horizontal projected fringes of the checkerboard, respectively. The Hilbert transform is integrated to obtain the wrapped phase, and then the three-frequency heterodyne method is used to calculate the absolute phase, thereby obtaining the fringe pattern. Figure 8c,d represent the absolute phase obtained by the vertical fringe and horizontal fringe, respectively. The results of the reconstruction using the system calibration information are shown in Figure 8e,f. Artefacts at the boundary of the edge can seriously affect reconstruction effects. Figure 8g shows the albedo of the surface of the object to be measured and the results obtained after using Equation (22) to calculate its edge and combining it with previous reconstruction results for compensation (shown in Figure 8h), which show that the influence of edge artefacts is significantly reduced. The root mean square error (RMSE) method (a widely used method, as evidenced by its use in studies such as [27]) was utilized to assess the performance of the proposed method. In this experiment, a reconstructed quantitative analysis of the checkerboard images in six different poses was performed, and the calculated RMSE are shown in Table 1. On average, the RMSE of a reconstruction decreases from 0.1677 mm before compensation to 0.0915 mm after compensation.
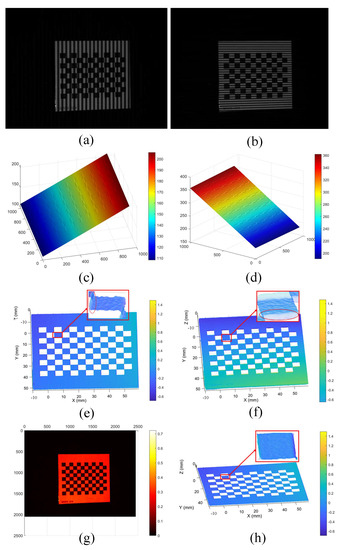
Figure 8.
Measurement results for a checkerboard. (a) Vertical fringe project image; (b) horizontal fringe projection image; (c) absolute phase of vertical fringe; (d) absolute phase of horizontal fringe; (e) result of 3D reconstruction of vertical fringe; (f) result of 3D reconstruction of horizontal fringe; (g) albedo of checkerboard surface; (h) results of 3D reconstruction after compensation.

Table 1.
The corresponding measurement RMSE (mm) for checkerboard.
3.2. Reconstruction of Ceramic Blocks
The second experiment involved reconstructing two stacked ceramic blocks. Figure 9a,b show the vertical and horizontal fringes, respectively, showing that the surfaces with different height values are numerous, which will cause a certain edge artefact effect. Figure 9c,d correspond to the absolute phase of the vertical and horizontal fringes, respectively. Figure 9e shows the reconstruction results for the vertical fringe, and Figure 9f illustrates the reconstruction results for the horizontal fringe. It can be seen that the edge artefacts caused by the height difference can have a significant impact on the final reconstruction. The result of vertical fringe reconstruction was compensated in this experiment. Figure 9g is the albedo diagram of the obtained image, and Figure 9h is the reconstructed image with compensation, which eliminates the effect of edge artefacts.
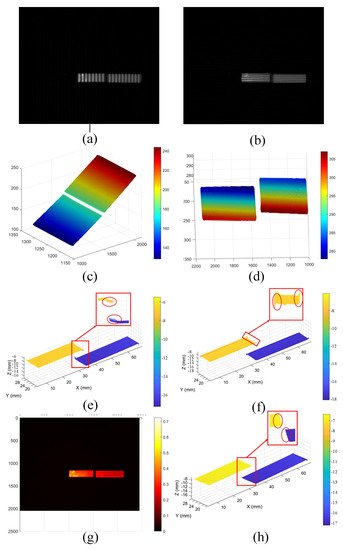
Figure 9.
Measurement results for ceramic blocks. (a) Vertical fringe project image; (b) horizontal fringe projection image; (c) absolute phase of vertical fringe; (d) absolute phase of horizontal fringe; (e) result of 3D reconstruction of vertical fringe; (f) result of 3D reconstruction of horizontal fringe; (g) albedo of ceramic block surface; (h) results of 3D reconstruction after compensation.
Subsequently, the reconstruction results were quantitatively analyzed. A comparison of the error of the points on the edge artefacts was carried out. As shown in Figure 10 (only the edge artefacts of six groups of data are shown), Figure 10a,b represent the error distributions without and within compensation, respectively. The curve of the same color represents the same location error distribution before and after compensation, and the absolute error at the edge artefacts has been significantly reduced after compensation. The RMSE was further calculated, and Table 2 shows the comparison of the RMSE of six groups of data in the edge artefacts. On average, the error is reduced by 48.7% by compensating for the error.
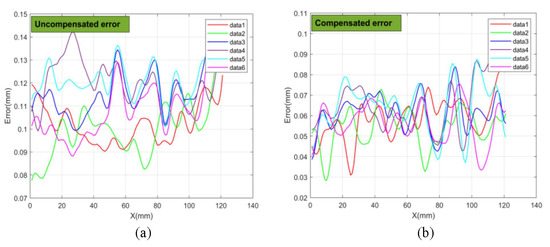
Figure 10.
Compensated machining error distributions. (a) Distribution of uncompensated error; (b) distribution of compensated error.

Table 2.
The corresponding measurement RMSE (mm) for ceramic blocks.
3.3. Reconstruction of Plaster Sculpture
To further validate the performance of the proposed method in the position of color change, a third set of experiments was conducted to measure the defective plaster statue of David.
Figure 11a,b correspond to a plaster sculpture with defective parts and the depth map in a mesh plot. The defective part creates a high contrast with its surroundings. The results show that the method combined with the Hilbert transform proposed in this study can measure the complex surfaces gracefully. Further, in order to better see the edge artefacts caused by the effects of the defects, a 3D point cloud was used for the presentation of the David sculpture, as shown in Figure 11c,d. Figure 11d shows the results of the uncompensated reconstruction. The point cloud at the edge is obviously sunken due to the influence of artefacts. The results of the reconstruction after compensation by the proposed method are shown in Figure 11d, which shows that the influence of edge artefacts is greatly suppressed. This set of experiments shows that the proposed method can also be used to compensate for the edge artefacts caused by color differences.
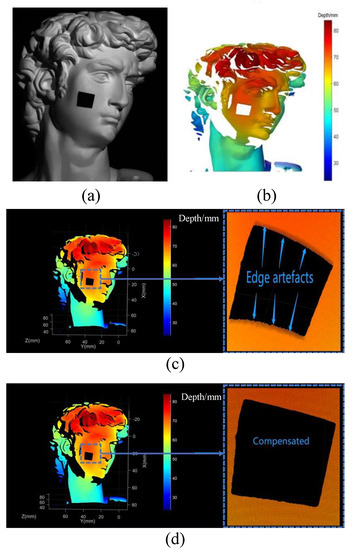
Figure 11.
Measurement results of plaster sculpture. (a) Defective plaster sculpture; (b) depth map of the defective plaster sculpture in mesh plot; (c) uncompensated 3D point cloud map; (d) compensated 3D point cloud map.
3.4. Reconstruction of Workpiece
To further validate the performance of the proposed method in the position of height change, the fourth experiment measured the oxide defect with height difference on a workpiece surface. Figure 12a,b correspond to a workpiece with defective parts and the depth map in a mesh plot. It can be clearly seen that the defective part creates a significant height difference. Further, it can be found that some parts of the defect are not continuous fractures due to edge artefacts in Figure 12c. Figure 12d shows the result of the uncompensated reconstruction of the defect, and the influence of edge artefacts is greatly suppressed. This set of experiments shows that the proposed method can also be used to compensate for the edge artefacts caused by height differences.
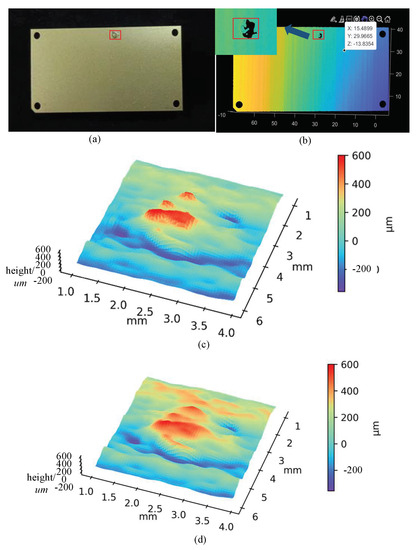
Figure 12.
Measurement results of workpiece surface defect. (a) Defect of rolled-in scale on workpiece surface; (b) depth map of the defective workpiece in mesh plot; (c) uncompensated 3D point cloud map; (d) compensated 3D point cloud map.
4. Discussion
Edge artefacts have been extensively studied in X-ray CT reconstruction. However, these methods cannot be used directly in fringe projection profilometry, so this study investigated this phenomenon using fringe projection profilometry and proposed a method to compensate for errors in the reconstruction results. This phenomenon has been studied to some extent, and targeted solutions are proposed in [12,13], and the edge artefact region was removed directly in [12], which has impacts on measurements that require this area information. Yue et al. [13] analyzed edge artefacts as a result of point expansion functions and perform error compensation in phase for planar objects to eliminate the effect of edge artefacts. Based on previous research, the propagation direction of the sinusoidal waveform in the fringe shows that the edge artefacts have different distributions of errors in different directions between the vertical and horizontal fringes. This property makes the effect of edge artefacts in the reconstruction results different. Therefore, this study compensates for errors caused by edge artefacts in reconstruction results based on the invariance of the object’s pose in space, and experiments have demonstrated the effectiveness of the proposed method. However, there are still improvements and clarifications that should be considered, including the following:
- (1)
- This study ignores the influence brought about by edge artefacts during system calibration. The phased elimination of artefacts in the circular calibration plate was introduced in [13], which can solve the error effects caused by edge artefacts to some extent. The method of fitting the phase of the calibration plate plane mentioned further improves the calibration accuracy [28]. These methods are all compensated based on phase results and cannot be applied correctly to objects with complex surfaces. Therefore, a combination method for error compensation for the reconstruction results can be further investigated.
- (2)
- Although the number of fringe patterns used by the phase-shifting method is reduced by using a Hilbert transform derived from the work in [20], twelve images still need to be projected, which is permissible for static measurements but not well-suited to dynamic measurements. Therefore, a combination of defocusing techniques in fringe projection profilometry can be employed to increase the projection rate for dynamic measurements of the object surface.
- (3)
- In addition, this study found that for some objects with highly reflective surfaces, this method still fails to detect areas affected by edge artefacts, so it is necessary to process such objects in a dynamic range before compensating for the error of edge artefacts [8,29].
5. Conclusions
This study introduced a novel phase correction technique, leveraging a multi-frequency phase heterodyne approach. By enhancing the adjacent phase error correction method, this research study deployed diverse correction strategies across varying regions. Incorporating a minimum phase error correction further mitigates noise errors and non-sinusoidal aberrations in the images. Experimental results validate the effectiveness of this method in eliminating jumping errors, demonstrating minimal deviation when applied to real-world images. However, the neighboring window size for the different images needs to be selected manually, which has caused some difficulties with the detection efficiency. Therefore, we will further improve the algorithm in future work so that it can adapt to different images.
This study investigated the edge artefact effect in PMP (caused by the camera’s point spread function). A method has been developed to compensate for the errors from the reconstruction results directly. The albedo of the object surface was employed to calculate the mask. A Hilbert transform is utilized to calculate the unwrapped phase. Compared with the three-frequency four-step heterodyne approach, the proposed method has the advantage of reducing the number of projected fringe patterns. The experimental results show that the proposed method can reduce errors caused by the edge artefacts. However, artefacts with non-rectangular edges still exist. Several facets have been investigated to lay the groundwork for subsequent studies, including the exploration of nonlinear correction methods.
Author Contributions
Conceptualization, B.G. and Y.X.; methodology, B.G. and C.K.; software, J.T.; validation, J.T. and C.K.; formal analysis, D.T.; investigation, C.Z.; resources, Y.X.; data curation, J.T.; writing—original draft preparation, B.G. and C.Z.; writing—review and editing, Y.X., D.T. and J.J.; visualization, J.J.; supervision, Y.X.; project administration, Y.X.; funding acquisition, Y.X. All authors have read and agreed to the published version of the manuscript.
Funding
This research was supported by the National Natural Science Foundation of China (NSFC) (61203172), the Sichuan Science and Technology Program (2023NSFSC0361, 2022002), and the Chengdu Science and Technology Program (2022-YF05-00837-SN).
Data Availability Statement
The datasets used and/or analyzed during the current study are available from the corresponding author upon reasonable request.
Conflicts of Interest
The authors declare no conflict of interest.
References
- Ma, R.; Li, J.; He, K.; Tang, T.; Zhang, Y.; Gao, X. Application of Moire Profilometry in Three-Dimensional Profile Reconstruction of Key Parts in Railway. Sensors 2022, 22, 2498. [Google Scholar] [CrossRef] [PubMed]
- Land, W.S.; Zhang, B.; Ziegert, J.; Davies, A. In-Situ Metrology System for Laser Powder Bed Fusion Additive Process. Procedia Manuf. 2015, 1, 393–403. [Google Scholar] [CrossRef]
- Zuo, C.; Tao, T.; Feng, S.; Huang, L.; Asundi, A.; Chen, Q. Micro Fourier Transform Profilometry (ΜFTP): 3D Imaging at 10,000 Fps. In Proceedings of the Conference on Lasers and Electro-Optics/Pacific Rim, Hong Kong, China, 29 July–3 August 2018; OSA: Hong Kong, China, 2018; p. Th2K.1. [Google Scholar]
- Fulvio, G.D.; Frontoni, E.; Mancini, A.; Zingaretti, P. Multi-Point Stereovision System for Contactless Dimensional Measurements. J Intell Robot Syst 2016, 81, 273–284. [Google Scholar] [CrossRef]
- Meza, J.; Contreras-Ortiz, S.H.; Romero, L.A.; Marrugo, A.G. Three-Dimensional Multimodal Medical Imaging System Based on Freehand Ultrasound and Structured Light. Opt. Eng. 2021, 60, 054106. [Google Scholar] [CrossRef]
- Chen, Q.; Han, M.; Wang, Y.; Chen, W. An Improved Circular Fringe Fourier Transform Profilometry. Sensors 2022, 22, 6048. [Google Scholar] [CrossRef]
- Laloum, D.; Printemps, T.; Lorut, F.; Bleuet, P. Correction of Absorption-Edge Artifacts in Polychromatic X-Ray Tomography in a Scanning Electron Microscope for 3D Microelectronics. Rev. Sci. Instrum. 2015, 86, 013703. [Google Scholar] [CrossRef]
- Zuo, C.; Huang, L.; Zhang, M.; Chen, Q.; Asundi, A. Temporal Phase Unwrapping Algorithms for Fringe Projection Profilometry: A Comparative Review. Opt. Lasers Eng. 2016, 85, 84–103. [Google Scholar] [CrossRef]
- Chen, C.; Gao, N.; Wang, X.; Zhang, Z. Adaptive Projection Intensity Adjustment for Avoiding Saturation in Three-Dimensional Shape Measurement. Opt. Commun. 2018, 410, 694–702. [Google Scholar] [CrossRef]
- Zhang, L.; Chen, Q.; Zuo, C.; Feng, S. High-Speed High Dynamic Range 3D Shape Measurement Based on Deep Learning. Opt. Lasers Eng. 2020, 134, 106245. [Google Scholar] [CrossRef]
- Zhang, W.; Li, W.; Yan, J.; Yu, L.; Pan, C. Adaptive Threshold Selection for Background Removal in Fringe Projection Profilometry. Opt. Lasers Eng. 2017, 90, 209–216. [Google Scholar] [CrossRef]
- Brakhage, P.; Heinze, M.; Notni, G.; Kowarschik, R. Influence of the Pixel Size of the Camera in 3D Measurements with Fringe Projection. In Optical Measurement Systems for Industrial Inspection III; Osten, W., Kujawinska, M., Creath, K., Eds.; SPIE: Munich, Germany, 2003; p. 478. [Google Scholar]
- Yue, H.; Dantanarayana, H.G.; Wu, Y.; Huntley, J.M. Reduction of Systematic Errors in Structured Light Metrology at Discontinuities in Surface Reflectivity. Opt. Lasers Eng. 2019, 112, 68–76. [Google Scholar] [CrossRef]
- Winiarski, B.; Gholinia, A.; Mingard, K.; Gee, M.; Thompson, G.; Withers, P.J. Correction of Artefacts Associated with Large Area EBSD. Ultramicroscopy 2021, 226, 113315. [Google Scholar] [CrossRef] [PubMed]
- Liu, Y.; Fu, Y.; Zhuan, Y.; Zhong, K.; Guan, B. High Dynamic Range Real-Time 3D Measurement Based on Fourier Transform Profilometry. Opt. Laser Technol. 2021, 138, 106833. [Google Scholar] [CrossRef]
- Zhang, H.; Zhang, Q.; Li, Y.; Liu, Y. High Speed 3D Shape Measurement with Temporal Fourier Transform Profilometry. Appl. Sci. 2019, 9, 4123. [Google Scholar] [CrossRef]
- Wang, Y.; Cai, J.; Liu, Y.; Chen, X.; Wang, Y. Motion-Induced Error Reduction for Phase-Shifting Profilometry with Phase Probability Equalization. Opt. Lasers Eng. 2022, 156, 107088. [Google Scholar] [CrossRef]
- Qian, J.; Tao, T.; Feng, S.; Chen, Q.; Zuo, C. Motion-Artifact-Free Dynamic 3D Shape Measurement with Hybrid Fourier-Transform Phase-Shifting Profilometry. Opt. Express 2019, 27, 2713. [Google Scholar] [CrossRef]
- Huang, P.S. Phase Error Compensation for a 3-D Shape Measurement System Based on the Phase-Shifting Method. Opt. Eng. 2007, 46, 063601. [Google Scholar] [CrossRef]
- Deng, J.; Li, J.; Feng, H.; Ding, S.; Xiao, Y.; Han, W.; Zeng, Z. Efficient Intensity-Based Fringe Projection Profilometry Method Resistant to Global Illumination. Opt. Express 2020, 28, 36346–36360. [Google Scholar] [CrossRef]
- Liao, Y.-H.; Xu, M.; Zhang, S. Digital Image Correlation Assisted Absolute Phase Unwrapping. Opt. Express 2022, 30, 33022. [Google Scholar] [CrossRef]
- Fei, L.; Jiaxin, L.; Junlin, L.; Chunqiao, H. Full-Frequency Phase Unwrapping Algorithm Based on Multi-Frequency Heterodyne Principle. Laser Optoelectron. Prog. 2019, 56, 011202. [Google Scholar] [CrossRef]
- Reich, C.; Ritter, R.; Thesing, J. White Light Heterodyne Principle for 3D-Measurement; Loffeld, O., Ed.; SPIE: Munich, Germany, 1997; pp. 236–244. [Google Scholar]
- Feng, S.; Zuo, C.; Zhang, L.; Tao, T.; Hu, Y.; Yin, W.; Qian, J.; Chen, Q. Calibration of Fringe Projection Profilometry: A Comparative Review. Opt. Lasers Eng. 2021, 143, 106622. [Google Scholar] [CrossRef]
- Zhang, Z. A Flexible New Technique for Camera Calibration. IEEE Trans. Pattern Anal. Mach. Intell. 2000, 22, 1330–1334. [Google Scholar] [CrossRef]
- Huang, P.S. Novel Method for Structured Light System Calibration. Opt. Eng. 2006, 45, 083601. [Google Scholar] [CrossRef]
- Zhang, S. Flexible and High-Accuracy Method for Uni-Directional Structured Light System Calibration. Opt. Lasers Eng. 2021, 143, 106637. [Google Scholar] [CrossRef]
- Takeda, M.; Mutoh, K. Fourier Transform Profilometry for the Automatic Measurement of 3-D Object Shapes. Appl. Opt. 1983, 22, 3977. [Google Scholar] [CrossRef]
- Wang, J.; Su, R.; Leach, R.; Lu, W.; Zhou, L.; Jiang, X. Resolution Enhancement for Topography Measurement of High-Dynamic-Range Surfaces via Image Fusion. Opt. Express 2018, 26, 34805–34819. [Google Scholar] [CrossRef] [PubMed]
Disclaimer/Publisher’s Note: The statements, opinions and data contained in all publications are solely those of the individual author(s) and contributor(s) and not of MDPI and/or the editor(s). MDPI and/or the editor(s) disclaim responsibility for any injury to people or property resulting from any ideas, methods, instructions or products referred to in the content. |
© 2023 by the authors. Licensee MDPI, Basel, Switzerland. This article is an open access article distributed under the terms and conditions of the Creative Commons Attribution (CC BY) license (https://creativecommons.org/licenses/by/4.0/).