Article

The Role of the Photon Counting Loss Effect in Time-Resolved Measurements of Fluorescence Anisotropy

by
Daniil A. Gvozdev
*,
Alexey N. Semenov
,
Georgy V. Tsoraev
and
Eugene G. Maksimov
Faculty of Biology, Lomonosov Moscow State University, 119991 Moscow, Russia
*
Author to whom correspondence should be addressed.
Photonics 2023, 10(6), 681; https://doi.org/10.3390/photonics10060681
Submission received: 18 April 2023 / Revised: 17 May 2023 / Accepted: 8 June 2023 / Published: 12 June 2023

Abstract

:
Determining the rate of rotation of molecules from their fluorescence anisotropy decay curves is a powerful method for studying molecular systems in biological applications. The single photon count detection systems used for this have a nonlinear dependence of the photon counting rate on the fluorescence intensity flux (photon counting loss effect), which can lead to a number of artifacts. Using metal complexes of phthalocyanines as a test sample, we have shown that such a nonlinearity can cause distortions in the determination of the fluorescence anisotropy lifetime and the asymptotic fluorescence anisotropy. We also assessed the dependence of the described phenomena on temperature and estimated the manifestations of the photon counting loss effect in the case of photobleaching of the fluorophores.

1. Introduction

Fluorescence anisotropy is a property of many fluorophores that allows for the extraction of a huge amount of data on the structural peculiarities of the studied object. The nature of the fluorescence anisotropy is governed by the mechanism by which transition moments in a molecule (both absorption and fluorescence) have a certain direction associated with a shift in the electron density when the photon quantum is absorbed [1]. Thus, the molecule has different sensitivity to light of different polarizations. When the sample is illuminated using vertically polarized light, the incident irradiation will be absorbed only by molecules that have a non-zero vertical projection of the absorption transition moment (principle of photoselection [2]). In solution, the molecules are randomly oriented, which means that vertically ( I V ) and horizontally ( I H ) polarized components can be detected in the fluorescence signal originated from the sample. To register these components, a polarization filter is placed in front of the detector (the so-called emission polarizer) either in vertical or horizontal orientation. The fluorescence anisotropy r of the fluorophore in this case is calculated by the formula
r = ( I V I H ) / ( I V + 2 I H )
In the general case, the detection system has different sensitivity to light with different polarization (in particular, due to the difference in the transmission efficiency of the monochromator), which should therefore be taken into account when calculating the r value using Formula (1). To do this, the sample is illuminated with horizontally polarized light, which, in the technique of measuring fluorescence at an angle of 90° with respect to the excitation axis, means that the intensity of the polarized fluorescence components must be the same. Then, the difference in the measured values I V x and I H x is unambiguously interpreted as an instrumental factor G = I V x / I H x and Formula (1) is modified in
r = ( I V G I H ) / ( I V + 2 G I H ) .
If the absorption and fluorescence transition moments of a fluorophore are colinear, then for a random distribution of molecules in the solution relative to the vertical polarization axis of the exciting light, the theoretical calculation of the fluorescence anisotropy gives a fundamental value of 0.4 [3]. However, for many fluorophores, the absorption and fluorescence transition moments are displaced by a certain angle, so that the measured fluorescence anisotropy is less than 0.4. Moreover, during an excited state, a molecule in a liquid solution has time to change orientation due to rotational diffusion, so the anisotropy additionally decreases. Having the fluorescence decay of the sample at different positions of the polarizer I V ( t ) and I H ( t ) , it is possible (using Formula (2)) to reconstruct the fluorescence anisotropy decay curve:
r ( t ) = ( I V ( t ) G I H ( t ) ) / ( I V ( t ) + 2 G I H ( t ) ) ,
r t = r o e t / θ .
Here, the characteristic anisotropy lifetime θ means the correlation time of molecular rotation, and r o is the initial fluorescence anisotropy (in the absence of rotational diffusion). This method is widely used to estimate the microviscosity of a medium [4,5] or local temperature [6,7] using a fluorophore probe, to study the interaction of biomolecules [8,9], the conformational mobility of protein molecules [10,11], etc. The presence of several time components in the decay kinetics of fluorescence anisotropy may indicate several types of fluorophore mobility or several variants of fluorophore localization in complex systems.
The time-correlated single photon counting (TCSPC) technique is widely used to record fluorescence decay kinetics [12,13]. The method includes registering the arrival time of only one photon in response to the excitation with a single laser pulse. The system is optimized to minimize the probability of two or more photons hitting the detector during a single laser flash. However, in the process of measurement, an increase in the number of arriving photons (counting rate) can be observed. In particular, the probability of a significant increase in the number of detected photons correlates with an increase in the concentration of the fluorophore, its fluorescence quantum yield, or the intensity of the exciting light. Ultimately, this leads to a decrease in the efficiency of photon counting, which is referred to in the literature as the photon counting loss (PCL) effect [14]. There are two reasons for this phenomenon. The first one is the photon loss within the same signal period (pile-up effect [15]), since the detection system cannot register any other photons that reach the detector after the first photon. The second one is the photon loss within the signal processing time: after detecting the first photon, the detection system goes into a state where its operation is impossible. The duration of this state is determined by the so-called detection “dead time” [16], which usually lasts tens or hundreds of ns. At high frequencies of pulsed excitation, this means that the detection system, after operation, is inactive for several cycles of excitation of the sample. Without proper control and optimization of the excitation and detection systems, the PCL effect may significantly alter the experimental results.
In this work, we demonstrate that the PCL effect has a significant influence on the parameters of fluorescence anisotropy decay kinetics using an aqueous solution of phthalocyanine (Pc) dye as an example. The obtained results will be useful for optimizing the method for recording time-resolved anisotropy in order to increase the accuracy of the method.

2. Materials and Methods

Zinc(II) and aluminum(III) octacarboxyphthalocyanines (ZnPc8 and AlPc8, respectively) were kindly provided by Prof. E.A. Lukyanets from the NIOPIK State Research Center (Russia) in the acid form and titrated with NaOH in an aqueous solution until the complete formation of the salt form of Pc.
Absorption spectra were recorded using a MayaPro spectrophotometer (Ocean Optics, Dunedin, FL, USA) and a stabilized SLS201L tungsten lamp (Thorlabs, Newton, NJ, USA). Steady-state fluorescence spectra were recorded using a FLAME CCD spectrometer (Ocean Optics, USA). Spectrophotometric measurements were performed in a thermostated cuvette holder Qpod 2e (Quantum Northwest, Liberty Lake, WA, USA) at 25 °C with magnetic stirring (300 rpm). MilliQ distilled water (Synergy Merck Millipore, Darmstadt, Germany) was used as a solvent. The measurements were carried out in a 1 mL plastic cuvette.
Fluorescence anisotropy experiments were carried out on a standard fluorescence setup with 90° excitation (L-configuration, Scheme 1). A PLS-450/660 LED laser (InTop, St. Petersburg, Russia) was used to excite Pc fluorescence at a wavelength of 660 nm (pulse duration 25 ps, pulse repetition rate 10/25/50 MHz). We used a collimator F230FC-B (Thorlabs, USA) to create a parallel beam with a diameter of 0.8 mm. The excitation light was polarized using a broadband polarization filter (Thorlabs, USA). The power of the laser beam was varied using neutral optical filters and a laser control unit. Fluorescence anisotropy in the excitation wavelength range of 620–680 nm was studied using a TOPOL-1050-C parametric femtosecond generator with a TEMA-150 pump laser (Avesta Project Ltd., Moscow, Russia): pulse duration 150 fs, pulse repetition rate 80 MHz. The light beam at output 2 (idler) was directed to the second harmonic generator ASG-O-1250-AT (Avesta Project, Russia). In this case, the excitation light had a horizontal polarization, which was turned into a vertical one using a combination of two Fresnel rhombs.
The fluorescence decay kinetics of Pc with picosecond time resolution were recorded using a SimpleTau-140 setup (Becker & Hickl, Berlin, Germany). Light collection was realized with biconvex lenses 1 and 2 (f = 50 mm) and condensers 3 and 4 of the monochromator (f = 18 mm). The fluorescence signal passed through an ML 44 monochromator with entrance and exit slits of 1 × 3 mm (Solar laser systems, Belarus) and was recorded using a HPM-100-40 hybrid detector (Becker & Hickl, Germany) with the emission polarizer in the vertical and horizontal positions. In TCSPC mode, fluorescence intensity was calculated as the area under the decay curve. The emission polarizer was rotated using a motorized mount (K10CR1/M, Thorlabs, USA), and the rotation angle was set using the APT software (Thorlabs, USA).
SPCImage (Becker & Hickl, Germany) software package was used for analysis of Pc fluorescence decay curves to estimate the fluorescence lifetimes (instrumental response function was measured (Appendix A, Figure A1) and considered in the analysis), and then we exported the data to OriginPro 9.1 (OriginLab Corporation, Northampton, MA, USA) for fluorescence anisotropy decay reconstruction and approximation procedures. Data acquisition time was chosen individually according to the principle that we do not reach more than 10,000 counts at the maximum of the fluorescence decay curve in the case of a horizontal position of the emission polarizer. This acquisition time was fixed and used for measurement in a configuration with a vertical position of the emission polarizer. Each experiment was repeated in triplicate.

3. Results and Discussion

3.1. Estimating the Photon Counting Loss Effect in the Detection Set-Up System

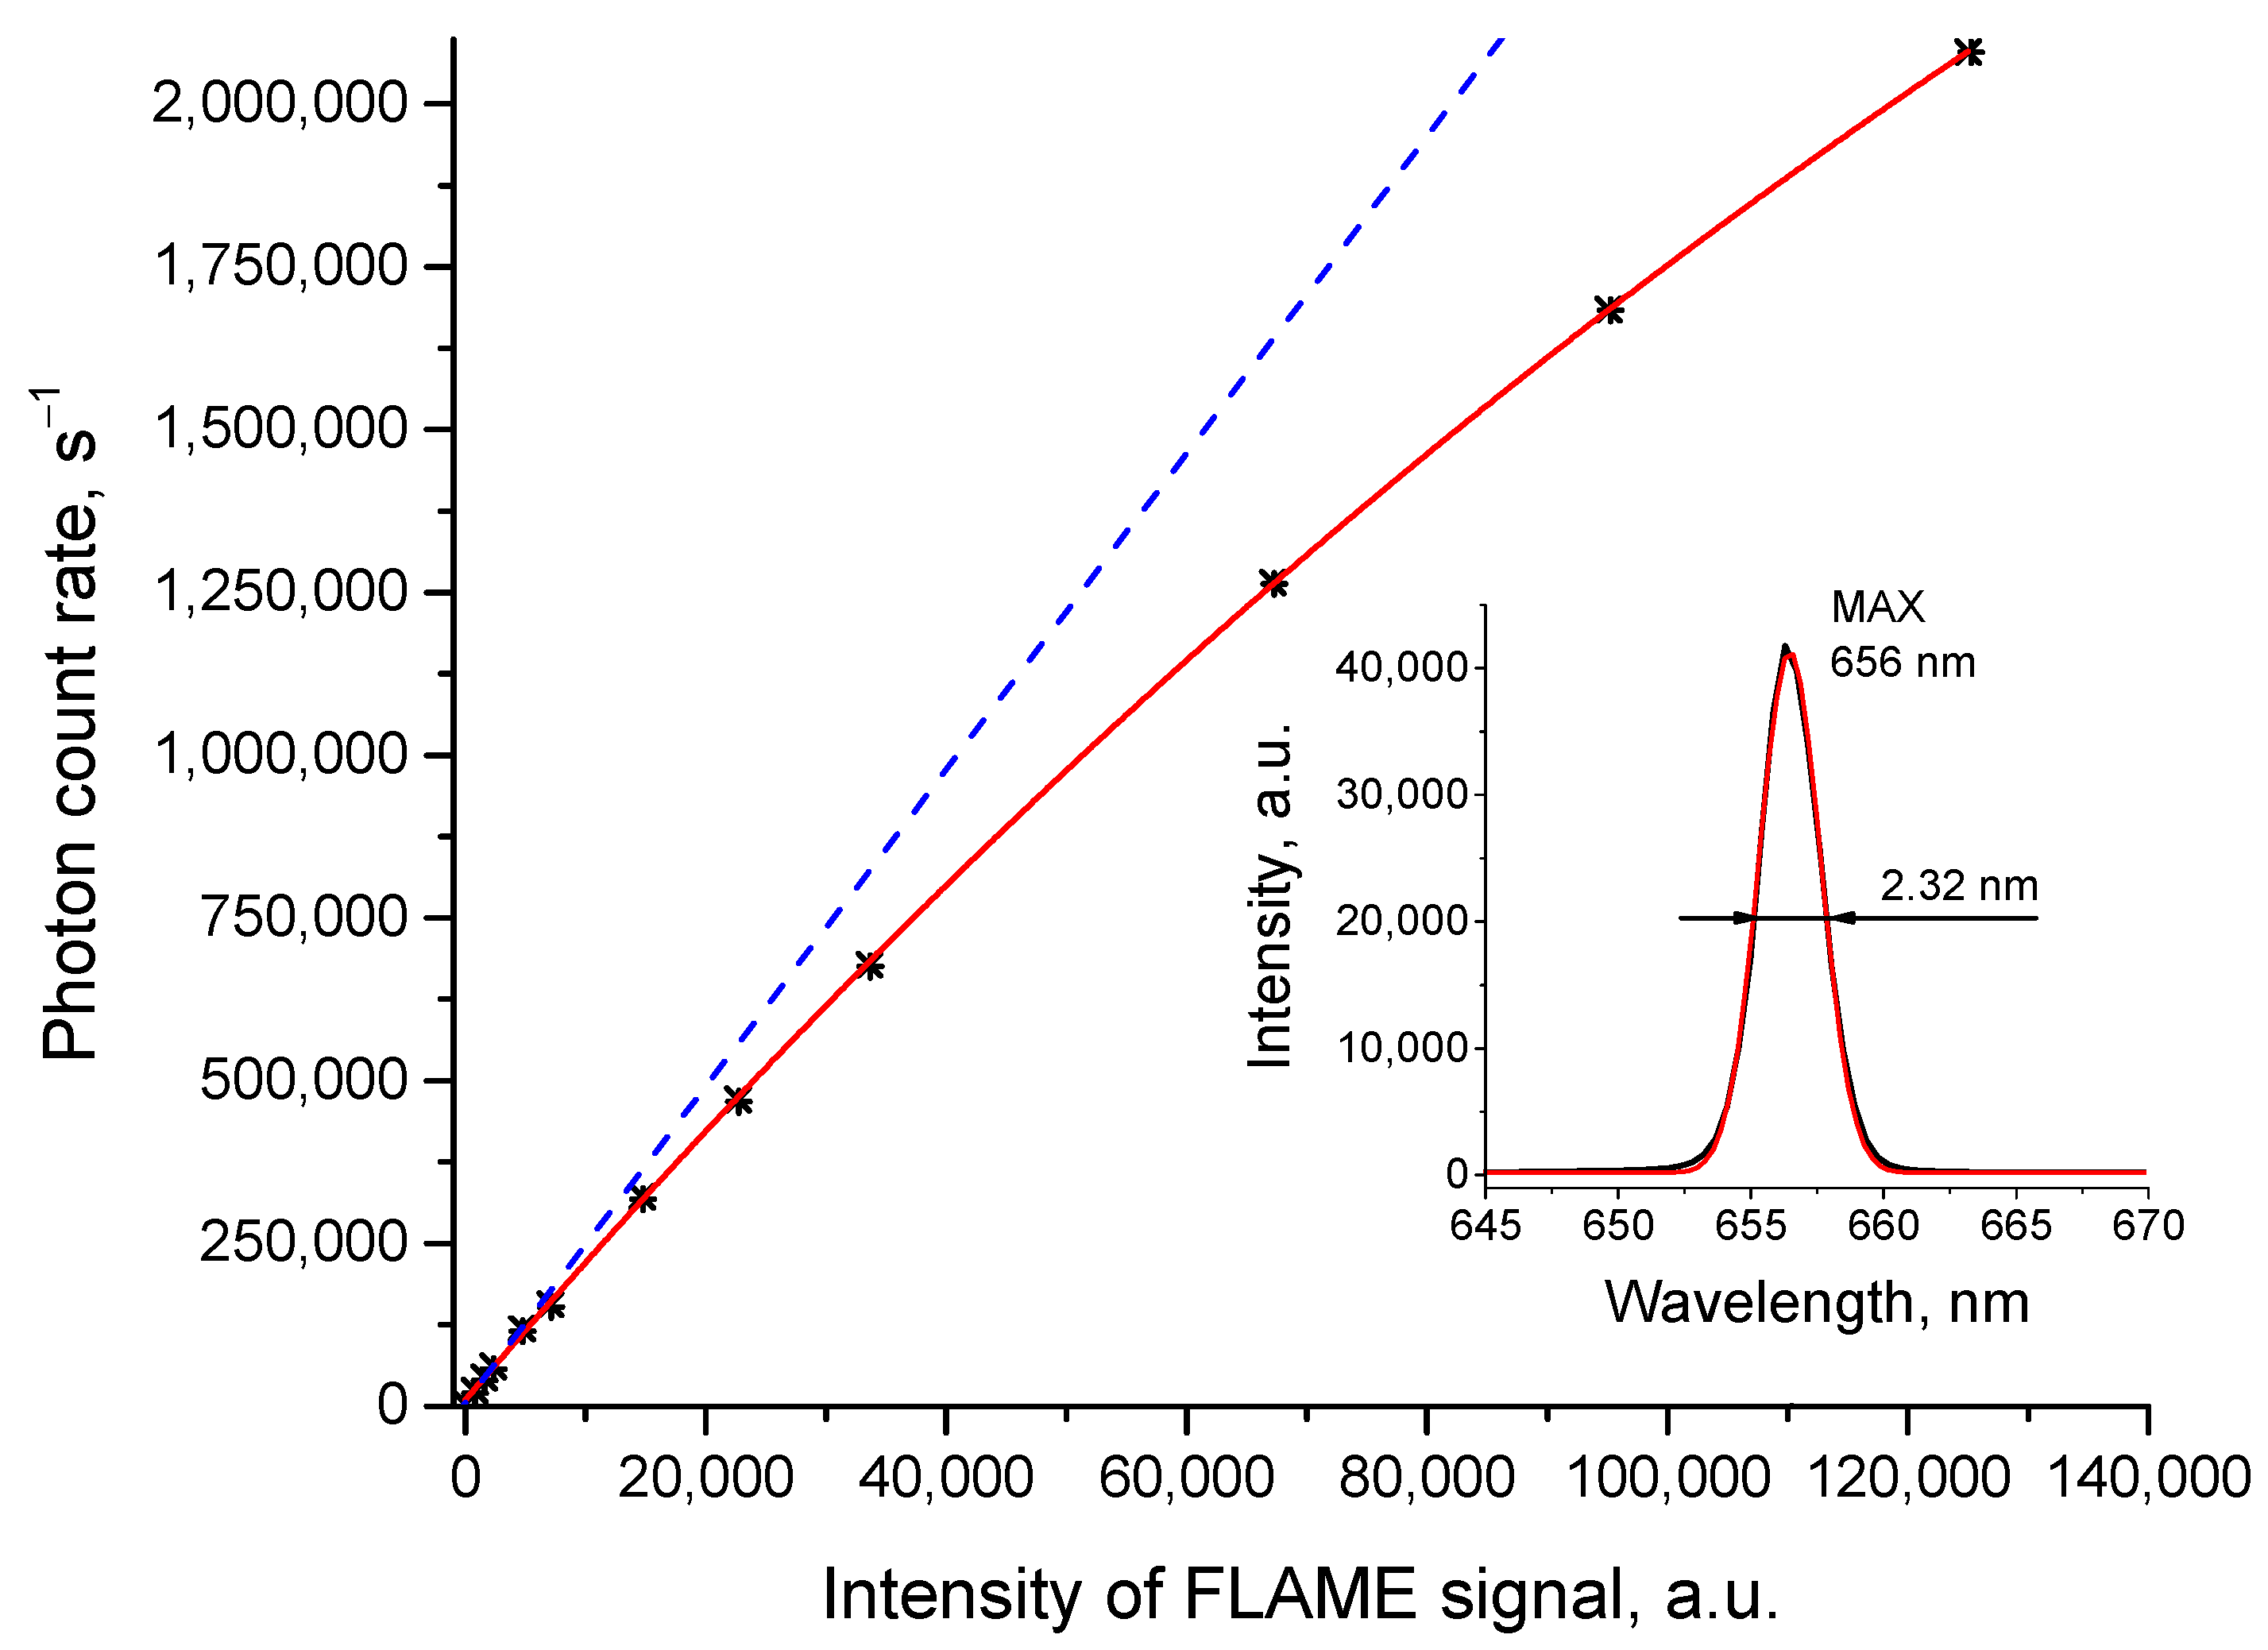
First, we estimated the PCL effect in a system with a fixed concentration of the AlPc8 fluorophore depending on the intensity of the exciting light. The results are shown in Figure 1. Here, the intensity of the exciting light (PLS-450/660 picosecond laser) was changed by a combination of neutral optical filters and measured by steady-state fluorimetry. The AlPc8 fluorescence decay kinetics were recorded by TCSPC to calculate the photon count rate.
Figure 1 demonstrates that the dependence of the photon count rate on the intensity of the exciting light is nonlinear. The PCL effect occurs even at relatively low photon count rates, up to 750,000 counts per second. We took the photon count rate of 100,000 s−1 as the conditional upper limit of the range, where the PCL effect can be considered minimal.

3.2. Selection of Optimal Conditions for Detecting Polarized Fluorescence of Phthalocyanines

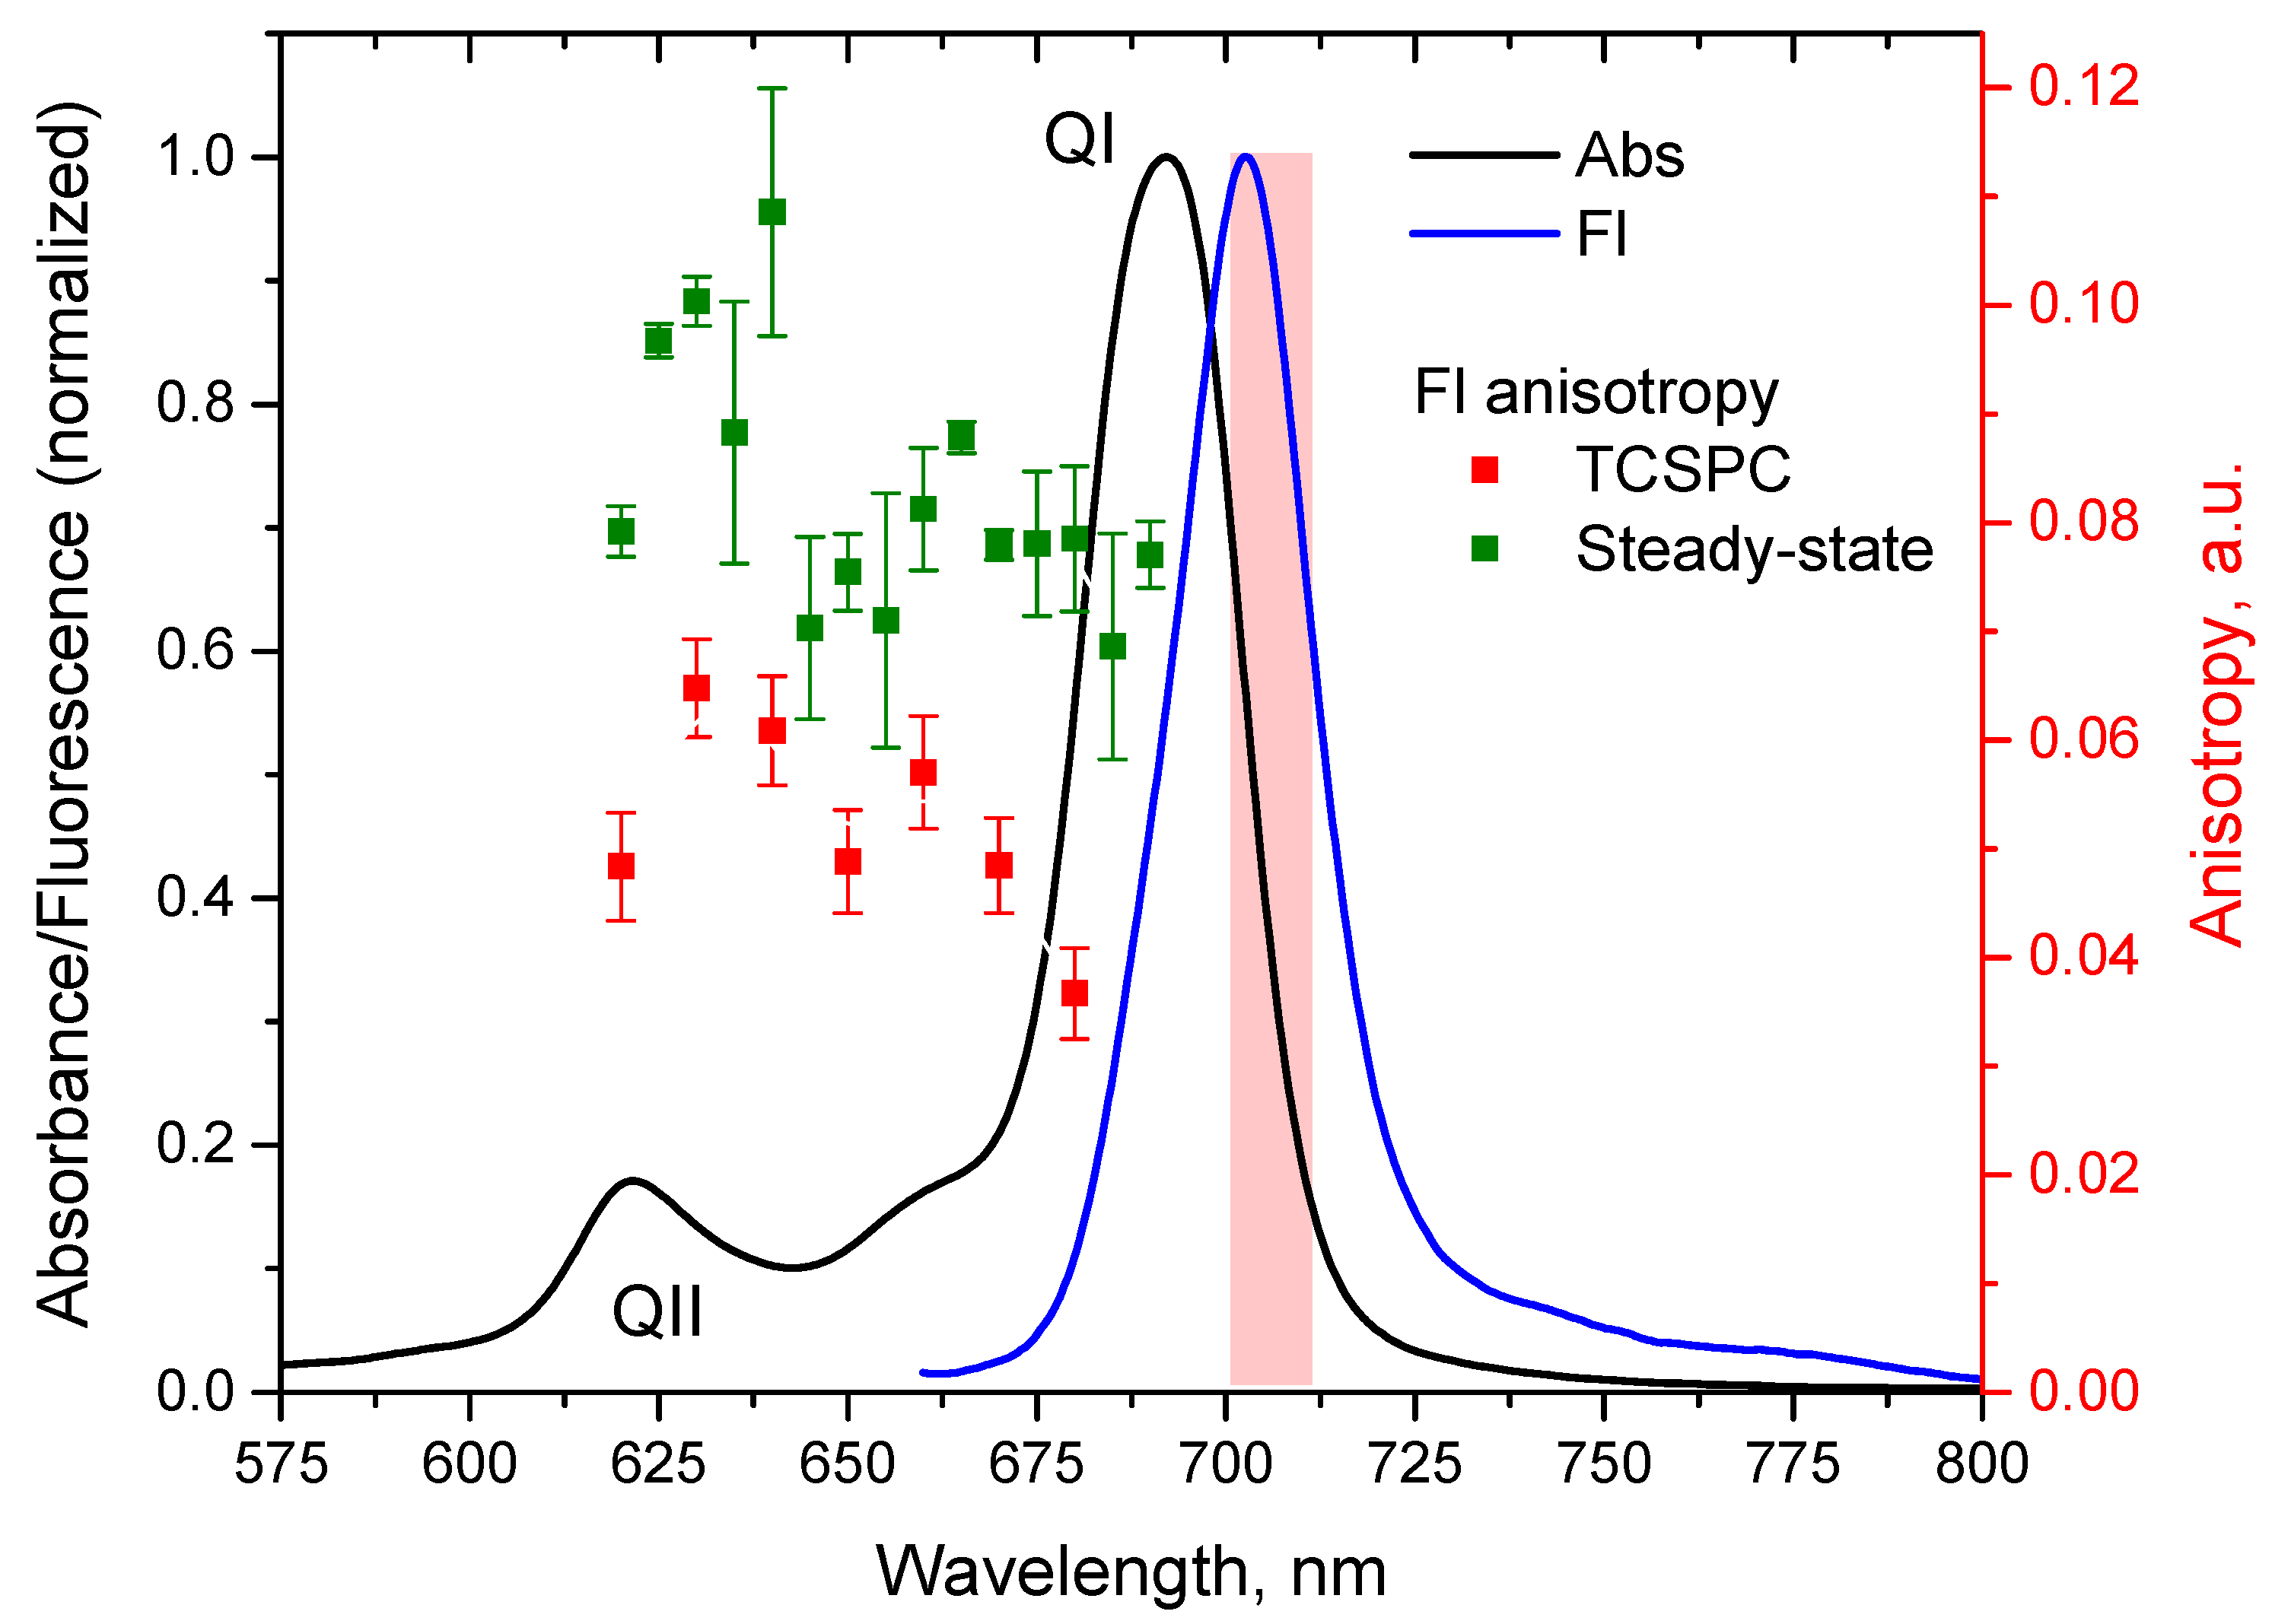
Generally, the fluorescence anisotropy of a fluorophore can depend on the excitation wavelength [17]. We investigated this dependence in order to find the optimal conditions for recording the fluorescence anisotropy decays. To do this, AlPc8 fluorescence was excited using a TOPOL-1050-C femtosecond laser by varying the excitation wavelength λexc in the region of the QI and QII bands of the Pc absorption spectrum (Figure 2). The value of r o was determined in two ways. The first one utilized TCSPC and consisted of recording the decay of Pc polarized fluorescence and calculating r o a using Formulas (3) and (4). The second method consisted of recording steady-state spectra of polarized fluorescence and calculating the fluorescence anisotropy r using Formula (2). In this experiment, the value of r is much smaller than the value of r o due to the rotational diffusion of the Pc molecules. Thus, the value of steady-state fluorescence anisotropy r o b was restored according to the Perrin equation:
r o b / r = 1 + τ / θ ,
where τ is the lifetime of the Pc excited state and θ is the rotational correlation time; both do not depend on the excitation wavelength and are 2.69 ± 0.01 ns and 260 ± 19 ps for AlPc8, respectively.
Figure 2 shows that the r o b values obtained by steady-state fluorimetry are greater than the r o a values obtained using the TCSPC method. It is known that the actual value of anisotropy ( r o a ) at the initial moment of decay t = 0 (the so-called limiting anisotropy), is less than the theoretical value (i.e., r o b ), because it strongly depends on the fitting quality of the anisotropy decay curve in the area of the initial time period of the kinetic (selected left limit of the fitting range) [18]. The obtained results demonstrated in Figure 2 show small changes in the initial anisotropy, which was found to be in the range of 0.08–0.1 within the studied wavelength range. It corresponds with the literature data, reporting symmetrically substituted metal complexes of the porphine series, which are planar oscillators, and its fundamental anisotropy cannot exceed 1/7 ≈ 0.14 [19,20]. For further measurements, we used a picosecond laser with a fixed fluorescence excitation wavelength at 660 nm.

3.3. Influence of the PCL Effect on the Decay of Pc Fluorescence Anisotropy

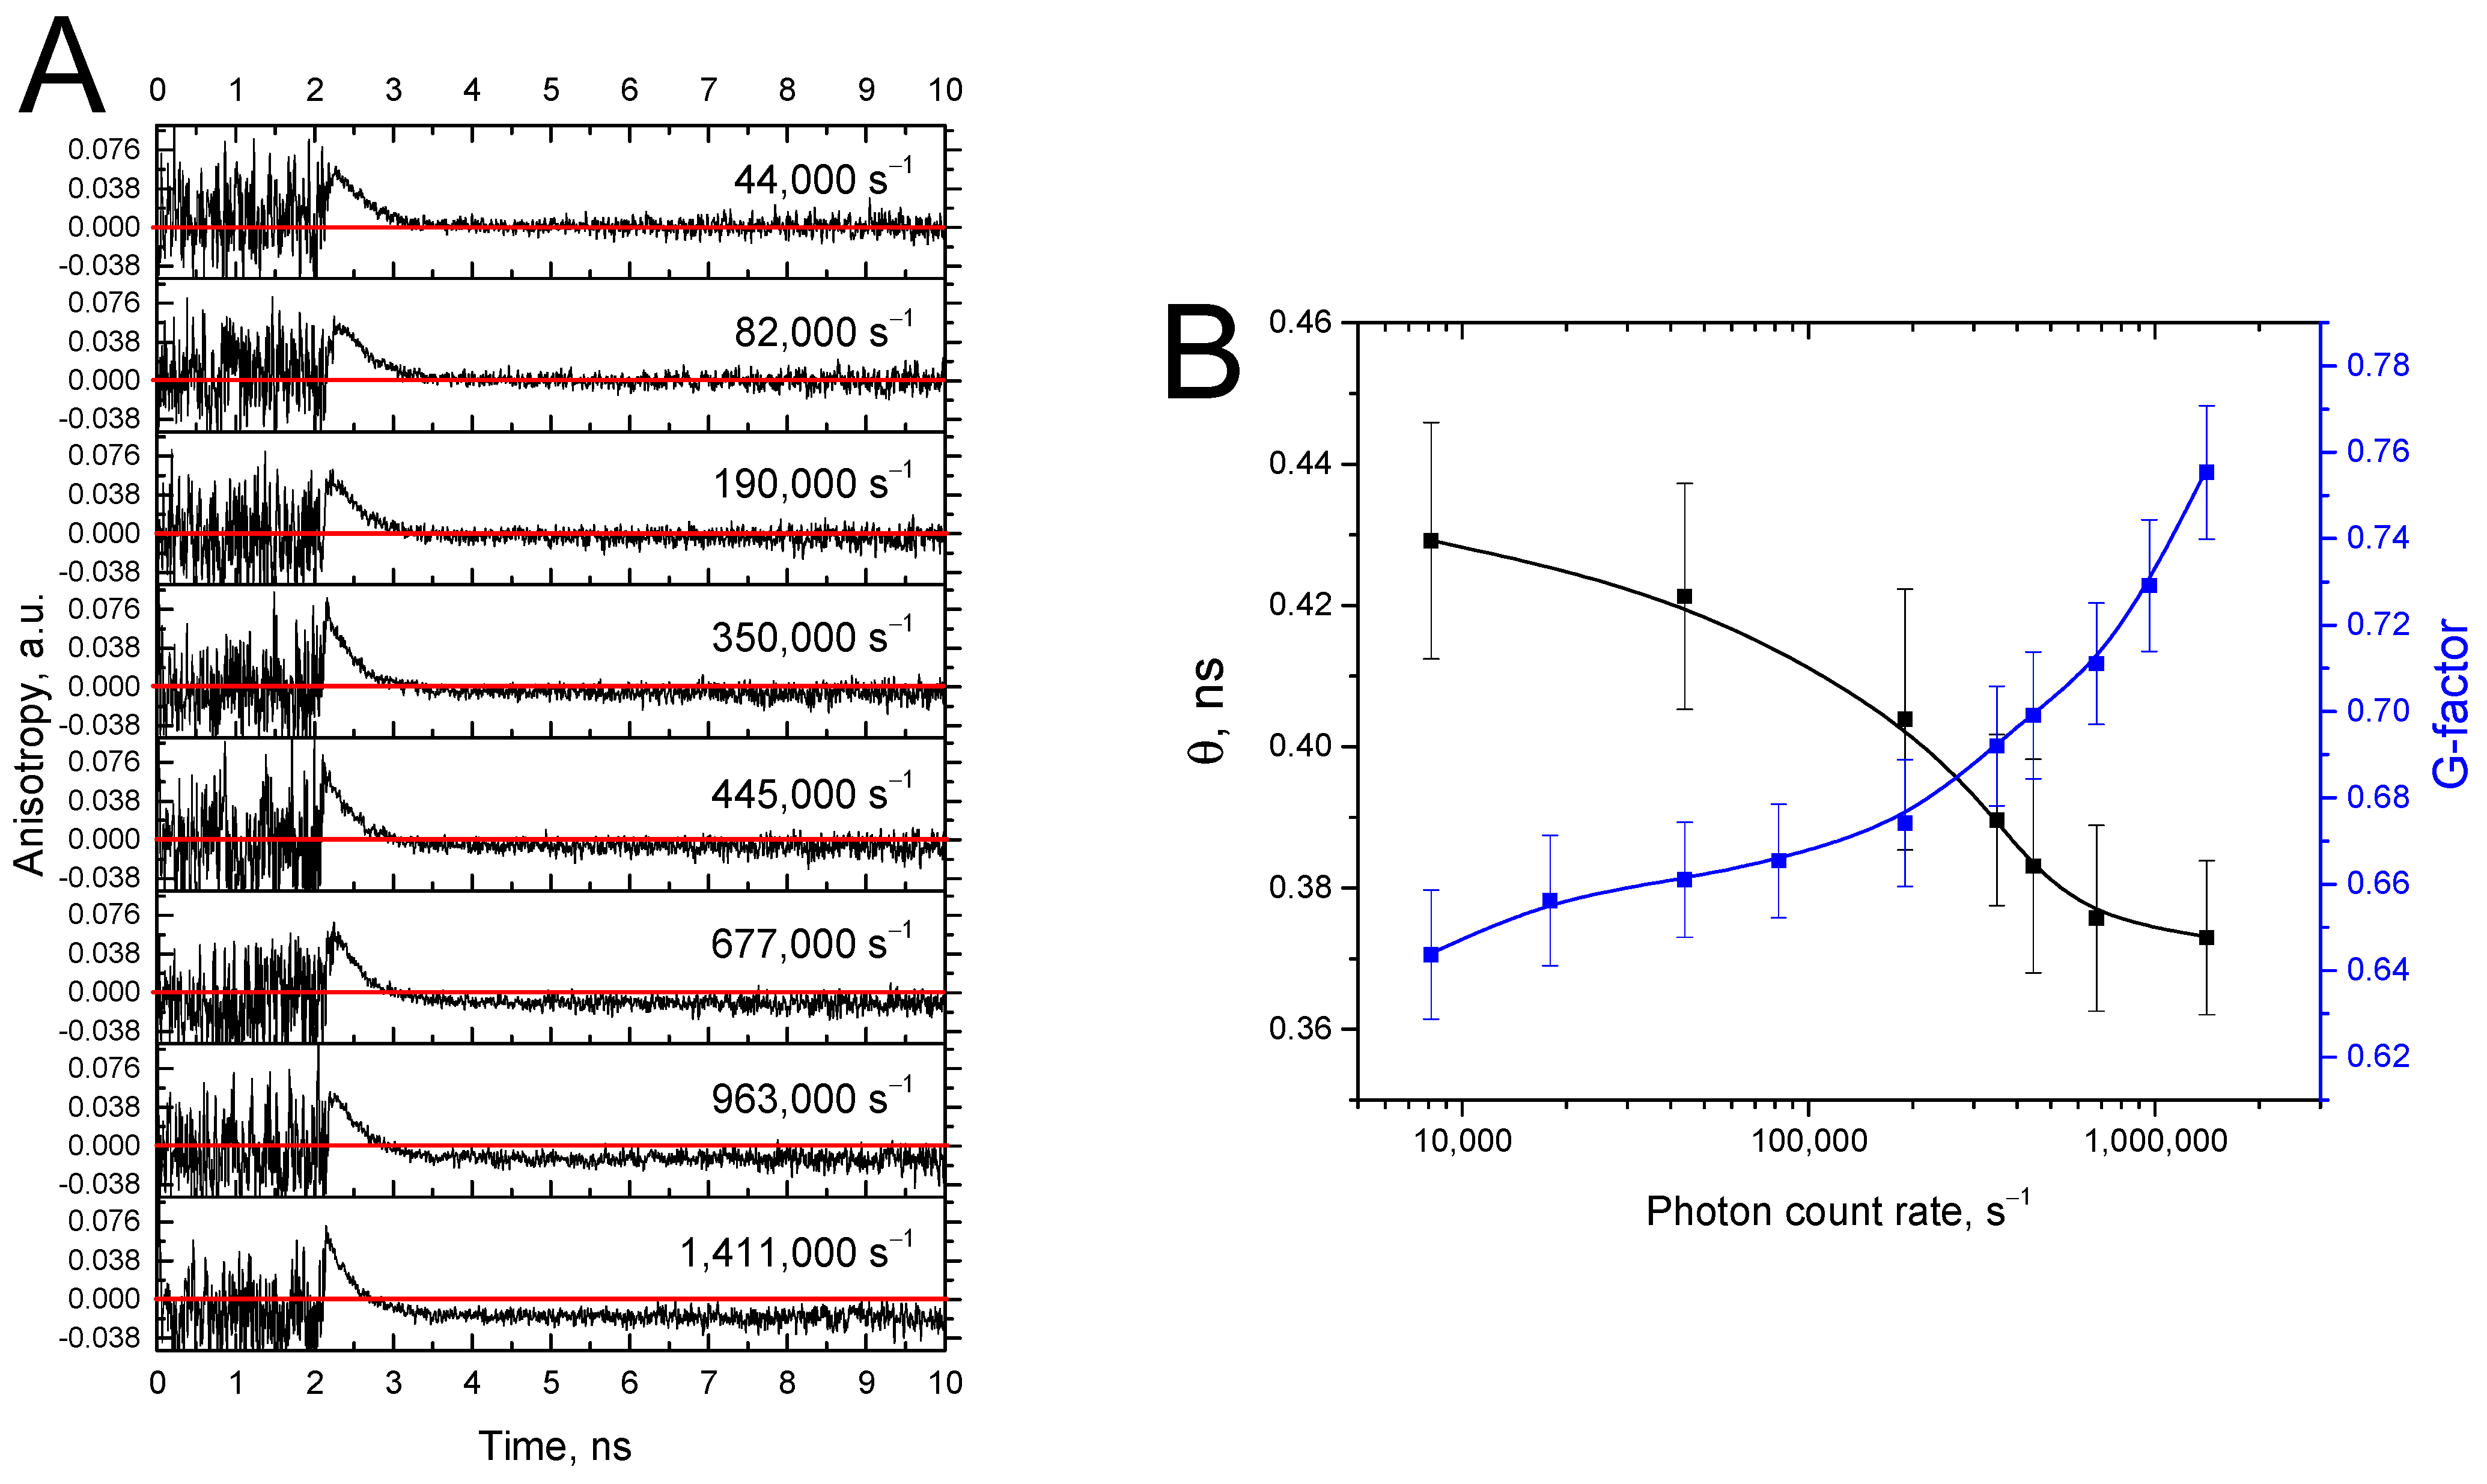
Under the identified optimal conditions, we studied the influence of the signal intensity arriving at the TCSPC detector on the G-factor and the approximation parameters of the Pc fluorescence anisotropy decay curve (Figure 3A). Here, we used equimolar Pc solutions and changed the incident light power. Figure 3B shows that the value of the G-factor increases with an increase in the photon counting rate. We propose the following mechanism for this dependence. As the count rate is increased, the detector starts saturating more rapidly when a horizontally polarized component is measured. As a result, it leads to a decrease in the denominator in the formula G = I V x / I H x and an increase in the value of the G factor. Such behavior occurs due to the diffraction grating of the monochromator, which reflects horizontally polarized light more efficiently. When the monochromator was replaced by a light filter that transmits light in the wavelength range of 730 nm (FWHM 10 nm), the G-factor was no more than 1.025.
It is clear from Figure 3B that the θ value statistically decreases (T-test, p < 0.05) with the increase in the G-factor when calculating the anisotropy decay curves using Formula (3). To determine the reason for the dependence of the rotational correlation time on the intensity of the exciting light, we used a constant and low concentration of Pc, where there are no aggregates or other concentration effects. The mechanism of the decrease in the θ value can be related to the fact that, as the G-factor increases, the contribution of the subtracted intensity G I H t in the numerator of Formula (3) increases. In this case, the reconstructed fluorescence anisotropy decay curve should have a larger slope. Thus, the PCL effect can distort the results of the time-resolved fluorescence anisotropy method. The distortion concerns not only the parameter of the rotational correlation time, but also the plateau reached by the fluorescence anisotropy decay curve (the so-called anisotropy at infinity, or the asymptotic anisotropy r ). Figure 3A shows the calculated decay curves of AlPc8 fluorescence anisotropy at different photon count rates. It can be seen that the asymptotic anisotropy decreases with increasing photon counting rates. An aqueous solution of Pc is a simple system from the point of view that Pcs, used in the experiment, do not have several types of fluorescent forms (indeed, AlPc8 and ZnPc8 fluorescence decay can be described by a monoexponential function, which is typical for planar molecules of the porphine series [20]). Additionally, there are no different types of microenvironments for Pc molecules where their rotation rate could differ or hindered rotation effects would be observed. In this case, we suppose that the asymptotic fluorescence anisotropy should strictly be equal to zero. Therefore, we conclude that the value of r changes due to the dependence of the G-factor on the PCL effect.
The fact that the asymptotic anisotropy differs from zero may indicate that the rotation of molecules can be hindered under certain conditions. For example, such behavior can be observed in fluorescent probes in the lipid bilayer [21,22] or in the case of covalently attached fluorophores [23], when there is an energy barrier that prevents the free rotation of the molecule in all directions. Thus, the TCSPC study of the properties of a fluorophore capable of performing various types of rotational motion at high photon counting rates can lead to nonzero values of r and incorrect conclusions regarding the freedom of rotation of the fluorophore molecule in complex systems, particularly inadequate values of the membrane microviscosity. In the case of fluorophores linked to biomolecules, anisotropy should be measured in solutions with controlled properties of fluorophores, allowing for zero values of asymptotic anisotropy. In the case of lipophilic fluorophores, which fluoresce poorly in aqueous solution, one can separate the effect of PCL from hindered rotation by changing the temperature [21]. At a constant low photon count rate, the asymptotic anisotropy r should approach zero with increasing temperature if there are indeed factors limiting the free rotation.

3.4. Temperature Dependence of the PCL Effect

If the fluorescence quantum yield of a fluorophore strongly depends on temperature, there is a risk of obtaining distorted fluorescence anisotropy decay at a constant high photon counting rate. Indeed, when using the method of time-resolved fluorescence anisotropy to estimate the rotation rate of molecules, a difficulty may arise: as the temperature increases, not only does the rotation rate of the molecule increase, but the fluorescence quantum yield also decreases. In turn, this will lead to a decrease in the photon counting rate and the contribution of the PCL effect. This means that in order to optimize the experimental conditions of TCSPC measurements of the temperature dependence of the fluorescence anisotropy, characterizing the role of PCL in the temperature-driven changes in the parameters of Pc fluorescence is required.
We recorded the decay of the AlPc8 polarized fluorescence at different temperatures in the range of 15–35 °C, fixing the photon counting rate at 15 °C at the level of 200,000 s−1. Under such conditions, we did not find significant temperature changes in the G-factor and approximation parameters of the decay curves of the AlPc8 fluorescence anisotropy (Table 1). So, the decrease in the Pc fluorescence intensity (Table 1, second column) with increasing temperature turned out to be insufficiently significant for the manifestation of the PCL effect. Therefore, we can assume that the change in the rotational correlation times obtained in this experiment is not an artifact and fully reflects the real system.

3.5. Effect of Fluorophore Photobleaching on the Pc Fluorescence Anisotropy Decay and the PCL Effect

The decay curve of the fluorescence anisotropy reconstructed from Formula (3) can be distorted in situations when the fluorophore concentration decreases during the measurement (for example, as a result of photobleaching). Although the fluorescence lifetime does not change during photobleaching (only undamaged molecules fluoresce), the fluorescence intensity and the total number of photons reaching the TCSPC detector decrease. Accordingly, the contribution of the PCL effect should decrease. The photobleaching rate can be reduced by lowering the intensity of the excitation light; in this case, the photon counting rate will also decrease. Although this will reduce the PLC effect, we will need to increase the signal collection time; at a photon counting rate of 10,000 s−1, a collection time of 5–10 min is needed to obtain the fluorescence anisotropy decay with an acceptable signal-to-noise ratio. Since photobleaching cannot be completely eliminated, its influence at long signal collection times can be significant.
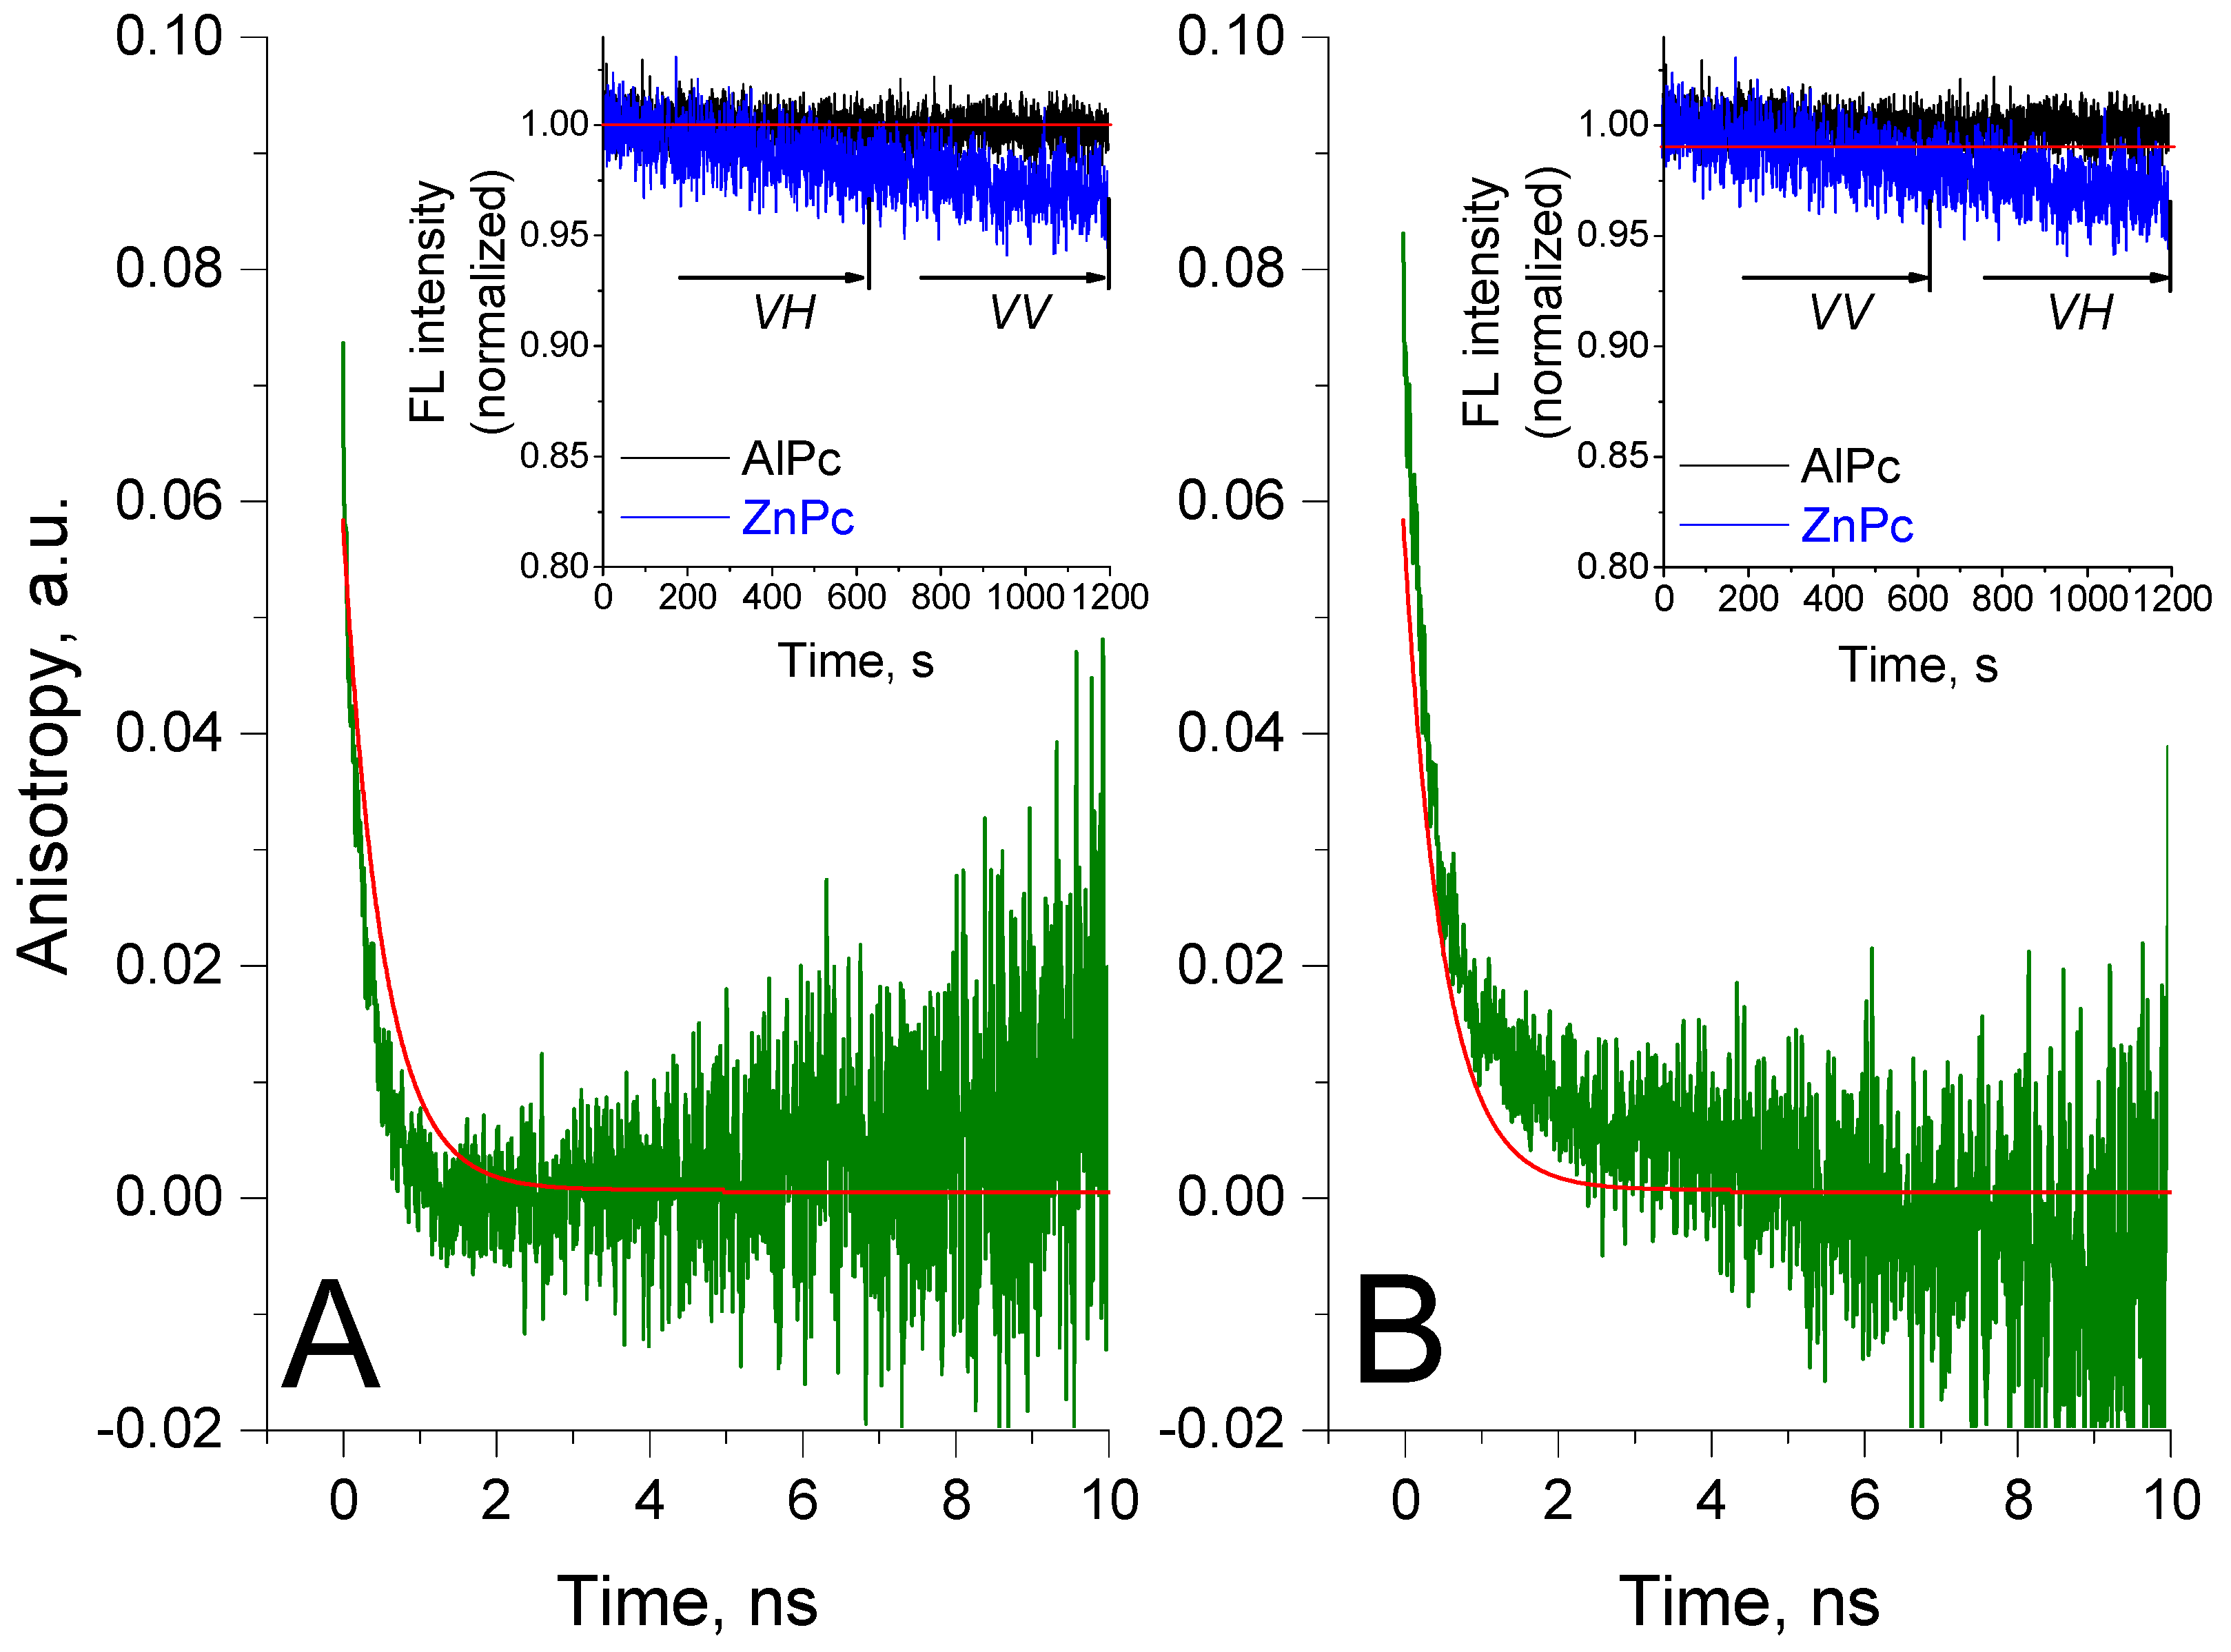
In the case of intense photobleaching, possible artifacts can be enhanced if polarized fluorescence I V ( t ) and I H ( t ) are detected one after another sequentially at different positions of the emission polarizer. In the inset of Figure 4, the change in the fluorescence intensity of AlPc8 and ZnPc8 is shown. Previously, we revealed that ZnPc8 is significantly less resistant to photobleaching than AlPc8 [24]. It can be seen that AlPc8 is photostable when a 1 μM solution is irradiated with monochromatic light (660 nm) in picosecond mode (50 MHz) for 20 min, while ZnPc8 is photobleached by ~4% under the same conditions. This value turns out to be significant in reconstructing the decay curve of ZnPc8 fluorescence anisotropy.
Figure 4 shows anisotropy decay curves measured at different detection sequences: sequence I H ( t ) I V ( t ) (the position of the emission polarizer changes from horizontal (h) to vertical (v); Figure 4A); and sequence I V ( t ) I H ( t ) (the position of the emission polarizer changes from vertical (v) to horizontal (h); Figure 4B). In both cases, two time components were found in the ZnPc8 fluorescence anisotropy decay. We suppose that the slow component here is an artifact, since the ZnPc8 fluorescence anisotropy decay is described by a single exponent if the experiment is carried out carefully, taking bleaching into account (Figure 4, red curve). In the case of the measurement sequence I H ( t )  →  I V ( t ) (Figure 4A), the shape of the anisotropy decay curve corresponds to the situation when the fluorophore is in two different states with different rotation times and different fluorescence lifetimes [22]. In measurements of I V ( t )  →  I H ( t ) (Figure 4B), the shape of the anisotropy decay curve corresponds to the situation when the fluorophore is in two different states with different rotation times and the same fluorescence lifetime, and the asymptotic anisotropy is non-zero. Thus, results can be incorrectly interpreted without taking into account the effect of photobleaching.

4. Conclusions

We have shown that the calculation of the fluorescence anisotropy decay from the polarized fluorescence decay curves can be associated with a number of artifacts due to the photon counting loss effect. This effect increases with a higher photon counting rate. Artifacts cause distortions in the obtained values of the asymptotic anisotropy and the rotational correlation time. These distortions are associated with incorrect values of the G-factor, which, in turn, is related to the sensitivity of the detection system to light of different polarizations. The effect of photon counting loss can be minimized as follows. The experiment should use low photon counting rates, preferably up to 20,000 s−1. Since too low photon count rates mean longer signal collection times (for which there may be upper limits under certain conditions), one should choose the highest photon count rates from the range where the asymptotic anisotropy for a freely rotating fluorophore is equal to zero. If the fluorescence anisotropy does not reach a plateau during the natural fluorescence lifetime, the selection of the optimal photon count rate should be carried out using the calibration curve of the dependence of the G-factor on the count rate. In a situation where the fluorophore undergoes photobleaching during signal collection, one can use a magnetic stirrer to refresh the pool of fluorophore molecules under the laser beam, reduce the frequency of laser pulses, or use the T-format setup for recording polarized fluorescence, when the signal of vertically and horizontally polarized fluorescence is recorded simultaneously.

Author Contributions

Conceptualization, D.A.G. and A.N.S.; methodology, D.A.G. and G.V.T.; validation, E.G.M.; investigation, D.A.G. and A.N.S.; resources, E.G.M.; data curation, A.N.S. and G.V.T.; writing—original draft preparation, D.A.G.; writing—review and editing, A.N.S. and E.G.M.; visualization, D.A.G. All authors have read and agreed to the published version of the manuscript.

Funding

This research was supported by the Russian Science Foundation grant No. 22-25-00183.

Institutional Review Board Statement

Not applicable.

Informed Consent Statement

Not applicable.

Data Availability Statement

Not applicable.

Conflicts of Interest

The authors declare no conflict of interest.

Appendix A

Figure A1. Instrumental response function (IRF) of the measurement system. Laser repetition rate 10 MHz. AlPc8 solution of 500 nM, excitation on 660 nm, fluorescence detection wavelength 705 nm.
Photonics 10 00681 g0a1
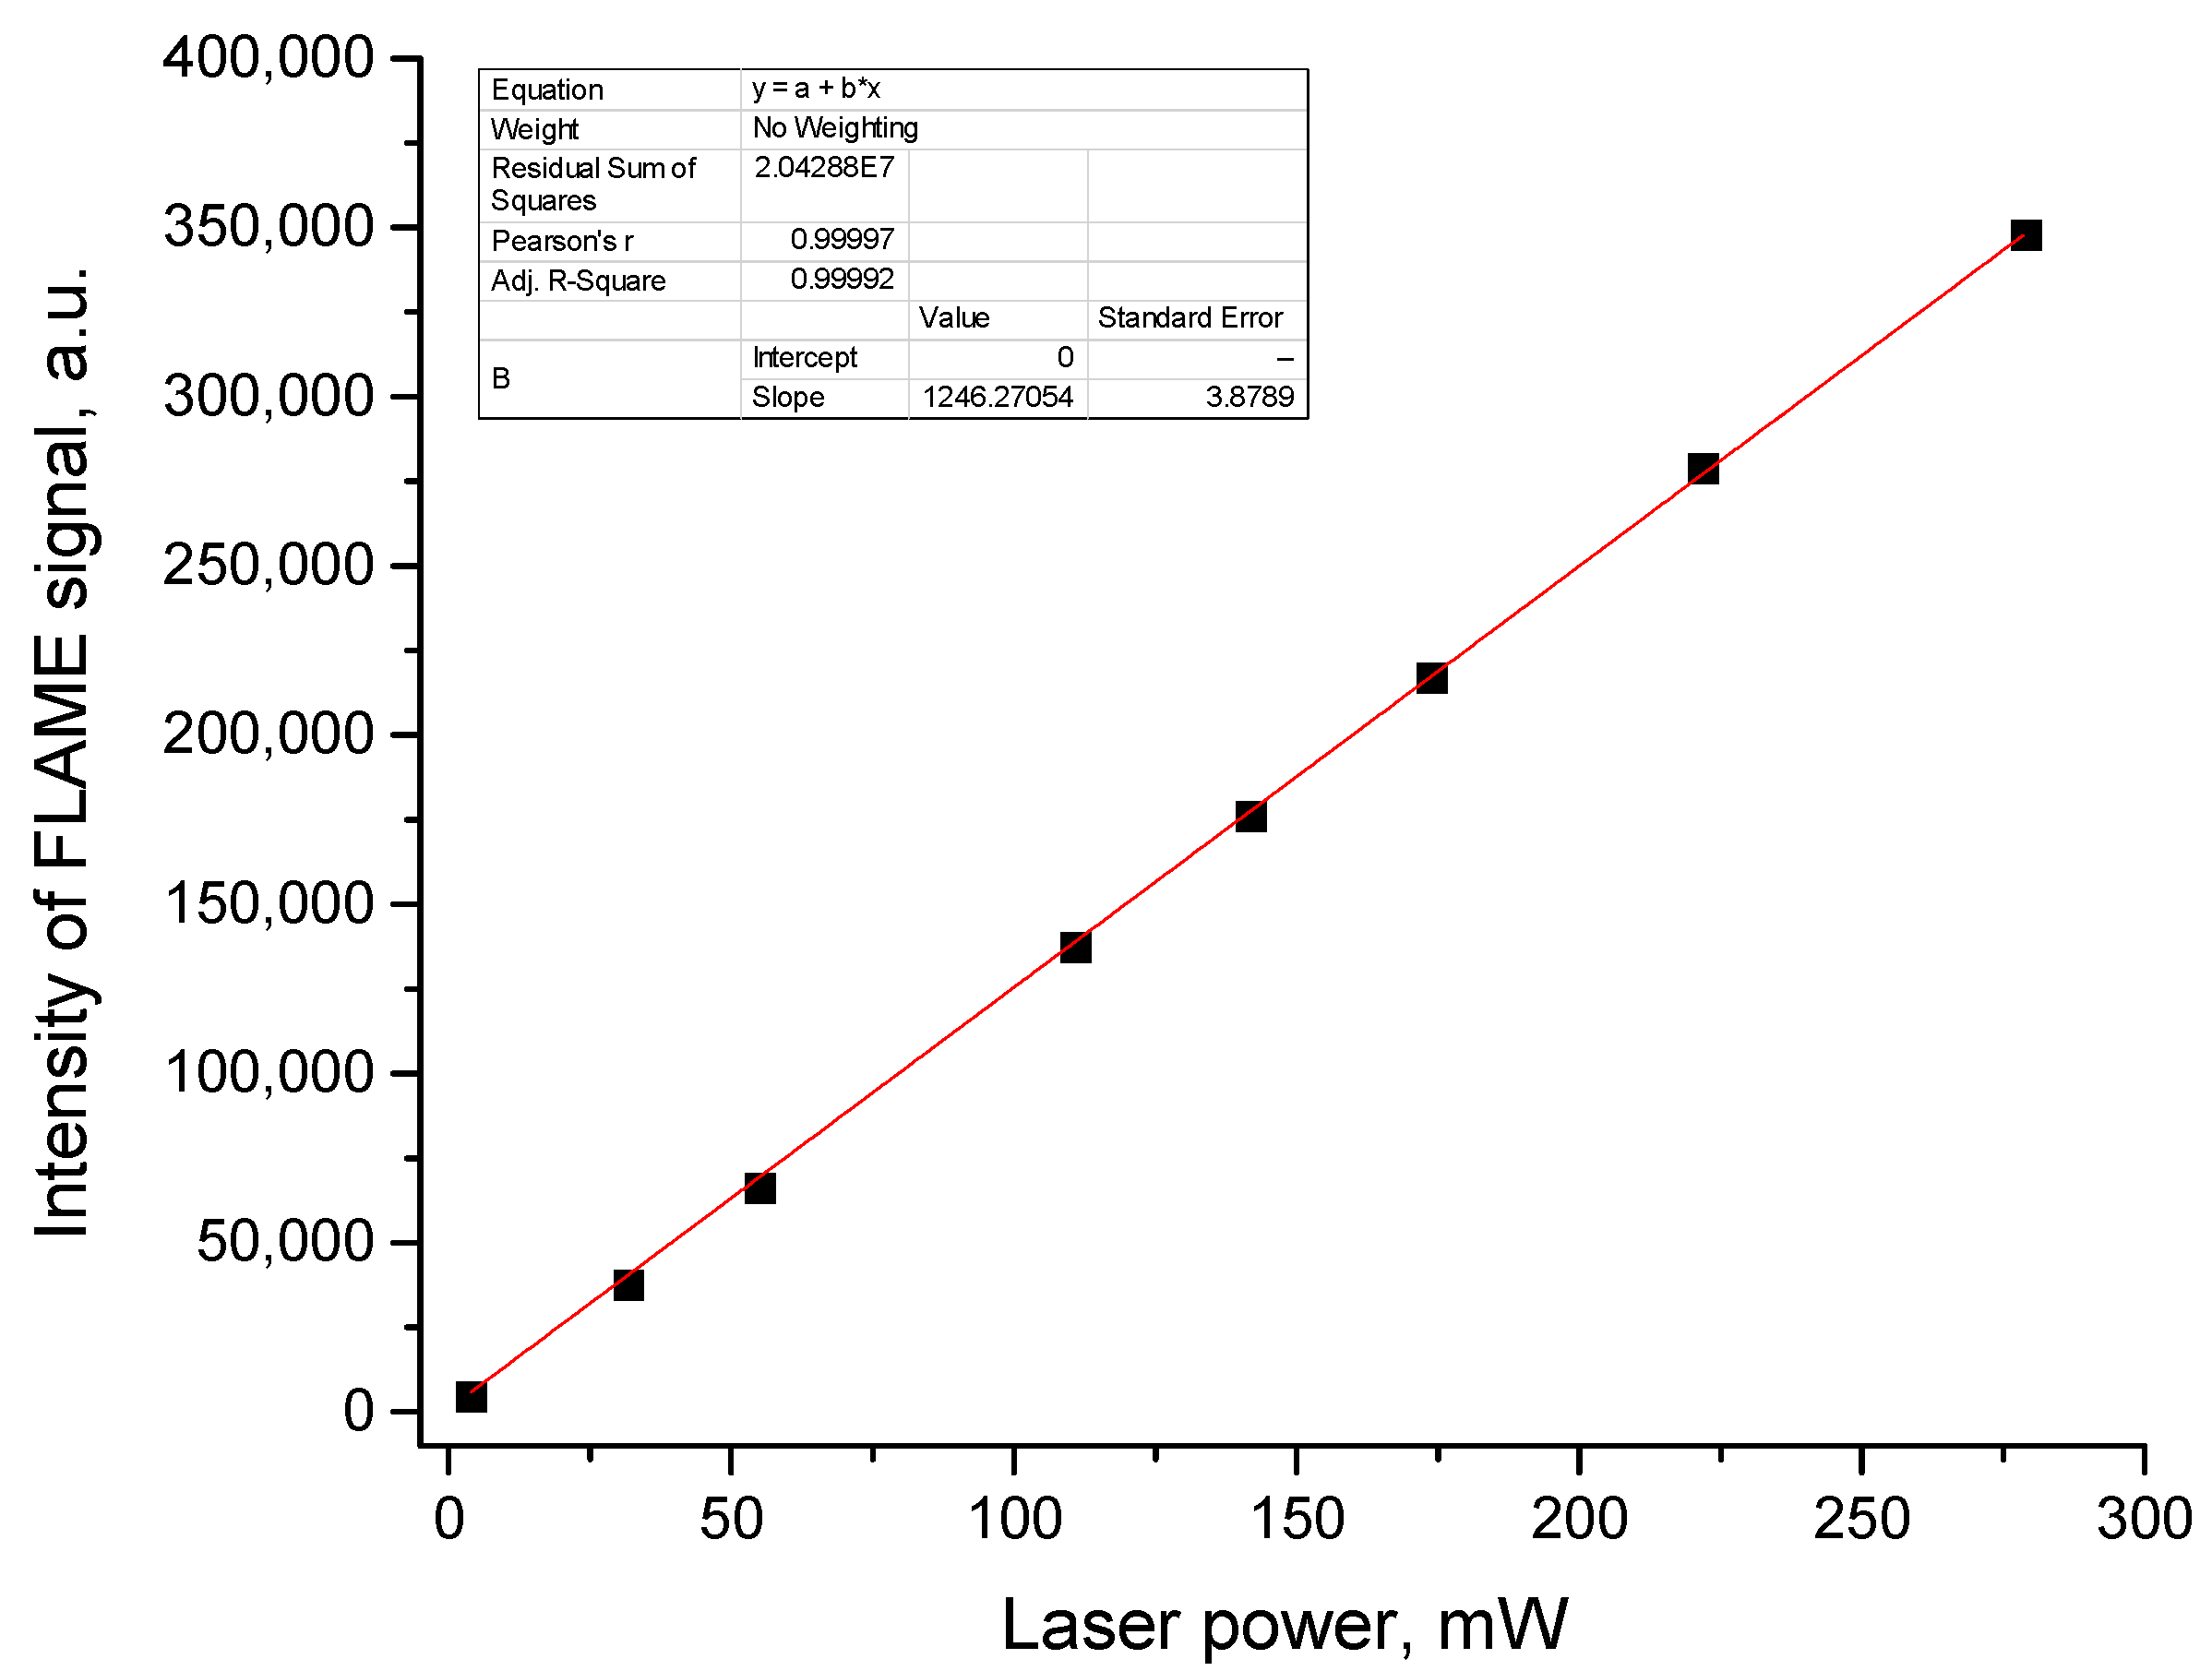
Figure A2. Calibration curve of the FLAME CCD spectrometer. Intensity of FLAME signal is the integral under the laser irradiation spectrum. We used a TOPOL-1050-C parametric femtosecond generator with a TEMA-150 pump laser as the light source (light beam at output 1 (signal), 685 nm). Laser power was measured with PM160T thermal sensor power meter (Thorlabs, USA) and was changed with neutral optical filters.
Photonics 10 00681 g0a2

References

  1. Kawski, A.; Gryczyński, Z. On the Determination of Transition-Moment Directions from Emission Anisotropy Measurements. Z. Naturforsch. A 1986, 41, 1195–1199. [Google Scholar] [CrossRef]
  2. Albrecht, A.C. Polarizations and assignments of transitions: The method of photoselection. J. Mol. Spectrosc. 1961, 6, 84–108. [Google Scholar] [CrossRef]
  3. Lakowicz, J.R. Fluorescence Anisotropy. In Principles of Fluorescence Spectroscopy; Springer: Boston, MA, USA, 1999; pp. 291–319. [Google Scholar] [CrossRef]
  4. Semenov, A.N.; Gvozdev, D.A.; Zlenko, D.V.; Protasova, E.A.; Khashimova, A.R.; Parshina, E.Y.; Baizhumanov, A.A.; Lotosh, N.Y.; Kim, E.E.; Kononevich, Y.N.; et al. Modulation of Membrane Microviscosity by Protein-Mediated Carotenoid Delivery as Revealed by Time-Resolved Fluorescence Anisotropy. Membranes 2022, 12, 905. [Google Scholar] [CrossRef] [PubMed]
  5. Miao, W.; Yu, C.; Hao, E.; Jiao, L. Functionalized BODIPYs as Fluorescent Molecular Rotors for Viscosity Detection. Front. Chem. 2019, 7, 825. [Google Scholar] [CrossRef] [PubMed] [Green Version]
  6. Baffou, G.; Kreuzer, M.P.; Kulzer, F.; Quidant, R. Temperature mapping near plasmonic nanostructures using fluorescence polarization anisotropy. Opt. Express 2009, 17, 3291. [Google Scholar] [CrossRef] [PubMed]
  7. Jain, P.; Aida, T.; Motosuke, M. Fluorescence Anisotropy as a Temperature-Sensing Molecular Probe Using Fluorescein. Micromachines 2021, 12, 1109. [Google Scholar] [CrossRef] [PubMed]
  8. Wahl, P.; Paoletti, J.; Le Pecq, J.-B. Decay of Fluorescence Emission Anisotropy of the Ethidium Bromide-DNA Complex Evidence for an Internal Motion in DNA. Proc. Natl. Acad. Sci. USA 1970, 65, 417–421. [Google Scholar] [CrossRef] [PubMed] [Green Version]
  9. Walport, L.J.; Low, J.K.K.; Matthews, J.M.; Mackay, J.P. The characterization of protein interactions—What, how and how much? Chem. Soc. Rev. 2021, 50, 12292–12307. [Google Scholar] [CrossRef] [PubMed]
  10. Holowka, D.; Wensel, T.; Baird, B. A nanosecond fluorescence depolarization study on the segmental flexibility of receptor-bound immunoglobulin E. Biochemistry 1990, 29, 4607–4612. [Google Scholar] [CrossRef] [PubMed]
  11. Das, D.; Arora, L.; Mukhopadhyay, S. Short-Range Backbone Dihedral Rotations Modulate Internal Friction in Intrinsically Disordered Proteins. J. Am. Chem. Soc. 2022, 144, 1739–1747. [Google Scholar] [CrossRef] [PubMed]
  12. Birch, D.J.S.; Imhof, R.E. Time-Domain Fluorescence Spectroscopy Using Time-Correlated Single-Photon Counting. In Topics in Fluorescence Spectroscopy: Techniques; Kluwer Academic Publishers: Boston, MA, USA, 1999; pp. 1–95. [Google Scholar] [CrossRef]
  13. Becker, W. Advanced Time-Correlated Single Photon Counting Techniques; Springer: Berlin, Germany, 2005. [Google Scholar]
  14. Becker, W. The bh TCSPC Handbook, 9th ed.; Becker & Hickl GmbH: Berlin, Germany, 2021; pp. 281–284. [Google Scholar]
  15. Salthammer, T. Numerical simulation of pile-up distorted time-correlated single photon counting (TCSPC) data. J. Fluoresc. 1992, 2, 23–27. [Google Scholar] [CrossRef] [PubMed]
  16. Isbaner, S.; Karedla, N.; Ruhlandt, D.; Stein, S.C.; Chizhic, A.; Gregor, I.; Enderlein, J. Dead-time correction of fluorescence lifetime measurements and fluorescence lifetime imaging. Opt. Express 2016, 24, 9429. [Google Scholar] [CrossRef] [PubMed] [Green Version]
  17. Kubista, M.; Aakerman, B.; Albinsson, B. Characterization of the electronic structure of 4′,6-diamidino-2-phenylindole. J. Am. Chem. Soc. 1989, 111, 7031–7035. [Google Scholar] [CrossRef]
  18. Prazeres, T.J.V.; Fedorov, A.; Barbosa, S.P.; Martinho, J.M.G.; Berberan-Santos, M.N. Accurate Determination of the Limiting Anisotropy of Rhodamine 101. Implications for Its Use as a Fluorescence Polarization Standard. J. Phys. Chem. A 2008, 112, 5034–5039. [Google Scholar] [CrossRef] [PubMed] [Green Version]
  19. Kim, D.; Osuka, A. Directly Linked Porphyrin Arrays with Tunable Excitonic Interactions. Acc. Chem. Res. 2004, 37, 735–745. [Google Scholar] [CrossRef] [PubMed]
  20. Maiti, N.C.; Mazumdar, S.; Periasamy, N. Dynamics of Porphyrin Molecules in Micelles. Picosecond Time-Resolved Fluorescence Anisotropy Studies. J. Phys. Chem. 1995, 99, 10708–10715. [Google Scholar] [CrossRef]
  21. Lakowicz, J.R.; Knutson, J.R. Hindered depolarizing rotations of perylene in lipid bilayers. Detection by lifetime-resolved fluorescence anisotropy measurements. Biochemistry 1980, 19, 905–911. [Google Scholar] [CrossRef] [PubMed]
  22. Semenov, A.N.; Gvozdev, D.A.; Moysenovich, A.M.; Zlenko, D.V.; Parshina, E.Y.; Baizhumanov, A.A.; Budylin, G.S.; Maksimov, E.G. Probing Red Blood Cell Membrane Microviscosity Using Fluorescence Anisotropy Decay Curves of the Lipophilic Dye PKH26. Int. J. Mol. Sci. 2022, 23, 15767. [Google Scholar] [CrossRef] [PubMed]
  23. Ha, T.; Glass, J.; Enderle, T.; Chemla, D.S.; Weiss, S. Hindered Rotational Diffusion and Rotational Jumps of Single Molecules. Phys. Rev. Lett. 1998, 80, 2093–2096. [Google Scholar] [CrossRef]
  24. Gvozdev, D.A.; Ramonova, A.A.; Maksimov, E.G.; Paschenko, V.Z. Specific features of the interaction between chemical traps and phthalocyanine dyes affecting the measurement of the yield of reactive oxygen species. Dye. Pigment. 2020, 181, 108538. [Google Scholar] [CrossRef]
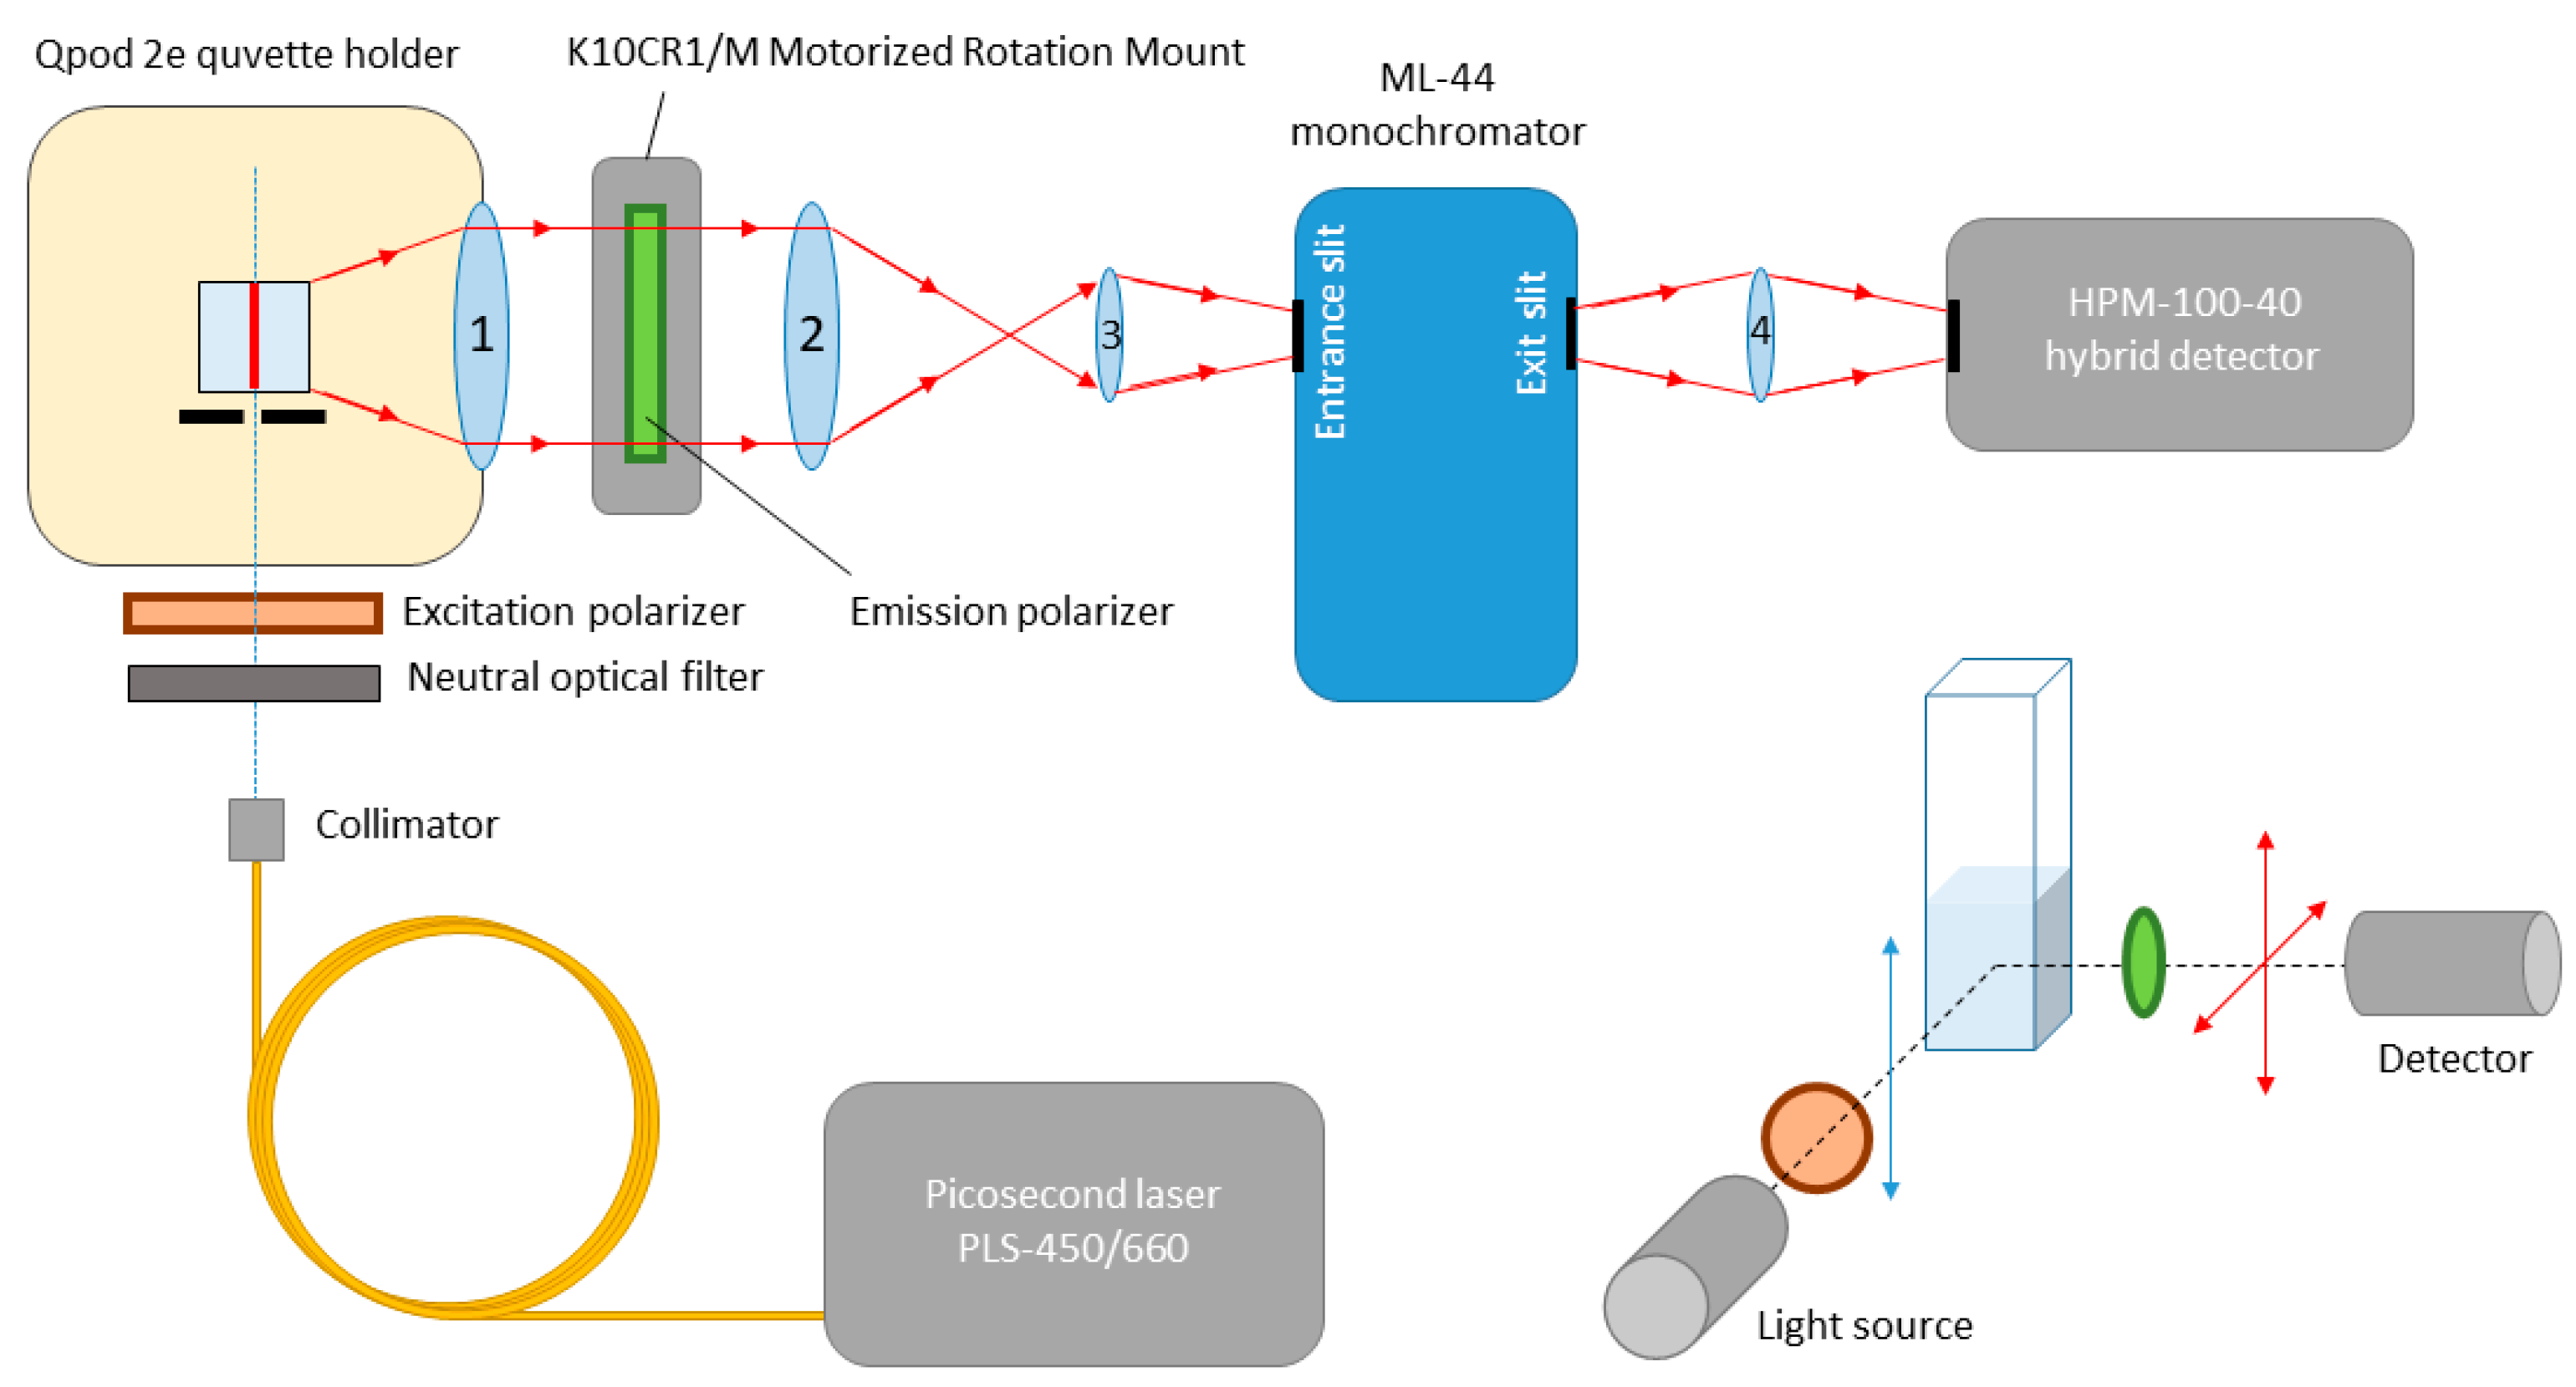
Scheme 1. Setup for measuring the decay kinetics of polarized fluorescence. A detailed description of the individual components of the measuring system can be found in the Materials and Methods section.
Photonics 10 00681 sch001
Figure 1. Dependence of the photon counting rate (HPM-100-40 hybrid detector) on the intensity of the exciting light (measured with the FLAME CCD spectrometer as a reference, see Appendix A, Figure A2). Aqueous solution of 1 μM AlPc8, fluorescence detection wavelength 705 nm, repetition rate 10 MHz. The blue dotted line is a linear approximation over the first three experimental points (where the PCL effect is minimal). Inset shows the spectral characteristics of laser radiation (PLS-450/660).
Photonics 10 00681 g001
Figure 2. Normalized absorption (black curve) and fluorescence (blue curve) spectra of AlPc8 in aqueous solution. The AlPc8 fluorescence detection region is shown in pink. The limiting anisotropy r o values of Pc fluorescence at different excitation wavelengths measured by TCSPC ( r o a , red square labels) and steady-state fluorimetry ( r o b , green square labels) are shown, demonstrating mean values with error bars corresponding to standard deviations (measurements were performed in triplets).
Photonics 10 00681 g002
Figure 3. (A) AlPc8 fluorescence anisotropy decay curves reconstructed by Formula (3) from experimental data with different photon counting rates (values obtained with the vertically oriented polarizers). Laser repetition rate: 25 MHz. The red horizontal line shows the zero level of anisotropy. (B) Dependence of the rotational correlation time θ and the values of the G-factor on the photon counting rate.
Photonics 10 00681 g003
Figure 4. ZnPc8 fluorescence anisotropy decay curves (green) reconstructed from polarized fluorescence decay measured in the sequence: (A) I H ( t )  →  I V ( t ) , when position of emission polarizer changes from horizontal (h) to vertical (v); (B) I V ( t )  →  I H ( t ) , when position of emission polarizer changes from vertical (v) to horizontal (h). The monoexponential approximation of the correct ZnPc8 fluorescence anisotropy decay curve is shown in red. Insets show the dependence of the fluorescence intensity of AlPc8 and ZnPc8 on the time exposition (laser repetition rate of 50 MHz). The signal is detected by photon counting in Fi/F0 (first in – first out) mode.
Photonics 10 00681 g004
Table 1. AlPc8 fluorescence intensity (area under the fluorescence decay curve), as well as approximation parameters of the AlPc8 fluorescence anisotropy decay at different temperatures. r is the asymptotic anisotropy, r o is the limiting anisotropy, and θ is the rotational correlation time.
Fl Intensity, a.u. r r o θ , ns
15 °C216,500−0.0039 ± 0.00240.056 ± 0.0010.54 ± 0.04
25 °C206,350−0.0008 ± 0.00220.057 ± 0.0010.41 ± 0.02
35 °C195,600−0.0014 ± 0.00200.057 ± 0.0010.31 ± 0.02
Disclaimer/Publisher’s Note: The statements, opinions and data contained in all publications are solely those of the individual author(s) and contributor(s) and not of MDPI and/or the editor(s). MDPI and/or the editor(s) disclaim responsibility for any injury to people or property resulting from any ideas, methods, instructions or products referred to in the content.