Abstract
Optical surface scattering is an important subject in the field of optics. Previous studies of surface scattering mainly focused on the influence of surface topography and often ignored the influence of the mechanical property’s change caused by polished surface densification. In this paper, we study the mechanical property of fused silica glass in detail and analyze the scattering behaviour of actual fused silica glass’s surface with sub-angstrom roughness, considering the topography and the change of refractive index. Experimental results show that there is a negative correlation between the height and modulus on the surface of roughly polished fused silica glass, and the correlation coefficient γ = −0.29 was determined. After super−polishing, the mechanical properties of the sample surface become significantly uniform with a roughness of Rq = 0.06 nm and Ra = 0.05 nm, and the correlation coefficient becomes γ = −0.02. Moreover, the nanoindentation test proves that silica glass surfaces have been densified during polishing. Based on the densification characteristics, the bidirectional reflectance distribution function (BRDF) was simulated by the finite element method. The result indicates that the densification characteristics will increase the scattering intensity. This work not only deepens the understanding of the properties of polished optical surfaces but also the surface scattering characteristics of optical elements.
1. Introduction
Fused silica glass has many excellent characteristics, such as ultra-low thermal expansion coefficient, reasonable optical transmission rate, excellent chemical stability, and good processing performance [1,2]. Because of this, fused silica is widely used as the standard material for beam steering, shaping, and splitting in typical and unique optical systems, such as optical fiber communication systems and laser interferometry gravitational wave detectors [3,4,5]. To meet its functional requirements, the silica glass must be processed through a series of grinding and polishing steps to achieve the shape forming and surface quality improvement. However, no processing method can obtain a strict mirror, the surface is uneven at the microscopic scale, which is the direct cause of surface scattering [6].
Wave scattering by rough surfaces is a fundamental error in various fields of science and technology related to measurements. For the ultra-sensitive photoelectric detection system, such as ring laser gyro used for the angular motion measurement [7], the backscattering caused by the uneven surface topography of a high reflectivity mirror directly decides the performance limit. To this end, researchers have conducted much research about the scattering caused by microscopic topography or roughness of optical surfaces [8,9]. The relationship between the total integrated scattering and the angle of incidence, polarization, and correlation length have all been analyzed in detail [10]. The results show that total integral scattering positively correlates with the roughness square. Under this guidance, the supersmooth polishing process was adopted to reduce fused silica surface roughness in ring laser gyro, in which a roughness lower than 0.04 nm was obtained [11], the most demanding known in engineering technology. Even though the surface roughness of the ultrasmooth surface is close to the atomic size, the practice shows that the locking effect caused by surface scattering is still significant [12]. There must be other critical factors affecting surface scattering besides surface roughness.
In previous studies, people tended to care mainly about surface roughness. However, they neglected the fact that the surface mechanical properties of fused silica glass may be changed by processing, which leads to the uneven distribution of the refractive index. Many theoretical and experimental studies have shown that when the longitudinal pressure in the processing process is greater than the yield force of the glass material, the densification phenomenon will occur on the processed surface with a more extensive refractive index than the ideal value [13]. For fused silica glass, the surface densification characteristics and the effect of densification on the surface scattering characteristics have yet to attract enough attention. This problem needs to be examined further in detail. In this paper, we study the mechanical property of fused silica glass in detail and analyze the scattering behaviour of actual fused silica glass’s surface with sub-angstrom roughness, considering the topography and the change of the refractive index.
2. Materials and Methods
2.1. Materials and Sample Preparation
A fused silica wafer with a diameter of 25 mm and a thickness of 6 mm was machined by the classical mechanical polishing method according to the process of forming, cutting, chamfering, grinding, roughly polishing, and superpolishing. The brand of used glass material was JGS2 and was provided by Shanghai Sikoty Optic and Electron Co., Ltd., China. After entering the polishing process, a four-axis polisher was used with optical pitch and cerium oxide powders. The schematic diagram of the polisher and auxiliary materials is illustrated in Figure 1. It should be noted that the particle size of the polishing powder was different in roughly polishing and superpolishing. The median particle size of the former was 1.5 μm, while the median particle size of the latter was smaller, about 200 nm. Moreover, the spindle rotation and swing speed were set to 20 rpm and 10 cycles/min in the roughly polishing and superpolishing stage. The rough polishing lasted fifty hours, and super−polishing lasted ten hours.
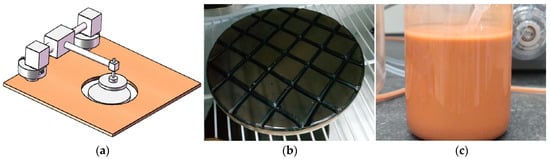
Figure 1.
Polisher and auxiliary materials: (a) polisher diagram; (b) optical pitch; (c) cerium oxide polishing slurry.
2.2. Characterization Tests
In order to observe the relationship between the surface topography and mechanical properties (mainly hardness and modulus) of polished fused silica glass clearly and accurately, the glass surface samples after rough and super−polishing were measured with the Dimension Icon atomic force microscope (AFM) of Bruker, Inc. The Scanning Asyst intelligent imaging function of PeakForce Tapping mode was used to tap the surface topography of a random area at 5 μm × 5 μm. The model of cantilever used was VTESPA-300. In addition, to obtain the surface mechanical properties of the same area, the PeakForce QNM module was used to perform imaging and mechanical measurement based on the force curve, which realized the synchronous acquisition of the surface topography imaging and mechanical imaging in situ. The image resolution in the experiment was 256 × 256.
The transverse distribution of surface Young’s modulus and its relationship with surface topography was researched in detail by AFM. In order to grasp the mechanical properties of the sample along the depth direction and measure the absolute value of its hardness and modulus, a nanoindentor was used by the static indentation method [14] for nanoindentation samples mounted on a stainless steel stage using vacuum. Measurements were carried out using Nanoindenter G200 (Agilent Inc.). Measurements were taken at room temperature (24 ± 1 °C) and relative humidity of 40%. To minimize the errors in tests, the machine compliance and the indenter area function were calibrated on a standard fused silica lump before testing. A Berkovich diamond tip with an effective radius of ~150 nm was used for nanoindentation tests. The nanoindentation tests were conducted separately with a maximum load displacement at 100 nm, 200 nm, and 400 nm. Every depth test was repeated at five points on the sample surfaces.
3. Results
The AFM test results are shown in Figure 2. Figure 2a–d show the morphology test results of the roughly polished sample, the modulus results of the same area of the roughly polished sample, and the morphology and modulus results of the superpolished sample, respectively. The microscopic topography of the roughly polished sample shows the surface roughness Rq = 0.45 nm and Ra = 0.35 nm. Meanwhile, Figure 2b shows the measured modulus of the same area based on the Derjaguin–Müller–Toporov (DMT) theory [15]. The standard and average deviation values are Mq = 3.27 GPa and Ma = 1.45 GPa, respectively. After super−polishing, the surface roughness and modulus value significantly decrease. The surface roughness decreases to Rq = 0.06 nm and Ra = 0.05 nm, and the deviation values of the DMT modulus are Mq = 0.91 GPa and Ma = 0.68 GPa, respectively. It should be noted that the modulus obtained in this experiment is the relative change of the surface modulus of the polished fused silica sample and cannot reflect its absolute value. In principle, measuring absolute modulus using the PeakForce QNM method requires a probe that matches the sample modulus. Considering the modulus of polished fused silica surface reaches 80 GPa, even the hardest probe we could use cannot meet the requirement of absolute value measurement. According to the suggestion of the application engineer of Bruker Inc., the VTESPA-300 probe was used to test the relative change of surface modulus. The setting of the peak force of each sample is uniform during the whole test process. Then, under the same peak force setting, if each sampling point is pressed into different depths, the relative modulus of each point can be reflected. Hence, this method can provide the relative variation of the surface modulus of the polished fused silica samples in transverse nanoscale resolution. As shown in Figure 2a, the surface of the roughly polished sample still has many visible scratches, and the actual surface microcosmic fluctuation exceeds 1 nm. Meanwhile, the scratches circled by the square of white dotted lines in Figure 2a as depressions are also clearly seen in Figure 2b as protrusions. It means that the surface morphology of polished samples is correlated with the modulus to some extent, which will be further explained in the discussion part. Moreover, Figure 2b manifests that the surface modulus, after roughly polishing in a classical polishing method, has significant fluctuation, and the transverse distribution of its modulus presents apparent non-uniformity. In comparing the results of Figure 2b,d, it can be found that the relative fluctuation of the sample modulus decreases significantly after super−polishing. It means that the mechanical properties of the sample surface become uniform.
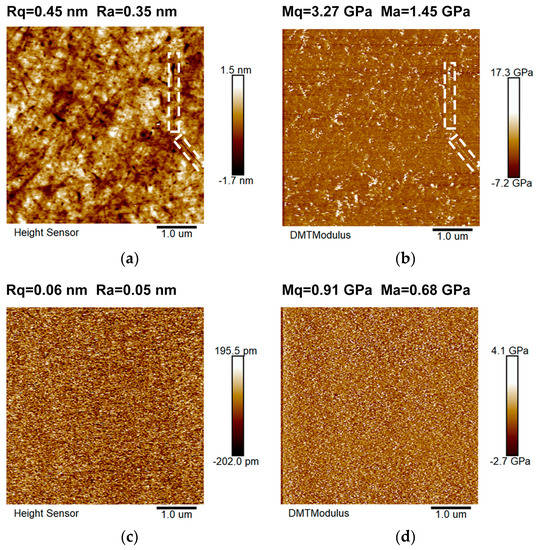
Figure 2.
AFM test results. Roughly polished sample topography (a) and modulus (b); super−polished sample topography (c) and modulus (d).
The transverse distribution of surface modulus and its relationship with surface topography was researched in detail by AFM. In order to grasp the mechanical properties of the sample along the depth direction and measure the absolute value of its hardness and modulus, a nanoindentor was used by the static indentation method [16]. The samples were measured at different depths of 50 nm, 100 nm, 200 nm, and 400 nm, respectively. The test was repeated five times for each depth, and the mean of the test results and their range fluctuation are shown in Figure 3. It can be seen that the hardness and modulus of the optical surface formed by the typical optical machining process gradually decreases with the increase of depth. At 50 nm, the hardness and modulus of the roughly polished surface are determined as 11.2 GPa and 81.6 GPa, respectively. The super−polished sample has slightly larger values of 11.5 GPa and 82.7 GPa, respectively. With the rise of depth, the hardness and modulus of the two samples significantly decrease and reach the same value at 400 nm. The hardness is around 9.07 GPa, and the modulus is 71.4 GPa; the noticeable base effect is present. The nanoindentation test results prove that the polished fused silica’s surface is densified after conventional polishing. The degree of densification will become more evident with the decrease in surface roughness. The results also proved that the surface mechanical properties of the super-smooth surface obtained by polishing in Figure 2d behave uniformly, not because the densified layer was removed during the super−polishing stage but because the fused silica surface was further densified under the action of polishing powder during this process, resulting in a uniformly densified fused silica surface.
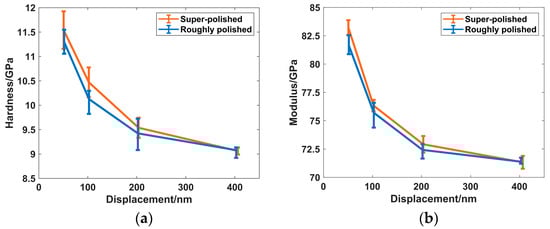
Figure 3.
Comparison of mechanical properties of super−polished and roughly polished samples tested by the static indentation method: (a) hardness; (b) modulus.
4. Discussion
4.1. Surface Densification Characteristics Analysis
The Pearson correlation coefficient was calculated based on the data of height and modulus in Figure 2 to find the internal relations between the polished surface microtopography and its modulus. The specific calculation formula can be expressed by , where is the covariance value between height and modulus data of each sampling point in the test area, and are the standard deviations of height and modulus, respectively. The roughly polished and super−polished sample value is γ = −0.29 and γ = −0.02, respectively. This result indicates that the optical surface’s microtopography of roughly polished fused silica glass negatively correlates with the modulus: the local modulus of the protrusion of geometric topography is small, and the modulus of the concave topography is large. It can be proved more obviously in the schematic diagram of the one-dimensional surface topography and modulus data selected randomly along the y direction, shown in Figure 4a. A small amount of data on height and modulus along the x direction is selected on the sample’s surface. It can be found that the modulus is generally more significant at the concave area of the surface topography, especially in the blue circle, where the height value is minimum and the modulus value is maximum. According to previous studies on the polishing mechanism, the traditional grinding and polishing process will lead to plastic deformation of glass materials, resulting in the permanent densification of the glass’s surface layer [15]. This explains why polished fused silica has a greater modulus where the surface is concave; the concave place is the mark left by polishing powders when polishing the glass surface, which becomes dense under the action of powders. Meanwhile, it should be noted that the correlation coefficient is larger than −1. This phenomenon means that the chemical actions cannot be ignored in the polishing process, in addition to the mechanical processes that produce densification. Furthermore, it explains why only a few scratches in Figure 2a seen as depressions are also clearly seen in Figure 2b as protrusions. The general principle of the material removal process of chemical action is that CeO2 polishing powder particles come into contact with the convex surface of the fused silica under the action of pressure and form a Ce-O-Si bond and then achieve the removal of silicon and oxygen atoms at the convex surface of the fused silica under the act of shear force. This removal mechanism will not cause obvious densification on the material’s surface. It can be found by comparing Figure 4a,b that the negative correlation between the topography and modulus almost disappears. The mechanical properties of the fused silica surface become uniform.
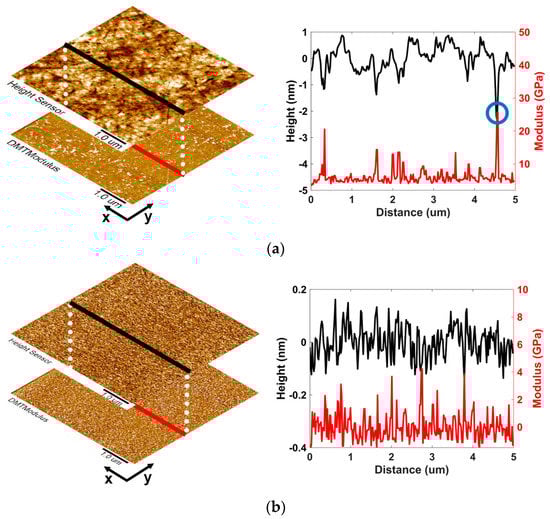
Figure 4.
Schematic diagram of the relationship between surface morphology and modulus at different polishing stages: (a) roughly polished; (b) super−polished.
4.2. Effect of Densification on Surface Scattering Characteristics
When densification occurs, the properties of the fused glass, such as hardness, Young’s modulus, and Poisson’s ratio, change, which affect its application. Especially for optical applications, the effect of surface densification of fused silica is mainly manifested in the increase of refractive index, which was proved by many previous studies [17,18,19,20]. In 1969, H. Yokota studied the relationship between the degree of densification and the refractive index of different glass materials. A positive correlation between the density of fused silica glass and the refractive index was obtained [18]. Based on the above conclusions, the surface scattering characteristics of the polished surface were studied by the finite element method (FEM) in which the change of refractive index caused by densification is innovatively considered.
In this simulation model, the super−polished surface topography data shown in Figure 2c was imported into the FEM software to establish the model of the scattering field. BRDF was used to characterize the surface scattering quantitatively [21]. As shown in Figure 5, the model was a hemispherical space consisting mainly of the densification fused silica glass, the air domain, and the perfect matching layer (PML). The background electric field was set as a linearly polarized plane wave with a wavelength of 633 nm and the incident at an incident angle of 30°. The wave optical model of COMSOL was used to calculate the scattered field.
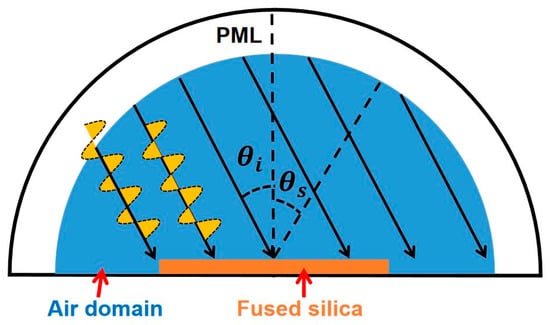
Figure 5.
Schematic diagram of the surface scattering simulation model.
Considering the apparent densification characteristic of the polished fused silica surface, it is reasonable to believe that the surface refractive index is higher than the ideal value. Meanwhile, due to the slight non-uniformity of surface densification after super−polishing, it can be assumed that the refractive index of fused silica at the same height level in this model is the same and gradually decreases to the theoretical value of 1.457 at a depth of 400 nm. Based on the above assumptions, this paper calculates the BRDF under the three conditions of the maximum surface refractive index of 1.6, 1.5, and 1.457 (i.e., no surface densification). The refractive index of 1.5 is set according to the fact that the densification degree of fused silica is 11%, corresponding to the refractive index of 1.5 reported by M. Okuno [22]. Meanwhile, this study pointed out that the maximum densification degree of fused silica can reach 20%, so this paper assumes that the refractive index value of the most apparent densification degree is 1.6. The spatial distribution of typical scattered fields obtained by simulation is shown in Figure 6a. The intensity of the scattered field at different scattering angles is collected at the position 3 μm away from the sample center. Based on the electric field intensity of the scattered field, the scattering angle distribution curve of the BRDF function is calculated, as shown in Figure 6b. The three BRDF distribution curves have broad peak values in the direction around, near the direction of specular reflection. This phenomenon is similar to the results reported by X. Shi [23]. It is worth noting that under the other same conditions, the scattering quantity in all directions of fused silica surface with a surface refractive index of 1.6 is greater than that of the other two groups of data; that is, the densification phenomenon caused by the polishing process will enhance the surface scattering of optical elements.
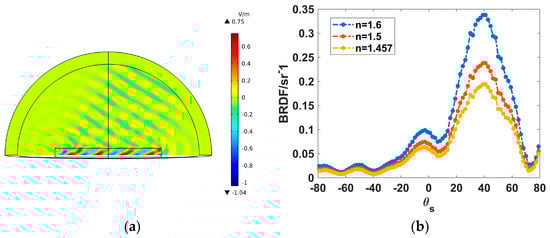
Figure 6.
(a) Spatial distribution of scattered electric field intensity; (b) BRDF distribution curve of different refractive index.
5. Conclusions
The surface mechanical properties of polished fused silica surfaces were studied by AFM and nanoindentation in detail. The roughly polished fused silica surface with a roughness of Rq = 0.45 nm and Ra = 0.35 nm behaves as apparent height fluctuation and non-uniform densification. Meanwhile, it was found that there is a negative correlation between height and modulus, and the correlation coefficient γ = −0.29 was determined. After super−polishing, the correlation coefficient is nearly close to zero, and the mechanical properties of the sample surface become significantly uniform, with the roughness decreasing to Rq = 0.06 nm and Ra = 0.05 nm. Moreover, the nanoindentation test proves that silica glass surfaces densify significantly during polishing. The hardness and modulus of the superpolished surface were determined as 11.5 GPa and 82.4 GPa, respectively, higher than the roughly polished sample. Based on the densification characteristics of polished fused silica glass, the bidirectional reflectance distribution function (BRDF) was simulated by the finite element method. The result indicates that the densification characteristics will increase the scattering intensity. The research in this paper can deepen not only the understanding of the properties of polished optical surfaces but also guide the application of sub-angstrom optical surfaces of fused silica glass.
Author Contributions
Conceptualization, Z.T.; methodology, X.J. and X.L.; software, X.J. and D.C.; validation, Z.T.; investigation, X.J. and Y.Q.; resources, X.L.; data curation, S.W.; writing—original draft preparation, Z.T.; writing—review and editing, X.J.; visualization, X.J. All authors have read and agreed to the published version of the manuscript.
Funding
This research received no external funding.
Institutional Review Board Statement
Not applicable.
Informed Consent Statement
Not applicable.
Data Availability Statement
Data of the results presented in this article are not publicly available.
Conflicts of Interest
The authors declare no conflict of interest.
References
- Frederik, K.; Karl, A.; Werner, B.; Dieter, S.; Nico, K.; Kai, S.; Tobias, M.N.; Christiane, R.; Dorothea, H.; Bastian, E.R. Three-dimensional printing of transparent fused silica glass. Nature 2017, 544, 337–339. [Google Scholar]
- Akira, J.I.; Hiroshi, K.; Kazuya, S. Silica glass: A material for photonics. J. Appl. Phys. 2000, 88, 1201–1213. [Google Scholar]
- Alessandro, L.; Stefano, B.; Guillermo, V.; Nicolas, A.; Wolfango, P. Daily monitoring of scattered light noise due to microseismic variability at the Virgo interferometer. Class. Quant. Grav. 2021, 39, 035001. [Google Scholar]
- Alessandro, L.; Stefano, B.; Wolfango, P.; Nicolas, A.; Antonino, C.; Irene, F.; Bas, S.; Michal, W. Scattered light noise characterisation at the Virgo interferometer with tvf-EMD adaptive algorithm. Class. Quant. Grav. 2020, 37, 145011. [Google Scholar]
- Abramovici, A.; Althouse, W.E.; Drever, R.W.; Gürsel, Y.; Kawamura, S.; Raab, F.J.; Shoemaker, D.; Sievers, L.; Spero, R.E.; Thorne, K.S.; et al. LIGO:The Laser Interferometer Gravitational-Wave Observatory. Science 1992, 256, 325–333. [Google Scholar] [CrossRef] [PubMed]
- Liao, W.; Dai, Y.; Xie, X.; Zhou, L. Influence of local densification on microscopic topography evolution during ion-beam sputtering of fused-silica surfaces. Appl. Opt. 2014, 53, 2487–2493. [Google Scholar] [CrossRef] [PubMed]
- Soref, R.; Bennett, B. Electrooptical effects in silicon. IEEE J. Quantum Electron. 1987, 23, 1123–1129. [Google Scholar] [CrossRef]
- Madsen; Christi, K. Linking Diffractive and Geometrical Optics Surface Scattering at a Fundamental Level. Adv. Opt. Photonics 2022, 12, 1–17. [Google Scholar] [CrossRef]
- Harvey; James, E. Parametric analysis of the effect of scattered light upon the modulation transfer function. Opt. Eng. 2013, 52, 073110. [Google Scholar] [CrossRef]
- Elson, J.M.; Rahn, J.P.; Bennett, J.M. Relationship of the total integrated scattering from multilayer-coated optics to angle of incidence, polarization, correlation length, and roughness cross-correlation properties. Appl. Opt. 1983, 22, 3207–3219. [Google Scholar] [CrossRef] [PubMed]
- Tan, Z.; Jiang, X.; Mao, Y.; Long, X.; Luo, H. Ultra-smooth surface with 0.4 Å roughness on fused silica. Ceram. Int. 2023, 49, 7245–7251. [Google Scholar] [CrossRef]
- Fan, Z.; Luo, H.; Hu, S.; Xiao, G. Research on lock-in correction for mechanical dithered ring laser gyro. Opt. Eng 2011, 50, 034403. [Google Scholar] [CrossRef]
- Walsh, C.J.; Leistner, A.J.; Oreb, B.F. Power spectral density analysis of optical substrates for gravitational-wave interferometry. Appl. Opt. 1999, 38, 4790–4801. [Google Scholar] [CrossRef] [PubMed]
- Kai, X.; Lambropoulos, J.C. Densification of fused silica: Effects on nanoindentation. In Proceedings of the International Symposium on Optical Science and Technology, San Diego, CA, USA, 25 October 2000. [Google Scholar]
- Suratwala, T.I.; Steele, W.A.; Wong, L.A.; Tham, G.C.; Destino, J.F.; Miller, P.E.; Ray, N.J.; Menapace, J.A.; Feigenbaum, E.; Shen, N.; et al. Subsurface mechanical damage correlations after grinding of various optical materials. J. Am. Ceram. Soc. 2019, 58, 092604. [Google Scholar] [CrossRef]
- Derjaguin, B.V.; Muller, V.M.; Toporov Yu., P. Effect of contact deformations on the adhesion of particles. J. Colloid Interface Sci. 1975, 53, 314–326. [Google Scholar] [CrossRef]
- Zheng, L.; Ansgar, W.S.; John, C.L. Surface effects on Young’s modulus and hardness of fused silica by nanoindentation study. J. Mater. Sci. 2007, 42, 191–198. [Google Scholar] [CrossRef]
- Yokota, H.; Sakata, H.; Nishibori, M.; Kinosita, K. Ellipsometric study of polished glass surfaces. Surf. Sci. 1969, 16, 265–274. [Google Scholar] [CrossRef]
- Liu, W.; Yuan, S.; Guo, X. Atomic understanding of the densification removal mechanism during chemical mechanical polishing of fused glass. Appl. Surf. Sci. 2022, 591, 153166. [Google Scholar] [CrossRef]
- Marler, B. On the Relationship between Refractive Index and Density for SiO2-polymorphs. Phys. Chem. Miner. 1998, 16, 286–290. [Google Scholar] [CrossRef]
- Bass, M. Hand Book of Optics, 3rd ed.; McGraw Hill Publications: New York, NY, USA, 2010. [Google Scholar]
- Okuno, M.; Reynard, B.; Shimada, Y.; Syono, Y.; Willaime, C. A Raman spectroscopic study of shock-wave densification of vitreous silica. Phys Chem Miner. 1999, 26, 304–311. [Google Scholar] [CrossRef]
- Shi, X.; Sun, Y.; Li, P.; Liu, H.; Lin, J. Research on Scattering Characteristics of Ultra-precision Turned Aluminum Alloy Mirror Surface. In Proceedings of the 7th International Conference on Nanomanufacturing, Xi’an, China, 17–19 November 2022. [Google Scholar]
Disclaimer/Publisher’s Note: The statements, opinions and data contained in all publications are solely those of the individual author(s) and contributor(s) and not of MDPI and/or the editor(s). MDPI and/or the editor(s) disclaim responsibility for any injury to people or property resulting from any ideas, methods, instructions or products referred to in the content. |
© 2023 by the authors. Licensee MDPI, Basel, Switzerland. This article is an open access article distributed under the terms and conditions of the Creative Commons Attribution (CC BY) license (https://creativecommons.org/licenses/by/4.0/).