1. Introduction
Coastal lakes and lagoons are ecologically and socioeconomically significant ecosystems that act as transitional interfaces between terrestrial, freshwater, and marine domains, providing vital habitats, biodiversity hotspots, and a wide range of ecosystem services (-) [
1,
2,
3]. Their ecological complexity and vulnerability arise from continuous interactions among hydrological, geomorphological, and anthropogenic factors, which shape their physical structure and biogeochemical functioning [
4,
5]. These systems are globally recognized for their high biodiversity and for providing essential ecosystem services such as nutrient cycling, shoreline stabilization, water purification, and nursery habitats for fish and invertebrates) [
6,
7]. However, their limited water exchange and shallow morphology make them particularly sensitive to eutrophication, salinization, and sediment accumulation driven by climate variability and anthropogenic pressures [
8,
9]. As a result, coastal lagoons have become priority areas for ecological monitoring and sustainable management under the European Union’s environmental directives.
Along the Romanian Black Sea coast, several such systems—including limans, coastal lakes, and lagoons—have formed through the progressive isolation of river valleys from the sea by sandy barrier beaches, followed by partial or complete reconnection through artificial channels or natural breaches [
10,
11]. The Mangalia–Limanu coastal lake system represents one of the southernmost transitional aquatic ecosystems of the Romanian littoral. It occupies the lower reach of a deeply incised limestone valley, partially fed by tributaries and numerous freshwater springs, and was formerly separated from the Black Sea by a sandy barrier breached in 1953, which transformed the lake into an open bay with direct marine exchange [
10,
12]. These morphogenetic characteristics make the system highly dynamic and sensitive to both natural drivers—such as wind-driven circulation, seiche oscillations, and episodic saline intrusions—and anthropogenic pressures, including fisheries, tourism, and agricultural runoff [
13,
14].
Like other coastal limans of the northwestern Black Sea, Mangalia–Limanu exhibits strong environmental gradients in salinity, hydrodynamics, and substrate composition, which shape its water quality, sediment structure, and benthic communities [
15,
16]. The resulting oligohaline to mesohaline conditions are comparable to those of Mediterranean and Baltic lagoons, where freshwater–marine mixing zones play a crucial role in regulating nutrient availability, sediment geochemistry, and biological productivity [
5,
9,
17]. These transitional systems are of particular scientific relevance as they act as natural biogeochemical filters, retaining nutrients and contaminants while supporting productive planktonic and benthic communities [
5,
6,
17].
Despite its designation as a nationally protected area of ecological significance, the Mangalia–Limanu Lake has been the subject of relatively few integrated ecological assessments. Most previous studies of Romanian coastal lakes have focused either on hydrological and geomorphological evolution [
10] or on the Danube Delta’s limans [
1,
2], with limited data available for the southern coastal systems. Yet, transitional lakes are highly vulnerable to cumulative anthropogenic pressures and climate-driven changes, often exhibiting rapid shifts in ecological state [
18,
19].
Within this context, the present study provides a holistic assessment of the Mangalia–Limanu coastal lake, integrating sedimentological, geochemical, and biological datasets to characterize its current ecological condition. By combining in situ water-quality measurements with sediment and macrozoobenthic analyses, this research aims to elucidate the interactions between physical, chemical, and biological processes that define the functioning of this transitional ecosystem. The findings are discussed within the broader framework of European coastal-lagoon dynamics and environmental management, contributing to the understanding and preservation of vulnerable low-salinity lagoonal environments [
6,
7,
9]
The present study addresses this knowledge gap by providing a comprehensive characterization of the Mangalia–Limanu coastal lake through an integrated, multi-proxy analysis combining physicochemical, sedimentological, geochemical, and biological datasets. Specifically, this research investigates the following:
- (i)
the physicochemical parameters of the water column (e.g., temperature, pH, dissolved oxygen, turbidity, conductivity, nutrients, and pigments);
- (ii)
the lithological and geochemical composition of the sediments, including organic matter, carbonates, siliciclastic fractions, and trace metals; and
- (iii)
the structure of macrozoobenthic communities as indicators of ecological quality.
This integrated approach provides insights into the relationships between hydrological dynamics, sediment geochemistry, and benthic community structure in a semi-enclosed, low-salinity lagoon influenced by both marine and continental inputs. By elucidating the interactions between hydrological, sedimentary, and biological processes, this study enhances understanding of the ecological functioning, resilience, and management needs of transitional aquatic systems. Furthermore, the results establish a valuable baseline for long-term ecological monitoring and for the sustainable management of similar coastal environments subject to natural variability and anthropogenic pressures.
2. Materials and Methods
2.1. Study Area
The Mangalia–Limanu coastal lake lies immediately south of the city of Mangalia, occupying the lower ~9.5 km of a narrow, strongly meandering valley that is 92.5 km long in total; its headwaters and over half of its length (~51 km) are in Bulgaria. The valley is deeply incised into a limestone plateau and hosts several erosion remnants, including three small islands (two near the lake’s head and one in the Albesti forest) and a peninsula connected to the shore by a very narrow isthmus in the lower basin. Historically, the lake was separated from the Black Sea by a sandy barrier—at most ~40 m wide—breached by a narrow channel that drained lake water to the sea. In 1953 the barrier was cut, transforming the lake into an open bay with direct marine exchange. Steep limestone slopes, with the 25 m contour closely tracking the shoreline, provide shelter from prevailing winds. These scarps are dissected by short, ephemeral, V-shaped gullies that debouch onto small alluvial fans colonized by reed clumps; other broader, infilled valleys—likely older generations—are now inactive and form small embayments where lake water penetrates inland. Larger tributaries occur only in the upper reach: Valea Arsa (left bank) and Valea Hagieni (right bank). At their confluence, the Mangalia (Albesti) valley widens into the partially infilled “Baia Izvoarelor,” dotted with floating reed mats (plaur) and two residual hills (~15.1 m and ~13.6 m a.s.l.). Numerous springs and seepages here coalesce into a stream that feeds the bay, whose head is reed-fringed for ~1 km due to fresher inputs and fine infill. Engineering works further partition the system: a dam at the Mangalia–Arsa confluence (1955–1956) created a pond used for irrigation and aquaculture, and an earthen dam built in 1969 (near Valea Balar) formed a ~1.5 km pond that limits saline intrusion upstream. Today, three water bodies align the valley: Mangalia Lake (downstream), Limanu pond (near Limanu village), and Hagieni pond (≈1 km farther upstream). The total catchment is ~784 km
2, of which ~278 km
2 lie in Romania [
10].
2.2. Physico-Chemical Parameters of Water
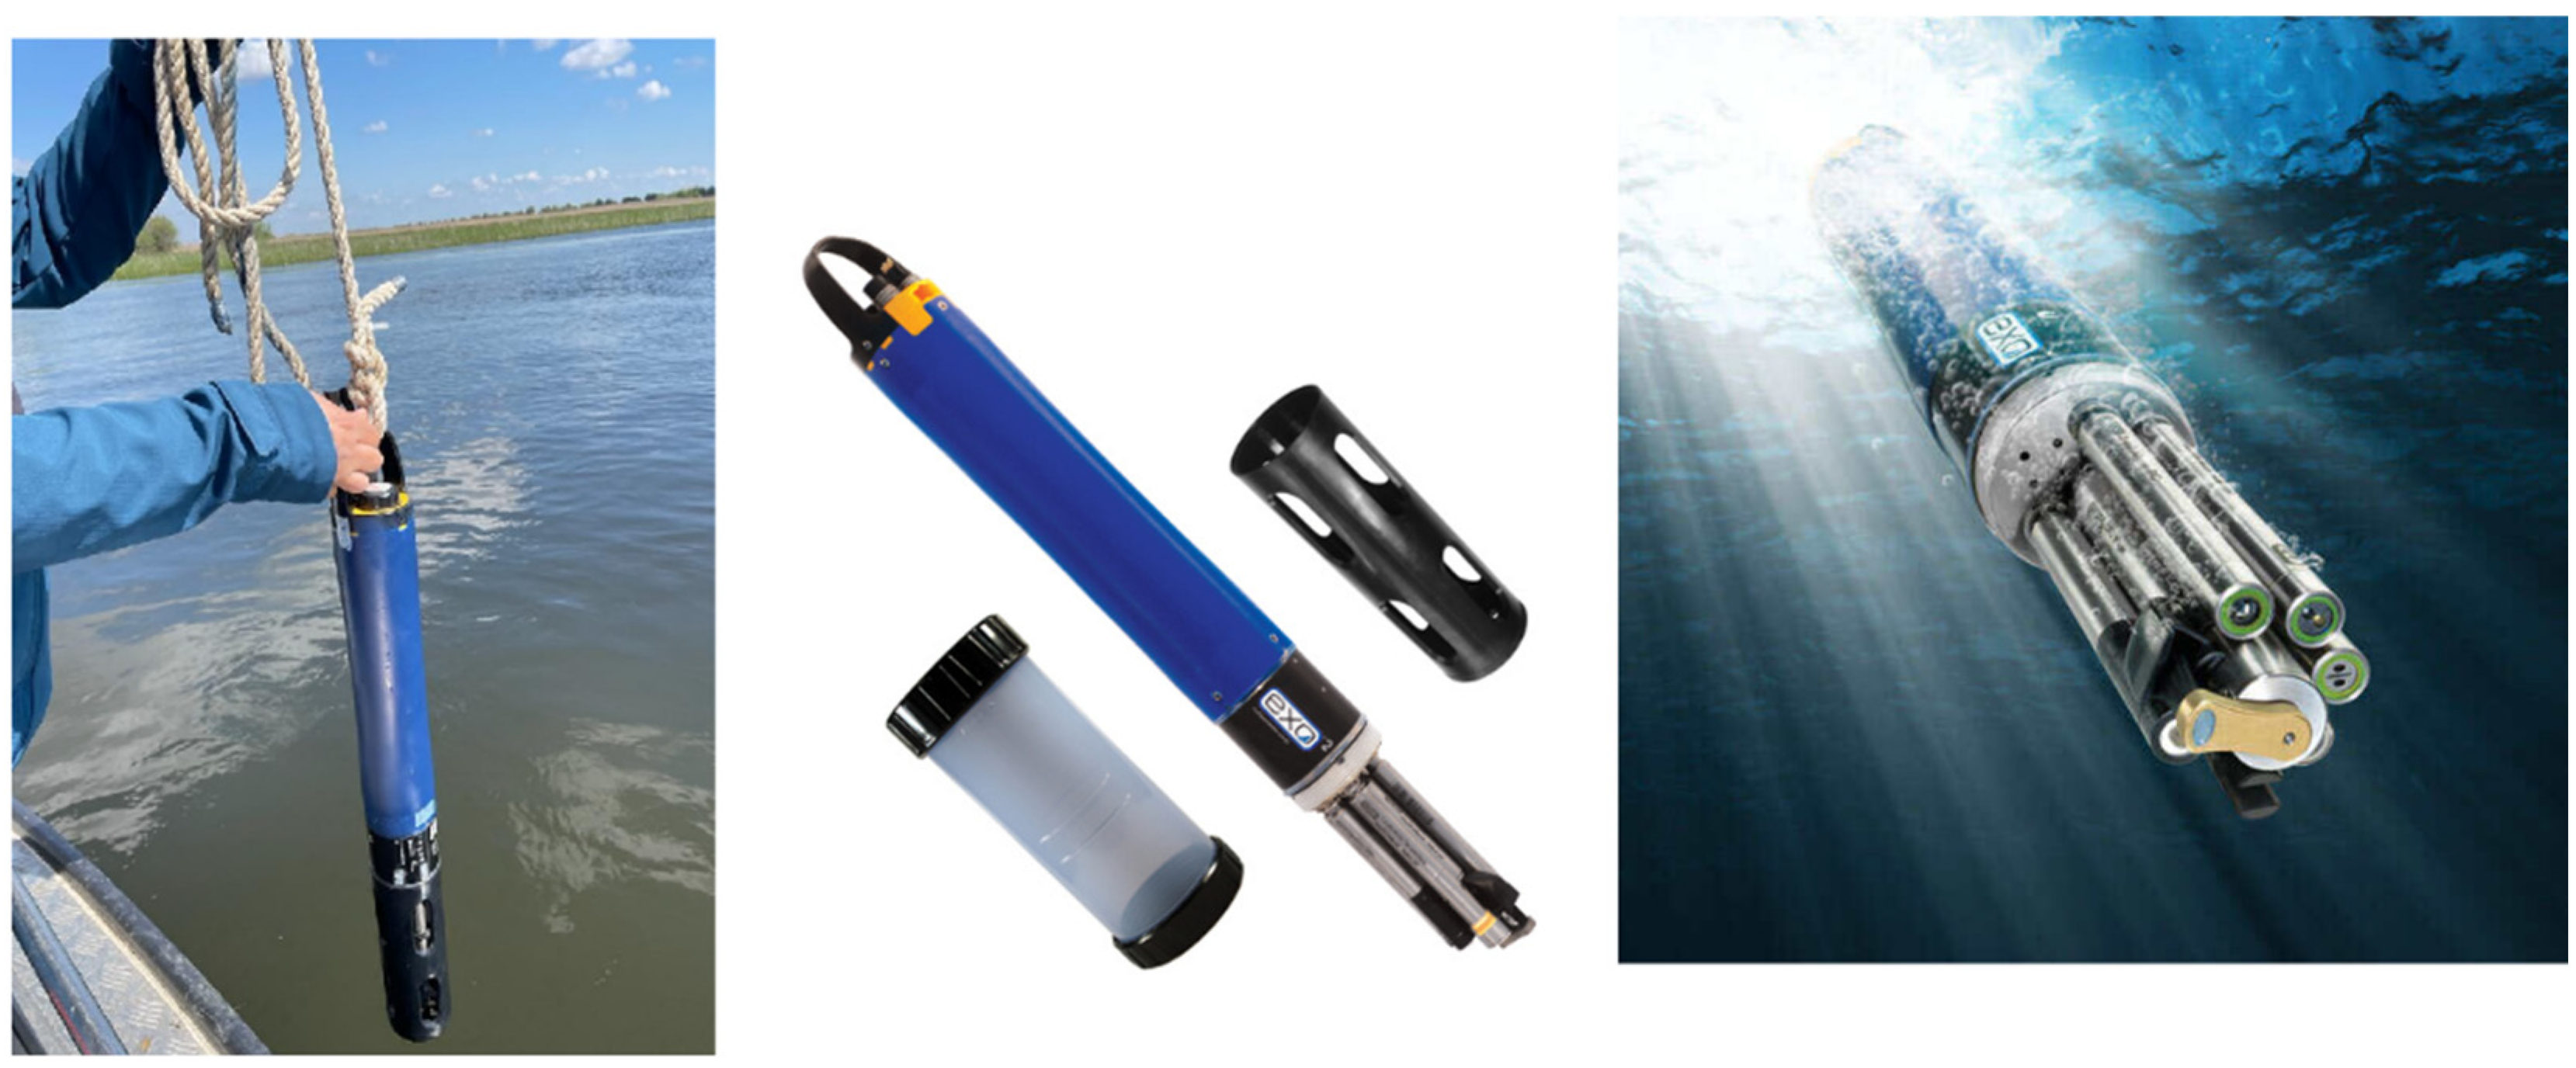
Field characterization of surface-water quality was performed in situ with a multiparameter sonde (EXO2, YSI, Yellow Springs, OH, USA) (
Figure 1). The instrument hosts advanced physical, optical, and electrochemical sensors, enabling measurements across a broad suite of indicators [
20]. The monitored variables included water temperature (°C), pH (pH units), turbidity (FNU), electrical conductivity (µS·cm
−1), total dissolved solids (mg·L
−1), salinity (PSU), dissolved oxygen as concentration (mg·L
−1) and saturation (%), oxidation–reduction potential (mV), nitrate by NitraLED (mg·L
−1), chlorophyll a (RFU), and total algal fluorescence (TAL-PC, RFU).
Water-quality status was assigned under the Romanian Order no. 161/2006 [
21], which defines five classes: I (very good), II (good), III (moderate), IV (poor), and V (bad). The assessment integrates national criteria with the European Water Framework Directive (2000/60/EC) [
22], ensuring alignment with EU objectives for ecological/chemical status, sustainable resource management, and protection of aquatic-ecosystem health. All physico-chemical determinations followed harmonized methodologies: Standard method SR EN ISO 5667-1:2023 [
23] for sampling, SR EN ISO 10523:2012 [
24] for pH, and SR EN ISO 5814:2013 [
25] for dissolved oxygen.
Instrument Calibration and Data Validation
Prior to each field survey, all EXO2 sensors (YSI Inc., Ohio, USA) were calibrated in standard calibration solutions according to the manufacturer’s protocols and relevant ISO procedures [
23,
24,
25]. The dissolved oxygen sensor was calibrated immediately before each set of measurements using air-saturated water to ensure high accuracy of in situ readings. Additional calibrations were performed for pH, conductivity, turbidity, and chlorophyll sensors using certified reference standards. Post-deployment checks were carried out to verify sensor stability and detect potential drift. The results obtained in the field were subsequently compared and validated against laboratory determinations performed at the GeoEcoMar Institute, ensuring consistency and reliability of the recorded data.
2.3. Sediment Sample Collection and Analysis
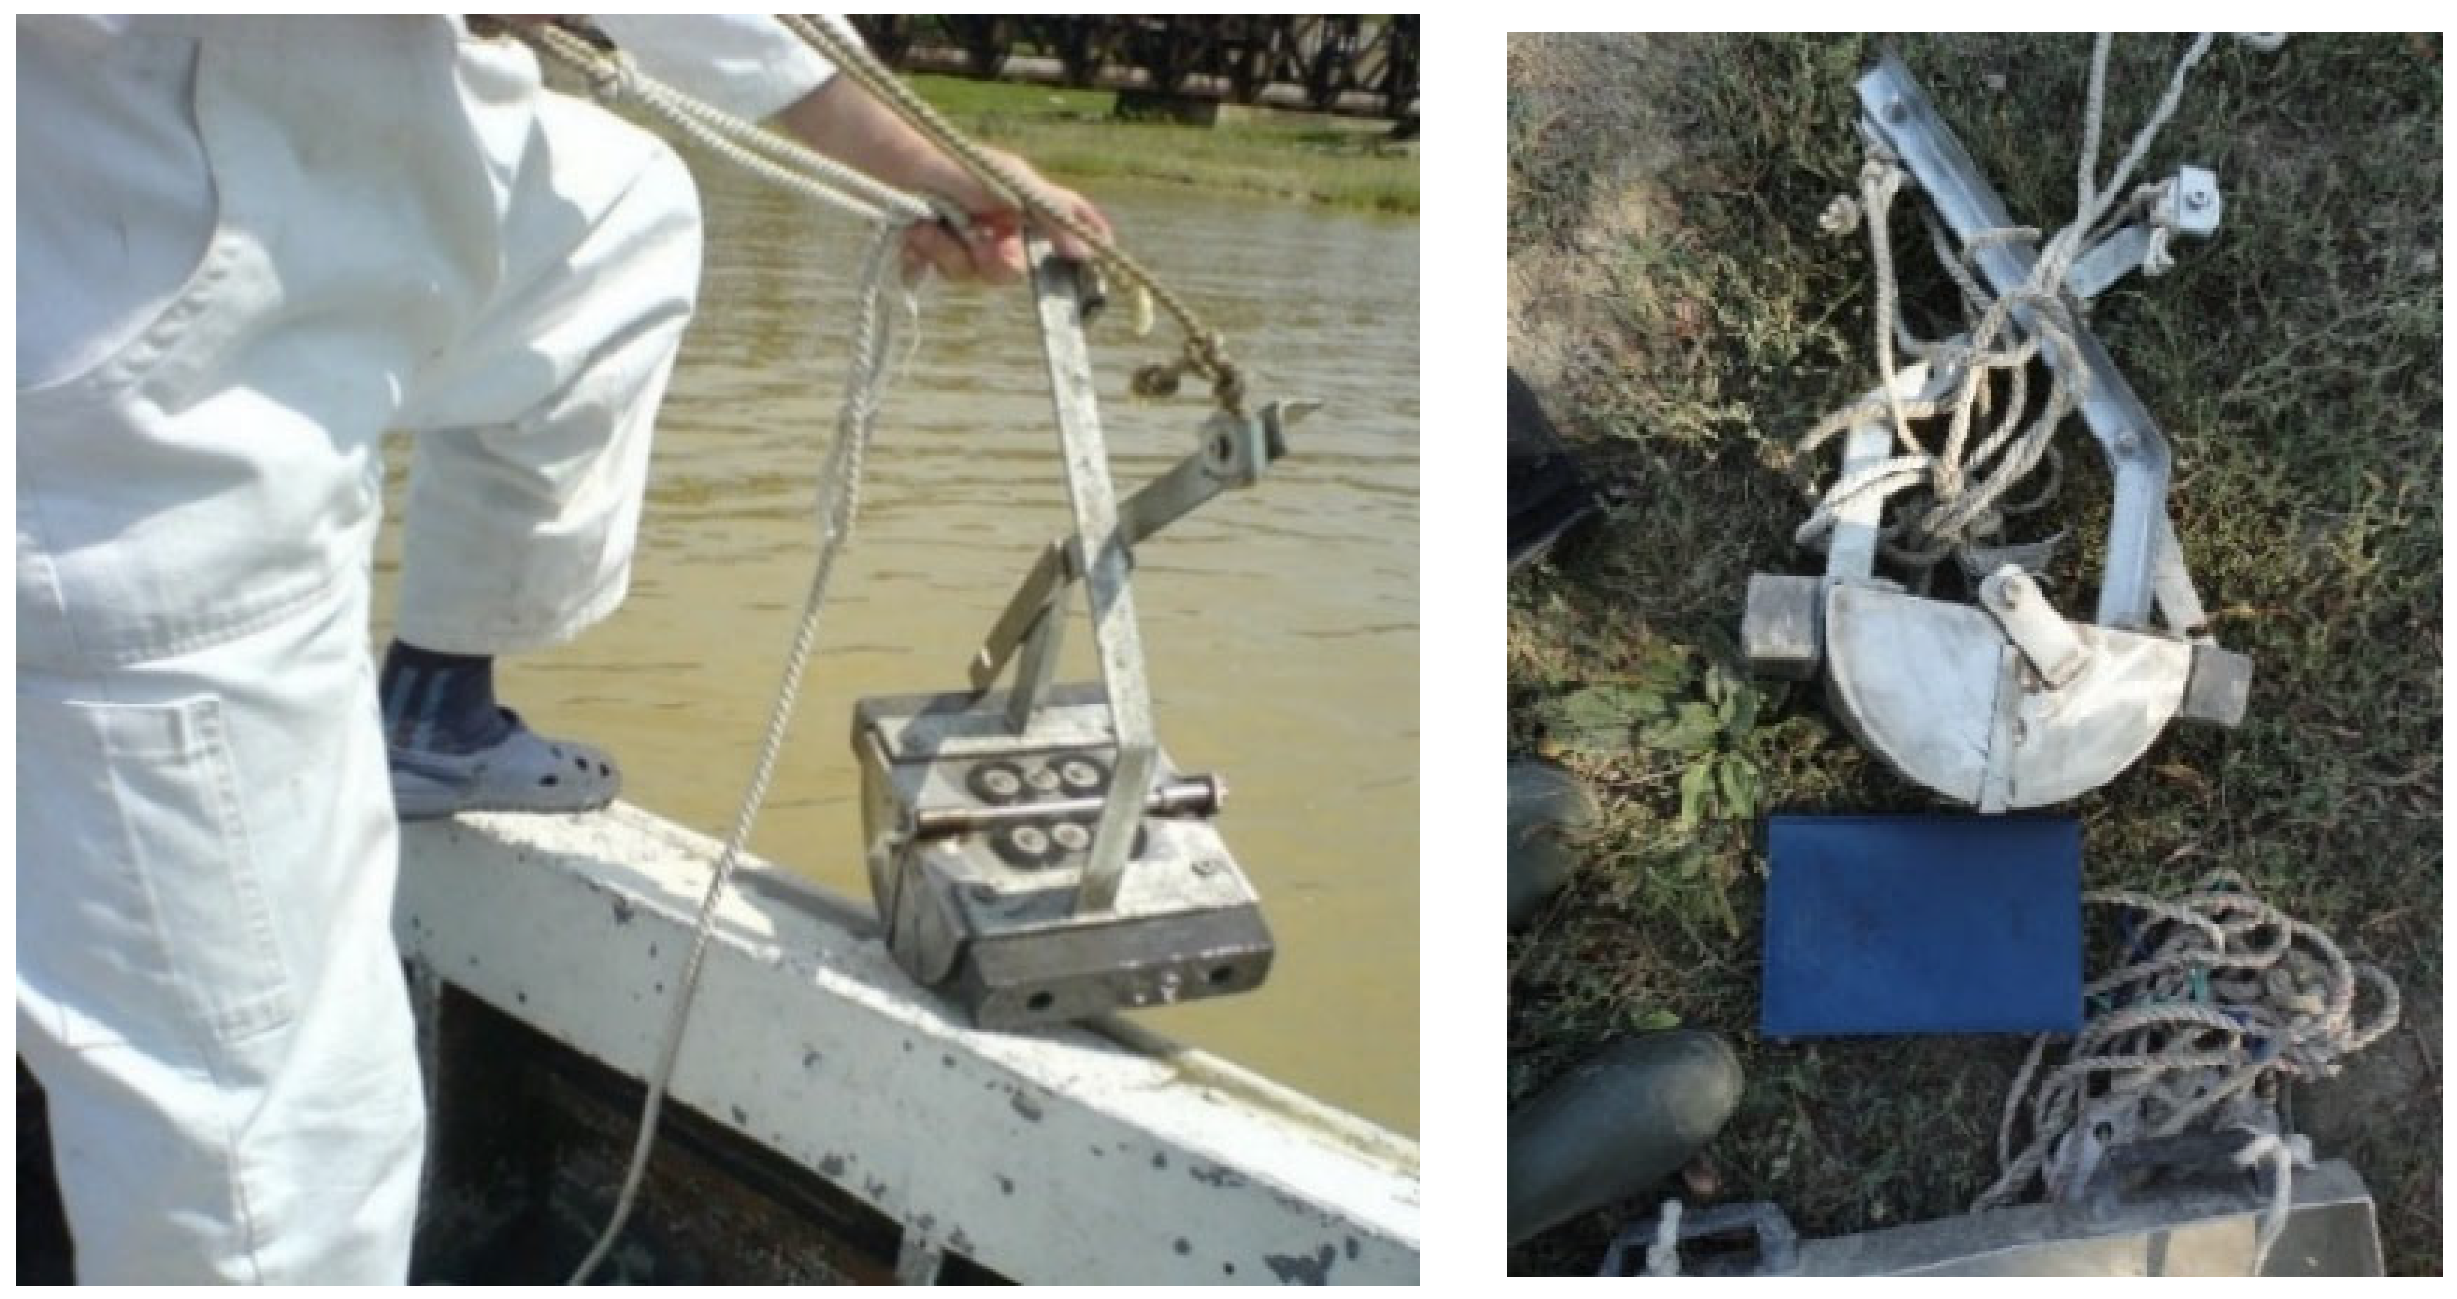
Sediments for sedimentological, geochemical, and biological (macrozoobenthic) investigations were collected with a Van Veen grab sampler, following SR EN ISO 10870:2012 [
26]. To express ecological indices per square meter, organism counts were scaled with an area-conversion factor of 25.2 (
Figure 2).
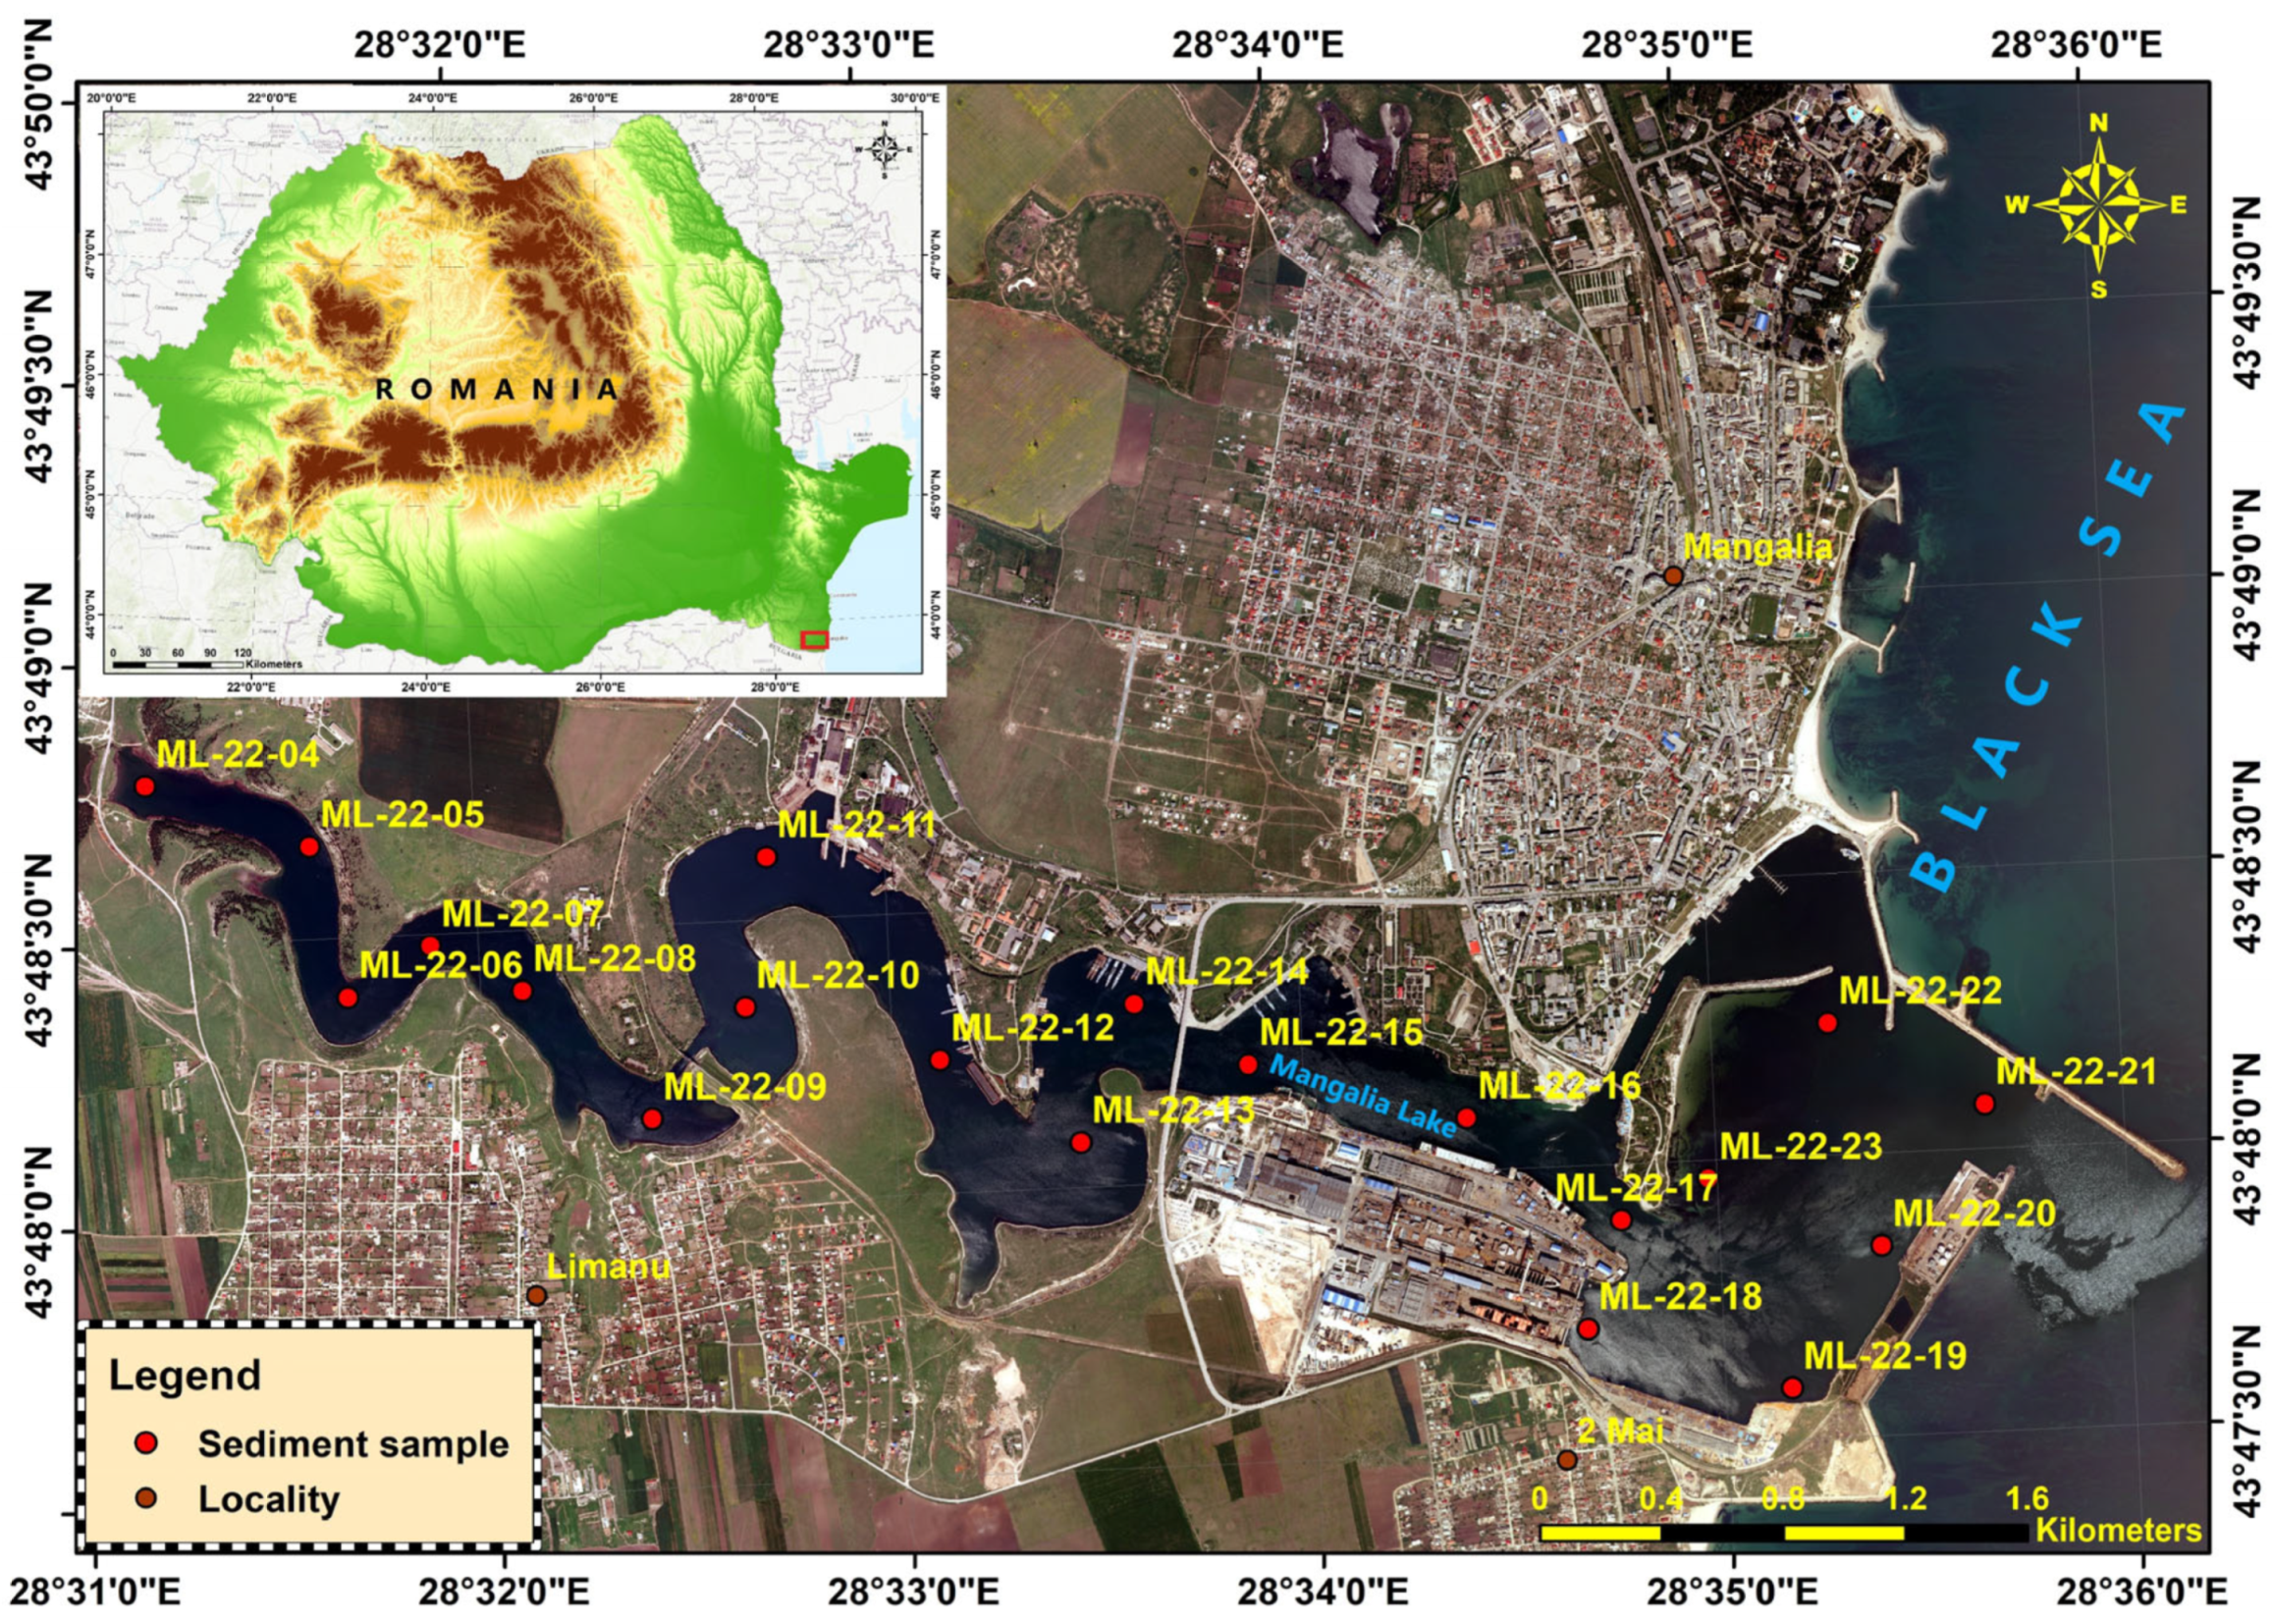
Between 4 and 10 July 2022, were collected 20 sediment samples for detailed lithological characterization of substrate composition and texture; in addition to lithology, these samples were analyzed for heavy metals to assess geochemical status and potential contamination. In parallel, a further 12 grabs were dedicated to macrozoobenthic community assessment to evaluate ecological status and biodiversity within the surveyed water bodies (
Figure 3).
2.4. Lithological Analysis
The sediments were characterized for their principal lithological fractions—water content (WC%), dry matter (DM%), total organic matter (TOM%), total carbonates (CAR%), and the residual siliciclastic portion (SIL%)—using standard sedimentological procedures (Standard method ASTM-D2216 (2010) [
27].
Loss on Drying (LOD). Moisture and dry residue were quantified gravimetrically by oven-drying at 105 °C, with sequential weighings before and after drying [
28]. The percentage mass loss represents water content, while the remaining mass defines DM%. In aquatic settings, water content commonly spans ~30–50% for mineral-rich deposits and can reach 95–99% in highly organic sediments; DM% provides a proxy for degree of compaction.
Loss on Ignition (LOI). TOM, CAR, and SIL were determined by sequential ignition in a muffle furnace (SNOL 8.2/1100) [
29,
30] Organic matter was estimated from mass loss at 550 °C, and carbonate content from additional loss at 950–1000 °C. Sediments are often described by OM thresholds derived at 550 °C, with mineral sediments typically <15–30% OM and organic-rich sediments exceeding ~15–30% OM [
31]. Carbonate content (from the 950–1000 °C step) is commonly grouped as non-carbonate (≤10% CaCO
3), slightly carbonate (10–30% CaCO
3), and carbonate (>30% CaCO
3). [
15,
32] The siliciclastic fraction corresponds to the residual dry mass after removal of organic matter and carbonates.
2.5. Geochemistry Analysis
X-ray fluorescence (XRF) is a non-destructive analytical technique used here for quantitative determination of heavy metals in sediments at mg kg−1 (ppm) levels. A primary X-ray beam from an X-ray tube irradiates the sample; atoms in the matrix emit fluorescent X-rays at discrete, element-specific energies. Elemental identification is achieved from the energy of these lines, while quantification is based on line intensities against appropriate calibrations. Measurements were performed with an energy-dispersive XRF spectrometer (Benchtop XEPOS C, SPECTRO), which provides a fully enclosed X-ray path with complete operator shielding. The instrument supports operation under vacuum, helium purge, or ambient air and enables simultaneous multi-element analysis across a broad atomic range (approximately Na–U). Target analytes included Fe2O3 (total), MnO, Co, Ni, Cu, Zn, Pb, Cd, Cr, Rb, Sr, Zr, and V. Major components are reported as oxides (e.g., Fe2O3, MnO), while trace metals are expressed as total elemental concentrations. The system’s analytical range extends from sub-ppm/ppb (depending on element, matrix, and counting time) up to 100%. A high-resolution detector optimized for count rate is coupled to a digital multichannel analyzer with on-board processing and memory, enabling robust data acquisition and transfer. Quantification relied on empirically derived calibrations tailored to the sediment matrix, with software-implemented corrections for spectral line overlap and matrix effects. All measurements were conducted under standard laboratory conditions (18–28 °C; ≤75% non-condensing relative humidity).
The chemical analyses in this study aimed to determine the concentration and spatial distribution of key elements and compounds within the sediments, which serve as indicators of geochemical conditions and potential contamination. The procedure involved the use of X-ray fluorescence (XRF), a non-destructive analytical technique that identifies and quantifies elements based on the characteristic fluorescent X-rays emitted when a sample is exposed to an X-ray beam. This method enables simultaneous detection of major and trace metals, such as Fe, Mn, Ni, Cu, Zn, Pb, and Cr, with high accuracy and reproducibility. Complementary gravimetric methods—loss on drying (LOD) and loss on ignition (LOI)—were applied to determine moisture, organic matter, and carbonate content, thereby providing context for the geochemical data. Together, these techniques allowed for a comprehensive interpretation of sediment composition and its relationship to hydrological and ecological processes within the Mangalia–Limanu system.
2.6. Analysis of Biological Samples
To assess the ecological status of benthic communities in the Mangalia–Limanu coastal lake (SE Romania), we applied a multihabitat sampling protocol adapted from the AQEM approach, the European framework used in Romanian monitoring programs. During fieldwork, quantitative and qualitative zoobenthic samples were collected with a Van Veen grab and a limnological net, selected according to substrate heterogeneity. All habitat types occupying >5% of the site were mapped and classified following SR EN ISO 16150:2012 [
33]. Grab material (sediment plus fauna) was rinsed on site through the limnological net and transferred to plastic jars. Samples were fixed and preserved with 4% buffered formaldehyde stained with Congo Red or Rose Bengal to facilitate sorting. For each microhabitat, three replicate grabs were taken. In the laboratory, processing followed European standard procedures SR EN ISO 10870: 2012 [
26]: sediments were wet-sieved through 1.00, 0.50, and 0.250 mm meshes to separate macro-, meio-, and microfaunal fractions. Organisms were sorted and identified under a Carl Zeiss SteREO Discovery V8 stereomicroscope and a Carl Zeiss Axio Star compound microscope, to the lowest practicable taxonomic level using appropriate identification keys. Abundances were counted per sample, averaged across triplicates, and converted to densities (individuals m
−2), by applying the factor corresponding to the area of the mouth of the Van Veen grab used.
2.7. Statistical Analyses
All statistical analyses were performed using PRIMER 7 with the PERMANOVA+ add-on software package [
34], xlSTAT 7.5.2 software [
35], and Past 4 software [
36].
The spatial interpolation of heavy metal concentrations presented in
Figure 4 was carried out using a geostatistical approach to visualize their distribution patterns across the Mangalia–Limanu lake system. The sampling points were georeferenced in the field using TRIMBLE R4 GNSS receivers operating in kinematic mode with Continuous Topo configuration, connected to the national GNSS ROMPOS network via Nearest v.3.1 RTCM for differential correction. All positional data were recorded in the official Stereographic 1970 coordinate system and subsequently exported in .CSV format. Data processing was performed in Global Mapper v.21, where errors were corrected and the points were connected through a polyline later converted into a polygon delineating the lake’s boundary. LANDSAT 8 imagery [
37] was used to refine the mapping of the shoreline and hard-to-access sectors. The geochemical data were then imported into ArcGIS 10, where the Topo to Raster interpolation algorithm (ArcToolbox module) was applied to generate continuous spatial surfaces representing the concentration gradients of each analyzed metal. This method ensures a hydrologically consistent interpolation suitable for environmental datasets characterized by gradual spatial variation.
3. Results
3.1. Analysis of Physicochemical and Chemical Parameters in Water “In Situ” and in the Laboratory
During the ~3 h horizontal transects from station ML-22-04 toward the port water area at ML-22-21, the EXO2 multiparameter sonde recorded a coherent set of signals that delineate a fresh–oligohaline system with vigorous daytime primary production and moderate spatial heterogeneity (
Table 1).
Chlorophyll (RFU). Fluorescence ranged from approximately 0.37 to 11.53 RFU (mean 6.63 RFU; median 6.74 RFU). Patches of elevated signal co-occurred with high daytime pH and oxygen supersaturation, consistent with active photosynthesis by phytoplankton and attached algae under warm, mid-day conditions. Because values are reported in relative fluorescence units, they resolve spatial patterns rather than absolute chlorophyll-a concentrations in the absence of a site-specific calibration.
Dissolved oxygen. DO varied between 7.62 and 19.27 mg L−1 (≈93–233% saturation), with a mean of 14.45 mg L−1 (≈184%). Minima occurred near the starting sector around ML-22-04, whereas higher and sustained supersaturation characterised the latter half of the route toward ML-22-21. Segmenting the series shows a clear spatial increase: in the first quartile the mean was ~10.2 mg L−1 (123%), rising to ~17.4 mg L−1 (210%) in the final quartile. Marked supersaturation (>150–200%) indicates intense daytime photosynthesis, in agreement with warm water (26.6–28.7 °C), elevated pH (mean ~9.1; maximum ~9.4), and a detectable chlorophyll signal (~6–12 RFU). No daytime hypoxia was observed; the overall minimum (~7.6 mg L−1) indicates well-oxygenated conditions throughout the survey. Step-like increases coincide with transitions among embayments or shifts in depth and vegetative cover, rather than sensor artefacts, as concentrations and percent saturation covaried tightly.
Specific conductivity, TDS, and salinity. Conductivity increased markedly along the transect, ranging from 226 to 1732 µS cm−1 (0.23–1.73 mS cm−1), with a mean of ~1623 µS cm−1 and a median of ~1716 µS cm−1. The corresponding TDS varied from ~0.14 to ~1.05 g L−1 and stabilised near ~1.05 g L−1 during most of the survey. EXO-derived practical salinity spanned 0.10–0.81 psu and settled close to 0.8 psu along the brackish reach. The longitudinal pattern is clear: in the first quarter (near ML-22-04) conductivity averaged ~1.15 mS cm−1, with minima down to ~0.23 mS cm−1; from mid-transect onward the water became consistently more mineralised, converging to 1.70–1.73 mS cm−1, and in the final quarter (near ML-22-21) the mean was ~1.72 mS cm−1. Because temperature varied only modestly (≈26.6–28.7 °C), this rise reflects a genuine increase in ionic content rather than a thermal artefact. Marine levels (>10–30 mS cm−1) were not reached, indicating oligohaline conditions and restricted exchange with the sea during the measurement window.
Nitrate (NO3–N). The ion-selective electrode reported raw potentials between ~51 and 147 mV and calculated concentrations from 1.95 to 96.81 mg L−1 (median 2.15 mg L−1). The very high, short-lived spikes in calculated concentration occurred during low-conductivity segments at the start of the transect and are likely influenced by matrix effects and cross-sensitivities typical of ISE sensors in low-ionic-strength/brackish waters. The mV trend itself suggests generally higher nitrate activity upstream within the Limans and lower toward the port water area.
Phycocyanin (total-algae channel, RFU). Phycocyanin fluorescence ranged from 0.71 to 8.78 RFU (mean 5.72 RFU). Spatial variability broadly paralleled the chlorophyll pattern and the high pH/DO sectors, indicating an active cyanobacterial component but not an extreme bloom during the survey period. As for chlorophyll, RFU units indicate relative intensity rather than absolute pigment concentration.
Turbidity (NTU). Turbidity was generally moderate, spanning 8.06–70.63 NTU (median 11.6 NTU). Peaks were brief and coincided with hydrodynamic transitions and proximity to infrastructure, consistent with localized resuspension rather than widespread water column turbidity.
pH. Waters were alkaline for most of the transect (7.28–9.39; mean 9.10; median 9.19). The progressive rise toward the middle–late segments, together with oxygen supersaturation, indicates strong daytime CO2 uptake by the photosynthesising community.
Temperature (°C). Temperature varied narrowly between 26.6 and 28.7 °C (mean 27.8 °C) and showed a slight increase over the ~3 h survey, consistent with mid-day heating of shallow waters.
The measurements depict a predominantly freshwater to slightly brackish (oligohaline) system that becomes progressively more mineralised downstream, in the port water area, characterized by vigorous daytime photosynthesis (high pH and DO), moderate turbidity, and patchy algal and cyanobacterial biomass. Nitrate patterns inferred from the raw electrode potentials indicate a stronger upstream influence, while the calculated concentrations require validation through discrete laboratory measurements.
3.2. Geochemistry Analysis
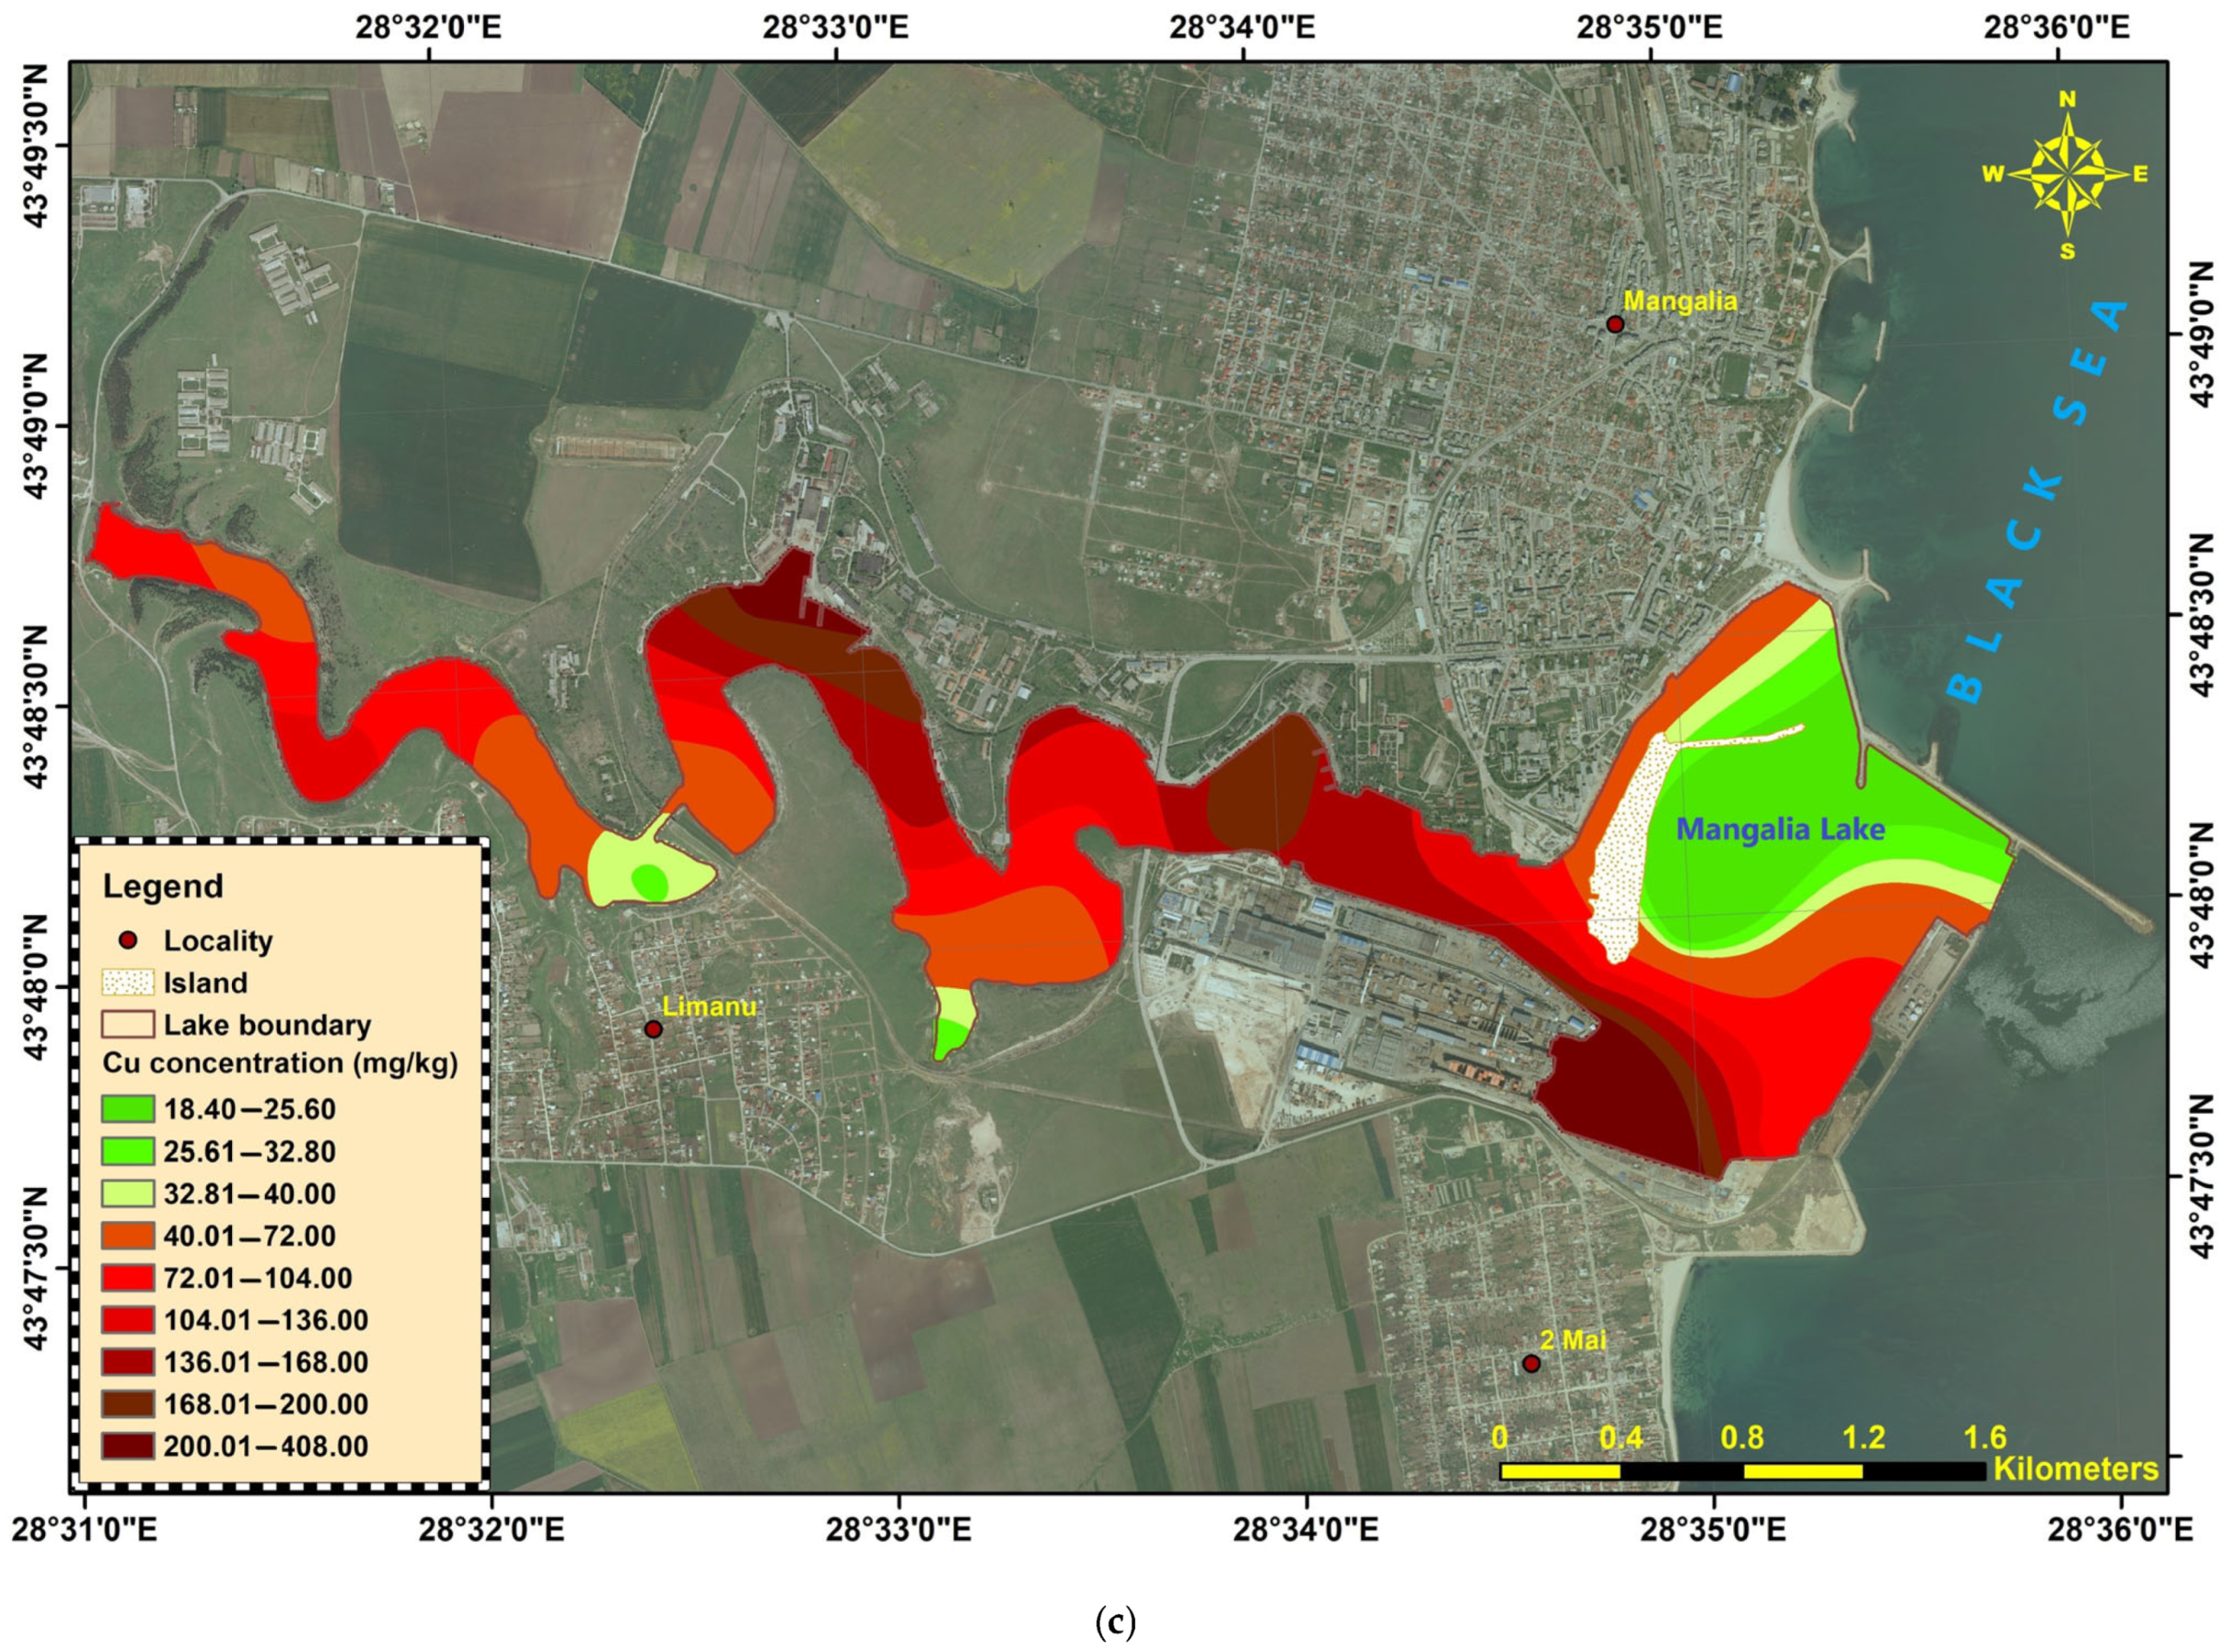
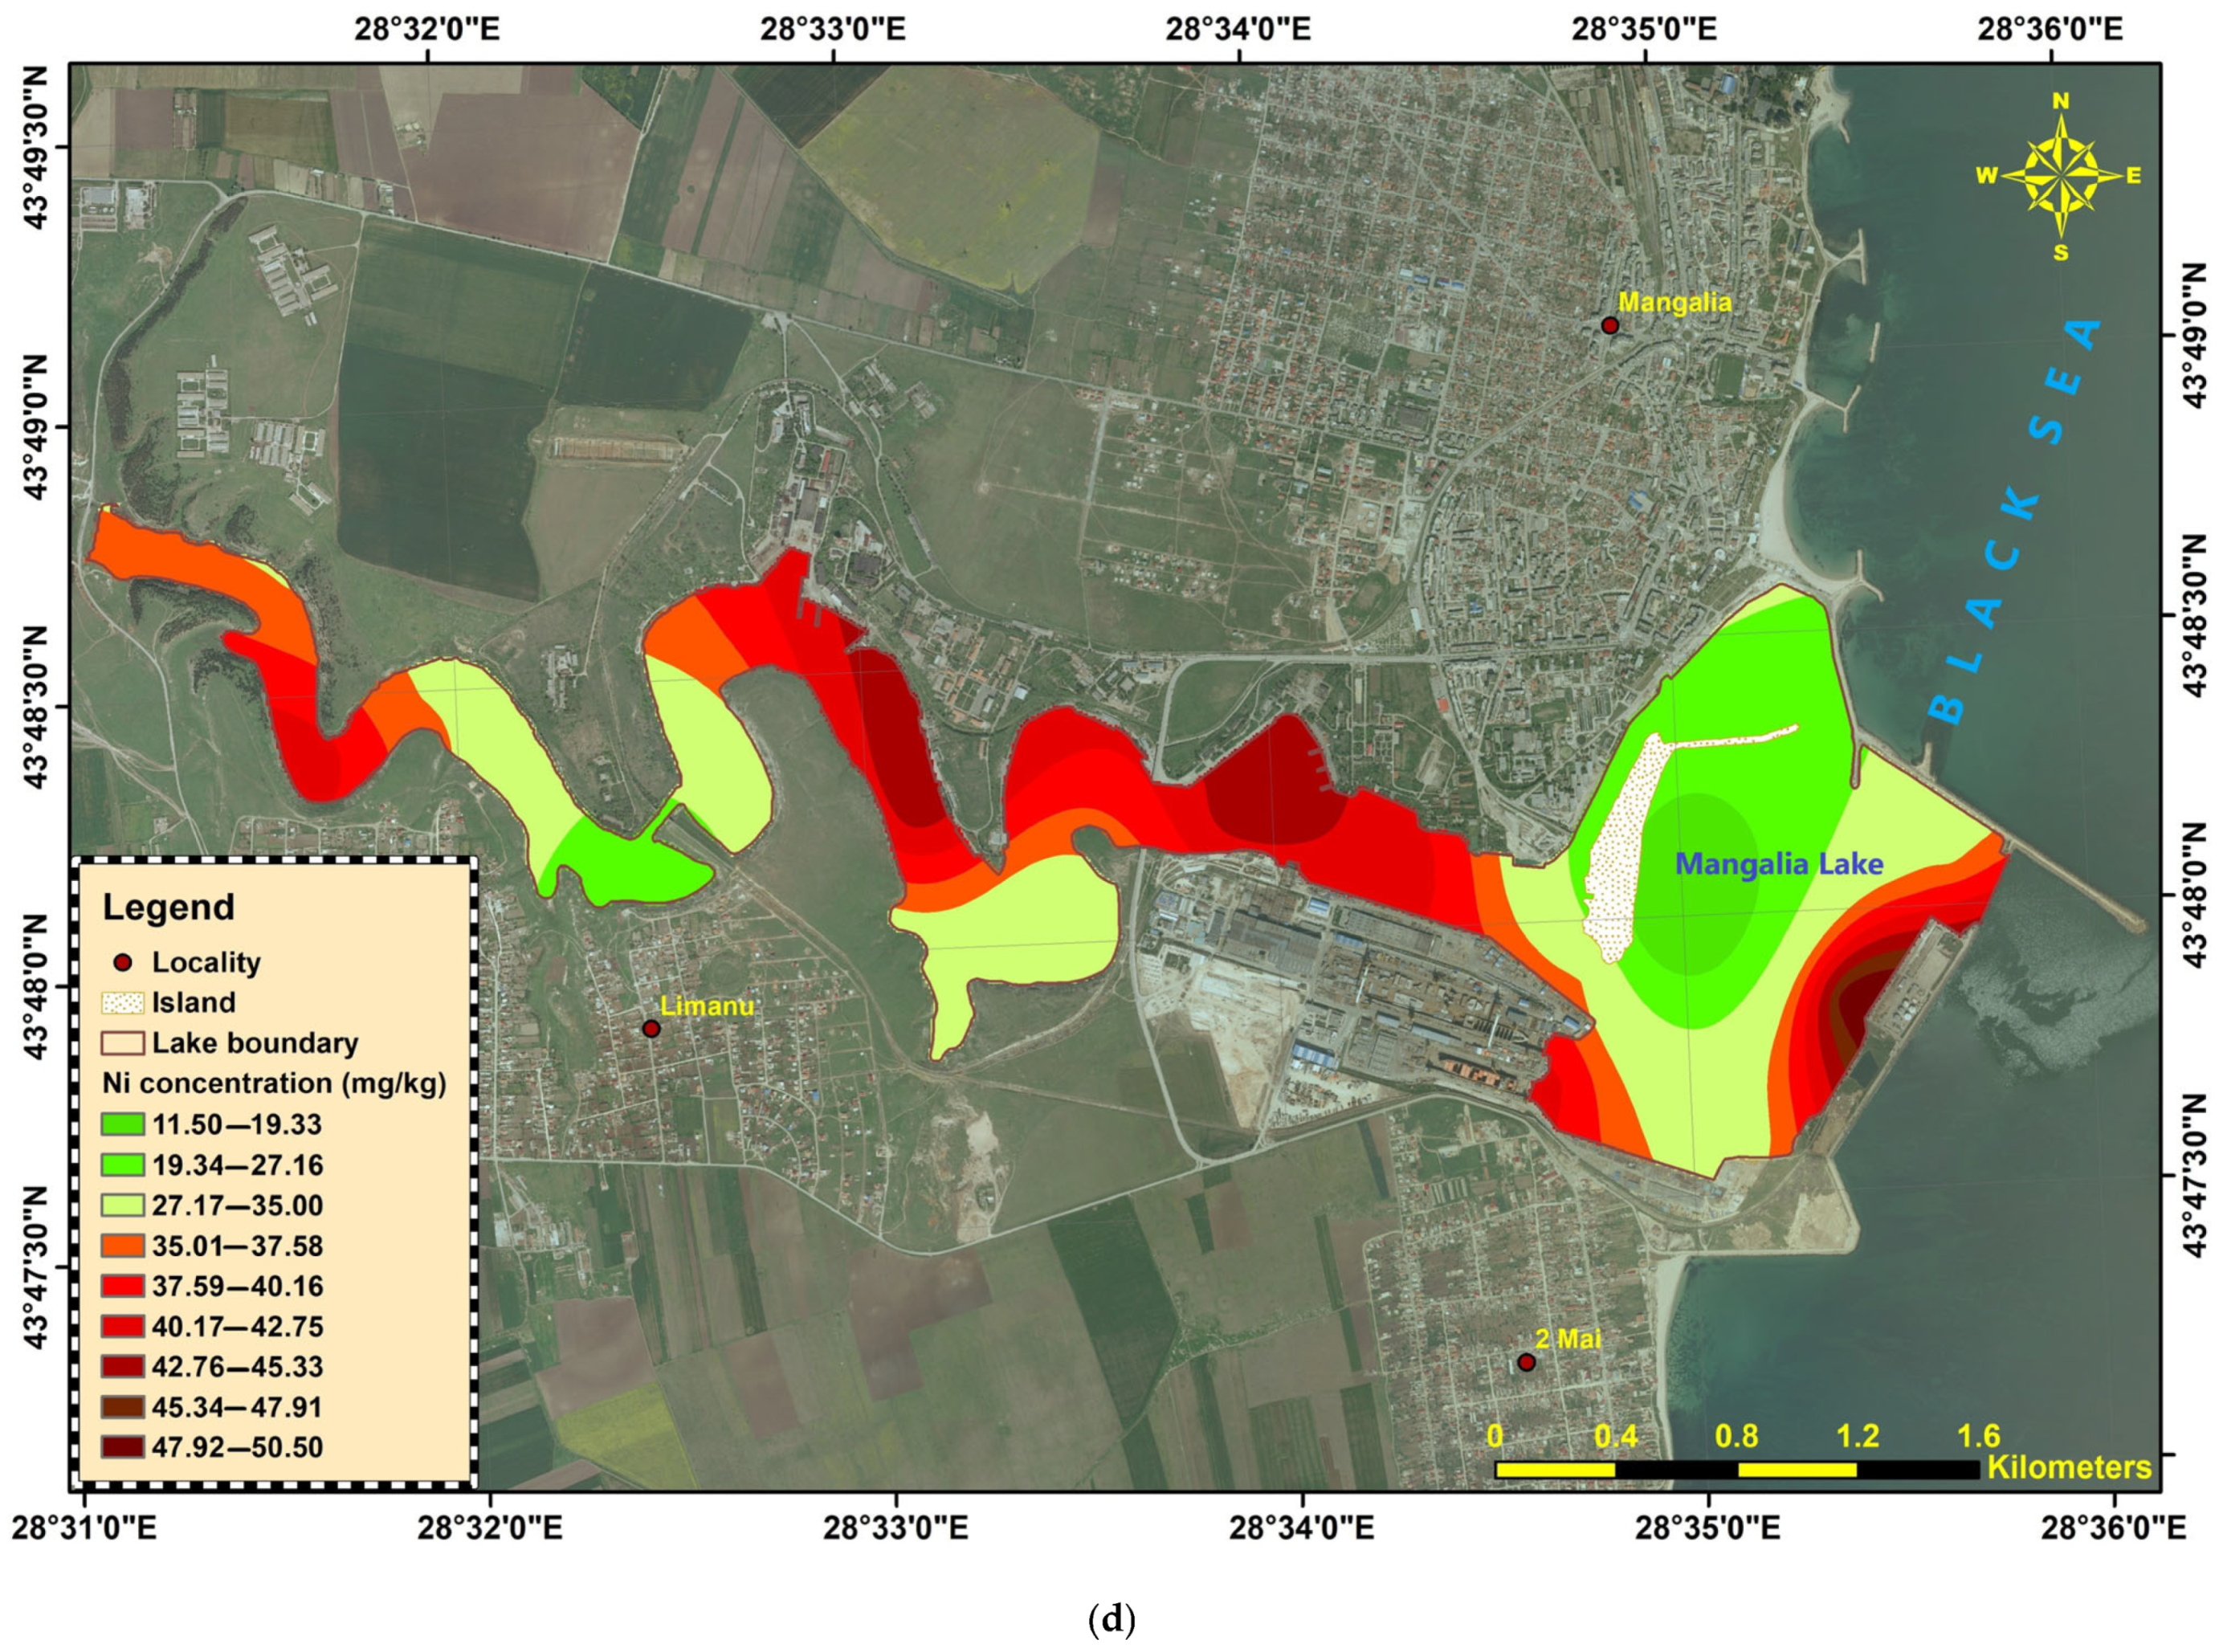
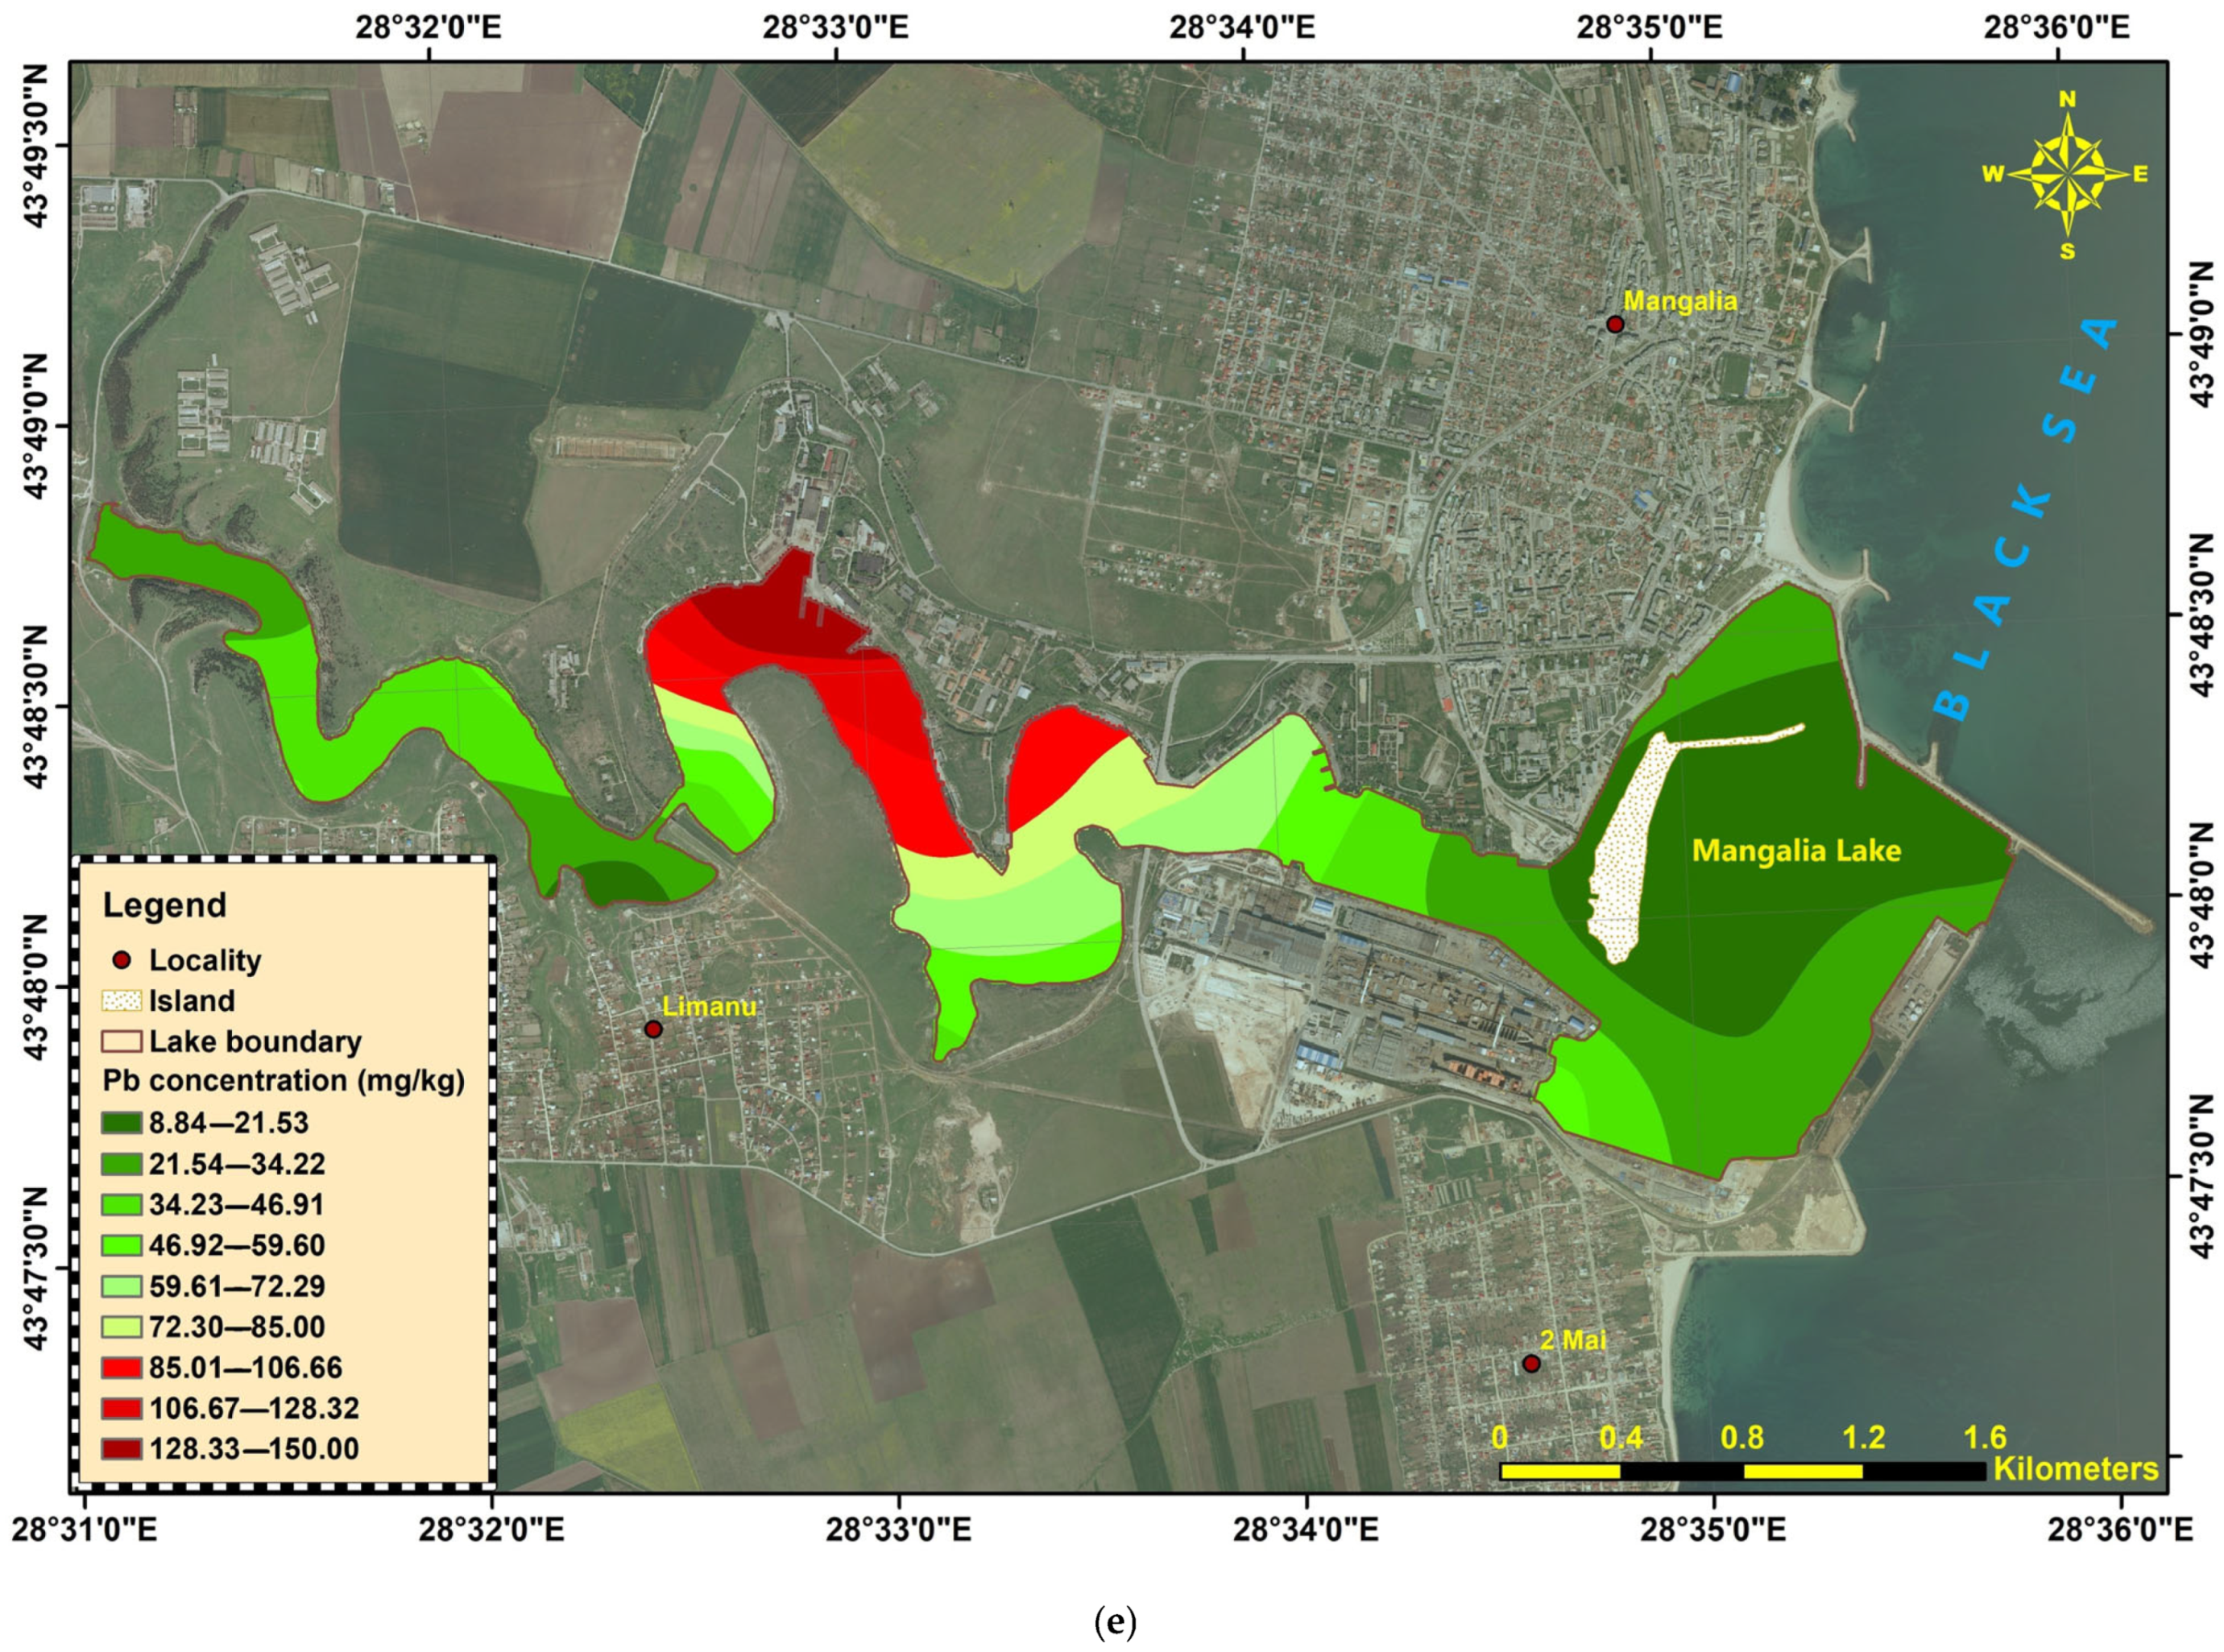
The geochemical analysis of surface sediments from the Mangalia–Limanu system shows marked spatial variability in heavy metal concentrations, which were compared against the threshold values stipulated by Order no. 161/2006 (Cr 100 mg/kg, Ni 35 mg/kg, Cu 40 mg/kg, Zn 150 mg/kg, As 29 mg/kg, Pb 85 mg/kg).
Arsenic (As) values were much lower than the 29 mg/kg threshold, ranging only from 2.54 to 16.48 mg/kg, showing no ecological concern (
Figure 4a).
Chromium (Cr) concentrations ranged from 46.8 to 216 mg/kg. Most stations in the upper and central sectors (ML-22-04 to ML-22-15) showed values below the regulatory limit, but several downstream sites, in the port water area (ML-22-16 to ML-22-19) exceeded it substantially, with the highest value at ML-22-18 (216 mg/kg) (
Figure 4b).
Copper (Cu) showed a broad range from 18.4 to 408 mg/kg, with numerous stations far above the 40 mg/kg limit. Exceptionally high levels were measured at ML-22-11 (198 mg/kg), ML-22-12 (143 mg/kg), ML-22-15 (176 mg/kg), and especially ML-22-18 (408 mg/kg), indicating potential point-source inputs or local accumulation hotspots (
Figure 4c).
Nickel (Ni). Concentrations ranged from 11.5 to 50.5 mg/kg. Values above the 35 mg/kg threshold (Order 161/2006) occurred at several sites—ML-22-06, ML-22-11, ML-22-12, ML-22-14 to ML-22-18, and ML-22-20. These exceedances are modest in magnitude and are plausibly geogenic: the natural abundance of Ni in the Earth’s crust is ~84 µg/g (≈84 mg/kg), and the regional lithology—greenschists in Dobrogea and basic rocks in the Banat Mountains—is known to impart naturally elevated Ni to derived sediments. Thus, while exceedances are frequent, they likely reflect background inputs from source rocks rather than clear anthropogenic enrichment (
Figure 4d);
Lead (Pb) ranged from 8.84 to 150 mg/kg. The highest concentrations occurred at ML-22-11 (150 mg/kg) and ML-22-12 (98.3 mg/kg), clearly surpassing the 85 mg/kg limit, while several upstream and downstream stations remained well below the threshold (
Figure 4e).
Zinc (Zn) concentrations were consistently elevated, spanning 41.8 to 697 mg/kg, and exceeded the 150 mg/kg limit at nearly all stations except those near the outermost marine sector (ML-22-21 to ML-22-23). Peaks were recorded at ML-22-06 (616 mg/kg), ML-22-11 (697 mg/kg) and ML-22-12 (420 mg/kg) (
Figure 4f).
Figure 4.
Heavy metals distribution in Mangalia-Limanu Lake: (a) As; (b) Cr; (c) Cu; (d) Ni; (e) Pb; (f) Zn.
Figure 4.
Heavy metals distribution in Mangalia-Limanu Lake: (a) As; (b) Cr; (c) Cu; (d) Ni; (e) Pb; (f) Zn.
The sediments show localized hotspots of Cr, Ni, Cu, Zn, and Pb contamination, mainly concentrated in the central–downstream liman and port-adjacent sectors (ML-22-10 to ML-22-18). In contrast, arsenic remained consistently low across the entire system. The widespread exceedances of the national quality standards for several metals highlight the potential for ecological risk in these areas, warranting further investigation of sources and potential bioavailability.
3.3. Lithological Analysis
Mangalia–Limanu lake is a good example of a mixed aquatic environment, an area where freshwater and saline (salt) water merge, creating brackish water, a unique environment with intermediate salt levels. This ecosystem is biologically diverse, featuring species adapted to fluctuating salinity, and is a vital transitional zone between land and sea. Like other aquatic environments, this lake currently faces new environmental issues, especially due to climate change.
The proportions of total organic matter (TOM%), carbonates (CAR%), and siliciclastic material (SIL%) were employed as proxy indicators to infer variations in sediment composition, influenced by both allochthonous and autochthonous inputs. Typically, freshwater and marine sediments (unconsolidated, semi-consolidated, or lithified) consist predominantly of three key components: organic matter, carbonates, and siliciclastic, which together form the solid phase of the sediment [
38]. Analyzing the lithological configuration of aquatic sediments is important, as it provides essential insights into the depositional evolution and development of aquatic systems, while also supporting effective natural resource management and environmental protection efforts.
Lithological analysis can provide valuable insights into the interactions among sediments, water, and vegetation, factors that are essential for effective water resource management and the preservation of sensitive habitats. In this study, the percentage concentrations of the main lithological components (TOM%, CAR%, SIL%) varied quite notably across the sampling sites, depending on their geographic location and underlying lithological characteristics. The specific situations are presented below.
Thus, during July 2022, a total of 20 lake-sediment samples were investigated, revealing different patterns of the main lithological components’ areal distribution inside the Mangalia Lake. The results are shown in
Table 2.
Total Organic Matter Fraction (TOM%). The organic matter present in the investigated lake sediments may originate from two sources. Allochthonous inputs (external, terrestrial sources) may enter the lake basin through plant debris, eroded soil from banks, etc. Otherwise, autochthonous sources are primarily linked to internal lake processes, including primary production from algae, macrophytes, zooplankton, and the decomposition of plant and animal matter. An overall evaluation of the analyzed sediment samples revealed that TOM% is the dominant component in most sampling sites, with values ranging widely from 18.39% to 88.30% of the total dry weight (
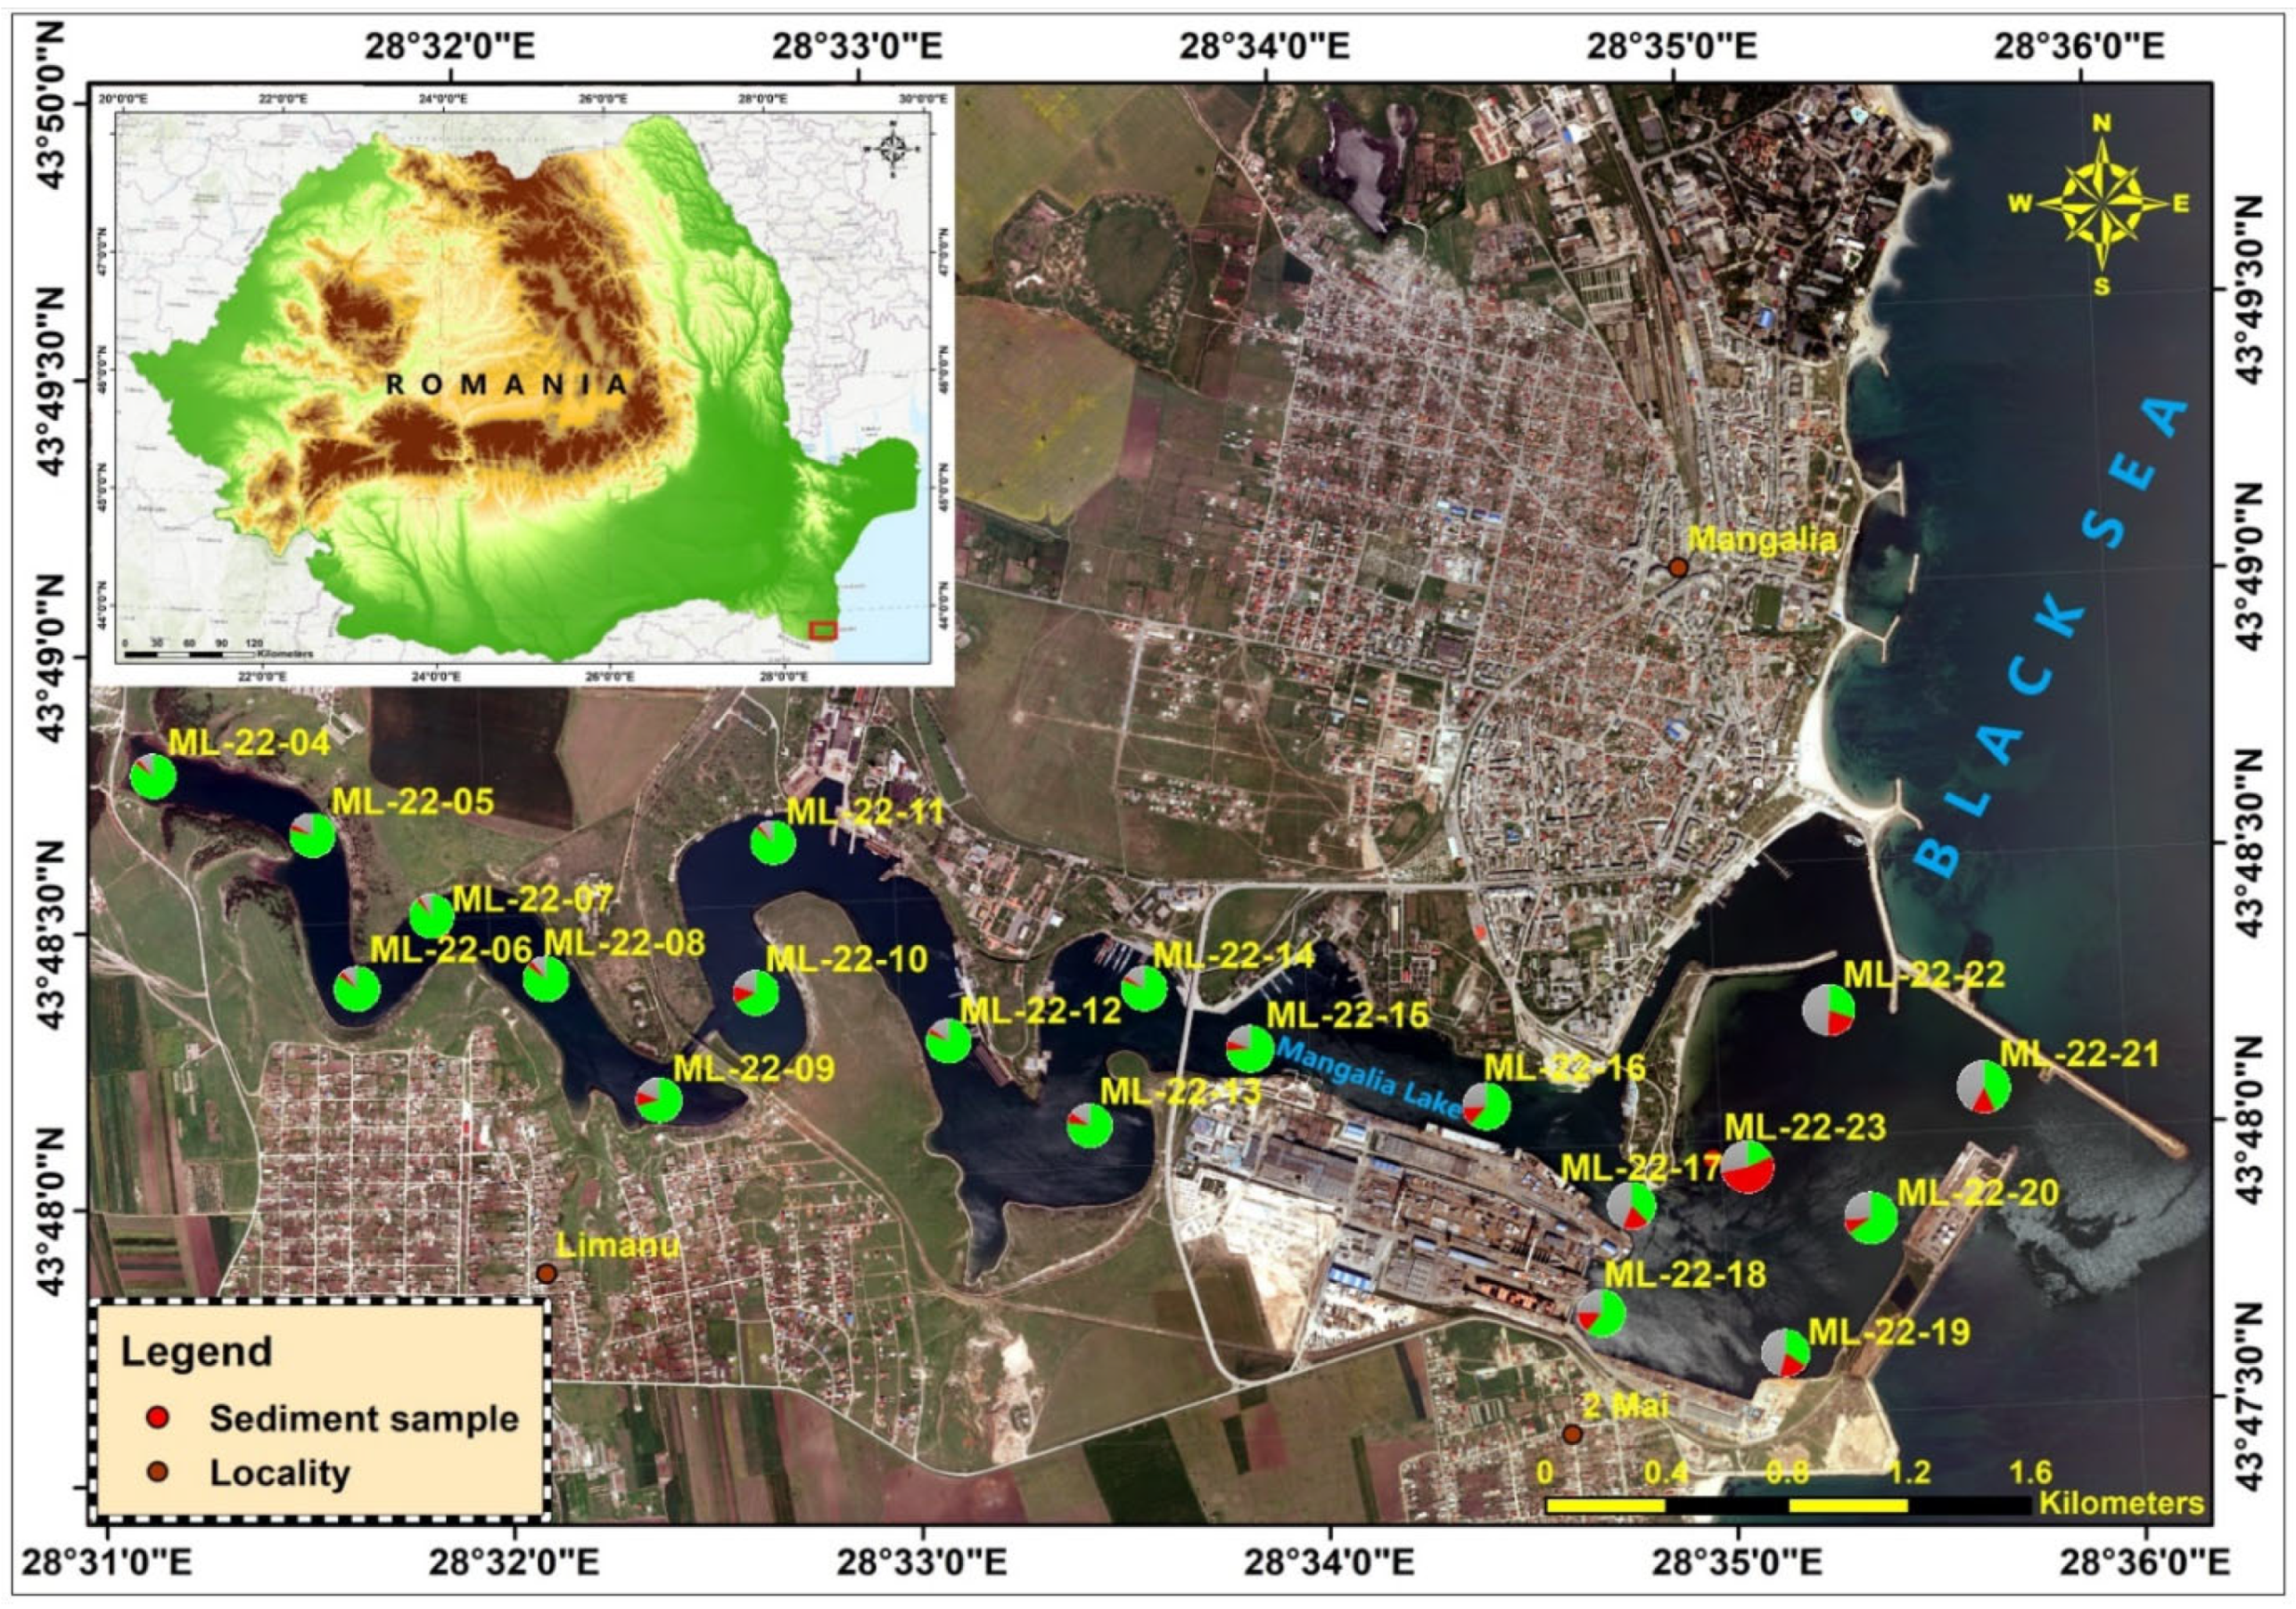
Table 2). The TOM% distribution trend is evident in most of the investigated samples. The highest value was found in the western part of the lake, i.e., ML22-07 (88.30%TOM), whilst the lower value was encountered in the eastern-central part of the lake, i.e., ML22-23 (18.39%TOM) (
Figure 5).
Total Carbonate Fraction (CAR%). Carbonates in aquatic environments can originate from biogenic sources, such as the remains of benthic and pelagic organisms, including skeletal fragments, shells, and shell debris. The inorganic sources may be represented by minerals such as calcite and aragonite. The carbonate content in the investigated sediment samples exhibited quite considerable areal variation across the surveyed sampling sites (
Table 2). The highest value was found in the sample named ML22-23 (53.36%CAR), whilst the lowest value was identified in ML22-11 (2.99%CAR) (
Figure 5). The highest carbonate contents encountered in some samples are linked to shells and shell debris excess within the sediment matrices.
Siliciclastic fraction (SIL%). The siliciclastic content in lake sediments can originate from allochthonous sources, which transport particles from surrounding weathered rocks, soils, and other materials. The autochthonous contribution includes locally generated siliciclastic sediments like sand, silt, and clay formed within the lake’s drainage basin or derived from the marine environment through weathering of shoreline materials, wind, and wave action. Overall, the investigated sampling sites showed relatively low siliciclastic fractions (SIL%) in their investigated sediments (
Table 2), especially in the western part of the lake. The highest value was found in the sample named ML22-22 (49.49%SIL), whilst the lowest value was identified in ML22-07 (8.35%SIL) (
Figure 5).
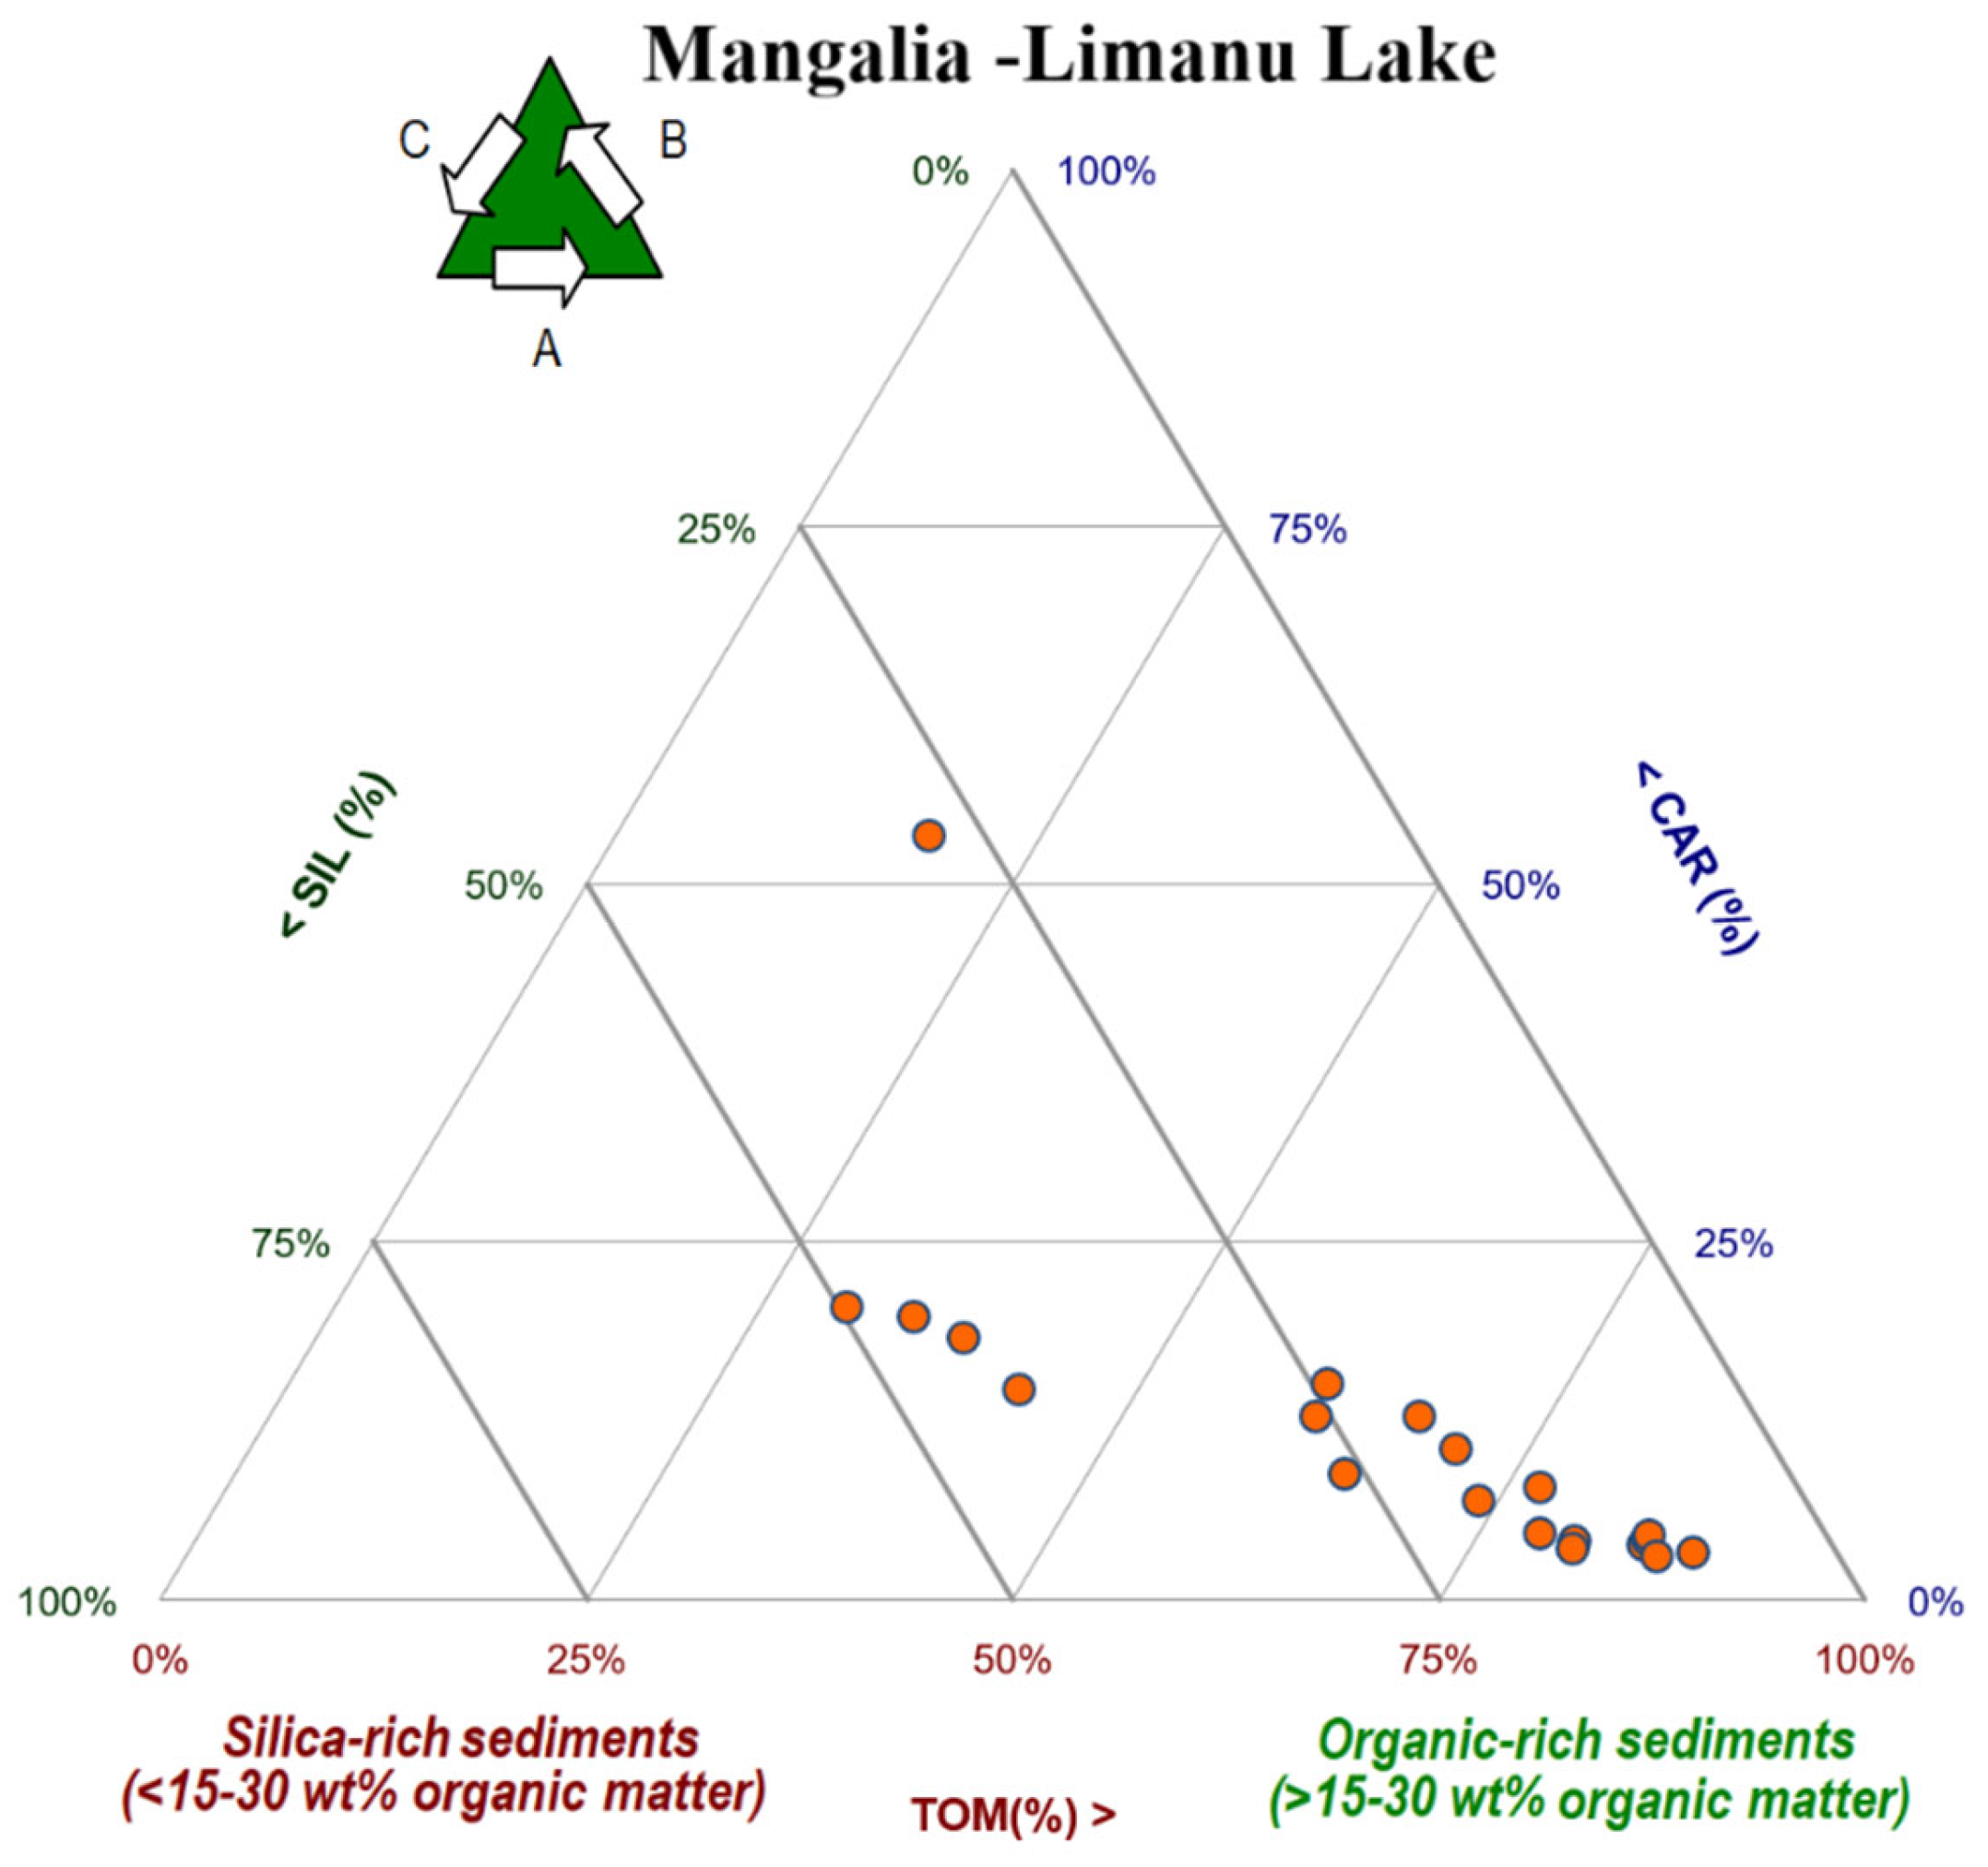
Roundly, pursuant to the organic matter (TOM%) and the siliciclastic (SIL%) fraction (calculated from the total dry sediment weight), the following types of mixed sediments were identified in the investigated Mangalia Lake sediment samples:
the organic-rich sediments, sequentially followed by the
silica-rich sediments (
Figure 6).
- -
organic-rich sediments (>15–30%TOM). From the total of 20 investigated samples, 1 sample had a lower value (<30%TOM), 8 samples fell within a wide range (30–70%TOM), and 11 remaining samples were registered within a large variety of values (>70%TOM).
- -
silica-rich sediments (>15–30%SIL). Involving a total of 20 tested samples, 16 samples had lower values (<30%SIL) and 4 remaining samples fell within a diverse range of values (30–70%SIL).
Further on, in terms of the carbonate content (CAR%), the following types were recognized:
- -
non-carbonated sediment (CAR ≤ 10%). Deducted from the total of 20 analyzed samples, 11 samples had lower values (CAR ≤ 10%).
- -
slightly carbonated sediments (10% < CAR ≤ 30%). Among a total of 20 examined samples, 8 samples had values identified within a slight spectrum of values (10% < CAR ≤ 30%).
- -
calcareous sediments (30% < CAR ≤ 50%) sediments. Over the entire series of 20 tested samples, only one sample had higher values (>50%CAR).
3.4. Analysis of the Benthic Fauna
Understanding biological processes in Mangalia-Limanu Lake requires integrating the physical template with the water regime. Geological–geomorphological context, the distribution and nature of benthic facies, and the lake’s hydrological and hydrochemical conditions jointly shape the mosaic of biotopes and the structure and dynamics of benthic communities. In coastal systems such as Mangalia-Limanu Lake, benthic facies type is a primary driver of community composition, modulated by current velocity and basin depth.
Our faunistic survey of Mangalia-Limanu Lake recorded 26 taxa belonging to 11 major invertebrate groups—Bryozoa, Cnidaria, Oligochaeta, Polychaeta, Gastropoda, Bivalvia, Tanaidacea, Amphipoda, Cumacea, Chironomidae larvae, and Decapoda (
Table 3).
In Mangalia–Limanu Lake, the benthic fauna comprised annelids, mollusks, crustaceans, and insect larvae. Among annelids, polychaetes dominated numerically (average density: 336 ind. m−2), followed by oligochaetes (14.7 ind. m−2). Polychaete taxa recorded included Glycera tridactyla, Mellina palmata, Ficopomatus enigmaticus, Lagis koreni, and representatives of the family Nereidae.
Mollusks were represented by a limited set of species. Marine gastropods such as Cerithidium sp., Bittium sp., and members of the family Rissoidae were present alongside the freshwater gastropod Stagnicola lacustris. Bivalves included Cerastoderma glaucum, Pholas dactylus, Abra nitida, Abra alba, Mytilus galloprovincialis, and Mytilaster lineatus.
Crustacean diversity was modest in terms of taxa of gammarids and corophiids, yet these Pontic–Caspian relicts formed conspicuous aggregations adapted to the local conditions. The amphipod Corophium curvispinum was the dominant form throughout the study area, and the marine amphipod Ampelisca sarsi was also recorded. Additional groups included Tanaidacea and Cumacea. Insect larvae were represented exclusively by Chironomidae.
The overall average density of benthic populations in Mangalia–Limanu Lake was 28,501.2 ind. m
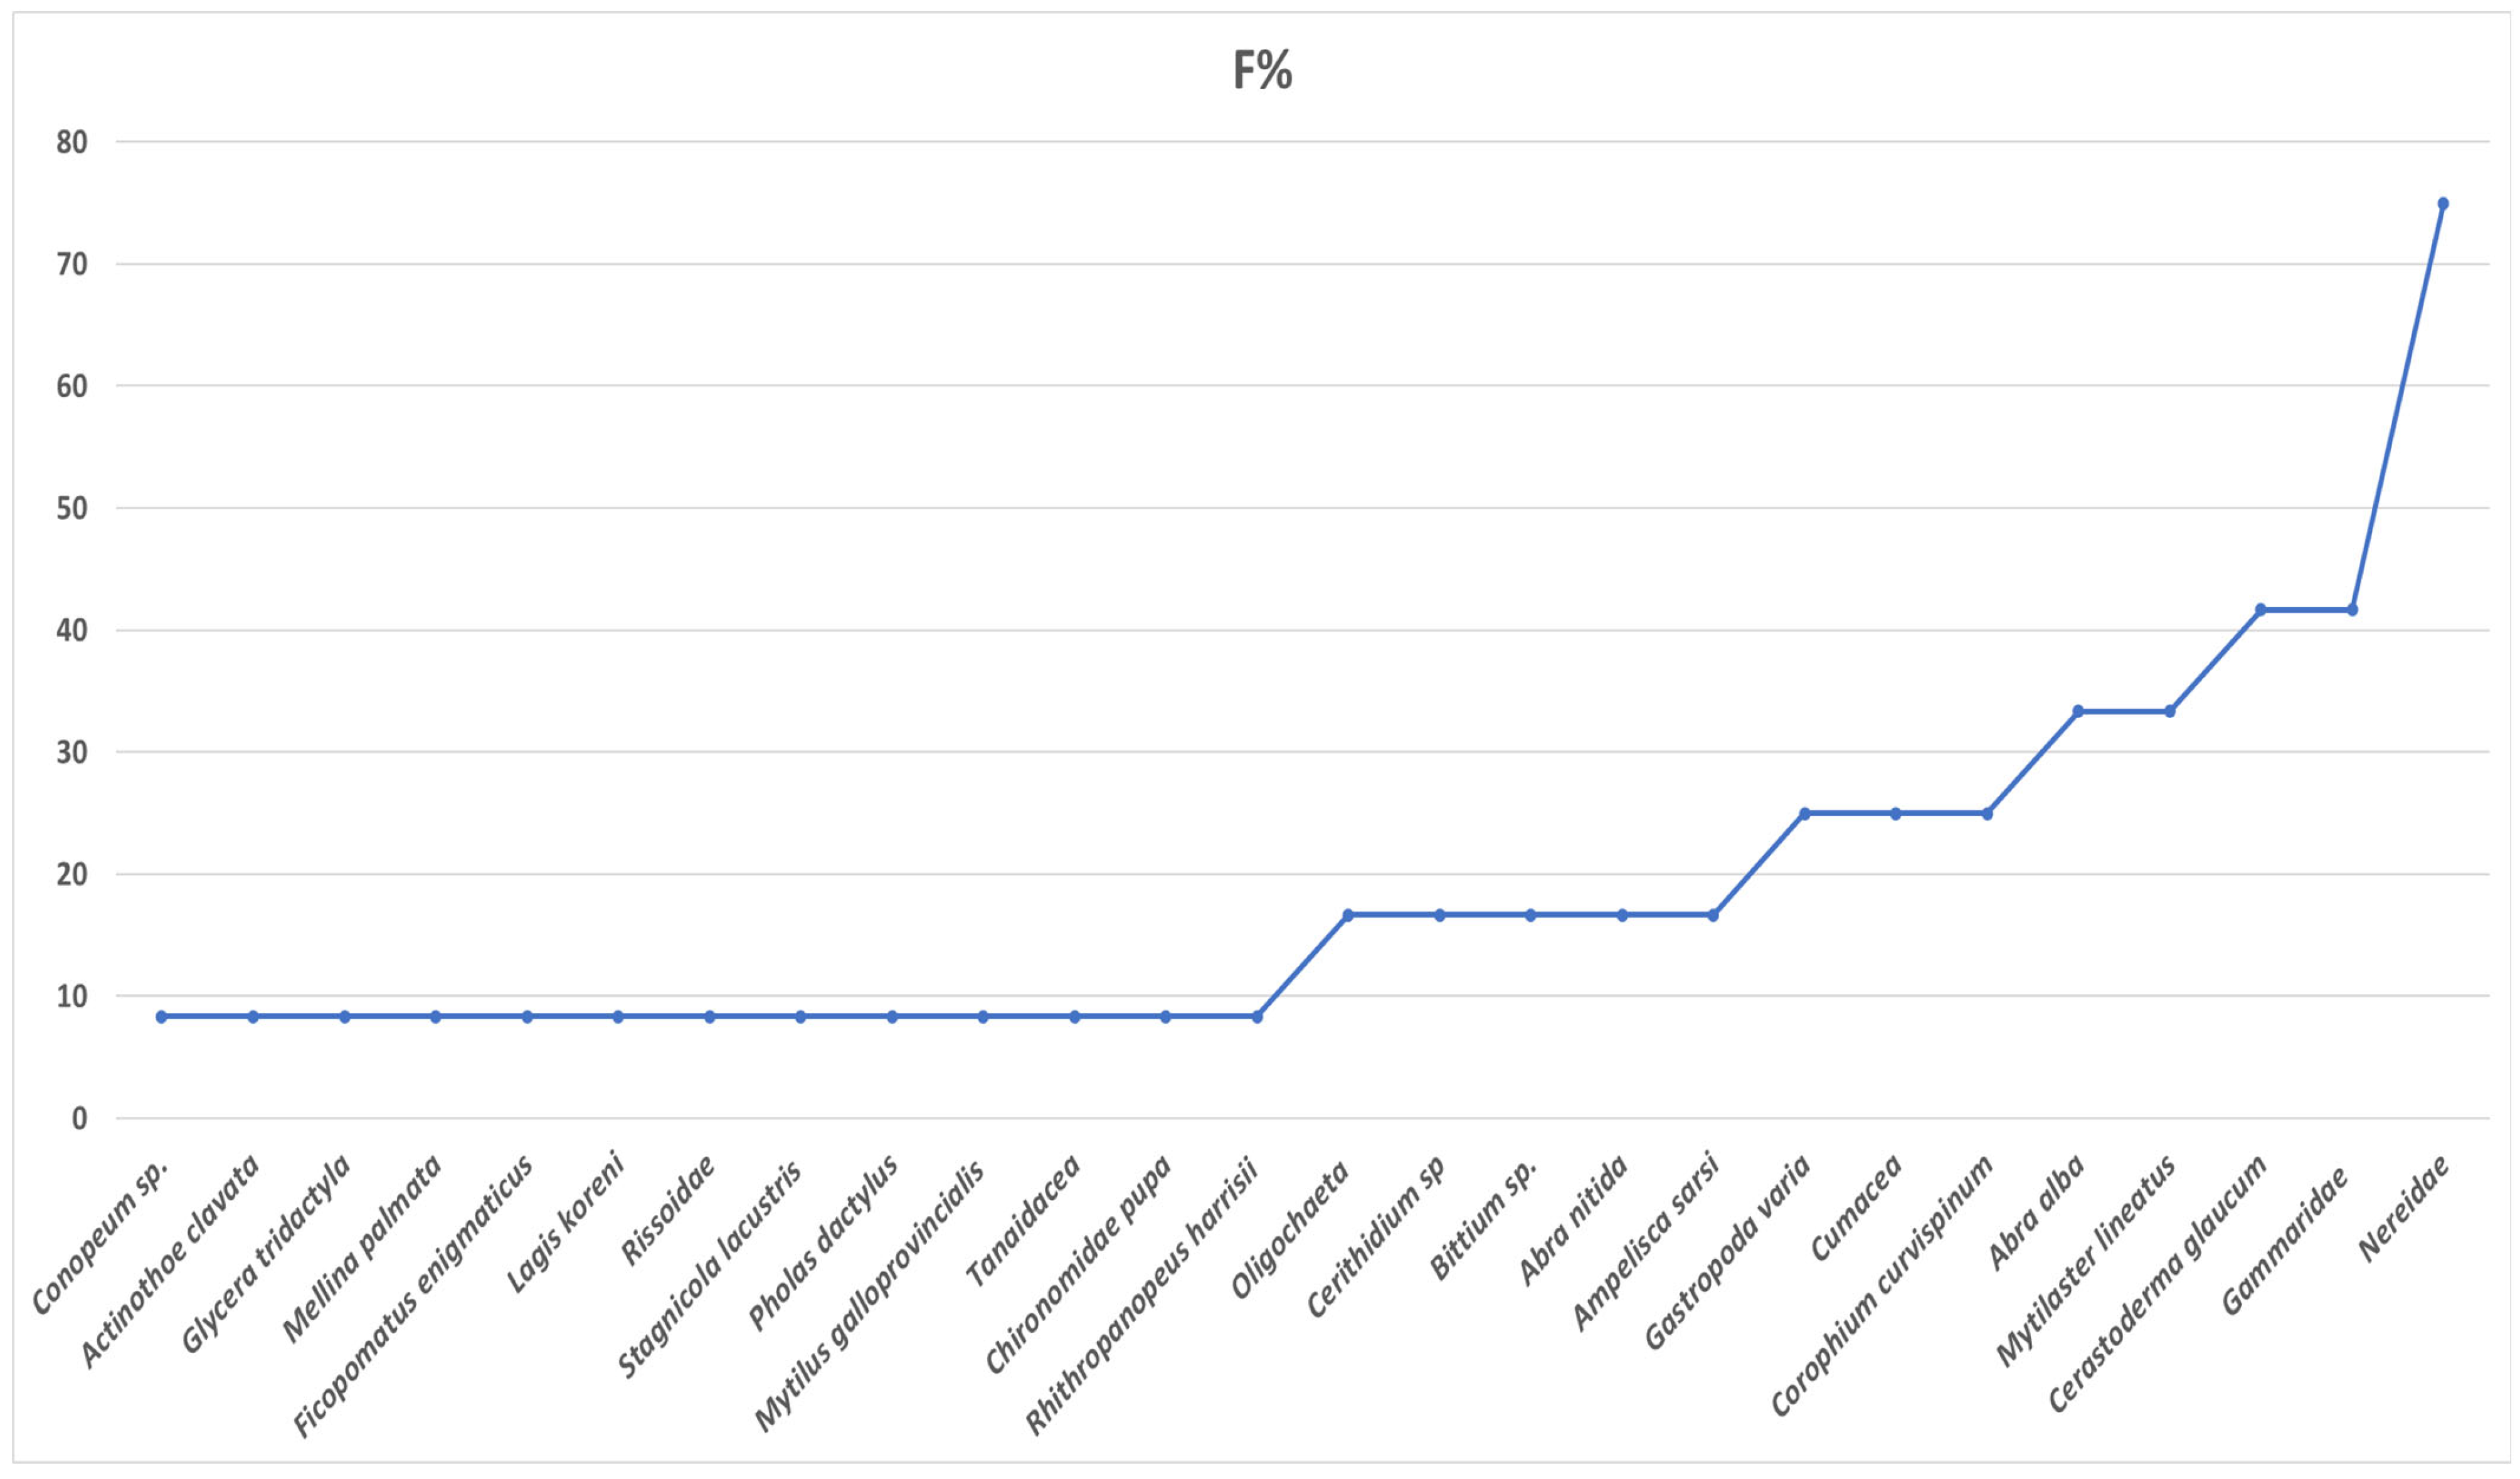
−2. The principal functional compartments were dominated by a small set of eurytopic species. The highest frequency of occurrence in the samples was recorded for three taxa typical of muddy to muddy–sandy substrates in wetlands:
Cerastoderma glaucum, Gammaridae, and Nereidae (
Figure 7).
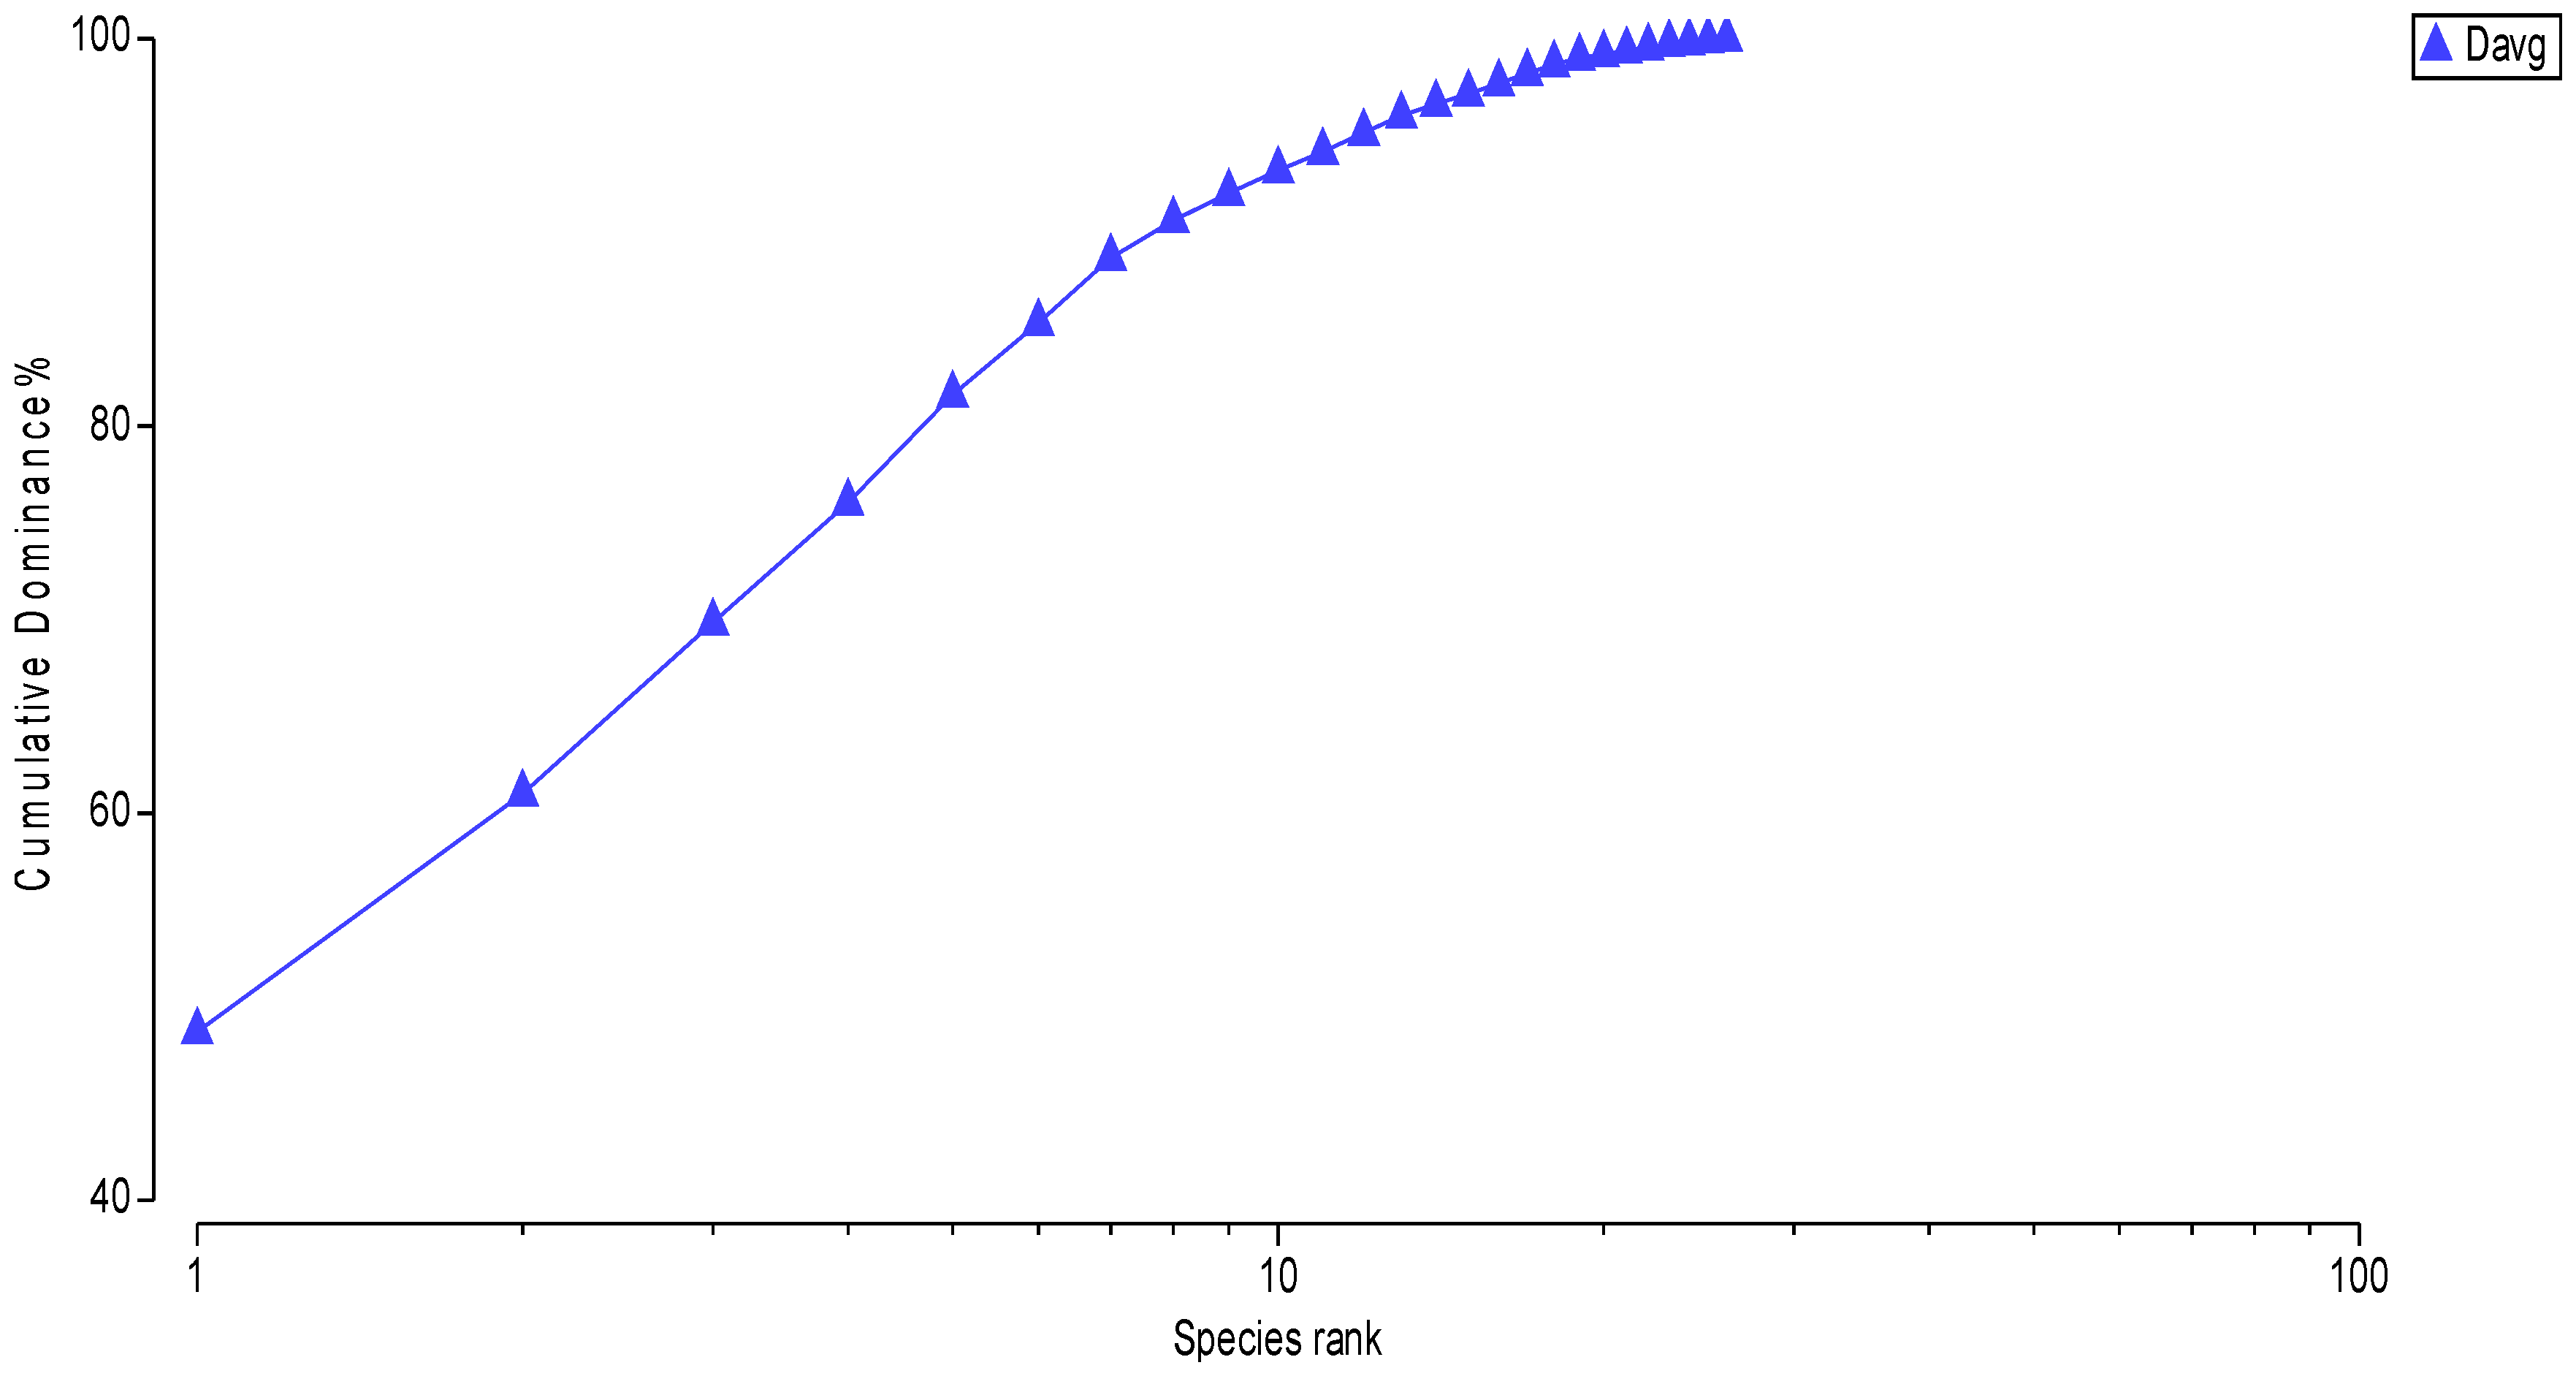
Of the 26 taxa recorded, only six were numerically dominant, collectively representing ~85% of total abundance:
Cerithidium sp., Nereidae, Gammaridae,
Cerastoderma glaucum,
Ampelisca sarsi, and
Bittium sp. (
Figure 8).
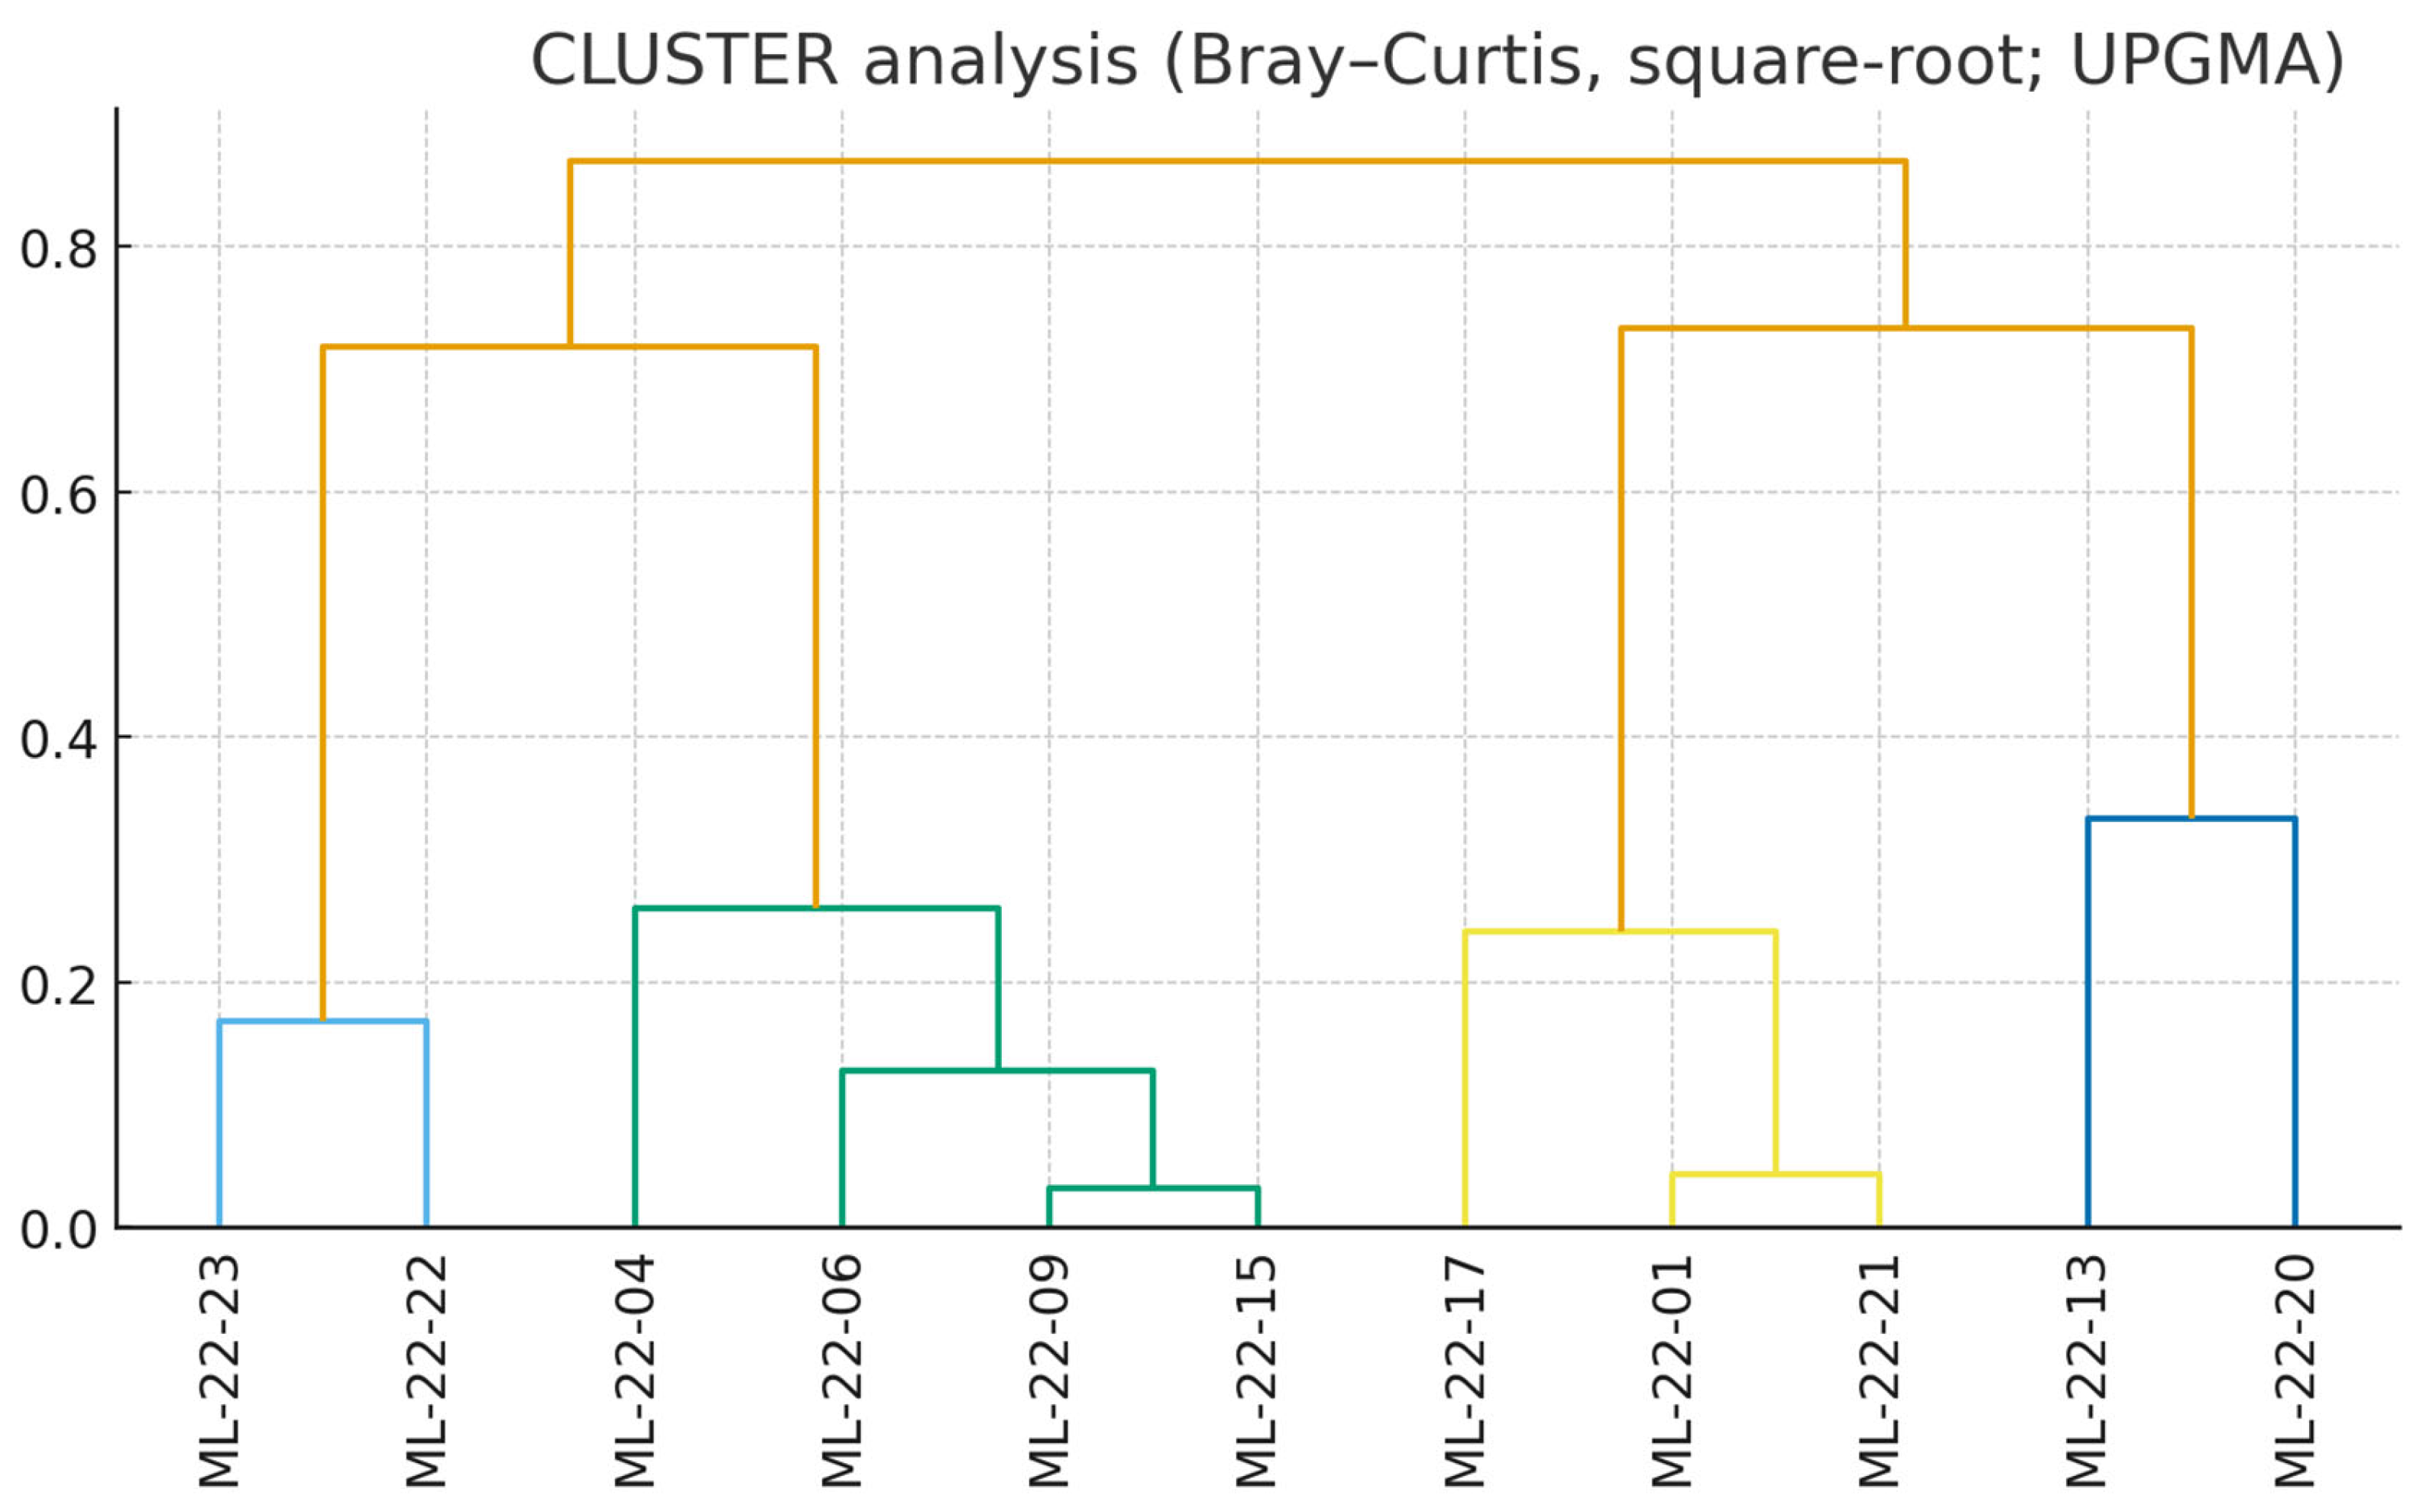
The cluster solution cleanly splits the stations into three ecological groupings. A marine-influenced embayment group (ML-22-22, ML-22-23) clusters tightly and is characterized by high total abundance and a fauna dominated by marine gastropods and bivalves (e.g.,
Cerithidium sp.,
Cerastoderma glaucum,
Bittium sp.). A second inner-lake/liman group (e.g., ML-22-04, -06, -09, -15, -17, -21) shows lower densities and mixed brackish assemblages in which polychaetes (Nereidae,
Ficopomatus enigmaticus) and amphipods (Gammaridae) are common. A third, low-diversity subgroup (ML-22-13, ML-22-20) contains samples with extreme dominance by a single taxon and near-null diversity metrics, clustering apart irrespective of position along the lake. This structure mirrors the longitudinal gradient in mineralization and sediment facies (
Figure 9).
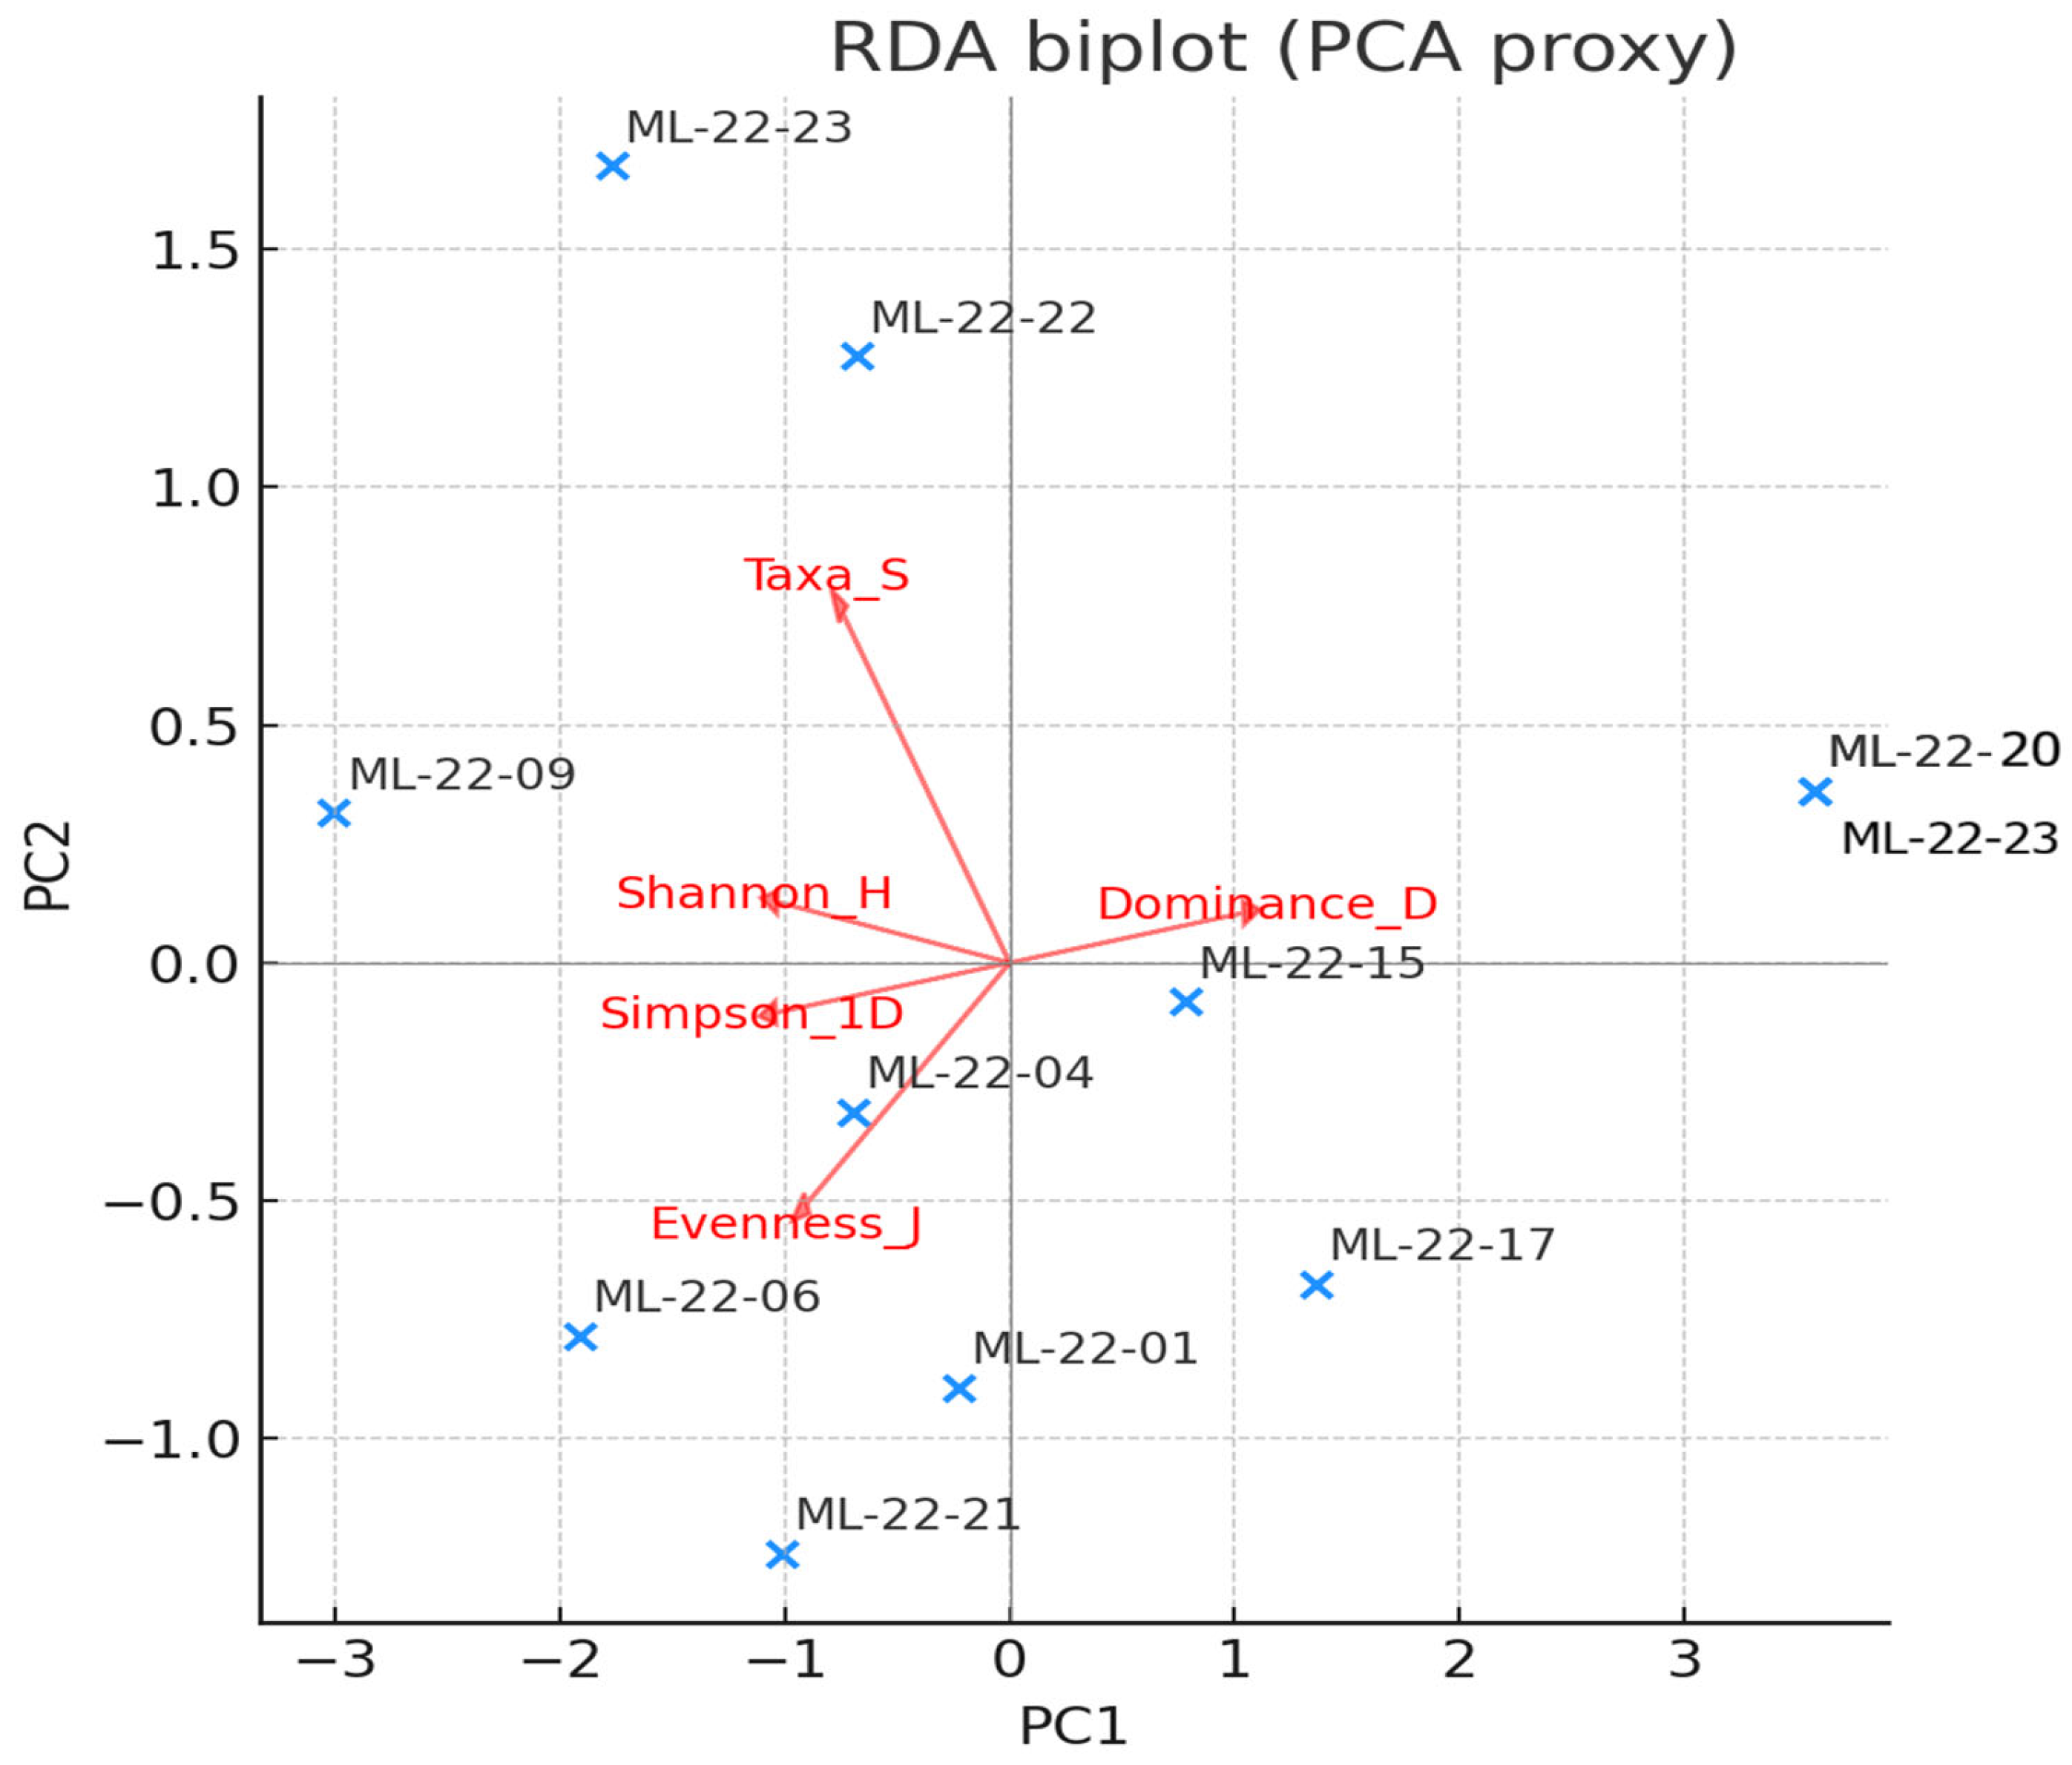
Constrained ordination places the marine-proximal stations (ML-22-22, ML-22-23) along positive axes of salinity, conductivity, TDS and carbonate content, together with marine taxa (e.g.,
Cerithidium sp.,
C. glaucum,
Ampelisca sarsi). Inner-lake stations project toward vectors for high TOM and fine substrates, associated with Nereidae, oligochaetes and gammarids. pH and DO co-align with chlorophyll and phycocyanin, indicating the influence of daytime photosynthesis on community structure; these vectors load most strongly on mid-lake sites where supersaturation and alkaline pH were recorded. Turbidity exerts a weak, localized effect, consistent with short-lived resuspension near infrastructure. The RDA confirms that hydrohaline regime and substrate composition are the primary drivers of assemblage turnover, with productivity (pH/DO/fluorescence) modulating abundances (
Figure 10).
Alpha-diversity ranged from H′ = 0–1.88 across stations, with Simpson (1–D) = 0–0.80 and evenness (J′) spanning ~0–0.86 (
Table 4). The highest richness and density occurred at the mouth (ML-22-23: S = 14; ML-22-22: S = 11), but these sites still exhibited strong numerical dominance (Berger–Parker ≈ 0.61–0.70) due to the overwhelming abundance of one or two marine gastropods. Up-lake stations typically supported few taxa (S ≤ 5) and showed either moderate diversity where polychaetas and amphipods co-occurred (e.g., ML-22-04, ML-22-06) or very low diversity with near-monodominance (ML-22-13, ML-22-20; H′ ≈ 0; D ≈ 1). At the system scale this translates to low-to-moderate diversity and high spatial heterogeneity, shaped by the transition from organic-rich, fine sediments in the limans to shellier, more mineralized facies near the outlet.
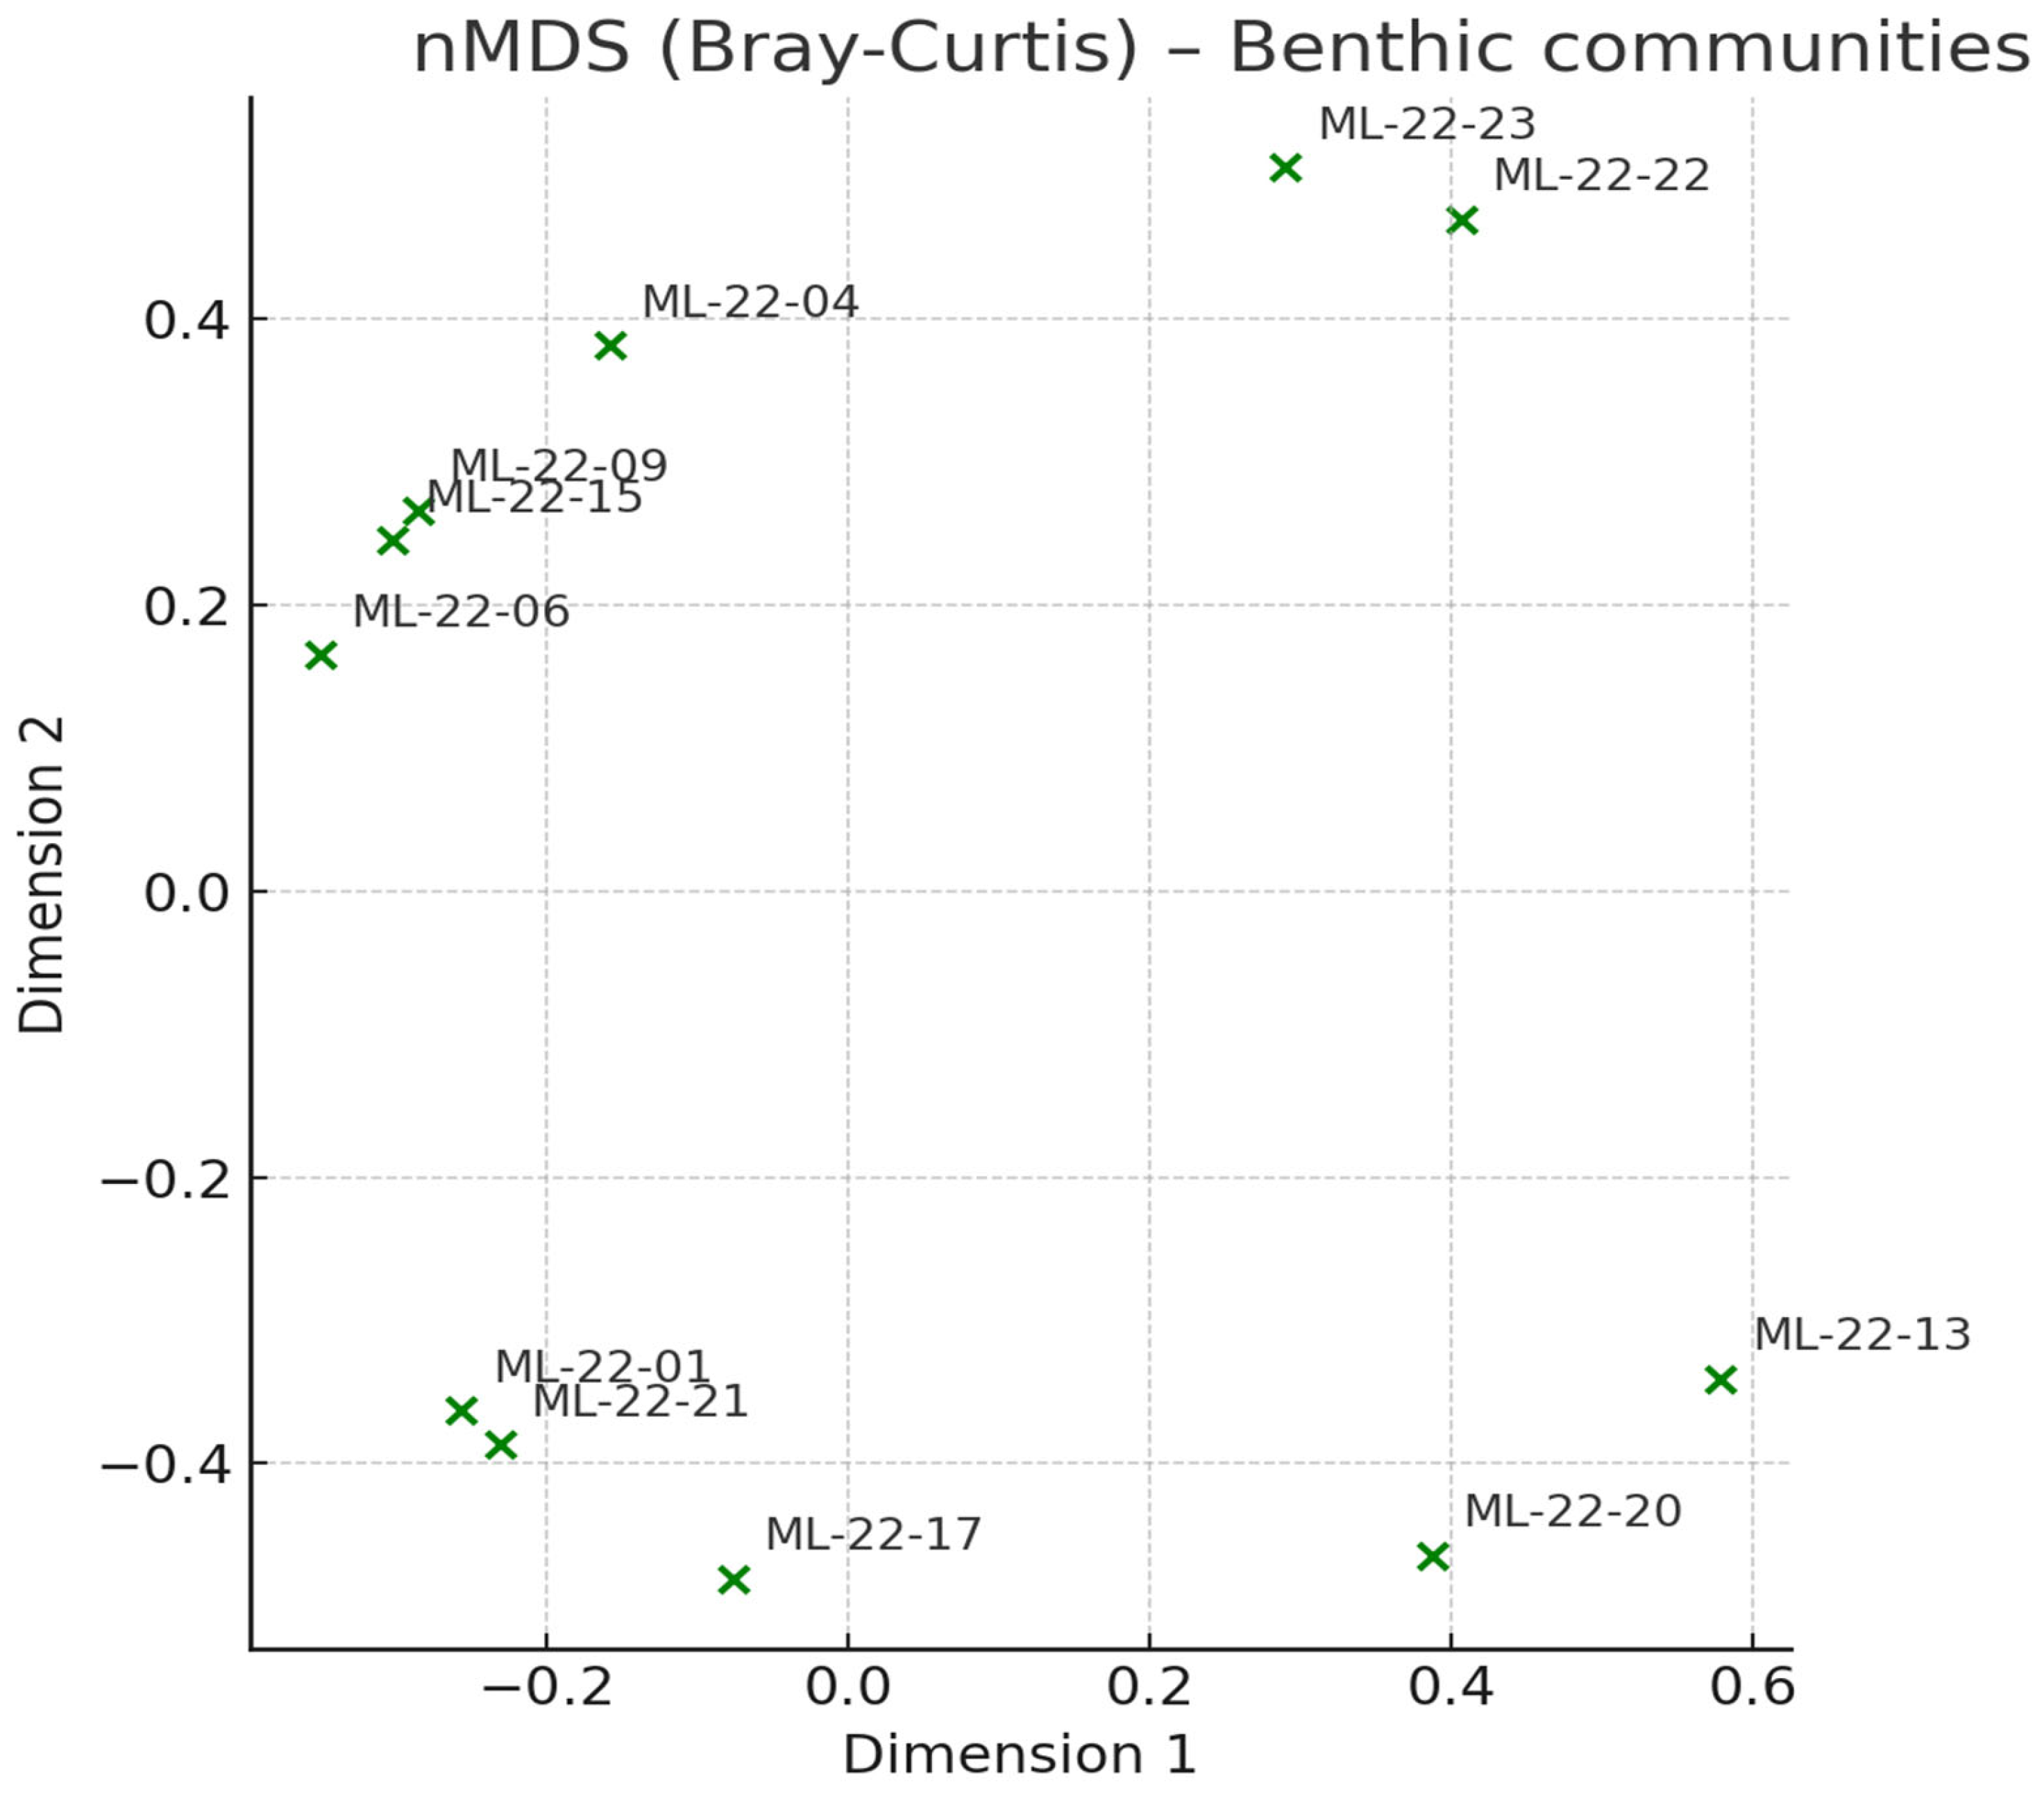
Ordination reproduces the cluster structure: a compact marine cluster (ML-22-22, -23), a dispersed inner-lake cluster reflecting mixed brackish assemblages, and a separate arm formed by the low-diversity samples (ML-22-13, -20). The spread within the inner-lake group tracks the gradient in TOM/SIL and the local balance of polychaetas vs. amphipods (
Figure 11).
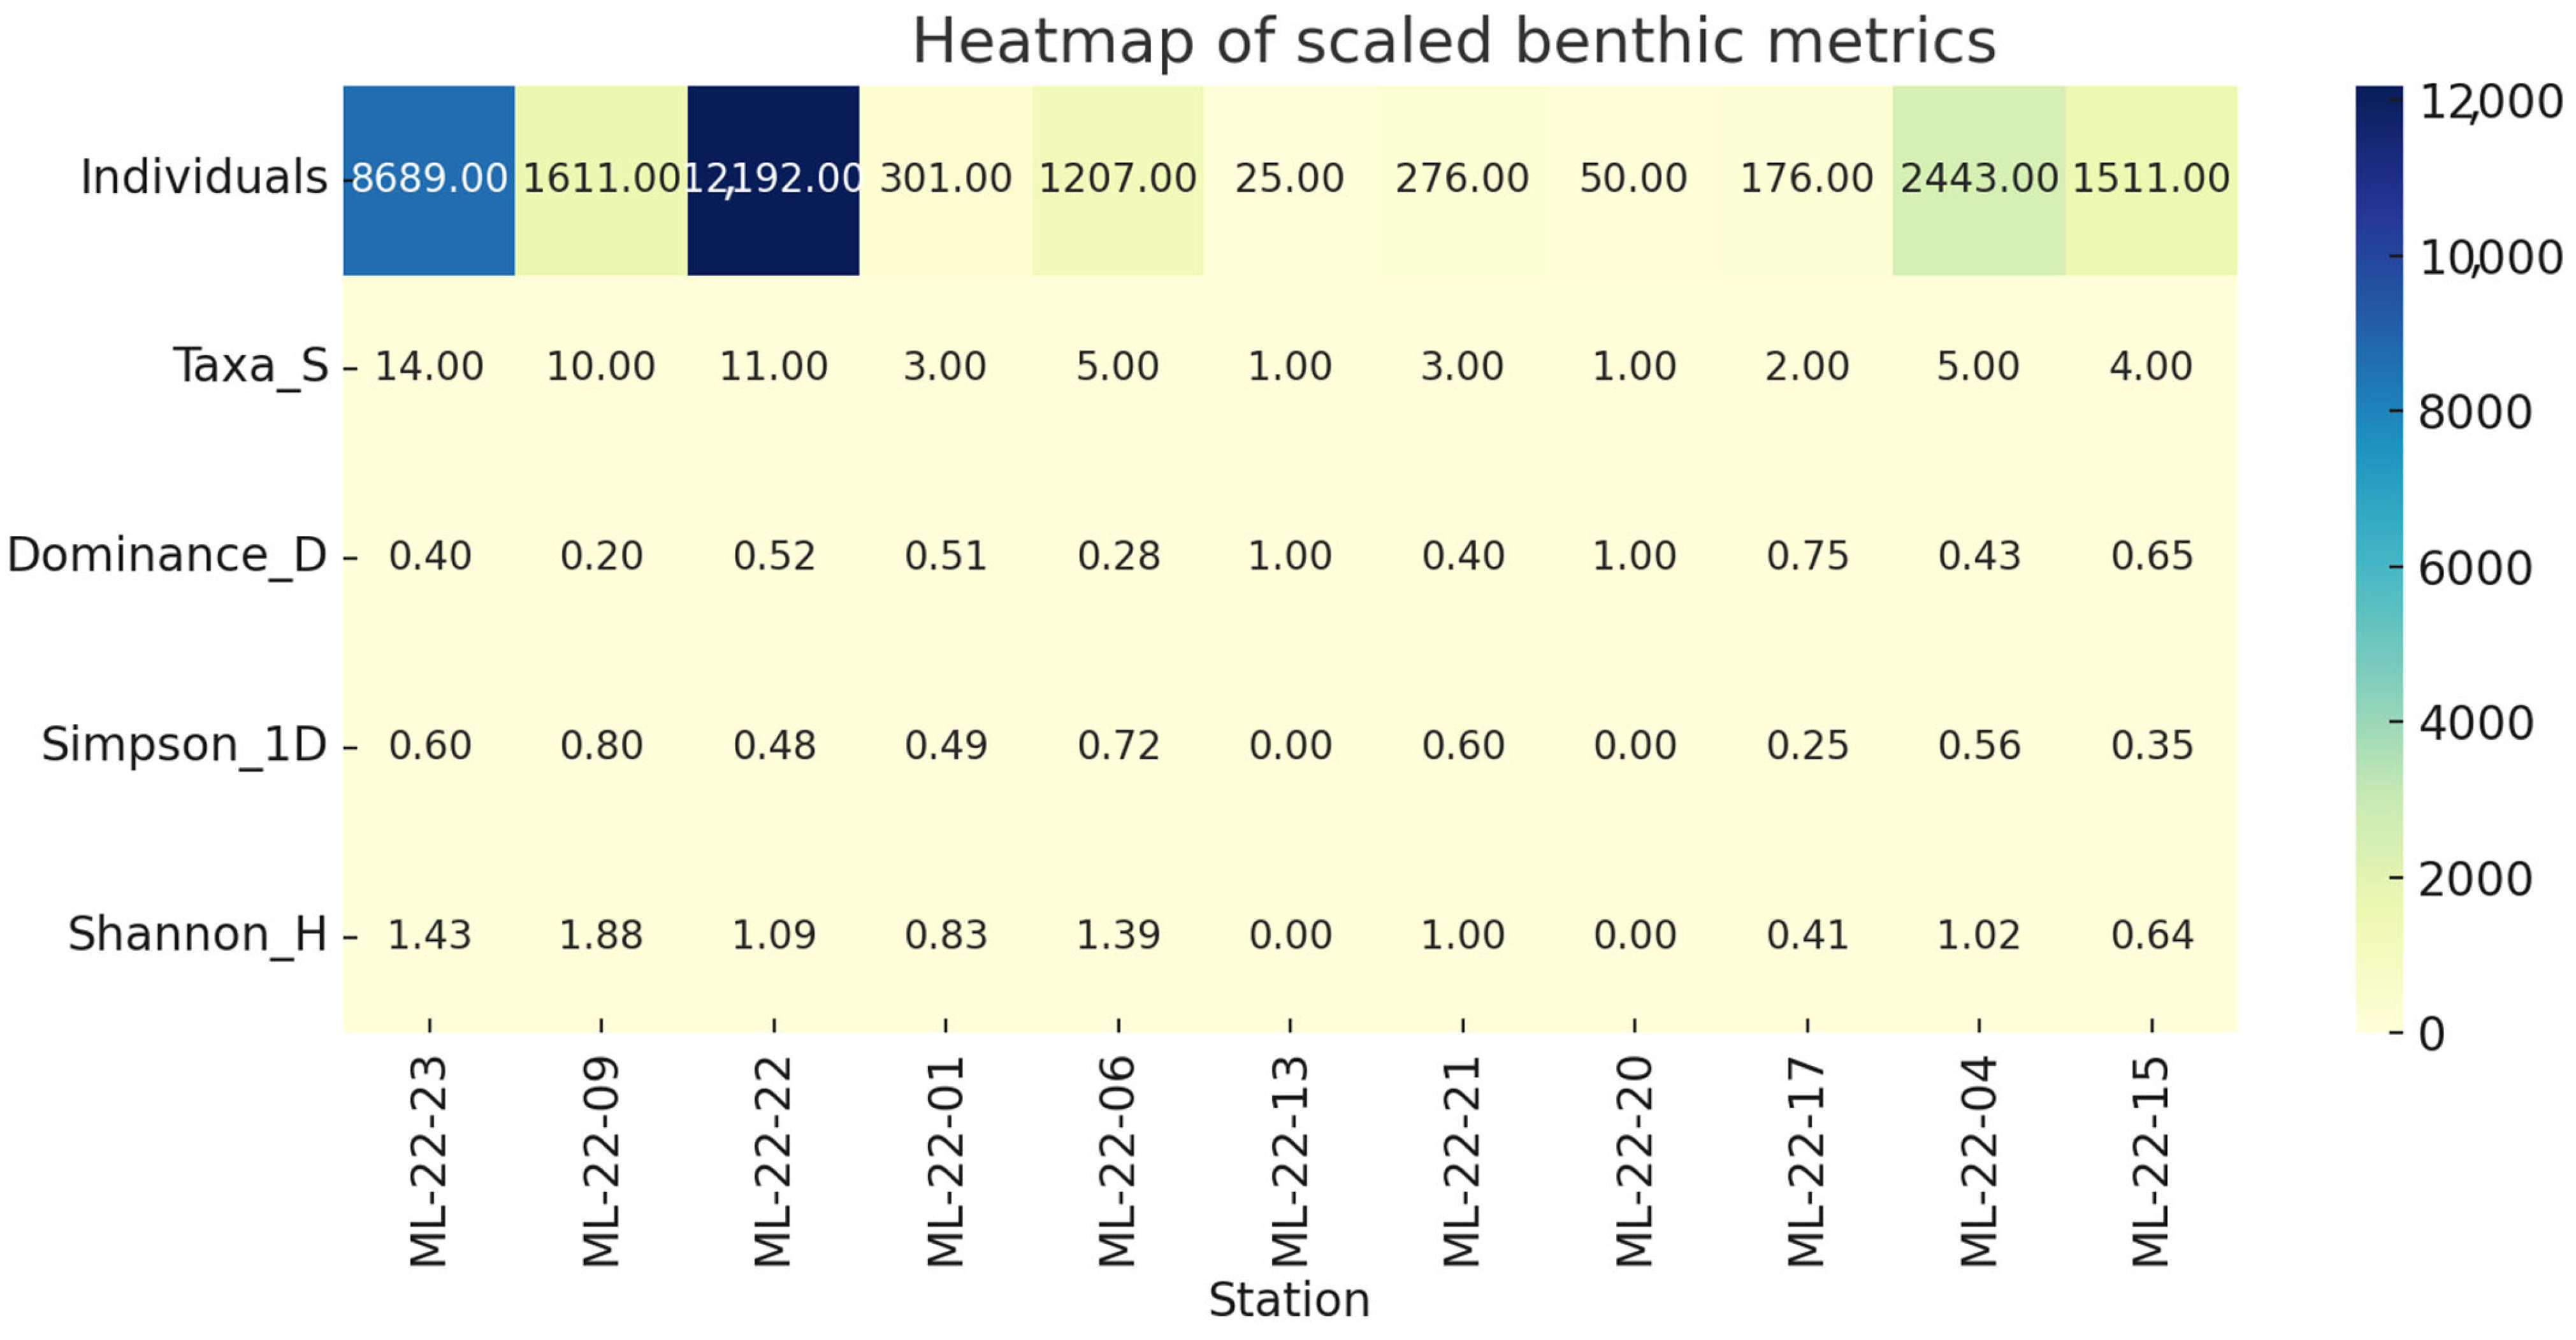
The heatmap highlights taxon-specific hotspots consistent with the ordinations: marine gastropods and
C. glaucum dominate the embayment, Nereidae and Gammaridae peak in mid-lake organic substrates, and single-taxon spikes explain the extreme dominance at ML-22-13 and ML-22-20. These patterns emphasize the combined control of salinity, substrate, and daytime productivity on the benthic mosaic of Mangalia–Limanu Lake (
Figure 12).
4. Discussion
The findings of this study provide the first integrated assessment of sedimentological, geochemical, physicochemical, and biological characteristics of the Mangalia–Limanu coastal lake system. By combining in situ water quality profiles with sediment composition, heavy-metal concentrations, and benthic community structure, the results highlight a system shaped by both natural low-energy hydrodynamics and cumulative anthropogenic pressures.
The physicochemical parameters recorded along the horizontal transect from the upper Limans toward the port water area delineate a predominantly freshwater to slightly brackish (oligohaline) system. Dissolved oxygen showed sustained daytime supersaturation (up to ~233%, ~19 mg/L), driven by vigorous photosynthesis under warm summer conditions, in agreement with elevated pH (up to 9.4) and patches of increased chlorophyll and phycocyanin fluorescence. This pattern is typical for shallow; well-lit systems where intense primary production rapidly raises oxygen and pH during daylight hours. The absence of daytime hypoxia suggests good oxygenation, but such supersaturation often precedes nocturnal drawdown, highlighting the need for full diel monitoring to assess potential night-time oxygen minima. Conductivity, TDS, and salinity showed a clear downstream gradient, with values increasing from ~226 µS/cm and 0.1 psu in the upstream Limans to ~1700 µS/cm and 0.8 psu in the port water area. This transition reflects progressive mineralization and restricted marine exchange, classifying the lake as oligohaline under Order no. 161/2006. Turbidity was generally moderate, and the brief peaks associated with local resuspension near infrastructure rather than basin-wide suspension indicate overall low hydrodynamic energy, favoring fine sediment deposition and organic matter accumulation. Nitrate showed a declining trend downstream, consistent with biological uptake, though raw electrode signals suggest higher nitrate activity in the upstream Limans; the calculated concentrations require confirmation through laboratory analyses.
Sedimentological results revealed high spatial heterogeneity in the composition of bottom deposits. Organic matter (TOM) dominated most sites, with values up to 88%, especially in the western and central basins, while siliciclastic fractions increased toward the eastern and port-adjacent sectors, reaching ~50% at ML-22-22. Carbonates were generally low (≤10%) but locally high at ML-22-23 (~53%), linked to shell debris accumulation. This lithological pattern suggests a mixed sedimentary environment shaped by both autochthonous production (organic matter from macrophytes and algae) and allochthonous inputs (siliciclastic particles transported from the catchment), with local bioclastic contributions near the port sector. The prevalence of organic-rich fine sediments is consistent with the low-energy depositional setting inferred from hydromorphology and in situ turbidity profiles.
Geochemically, surface sediments showed notable enrichments in several heavy metals. Chromium, copper, zinc, and lead frequently exceeded the threshold values set by Order no. 161/2006, particularly in the central and port-adjacent sectors (ML-22-10 to ML-22-18), while nickel often slightly surpassed the 35 mg/kg limit but likely reflects natural geogenic inputs from greenschists and basic rocks known to yield naturally elevated Ni. Arsenic concentrations remained well below the threshold across all sites. The clustering of exceedances in the port water area suggests localized contamination hotspots potentially linked to maritime, urban, or legacy industrial activities. The co-occurrence of high metal concentrations with fine-grained, organic-rich sediments is consistent with known geochemical behavior, as such substrates have high adsorption capacity and favor metal accumulation. This pattern indicates an increased potential for metal bioavailability and ecological risk in these sectors, warranting further investigation.
Biologically, the benthic community showed strong spatial contrasts. Overall diversity was low to moderate (Shannon H′ = 0–1.88; median ≈ 1.09), well below the H′ ≈ 2 threshold typically associated with well-structured coastal communities [
39,
40]. Most stations were dominated by a small number of eurytopic taxa—especially
Cerithidium sp., Nereidae, Gammaridae,
Cerastoderma glaucum,
Ampelisca sarsi, and
Bittium sp.—which together contributed ~85% of total abundance. Sites in the upstream and central Limans were species-poor and numerically dominated by one or two taxa, reflecting simplified, low-resilience assemblages. In contrast, stations ML-22-09, ML-22-22, and ML-22-23 in the eastern embayment and port area displayed higher richness (up to 14 taxa) and abundance (>12,000 individuals), with more balanced compositions and lower dominance. Multivariate analyses (CLUSTER, nMDS, and RDA) confirmed the spatial segregation of these assemblages into two functional groups: (i) a low-diversity compartment dominated by a few tolerant species, and (ii) a more diverse compartment influenced by marine connectivity and more stable substrates. The correlation of diversity with TOM and siliciclastic content suggests that benthic community structure is shaped by the interaction of substrate properties and local hydrological conditions.
These findings place Mangalia–Limanu Lake in an intermediate ecological position compared to other Romanian coastal lakes: it retains active benthic communities and high primary productivity, but exhibits signs of organic enrichment, metal accumulation, and localized biodiversity loss [
41,
42,
43,
44] The combination of low hydrodynamic energy, high organic content, and anthropogenic pressures (maritime infrastructure, catchment inputs) creates conditions favorable for contaminant retention and opportunistic species proliferation [
45,
46]. Such settings are vulnerable to regime shifts, particularly under warming and eutrophication pressures documented in similar European lagoons [
19,
47]. Continuous integrated monitoring of water quality, sediment geochemistry, and benthic communities is therefore essential to detect early ecological deterioration, manage contaminant sources, and preserve biodiversity and ecosystem functions in this transitional coastal system [
48,
49,
50,
51]
This study provides an updated and comprehensive ecological baseline for the Mangalia–Limanu system, addressing the current lack of integrated research on anthropized Romanian coastal lakes. By linking sediment properties, water quality, and biological structure, it contributes essential knowledge to support the implementation of EU Water Framework Directive objectives, guide conservation planning, and inform sustainable management policies for coastal wetlands in the Black Sea region.
5. Conclusions
This study provides the first comprehensive assessment of the Mangalia–Limanu coastal lake, integrating sedimentological, geochemical, physicochemical, and biological datasets to evaluate its current ecological condition.
The results indicate that the system functions as a predominantly freshwater to slightly brackish (oligohaline) transitional environment, exhibiting a clear longitudinal gradient from lower-mineralized upstream sectors to more mineralized waters near the port area. Physicochemical profiles revealed strong daytime photosynthetic activity, evidenced by oxygen supersaturation (>200%), elevated pH (~9.4), and localized peaks in chlorophyll a and phycocyanin fluorescence. These patterns reflect an active primary-producer community, with no evidence of daytime hypoxia during the survey period. Conductivity, TDS, and salinity increased toward the outlet, while higher nitrate levels upstream suggest efficient nutrient uptake along the lake–channel continuum.
Sedimentological analyses showed a predominance of organic-rich substrates in the western and central sectors, transitioning to more siliciclastic and carbonate-enriched deposits toward the eastern (port) area. This composition reflects the combined influence of autochthonous organic production, allochthonous inputs from the catchment, and local bioclastic contributions. Geochemically, surface sediments displayed frequent exceedances of national threshold values (Order no. 161/2006) for Cr, Cu, Zn, Pb, and locally Ni—particularly in the central and port-adjacent stations (ML-22-10 to ML-22-18)—indicating potential contamination hotspots. Arsenic concentrations remained consistently low across the system.
Biological data revealed low to moderate benthic diversity (Shannon–Wiener H′ < 2) and strong dominance by a limited set of eurytopic taxa, including Cerithidium sp., Nereidae, Gammaridae, Cerastoderma glaucum, Ampelisca sarsi, and Bittium sp. Species richness and abundance were higher within the port embayment, suggesting a more stable, marine-influenced assemblage, while upstream and central sectors supported simplified communities dominated by stress-tolerant species.
Overall, the Mangalia–Limanu system appears to be an ecologically functional yet vulnerable lagoon-like environment, combining high primary productivity with localized pollution risks and reduced benthic diversity. The accumulation of organic matter and fine sediments, together with heavy metal enrichment, suggests low hydrodynamic renewal and potential susceptibility to further eutrophication and contaminant retention. The findings underscore the importance of continuous, integrated monitoring of water quality, sediment contamination, and biological communities to prevent ecological degradation and to support the sustainable management and conservation of this transitional coastal ecosystem.
In the broader context of European coastal management, the results of this study align with the objectives of the Water Framework Directive (2000/60/EC) and the Marine Strategy Framework Directive (2008/56/EC), both of which emphasize the protection and restoration of transitional and coastal waters to achieve “good ecological status.” The integrated approach applied here—linking physicochemical, sedimentological, and biological parameters—provides a valuable framework for long-term ecological monitoring and adaptive management. Furthermore, by establishing a comprehensive baseline for the Mangalia–Limanu system, this research contributes to regional and cross-border initiatives aimed at safeguarding the ecological integrity of the northwestern Black Sea coastal zone within the broader framework of European environmental policy.
Future Research Directions
Future investigations in the Mangalia–Limanu Coastal Lake will focus on a more detailed spatial integration of physicochemical, geochemical, and biological datasets to improve the understanding of ecosystem functioning and contaminant dynamics. Particular attention will be given to the identified geochemical hotspot near station ML-22-11, where elevated metal concentrations suggest potential point-source or diagenetic enrichment. Biological sampling will be expanded to include this sector and its adjacent areas to assess the ecological response of benthic communities to metal stress.
In addition to sediment analyses, future studies will incorporate water-column metal assessments to better quantify dissolved versus particulate fractions and to evaluate the geochemical coupling between the sediment and overlying water. Sampling of land sediments and inflowing waters around the lake margins will help to identify potential sources and transport pathways for metals and nutrients.
Special focus will also be directed toward carbonate dynamics within the mixing zone, where interactions between freshwater and saline inputs may induce both chemical precipitation and dissolution of calcium carbonate. These processes are likely to influence metal mobility and organic matter stabilization. Understanding their balance will be critical to modeling geochemical gradients and predicting ecosystem responses to ongoing environmental pressures.
Author Contributions
Conceptualization, A.B.P. and L.D.; methodology, A.B.P., I.C. and F.R.; software, A.B.P. and G.I.; validation, A.B.P. and L.D.; formal analysis, A.B.P., C.G., I.C. and F.R.; investigation, A.B.P. and A.T.; resources, L.D.; data curation, A.B.P., I.C., F.R. and L.D.; writing—original draft preparation, A.B.P.; writing—review and editing, A.B.P.; visualization, A.B.P.; supervision, A.B.P. and L.D.; project administration, L.D.; funding acquisition, L.D. All authors have read and agreed to the published version of the manuscript.
Funding
The research leading to these results was financed by the Ministry of Research and Innovation—“Program Nucleu”—13N/08.02.2019—PN19-20-04-01 and PN 19.20.04.01.
Institutional Review Board Statement
Not applicable.
Informed Consent Statement
Not applicable.
Data Availability Statement
Data will be made available on request.
Acknowledgments
During the preparation of this manuscript, the authors used ChatGPT (OpenAI, GPT-5, 2025) as an AI-assisted writing tool for language editing and text refinement. The authors have carefully reviewed and edited the output, and they take full responsibility for the content of this publication.
Conflicts of Interest
The authors declare no conflicts of interest.
References
- Gâştescu, P. The Danube Delta biosphere reserve. Geography, biodiversity, protection, management. Rev. Roum. Géogr. 2009, 53, 139–152. [Google Scholar]
- Gâştescu, P.; Ştiucă, R. The Danube Delta—A Biosphere Reserve; CD Press Publishing House: Bucharest, Romania, 2008; p. 400, (In Romanian, with Contents and Introduction in English). [Google Scholar]
- Newton, A.; Icely, J.; Cristina, S.; Brito, A.; Cardoso, A.C.; Colijn, F.; Dalla Riva, S.; Gertz, F.; Hansen, J.W.; Holmer, M.; et al. An overview of ecological status, vulnerability and future perspectives of European large shallow, semi-enclosed coastal systems, lagoons and transitional waters. Estuar. Coast. Shelf Sci. 2014, 140, 95–122. [Google Scholar] [CrossRef]
- Kjerfve, B.; Magill, K.E. Geographic and hydrodynamic characteristics of shallow coastal lagoons. Mar. Geol. 1989, 88, 187–199. [Google Scholar] [CrossRef]
- Perillo, G.M.E.; Wolanski, E.; Cahoon, D.R.; Hopkinson, C.S. (Eds.) Coastal Wetlands: An Integrated Ecosystem Approach, 2nd ed.; Elsevier B.V.: Amsterdam, The Netherlands, 2019; ISBN 978-0-444-63893-9. [Google Scholar]
- Newton, A.; Brito, A.C.; Icely, J.D.; Derolez, V.; Clara, I.; Angus, S.; Schernewski, G.; Inácio, M.; Lillebø, A.I.; Sousa, A.I.; et al. Assessing, quantifying and valuing the ecosystem services of coastal lagoons. J. Nat. Conserv. 2018, 44, 50–65. [Google Scholar] [CrossRef]
- Pérez-Ruzafa, A.; Pérez-Marcos, M.; Marcos, C. Coastal lagoons in focus: Their environmental and socioeconomic importance. J. Nat. Conserv. 2020, 57, 125886. [Google Scholar] [CrossRef]
- Reizopoulou, S.; Nicolaidou, A. Benthic diversity of coastal brackish-water lagoons in western Greece. Aquat. Conserv. Mar. Freshw. Ecosyst. 2004, 14, S93–S102. [Google Scholar] [CrossRef]
- Ligorini, V.; Malet, N.; Garrido, M.; Four, B.; Etourneau, S.; Leoncini, A.S.; Dufresne, C.; Cecchi, P.; Pasqualini, V. Long-term ecological trajectories of a disturbed Mediterranean coastal lagoon (Biguglia lagoon): Ecosystem-based approach and considering its resilience for conservation. Front. Mar. Sci. 2022, 9, 937795. [Google Scholar] [CrossRef]
- Breier, A. Lakes on the Romanian Black Sea Coast—Hydrogeographic Study; Publishing House of the Academy of the Socialist Republic of Romania: Bucharest, Romania, 1976. (In Romanian) [Google Scholar]
- Pérez-Ruzafa, A.; Marcos, C.; Pérez-Ruzafa, I.M. Mediterranean coastal lagoons in an ecosystem and aquatic resources management context. Phys. Chem. Earth Parts A/B/C 2011, 36, 160–166. [Google Scholar] [CrossRef]
- Tate, R.L. Soil Organic Matter. Biological and Ecological Effects; John Wiley and Sons: New York, NY, USA, 1987; p. 291. [Google Scholar]
- Tolmazin, D. Changing coastal oceanography of the Black Sea. Prog. Oceanogr. 1985, 15, 217–276. [Google Scholar] [CrossRef]
- Staneva, J.; Stanev, E.V. Oceanic response to atmospheric forcing derived from regional climatology and mesoscale model simulation. J. Mar. Syst. 1998, 16, 51–68. [Google Scholar]
- Emelyanov, E.M.; Shimkus, K.M. Geochemistry and Sedimentology of the Mediterranean Sea; Reidel Publishing Company: Dordrecht, The Netherlands, 1986; p. 567. [Google Scholar] [CrossRef]
- Nichols, G. Sedimentology and Stratigraphy, 2nd ed.; Wiley-Blackwell: Hoboken, NJ, USA, 2009. [Google Scholar]
- Elliott, M.; Whitfield, A.K. Challenging paradigms in estuarine ecology and management. Estuar. Coast. Shelf Sci. 2011, 94, 306–314. [Google Scholar] [CrossRef]
- Pérez-Ruzafa, A.; Marcos, C.; Pérez-Ruzafa, I.M. Coastal lagoons: Environmental variability, ecosystem complexity, and goods and services uniformity. Estuar. Coast. Shelf Sci. 2019, 217, 1–23. [Google Scholar]
- Borja, Á.; Dauer, D.M.; Elliott, M.; Simenstad, C.A. Medium- and long-term recovery of estuarine and coastal ecosystems: Patterns, rates and restoration effectiveness. Estuaries Coasts 2010, 33, 1249–1260. [Google Scholar] [CrossRef]
- Lipps, W.C.; Braun-Howland, E.B.; Baxter, T.E. Standard Methods for the Examination of Water and Wastewater, 24th ed.; American Public Health Association (APHA): Washington, DC, USA; American Water Works Association (AWWA): Washington, DC, USA; Water Environment Federation (WEF): Washington, DC, USA; APHA Press: Washington, DC, USA, 2023; ISBN 0875532993/9780875532998. [Google Scholar]
- Order No. 161/2006; Normative Concerning the Classification of Surface Water Quality to Establish the Ecological Status of Water Bodies (Romanian Order MEWM No. 161/2006), Annex C—Elements and Physico-Chemical Quality Standards in Water. Published in the Romanian Official Monitor, Part I, No. 511 bis, 13 June 2006. Available online: https://legislatie.just.ro/Public/DetaliiDocument/74255 (accessed on 21 August 2025).
- Directive 2000/60/EC of the European Parliament and of the Council Establishing a Framework for Community Action in the Field of Water Policy. Available online: https://eur-lex.europa.eu/eli/dir/2000/60/oj/eng (accessed on 21 September 2025).
- SR EN ISO 5667-1:2023; Water Quality—Sampling—Part 1: Guidance on the Establishment of Sampling Programmes and Techniques. 2025. ASRO—Romanian Standardization Association: Bucharest, Romania, 2012. Available online: https://magazin.asro.ro/ro/standard/248767 (accessed on 21 August 2025).
- SR EN ISO 10523:2012; Water Quality—Determination of pH. ASRO—Romanian Standardization Association: Bucharest, Romania, 2012. Available online: https://magazin.asro.ro/ro/standard/248767 (accessed on 21 August 2025).
- SR EN ISO 5814:2013; Water Quality—Determination of Dissolved Oxygen Content—Electrochemical Probe Method. 2025. ASRO—Romanian Standardization Association: Bucharest, Romania, 2012. Available online: https://magazin.asro.ro/ro/standard/248767 (accessed on 21 August 2025).
- SR EN ISO 10870: 2012; Water Quality—Guidelines for the Selection of Sampling Methods and Devices for Benthic Macroinvertebrates in Fresh Waters. International Organization for Standardization: Geneva, Switzerland; ASRO—Romanian Standardization Association: Bucharest, Romania, 2012. Available online: https://magazin.asro.ro/ro/standard/248767 (accessed on 21 August 2025).
- ASTM D2216-10; Standard Test Methods for Laboratory Determination of Water (Moisture) Content of Soil and Rock by Mass. ASTM International: West Conshohocken, PA, USA, 2010. Available online: https://store.astm.org/d2216-10.html (accessed on 21 August 2025).
- Smith, K.A.; Mullins, C.E. Soil and Environmental Analysis: Physical Methods. Revised and Expanded; Marcel Dekker, Inc.: New York, NY, USA; United States Department of Agriculture: Washington, DC, USA, 2000.
- Dean, W.E. Determination of carbonate and organic matter in calcareous sediments and sedimentary rocks by loss on ignition: Comparison with other methods. J. Sediment. Petrol. 1974, 44, 242–248. [Google Scholar]
- Heiri, O.; Lotter, A.F.; Lemcke, G. Loss on ignition as a method for estimating organic and carbonate content in sediments: Reproducibility and comparability of results. J. Paleolimnol. 2001, 25, 101–110. [Google Scholar] [CrossRef]
- Van der Veer, G. Geochemical soil survey of The Netherlands. Atlas of major and trace elements in topsoil and parent material; assessment of natural and anthropogenic enrichment factors. Neth. Geogr. Stud. 2006, 347, 1–245. [Google Scholar]
- de Bakker, H.; Schelling, J. Systeem van Bodemclassificatievoor Nederland: De Hogere Niveaus, Tweede, Gewijzigde Druk, Centrum Voor Landbouwpublikaties en Landbouwdocumentatie, Wageningen. 1989. Available online: https://research.wur.nl/en/publications/systeem-van-bodemclassificatie-voor-nederland-de-hogere-niveaus-2 (accessed on 21 September 2025).
- SR EN ISO 16150: 2012; Water Quality—Guidance on Pro-Rata Multi-Habitat Sampling of Benthic Macro-Invertebrates from Wadeable Rivers. ISS: Belgrade, Serbia; ASRO—Romanian Standardization Association: Bucharest, Romania, 2012. Available online: https://magazin.asro.ro/ro/standard/248767 (accessed on 21 August 2025).
- Anderson, M.J.; Gorley, R.N.; Clarke, K.R. PERMANOVA+ for PRIMER: Guide to Software and Statistical Methods; Statistical Analysis App for Windows; PRIMER-E: Plymouth, UK, 2008. [Google Scholar]
- Addinsoft. XLSTAT. Statistical and Data Analysis Solution; Addinsoft: New York, NY, USA, 2020; Available online: https://www.xlstat.com/ (accessed on 21 August 2025).
- Available online: https://past.en.lo4d.com/download (accessed on 21 August 2025).
- Available online: https://www.usgs.gov (accessed on 21 June 2025).
- Ricken, W. Sedimentation as a Three-Component System. Organic Carbon, Carbonate, Noncarbonate; Lecture Notes in Earth Sciences Series, XII; Springer: Berlin/Heidelberg, Germany, 1993; Volume 51, p. 211. [Google Scholar]
- Basset, A.; Elliott, M.; West, R.J.; Wilson, J.G. Estuarine and lagoon biodiversity and their natural goods and services. Estuar. Coast. Shelf Sci. 2013, 132, 1–4. [Google Scholar] [CrossRef]
- Patrício, J.; Neto, J.M.; Teixeira, H.; Salas, F.; Marques, J.C. The robustness of ecological indicators to detect long-term changes in the structure and functioning of estuarine systems. Mar. Environ. Res. 2009, 68, 25–36. [Google Scholar] [CrossRef]
- Chiriac, E.; Udrescu, M. The Naturalist’s Guide to the World of Freshwater; Bucharest Scientific Publishing House: Bucharest, Romania, 1965. [Google Scholar]
- Ciubuc, C.; Ciolpan, O. Weed-bed fauna of the Danube Delta. In DANUBE DELTA Genesis and Biodiversity; Tudorancea, C., Tudorancea, M.M., Eds.; Backhuys Publishers: Leiden, The Netherlands, 2006; pp. 261–289. [Google Scholar]
- Bogut, I.; Vidakovik, J.; Palijan, G.; Cerba, D. Benthic macroinvertebrates associated with four species of macrophytes. Biol. Bratisl. Sect. Zool. 2007, 62, 600–606. [Google Scholar] [CrossRef]
- Cañedo-Argüelles, M.; Rieradevall, M. Quantification of environment driven changes in epiphytic macroinvertebrate communities associated to Phragmites australis. J. Limnol. 2009, 68, 229–241. [Google Scholar] [CrossRef]
- Conley, D.J.; Malone, T.C. Annual cycle of dissolved silicate in Chesapeake Bay: Implications for the production and fate of phytoplankton biomass. Mar. Ecol. Prog. Ser. 1992, 81, 121–128. [Google Scholar] [CrossRef]
- Cupşa, D.; Telcean, I.C.; Covaciu-Marcov, S.D. Aspecte ale structurii faunei bentonice din apele permanente şi temporare din zona Stâna de Vale (jud. Bihor). An. Univ. Oradea Fasc. Biol. 2002, IX, 117–124. [Google Scholar]
- Cure, V. Structure and ecological role of pytophilous chironomids from some Danubian ecosystems in Romania. Int. Ver. Theor. Angew. Limnol. Verhandlungen 1991, 24, 2925–2929. [Google Scholar]
- Gray, J.S. Effects of environmental stress on species-richness: An interpretation of the Juan Fernández Islands. Proc. R. Soc. B Biol. Sci. 1989, 236, 427–436. [Google Scholar]
- Lencioni, V. Chironomids as bioindicators of environmental quality in freshwater ecosystems. Chic. J. 2012, 31, 525–541. [Google Scholar]
- Smith, V.H.; Tilman, G.D.; Nekola, J.C. Eutrophication: Impacts of excess nutrient inputs on freshwater, marine, and terrestrial ecosystems. Environ. Pollut. 1999, 100, 179–196. [Google Scholar] [CrossRef]
- Wetzel, R.G. Limnology: Lake and River Ecosystems, 3rd ed.; Academic Press: New York, NY, USA, 2001. [Google Scholar]
Figure 1.
Multiparameter probe, model EX02.
Figure 1.
Multiparameter probe, model EX02.
Figure 2.
Van Veen Bodengreifer.
Figure 2.
Van Veen Bodengreifer.
Figure 3.
Mangalia-Limanu Lake with sampling stations.
Figure 3.
Mangalia-Limanu Lake with sampling stations.
Figure 5.
Areal distribution of TOM—green, CAR—red, and SIL—grey (%) fractions in the Mangalia Lake sediments.
Figure 5.
Areal distribution of TOM—green, CAR—red, and SIL—grey (%) fractions in the Mangalia Lake sediments.
Figure 6.
Ternary diagrams showing the percentage distribution (%) of the lithological components in the Mangalia-Limanu Lake sediments. The three axes represent the relative proportions of silica (SIL, %), carbonate (CAR, %), and total organic matter (TOM, %). Letters A, B, and C indicate the ternary diagram corners corresponding to the endmembers (A—TOM; B—CAR; C—SIL). Orange dots represent individual sediment samples.
Figure 7.
Frequency (%) of benthic taxa in the area of Limanu Lake Mangalia. Each dot represents the frequency value (F%) recorded for an individual taxon.
Figure 7.
Frequency (%) of benthic taxa in the area of Limanu Lake Mangalia. Each dot represents the frequency value (F%) recorded for an individual taxon.
Figure 8.
Cumulative curve of mean benthic population density in the study area.
Figure 8.
Cumulative curve of mean benthic population density in the study area.
Figure 9.
Cluster analysis Bray–Curtis, square root; UPGMA. The dendrogram shows the similarity relationships among sampling stations based on species composition. Lines of different colors represent distinct clusters or groups of samples with higher similarity levels.
Figure 9.
Cluster analysis Bray–Curtis, square root; UPGMA. The dendrogram shows the similarity relationships among sampling stations based on species composition. Lines of different colors represent distinct clusters or groups of samples with higher similarity levels.
Figure 10.
RDA biplot (PCA proxy) showing the relationship between diversity indices (red arrows) and sampling stations (blue crosses) in the Mangalia–Limanu Lake area. Diversity indices include species richness (Taxa_S), Shannon diversity (Shannon_H), Simpson index (Simpson_1D), evenness (Evenness_J), and dominance (Dominance_D). Arrows indicate the direction and strength of correlation with the ordination axes.
Figure 11.
nMDS (Bray–Curtis)–Benthic communities.
Figure 11.
nMDS (Bray–Curtis)–Benthic communities.
Figure 12.
Heatmap of scaled benthic metrics.
Figure 12.
Heatmap of scaled benthic metrics.
Table 1.
A synopsis of the physico-chemical parameters of water surface samples from Mangalia–Limanu Lake.
Table 1.
A synopsis of the physico-chemical parameters of water surface samples from Mangalia–Limanu Lake.
| Parameter | Min. | Max. | Mean ± SD |
|---|
| Chlorophyll RFU | 0.37 | 11.53 | 6.637 ± 2 |
| Conductivity (µS/cm) | 226.5 | 1732 | 1623.19 ± 331.871 |
| NO3-N mV | 50.8 | 147 | 137.93 ± 21.46 |
| NO3-N mg/L | 1.95 | 96.81 | 7.37 ± 20.905 |
| Oxygen Saturation (ODO % sat) | 96.6 | 223.5 | 184.76 ± 25.367 |
| Dissolved Oxygen (ODO mg/L) | 7.71 | 17.84 | 14.45 ± 1.924 |
| Salinity psu | 0.1 | 0.81 | 0.77 ± 0.159 |
| Total Algal Content (TAL PC RFU) | 0.71 | 8.78 | 5.73 ± 1.473 |
| Total Dissolved Solids (TDS mg/L) | 143 | 1053 | 1001.26 ± 203.752 |
| Turbidity NTU | 8.06 | 70.63 | 17.39 ± 13.107 |
| pH | 7.28 | 9.39 | 9.11 ± 0.411 |
| Temperature °C | 26.572 | 28.726 | 27.77 ± 0.631 |
Table 2.
Results expressed as the percentage concentration (%) of the main lithological components from Mangalia Limanu Lake.
Table 2.
Results expressed as the percentage concentration (%) of the main lithological components from Mangalia Limanu Lake.
| No. Crt. | Sample’s Indicative | TOM (%) | CAR (%) | SIL (%) |
|---|
| 1 | ML22-04 | 85.13 | 3.8 | 11.07 |
| 2 | ML22-05 | 78.67 | 4.59 | 16.75 |
| 3 | ML22-06 | 85.04 | 4.27 | 10.68 |
| 4 | ML22-07 | 88.30 | 3.35 | 8.35 |
| 5 | ML22-08 | 85.11 | 4.51 | 10.37 |
| 6 | ML22-09 | 70.67 | 10.59 | 18.75 |
| 7 | ML22-10 | 67.41 | 12.79 | 19.8 |
| 8 | ML22-11 | 86.35 | 2.99 | 10.66 |
| 9 | ML22-12 | 80.85 | 4.14 | 15 |
| 10 | ML22-13 | 77.04 | 7.85 | 15.11 |
| 11 | ML22-14 | 81.07 | 3.56 | 15.37 |
| 12 | ML22-15 | 73.89 | 6.9 | 19.22 |
| 13 | ML22-16 | 61.37 | 12.74 | 25.9 |
| 14 | ML22-17 | 37.91 | 18.3 | 43.78 |
| 15 | ML22-18 | 60.89 | 15.05 | 24.06 |
| 16 | ML22-19 | 34.29 | 19.81 | 45.9 |
| 17 | ML22-20 | 65.08 | 8.81 | 26.12 |
| 18 | ML22-21 | 43.04 | 14.72 | 42.24 |
| 19 | ML22-22 | 30.03 | 20.48 | 49.49 |
| 20 | ML22-23 | 18.39 | 53.36 | 28.25 |
| Min. value | 18.39 | 2.99 | 8.35 |
| Max. value | 88.30 | 53.36 | 49.49 |
| Average value | 65.53 | 11.63 | 22.84 |
Table 3.
General characterization of benthic populations from Mangalia-Limanu Lake. (Total Abundance—Ab, Dominance—D%, Occurrence number—Noc, Frequency—F%, Average density—Davg ind.m−2, Ecological density—Deco ind.m−2, Ecological significance index—W).
Table 3.
General characterization of benthic populations from Mangalia-Limanu Lake. (Total Abundance—Ab, Dominance—D%, Occurrence number—Noc, Frequency—F%, Average density—Davg ind.m−2, Ecological density—Deco ind.m−2, Ecological significance index—W).
| Crt. No. | Species/Station | A | D % | Noc | F% | Davg | Deco | W |
|---|
| 1. | Conopeum sp. | 50.4 | 0.18 | 1 | 8.3 | 4.2 | 50.4 | 1.21 |
| 2. | Actinothoe clavata | 151.2 | 0.53 | 1 | 8.3 | 12.6 | 151.2 | 2.10 |
| 3. | Oligochaeta | 176.4 | 0.62 | 2 | 16.7 | 14.7 | 88.2 | 3.21 |
| 4. | Glycera tridactyla | 126 | 0.44 | 1 | 8.3 | 10.5 | 126 | 1.92 |
| 5. | Nereidae | 3502.8 | 12.29 | 9 | 75.0 | 291.9 | 389.2 | 30.36 |
| 6. | Mellina palmata | 25.2 | 0.09 | 1 | 8.3 | 2.1 | 25.2 | 0.86 |
| 7. | Ficopomatus enigmaticus | 327.6 | 1.15 | 1 | 8.3 | 27.3 | 327.6 | 3.09 |
| 8. | Lagis koreni | 50.4 | 0.18 | 1 | 8.3 | 4.2 | 50.4 | 1.21 |
| 9. | Gastropod | 252 | 0.88 | 3 | 25.0 | 21 | 84 | 4.70 |
| 10. | Cerithidium sp. | 13,885.2 | 48.72 | 2 | 16.7 | 1157.1 | 6942.6 | 28.50 |
| 11. | Bittium sp. | 1058.4 | 3.71 | 2 | 16.7 | 88.2 | 529.2 | 7.87 |
| 12. | Rissoidae | 957.6 | 3.36 | 1 | 8.3 | 79.8 | 957.6 | 5.29 |
| 13. | Stagnicola lacustris | 25.2 | 0.09 | 1 | 8.3 | 2.1 | 25.2 | 0.86 |
| 14. | Cerastoderma glaucum | 1764 | 6.19 | 5 | 41.7 | 147 | 352.8 | 16.06 |
| 15. | Pholas dactylus | 50.4 | 0.18 | 1 | 8.3 | 4.2 | 50.4 | 1.21 |
| 16. | Abra nitida | 100.8 | 0.35 | 2 | 16.7 | 8.4 | 50.4 | 2.43 |
| 17. | Abra alba | 277.2 | 0.97 | 4 | 33.3 | 23.1 | 69.3 | 5.69 |
| 18. | Mytilus galloprovincialis | 151.2 | 0.53 | 1 | 8.3 | 12.6 | 151.2 | 2.10 |
| 19. | Mytilaster lineatus | 403.2 | 1.41 | 4 | 33.3 | 33.6 | 100.8 | 6.87 |
| 20. | Tanaidacea | 151.2 | 0.53 | 1 | 8.3 | 12.6 | 151.2 | 2.10 |
| 21. | Cumacea | 554.4 | 1.95 | 3 | 25.0 | 46.2 | 184.8 | 6.97 |
| 22. | Gammaridae | 2520 | 8.84 | 5 | 41.7 | 210 | 504 | 19.19 |
| 23. | Corophium curvispinum | 277.2 | 0.97 | 3 | 25.0 | 23.1 | 92.4 | 4.93 |
| 24. | Ampelisca sarsi | 1587.6 | 5.57 | 2 | 16.7 | 132.3 | 793.8 | 9.64 |
| 25. | Chironomidae pupa | 50.4 | 0.18 | 1 | 8.3 | 4.2 | 50.4 | 1.21 |
| 26. | Rhithropanopeus harrisii | 25.2 | 0.09 | 1 | 8.3 | 2.1 | 25.2 | 0.86 |
Table 4.
Alpha diversity indices.
Table 4.
Alpha diversity indices.
| | ML-22-23 | ML-22-09 | ML-22-22 | ML-22-01 | ML-22-06 | ML-22-13 | ML-22-21 | ML-22-20 | ML-22-17 | ML-22-04 | ML-22-15 |
|---|
| Taxa_S | 14 | 10 | 11 | 3 | 5 | 1 | 3 | 1 | 2 | 5 | 4 |
| Individuals | 8689 | 1611 | 12192 | 301 | 1207 | 25 | 276 | 50 | 176 | 2443 | 1511 |
| Dominance_D | 0.4024 | 0.1963 | 0.5177 | 0.5123 | 0.2815 | 1 | 0.4028 | 1 | 0.7537 | 0.435 | 0.6475 |
| Simpson_1-D | 0.5976 | 0.8037 | 0.4823 | 0.4877 | 0.7185 | 0 | 0.5972 | 0 | 0.2463 | 0.565 | 0.3525 |
| Shannon_H | 1.425 | 1.877 | 1.092 | 0.8273 | 1.389 | 0 | 0.9985 | 0 | 0.413 | 1.025 | 0.6398 |
| Evenness_e^H/S | 0.297 | 0.6532 | 0.271 | 0.7624 | 0.8018 | 1 | 0.9048 | 1 | 0.7556 | 0.5576 | 0.474 |
| Brillouin | 1.414 | 1.849 | 1.085 | 0.7796 | 1.361 | −0.02574 | 0.9502 | −0.03116 | 0.3844 | 1.015 | 0.6282 |
| Menhinick | 0.1501 | 0.249 | 0.0996 | 0.1725 | 0.1438 | 0.1992 | 0.1802 | 0.1409 | 0.1506 | 0.1011 | 0.1029 |
| Margalef | 1.433 | 1.219 | 1.063 | 0.3504 | 0.5637 | 0 | 0.3558 | 0 | 0.1934 | 0.5128 | 0.4098 |
| Equitability_J | 0.5397 | 0.8138 | 0.4554 | 0.75 | 0.8617 | | 0.9056 | | 0.5917 | 0.6365 | 0.4608 |
| Fisher_alpha | 1.631 | 1.421 | 1.191 | 0.4627 | 0.6662 | 0.2081 | 0.4701 | 0.1768 | 0.3161 | 0.6017 | 0.4989 |
| Berger-Parker | 0.6116 | 0.328 | 0.7025 | 0.6647 | 0.3952 | 0.9921 | 0.5447 | 0.9921 | 0.856 | 0.5772 | 0.7831 |
| Chao-1 | 14 | 10 | 11 | 3 | 5 | 1 | 3 | 1 | 2 | 5 | 4 |
| iChao-1 | 14 | 10 | 11 | 3 | 5 | 1 | 3 | 1 | 2 | 5 | 4 |
| ACE | 14 | 10 | 11 | 3 | 5 | 1 | 3 | 1 | 2 | 5 | 4 |
| Squares | 14 | 10 | 11 | 3 | 5 | 1 | 3 | 1 | 2 | 5 | 4 |
| Disclaimer/Publisher’s Note: The statements, opinions and data contained in all publications are solely those of the individual author(s) and contributor(s) and not of MDPI and/or the editor(s). MDPI and/or the editor(s) disclaim responsibility for any injury to people or property resulting from any ideas, methods, instructions or products referred to in the content. |
© 2025 by the authors. Licensee MDPI, Basel, Switzerland. This article is an open access article distributed under the terms and conditions of the Creative Commons Attribution (CC BY) license (https://creativecommons.org/licenses/by/4.0/).


