Article

Annual and Seasonal Trends in Density, Biomass, and Secondary Production of Chironomid Midges (Diptera: Chironomidae) in the Middle Reaches of the Shinano River, Japan, 2015–2019

by
Kimio Hirabayashi
Institute of Textile Science and Technology, School of Science and Technology, Academic Assembly, Shinshu University, 3-15-1, Ueda 386-8567, Japan
Limnol. Rev. 2025, 25(2), 27; https://doi.org/10.3390/limnolrev25020027
Submission received: 25 March 2025 / Revised: 23 May 2025 / Accepted: 27 May 2025 / Published: 6 June 2025

Abstract

The dipteran family Chironomidae is the most widely distributed and, frequently, the most abundant group of insects in freshwater environments. Ecologically, the group plays an important role in trophic cycles and detritus processing in aquatic ecosystems and can be the most productive group of secondary producers in running waters. The annual secondary production of Chironomidae was estimated using emergence trap data from riffles and pools from two stations on the middle reaches of the Shinano River: Tokida Bridge Area (slope 1/180) and Iwano Bridge Area (1/1000). Emergence traps were set up for 24 h on the river’s water surface at three points each in the riffles and pools monthly from April 2015 to March 2019. Five subfamilies of Chironomidae were recorded during the investigation period: Chironominae, Orthocladiinae, Tanypodinae, Diamesinae, and Prodiamesinae. In the Shinano River (Tokida + Iwano area), Orthocladiinae and Diamesinae were the dominant subfamilies in terms of both density (63.2% and 19.0%, respectively) and biomass (62.2% and 25.2%, respectively). Each year’s annual secondary production measured as ash free dry weight (AFDW) was 11.33–55.04 g/m2/year in Tokida and 5.83–38.43 g/m2/year in Iwano. The average annual secondary production of detritus feeder Chironomidae (all except for Tanypodinae) was 24.46 ± 20.38 (ranging from 11.13 in 2015 to 54.67 in 2018) in the Tokida area and 19.61 ± 16.38 (ranging from 5.41 in 2016 to 37.53 in 2017) in the Iwano area. On the other hand, that of carnivorous Chironomidae (Tanypodinae) was 0.22 ± 0.10 (ranging from 0.13 in 2016 to 0.37 in 2018) in the Tokida area and 0.66 ± 0.24 (ranging from 0.42 in 2016 to 0.90 in 2017) in the Iwano area, and overall secondary production averaged 22.48 g/m2/year in the middle reaches of the Shinano River. These values were higher than in previous reports.

Graphical Abstract

1. Introduction

The dipteran family Chironomidae is the most widely distributed and, frequently, the most abundant group of insects in freshwater environments, including springs, streams and seepage areas, rivers, lakes, marshes, and temporary pools (reviewed by Pinder [1]). Numerous studies on the seasonal abundance and growth rates of chironomid midges and larvae in relation to environmental factors have been conducted in both lentic and lotic habitats (reviewed in [2,3]). Ecologically, Chironomidae play important roles in trophic cycles and detritus processing in river ecosystems (reviewed in [4,5,6]). Several previous studies have reported secondary production patterns of Chironomidae from rivers throughout the world (e.g., [7,8,9]). According to Iwakuma [10], among the groups of secondary producers, Chironomidae were the most productive in running water. However, there have been few reports on the seasonal trends in density, biomass, and production of chironomid midges and larvae in the rivers of Japan (e.g., [11]) because of difficulties associated with high densities, species identification, and a general lack of larval identification keys (e.g., [12,13,14,15]). Additionally, the effects of environmental conditions on chironomid populations, including flooding and water quality alterations, are not well known. Recently, energy flow studies have been recognized as a tool in aquatic ecology, with applications in energy–biomass flow studies, trophic ecology, and management of biological resources as well as in the assessment of environmental stress [16].
Many methods have been used to estimate annual secondary production [17]. For example, Speir and Anderson [18] reported the use of emergence data (production/emergence ratio = P/E ratio) to estimate the annual production of aquatic insects. In particular, the annual production of chironomid larvae that live in rivers needs to be estimated from emergence data because the first/second instar larvae are small in size and frequently drift, and the life history is shorter than that of chironomid larvae that live in standing waters, such as lakes and marshes [19]. Thus, the size frequency method cannot be used.
The occurrence and seasonal emergence of several subfamilies of Chironomidae in the middle reaches of the Shinano River were previously reported by Hirabayashi [20], who found that density, emergence, and secondary production of chironomids were strongly influenced by environmental factors such as water temperature, flooding, and season. In the present study, seasonal trends in density and biomass as well as yearly pattern of secondary production of chironomid midges were investigated from 2015 to 2019 in the Shinano river, Japan. The dynamics of secondary production in relation to major flooding events were also investigated.

2. Materials and Methods

2.1. Study Site

This study was performed in the middle reaches of the Shinano River, which is located in the center of Honshu Island (Figure 1). It is Japan’s longest river (length, ca. 367 km; drainage area, ca. 11,900 km2), flowing northward through Nagano and Niigata Prefectures to the Japan Sea. Specific study sites were located in the Tokida area of Ueda City and the Iwano area of Nagano City, Nagano Prefecture (Figure 1).
The riverine environment in these areas, which consists of the ‘unit structure’ of a natural river system, i.e., scour pools, riffles, and runs, has been generally well preserved. In the Tokida area, which has a bed slope of 1/180, the substrate is largely composed of loose cobble and boulders (approximately 10 to 30 cm), and the channel and riverside widths are about 70 m and 200 m, respectively. There is approximately 2500 m2 of riffle area and 1200 m2 of pool (M-type pool) area available for sampling at this location. On the other hand, the river in the Iwano area has a bed slope of 1/1000, the riverbed substrate is primarily composed of cobble and gravel (approximately from 5 to 10 cm), and the channel and riverside widths are about 70 m and 400 m, respectively. At the Iwano site, there is about 500 m2 of riffle area and 5000 m2 of pool area available for sampling. Some artificial structures, e.g., wave-dissipating concrete blocks, that protect the riverbank from erosion have been constructed along the river in both areas.

2.2. Collection of Adult Chironomid Midges

Floating dome-shaped emergence traps (86 cm × 57 cm, basal area 0.49 m2; [21]), which were modifications of those described by LeSage and Harrison [22], were set up for 24 h on the river surface at three points each in the riffles of the Tokida area and Iwano area of the Shinano River. The sides and the dome tops of the traps were made of nylon bolting mesh (300 µm opening). To collect all captured insects, the traps were lifted out of the water with their bases covered, and insects were collected with the aid of a manual suction type entomological aspirator. The collections were made once a month from April 2015 to March 2019 in the Tokida area (4 years) and from April 2016 to March 2019 in the Iwano area (3 years). Collected insects were killed with insecticide spray and stored in 70% ethanol. Chironomid midges were separated from the other insects, and the number of midges was counted in the laboratory. Their wet weight was measured with an electric balance (AND, HM-202). Some specimens of the captured chironomid midges were mounted on slides and identified to the subfamily level according to the key of Pinder [23]. Water level data were obtained from the Ministry of Land, Infrastructure, Transport and Tourism, Japan [24].

2.3. Estimation of Annual Secondary Production of Chironomidae

When specimens could be identified only to the family level or when cohorts could not be distinguished, production was estimated from published turnover ratios (P/B) [25]. Although this is an indirect and coarse approach [26], it may serve at least to obtain order of magnitude estimates of secondary production [27,28,29,30,31]. The annual secondary production of Chironomidae was calculated using the annual emerging biomass and P/E ratio method [18] as follows. Annual secondary production (ash free dry weight (AFDW) g/m2/year) = monthly emergence biomass (AFDW g/m2) × 12 months × P/E ratio. The P/E ratio of chironomid midges was reported to be 2.8 in a previous study [10], but in this study using the Tanypodinae (engulfers and predatory piercers; carnivorous Chironomidae, [32]), it was 2.46, while for other subfamilies, it was 2.94. The sample of chironomid midges was oven-dried at 85 °C until it reached a constant value to determine the dry weight and ignited in a muffle furnace at 550 °C for 30 min to determine the ignition loss. Dry weight was estimated as 0.19 × wet weight [33], and ash free dry weight was estimated as 0.93 × dry weight. Finally, the annual secondary production of Chironomidae was estimated for the area of one river unit structure, one riffle area, and one pool area (AFDW g/one river unit structure/year), in other words, for the Tokida area, riffle sites (m2) × the annual secondary production in riffles (AFDW g/m2/year) + pool sites (m2) × the annual secondary production in pools (AFDW g/m2/year).

3. Results and Discussion

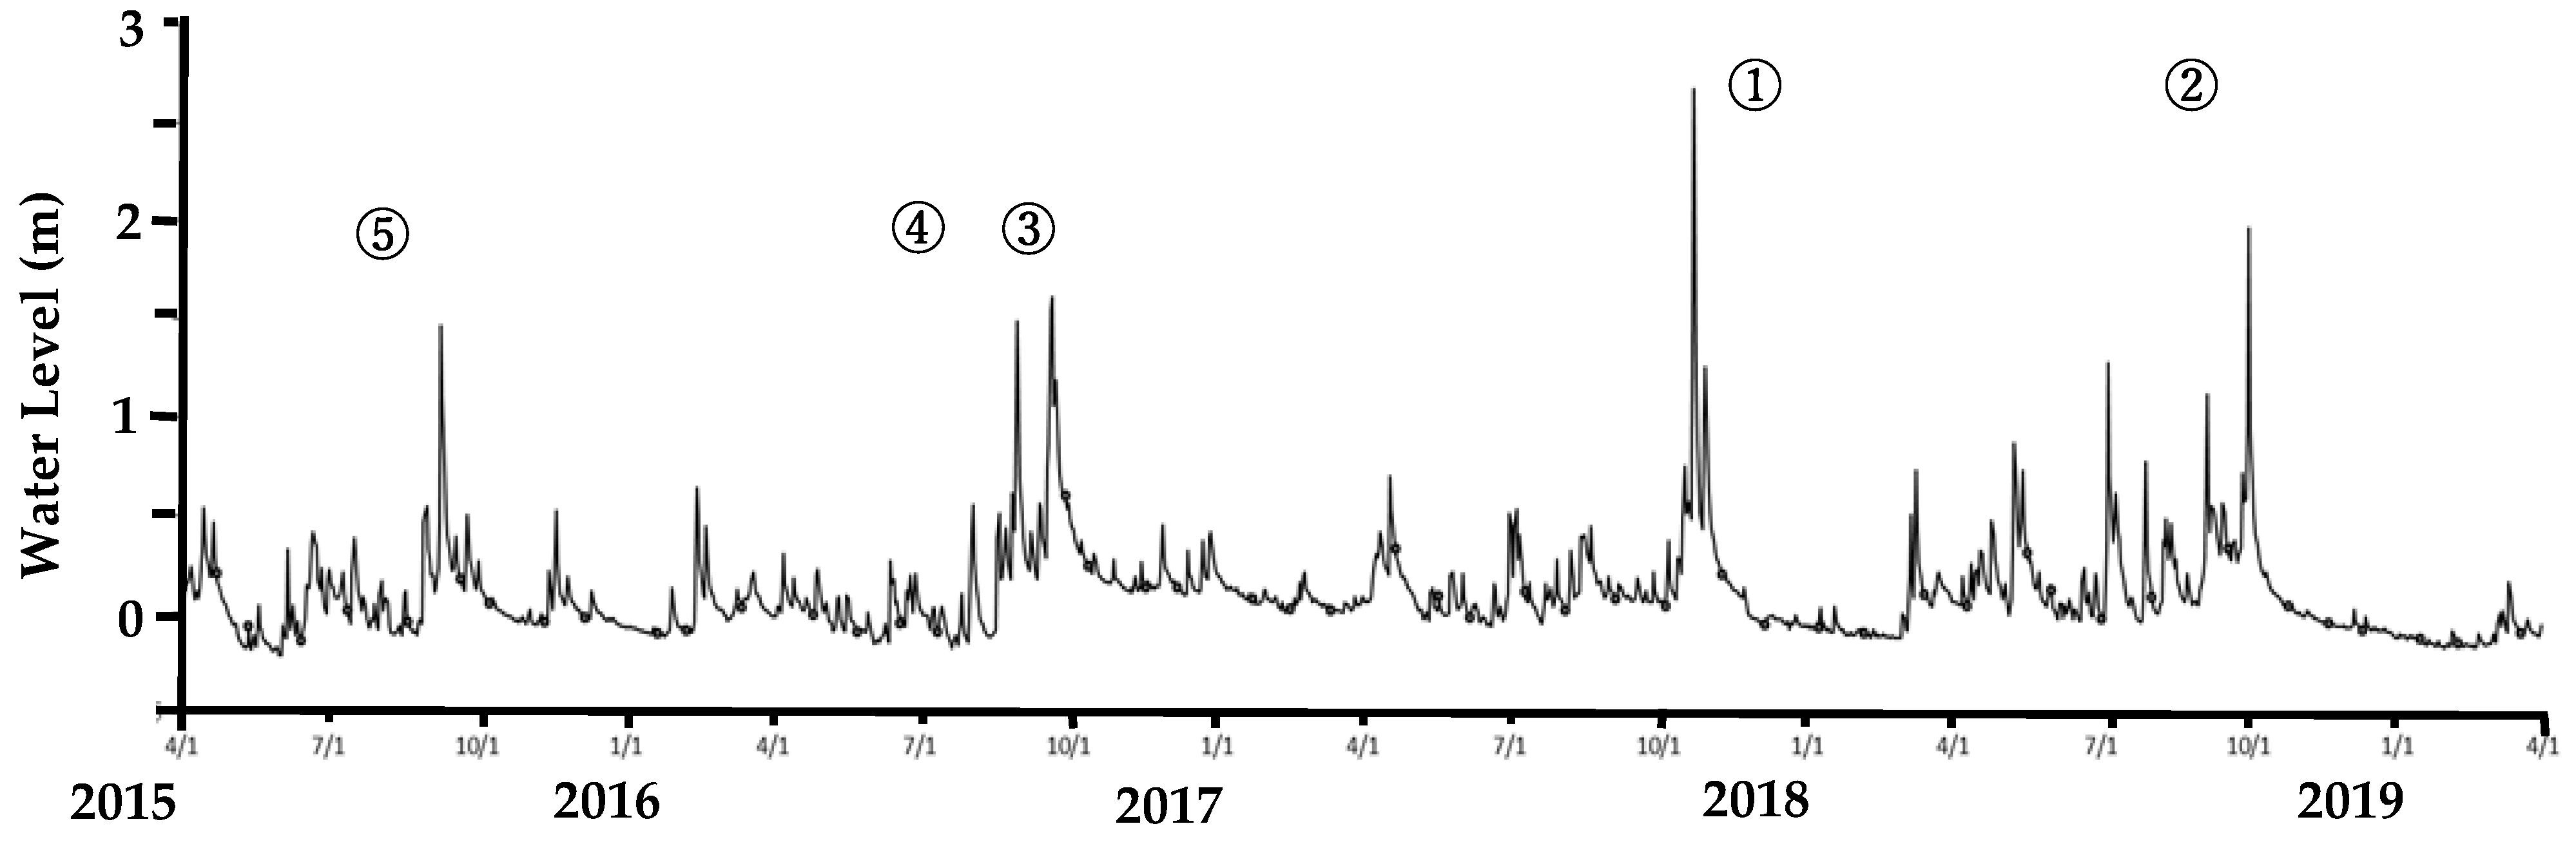
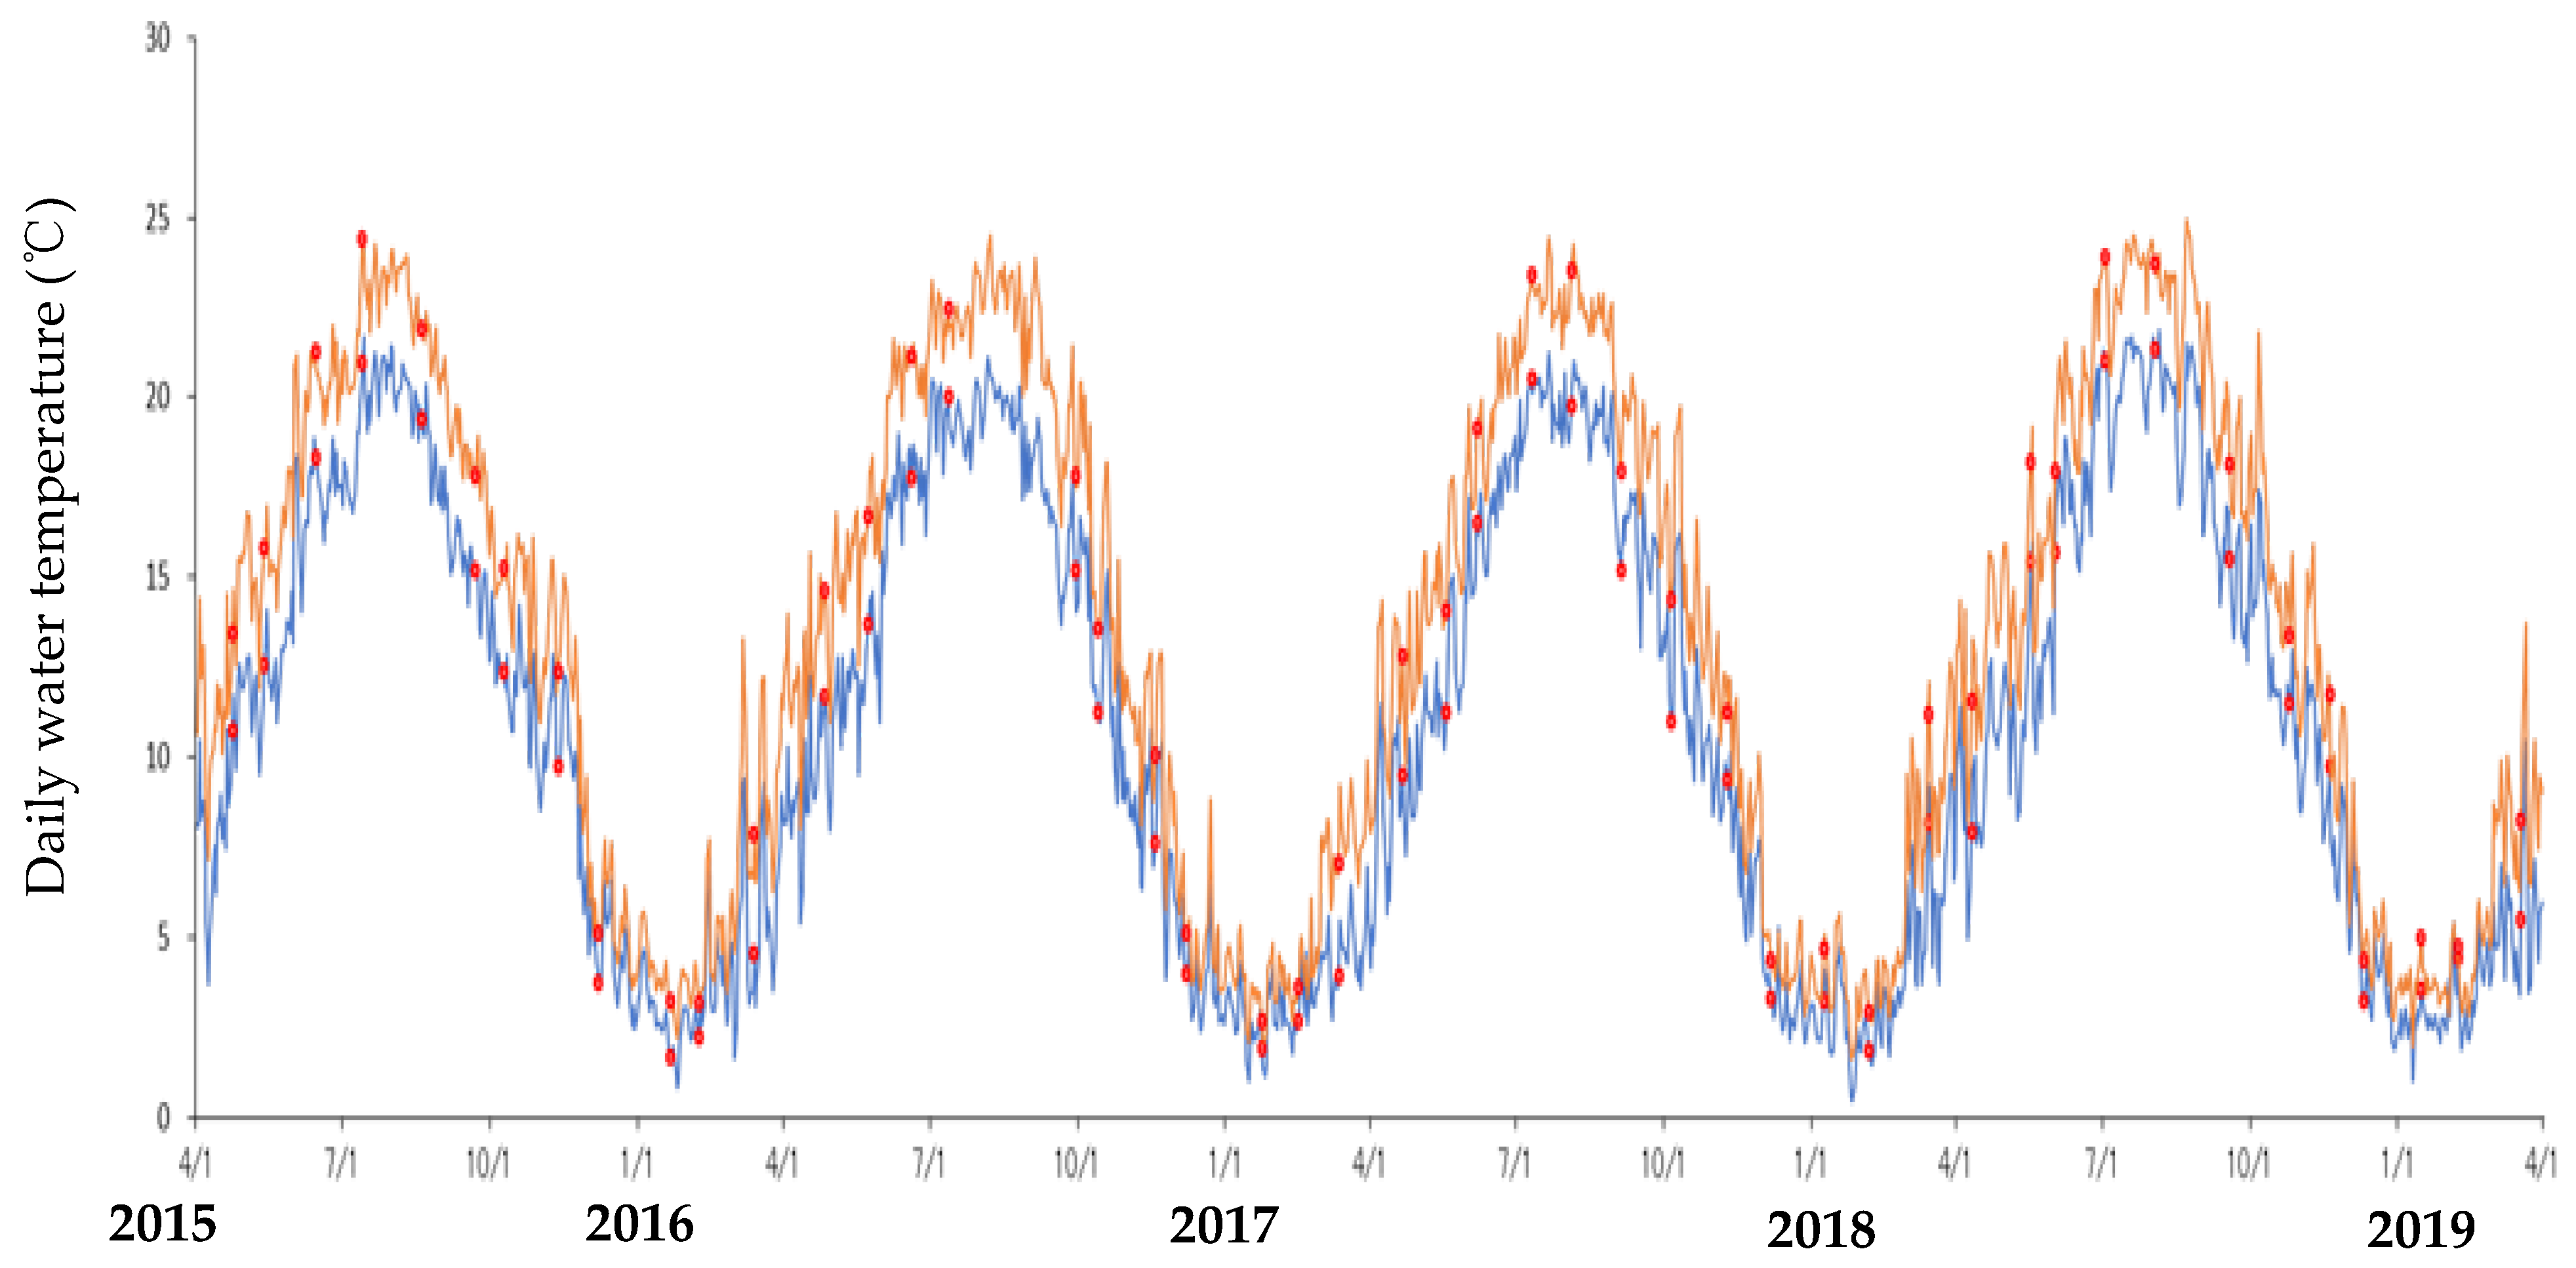
3.1. Environmental Conditions During the Investigation Periods

An exceptionally strong flood (more than 1.50 m above the daily mean water level), in which a 2.75 m peak ① was recorded, occurred on 23 October 2017. The next highest peaks occurred on 1 October 2018 (1.96 m ②), 21 September 2016 (1.61 m ③), 30 August 2016 (1.50 m ④), and 9 September 2015 (1.50 m ⑤). Moreover, there were several small floods (more than 50 cm) from March to October 2018, which were not seen in other years (Figure 2). These levels were recorded at the Ikuta Water Observatory (36°23′ N, 138°16′ E), which is located about 5 km from the sampling site in the Tokida area.
Figure 3 shows the daily mean water temperature during the study period in the Tokida and Ikuta areas. The daily mean water temperature was 10.8 ± 6.2 °C in the Tokida area and 13.4 ± 6.9 °C in the Iwano area.

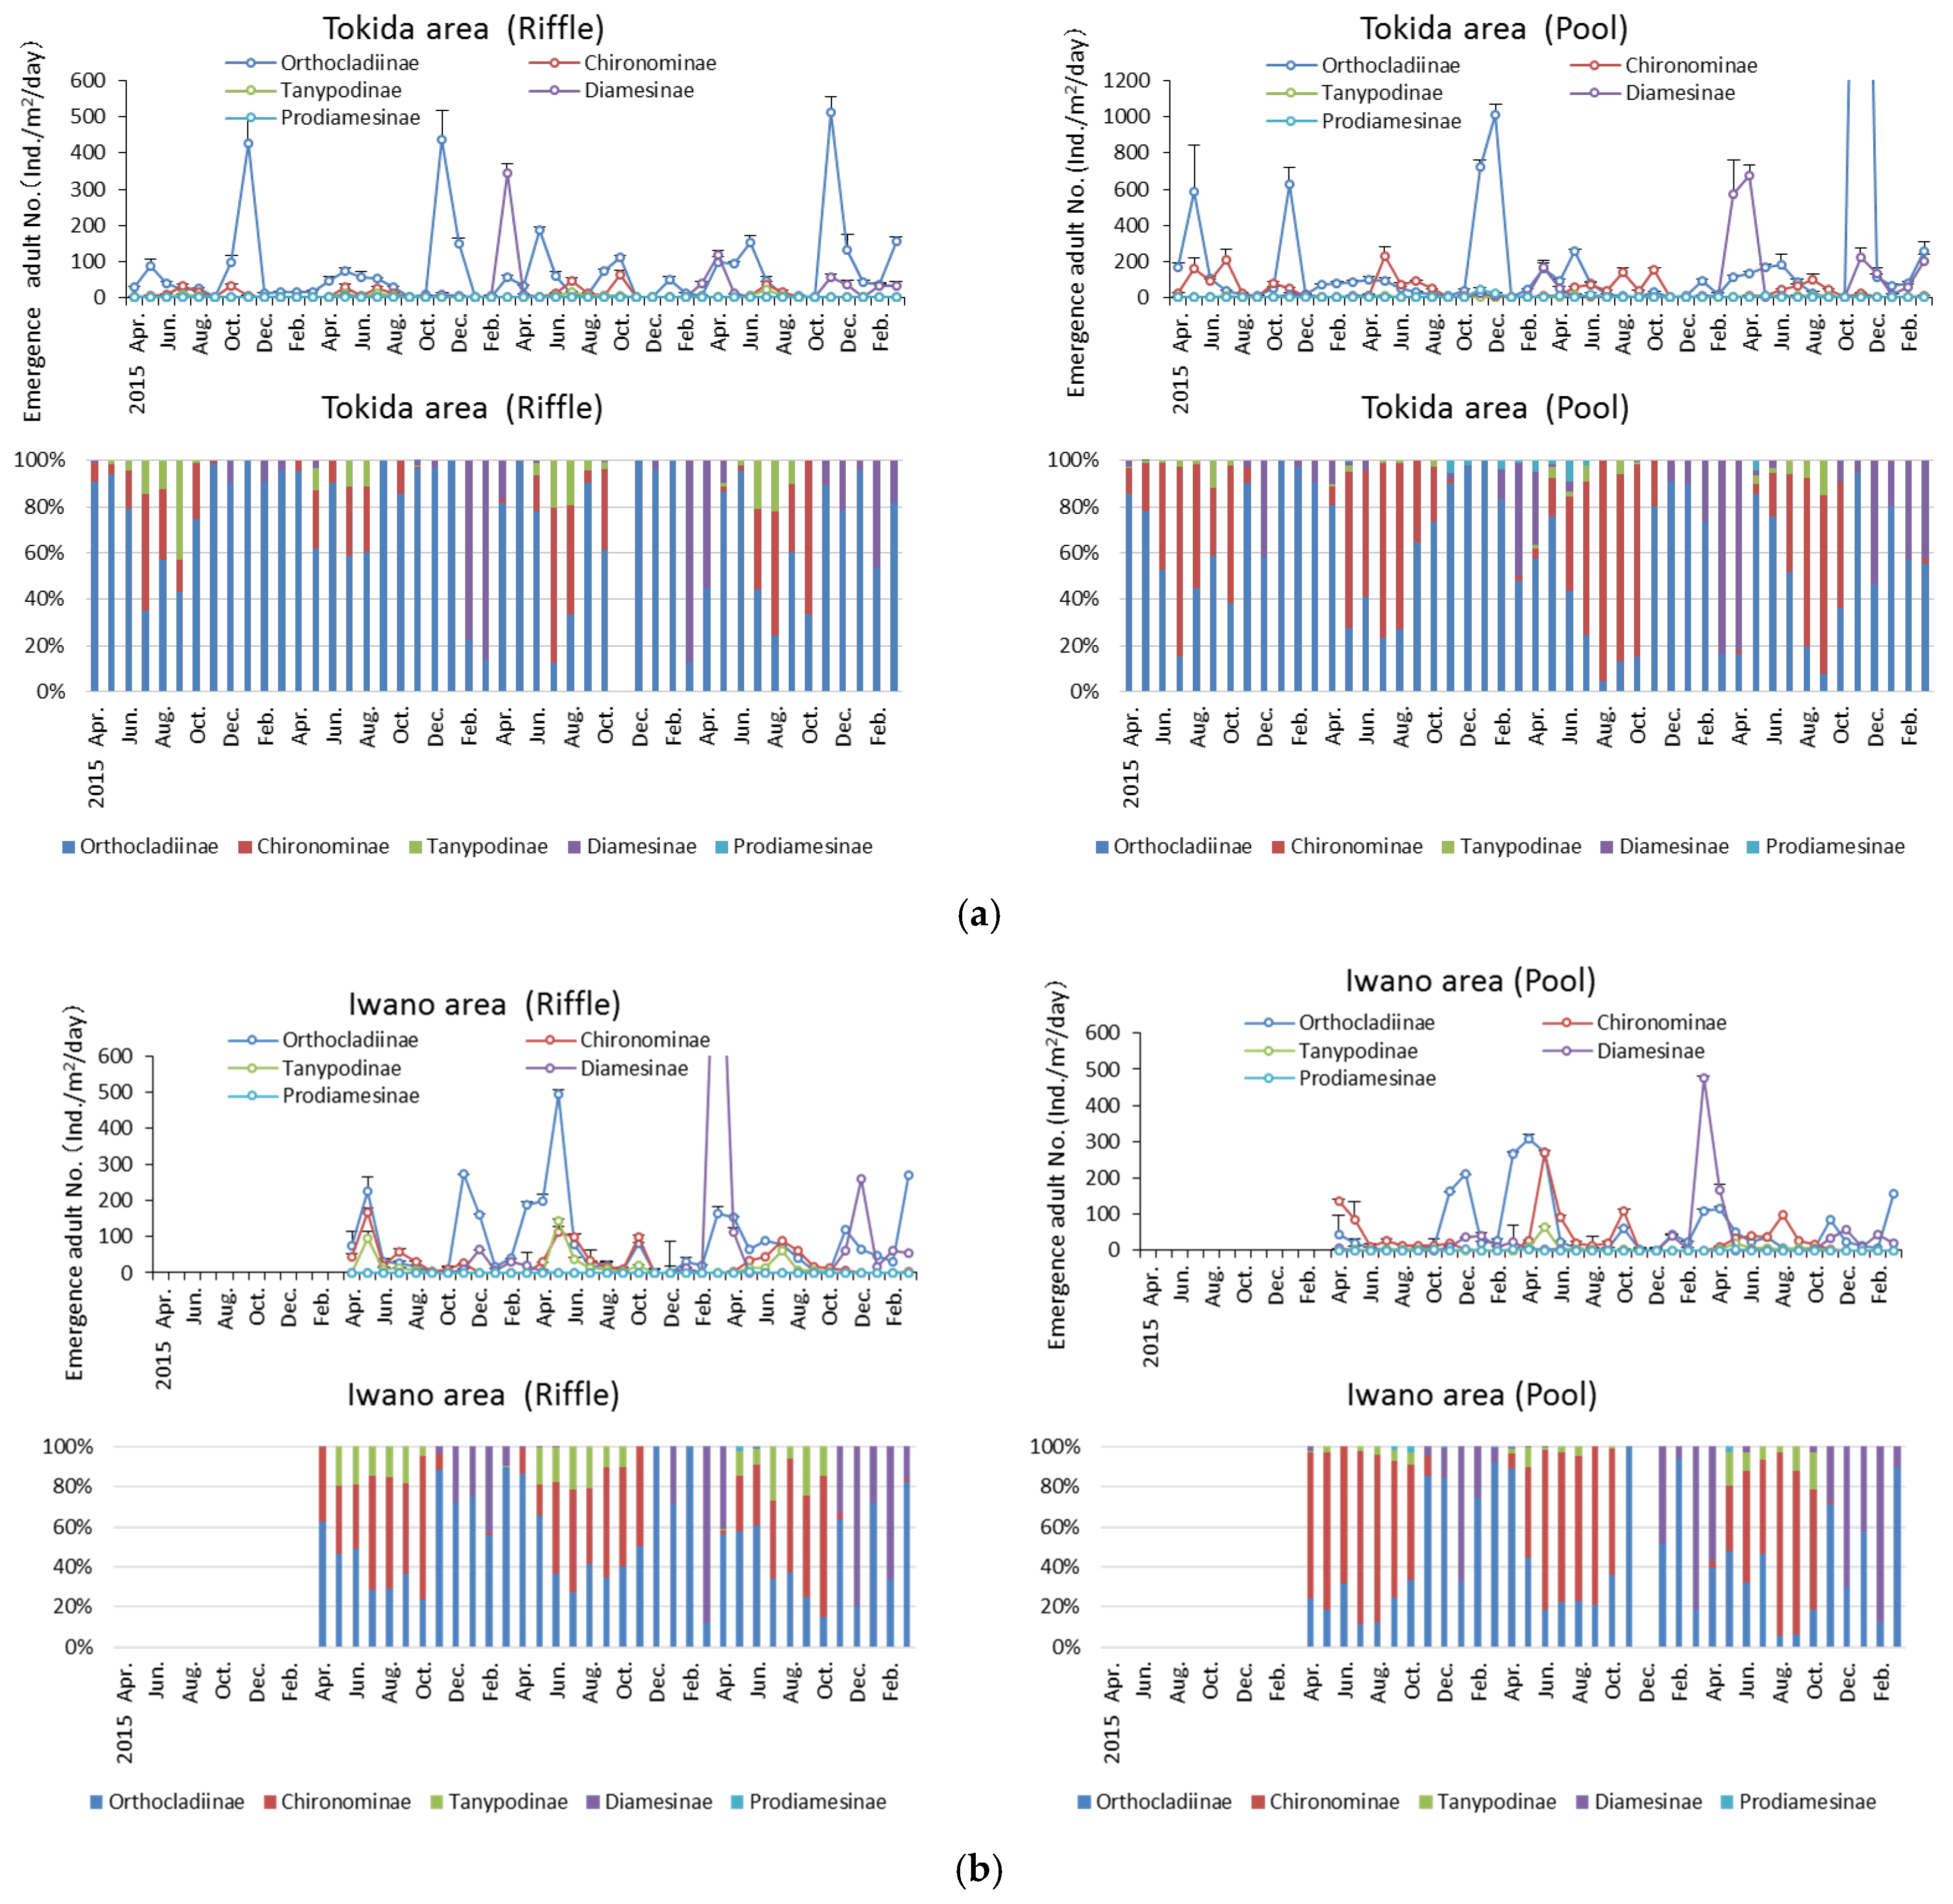
3.2. Seasonal Trends in Density and Biomass of Adult Chironomid Midges

Table 1 shows the annual changes in the emergence densities and biomass of adult chironomid midges (subfamily level). Five subfamilies of Chironomidae were recorded during this study: Orthocladiinae, Chironominae, Tanypodinae, Diamesinae, and Prodiamesinae. A total of 45,433 individual adult midges/three emergence traps (21.1 g wet weight/three emergence traps) were collected from April 2015 to March 2019 in the Tokida area and from April 2016 to March 2019 in the Iwano area (Table 1). In the Shinano River (Tokida + Iwano area), Orthocladiinae and Diamesinae were the dominant subfamilies in terms of both density (63.2% and 19.0%, respectively) and biomass (62.2% and 25.2%, respectively) (Table 1). The average emergence density and biomass (mg wet weight) in the Tokida area during the 4 years were 1746 ± 606 individuals/three traps/year (924.0 ± 967.4 mg biomass/three traps/year) in the riffle site and 5565 ± 3724 (3080.2 ± 3649.7) in the pool site, respectively. In the Iwano area, the average emergence density and biomass during the three sampling years were 3252 ± 1021 (1053.9 ± 864.9) in the riffle site and 2144 ± 683 (639.4 ± 369.3) in the pool site, respectively. The largest number of collected chironomid midges was from the pool site in the Tokida area, while the smallest number was from the riffle site at that same location.
Seasonal changes in the emergence densities and ratios of adult chironomid midges from riffle and pool habitats in the Tokida (Figure 4a) and Iwano (Figure 4b) areas are shown in Figure 4. Chironomid midges emerged from the river throughout the year in both areas. In the Tokida area (Figure 4a), Orthocladiinae were dominant throughout the year, but in the summer when the water temperature was high, the ratio of Chironominae and Tanypodinae densities increased. On the other hand, in the winter when the water temperature was low, the ratio of Diamesinae density increased because this subfamily contains species that are cold-tolerant stenotherms [34].
In the Iwano area (Figure 4b), Orthocladiinae also dominated throughout the year, but in summer, the ratio of the Chironominae density was higher, and the emergence period was longer compared to the Tokida area because the annual mean water temperature was higher for the former area (Figure 3). Members of the Chironominae are warm eurytherms [34].
Seasonal population fluctuations were large at the pool site in the Tokida area compared with the other sites. However, in both areas, there were differences between year and year, and there were two emergence peaks, i.e., in March and May and in November and December each year. However, following the major flood in October 2017, the number of specimens collected in November was nearly zero. At the riffle and pool sites in the Tokida area, there were emergence peaks of Orthocladiinae in November of 2015, 2016, 2018, but there was no emergence peak in 2017. Instead, many adult Diamesinae were collected at the riffle site in March 2017 and at the pool site in March and April of 2018. On the other hand, at the riffle and pool sites in the Iwano area, there were emergence peaks of Diamesinae in March and December and emergence peaks of Orthocladiinae in March to May and November to December of 2015, 2016, 2018, but there was no emergence peak in 2017. In winter from December 2018 to February 2019, the water temperature was lower than in the other years, i.e., monthly mean water temperature was 2.8 °C (0.6 °C below the monthly mean water temperature) in the Tokida area and 3.9 °C (0.6 °C below) in the Iwano area. When the water temperature became lower, many adult Diamesinae began emerging from the river. According to Cranston [34], the ratios of taxa richness among subfamilies likely reflect variation in the proportions of cold stenothermic taxa (Diamesinae and Orthocladiinae) to warm eurytherms (Chironominae), which is in agreement with the findings of this study.

3.3. Range of Annual Secondary Production of Chironomidae in Shinano River

The mean annual secondary production for each chironomid subfamily is shown in Table 2. In the Tokida area, Orthocladiinae was the most important subfamily, with 43,342 (ranging from 17,580 in 2017 to 101,469 in 2018; 5.8-fold difference) AFDW g/one river unit structure/year (63.0%), followed by Diamesinae, with 19,986 (907 in 2015 to 43,464 in 2018; 47.9-fold difference) AFDW g/one river unit structure/year (29.1%) from 2015 to 2018. In 2017, the production of Orthocladiinae was the lowest because large-scale floods occurred in October, and the emergence of Orthocladiinae in November was almost 0 individuals (Figure 2). The production of Diamesinae in 2017 and 2018 was very high, and accordingly, the total chironomid production was highest in 2018.
In the Iwano area, Diamesinae was the most important subfamily, with 49,690 (4980 in 2016 to 113,360 in 2017; 22.8-fold difference) AFDW g/one river unit structure/year (60.9%), followed by the Orthocladiinae, with 22718 (15,180 in 2016 to 29,905 in 2017; 2.0-fold difference) AFDW g/one river unit structure/year (27.8%) from 2016 to 2018. The fluctuation in annual secondary production of Diamesinae was also large in both areas. In 2017, Orthocladiinae and Diamesinae had the highest production because huge numbers of adult midges of Diamesinae emerged in March 2018 (Figure 4b). In addition, the size of Diamesinae (weight of individual bodies was heavy) was larger than other subfamilies in the winter (Figure 4b).
The chironomid annual mean secondary production in each area was estimated (Table 2). In the Tokida area, the annual mean secondary production from 2015 to 2018 was 68,757 (32,766 in 2015 to 150,885 in 2018; 4.6-fold difference) AFDW g/one river unit structure/year. In comparison, in the Iwano area from 2016 to 2018, it was 81,575 (27,460 in 2016 to 152,825 in 2017; 5.6-fold difference) AFDW g/one river unit structure/year.
Finally, the chironomid mean annual secondary production in the middle reaches of the Shinano River was estimated. It was 81,165 (ranging from 34,068 in 2016 to 107,663 in 2018; 3.2-fold difference) AFDW g/one river unit structure/year from 2016 to 2018 (Table 2). The annual secondary production of each chironomid subfamily in the middle reaches of the Shinano River from 2016 to 2018 (Table 2) was also estimated as follows: Orthocladiinae—36,139 (ranging from 22,404 in 2016 to 62,270 in 2018; 2.8-fold difference) AFDW g/one river unit structure/year (44.5%); Chironomidae—4893 (4223 in 2016 to 5756 in 2018; 1.4-fold difference) AFDW g/one river unit structure/year (6.0%); Tanypodinae—1748 (640 in 2016 to 2330 in 2018; 3.6-fold difference) AFDW g/one river unit structure/year (2.2%); Diamesinae—38,018 (5953 in 2016 to 71,003 in 2017; 11.9-fold difference) AFDW g/one river unit structure/year (46.8%); and Prodiamesinae—755 (235 in 2017 to 1211 in 2018; 5.2-fold difference) AFDW g/one river unit structure/year (0.9%). Thus, Diamesinae and Orthocladiinae were important contributors to annual secondary production.
It was clear that the floods had a great impact on the secondary production of Chironomid midges in the middle reaches of the Shinano River during the Orthocladiinae emergence period (March–May and November–December) and on the huge emergence of Diamesinae in winter, which was due to the low water temperatures during that season.
Iwakuma [10] reviewed the secondary production of lotic Chironomidae and the carnivorous chironomids and found they ranged from 0.01 to 28 and 0.01 to 0.4 AFDW g /m2/year. Table 3 shows these values using AFDW g/m2/year. The average annual secondary production of detritus feeder Chironomidae (all except for Tanypodinae) was 24.46 ± 20.38 (ranging from 11.13 in 2015 to 54.67 in 2018) in the Tokida area and 19.61 ± 16.38 (ranging from 5.41 in 2016 to 37.53 in 2017) in the Iwano area. On the other hand, that of carnivorous Chironomidae (Tanypodinae) was 0.22 ± 0.10 (ranging from 0.13 in 2016 to 0.37 in 2018) in the Tokida area and 0.66 ± 0.24 (ranging from 0.42 in 2016 to 0.90 in 2017) in the Iwano area. These values were compared with the review report of Iwakuma [10], which showed larger values than that. Okino [35] reported primary production in this area and stated that the net growth of periphyton biomass was very high because of high nutrient concentration (N and P) in the river water. However, even in the same river and the same season, the present results suggest that the values of annual secondary production differed greatly depending on the flood patterns. Therefore, it may be necessary to estimate the secondary production (which requires a range of variation) in many other rivers based on field observations over several years, as in the present research.
Although regular flooding helps to maintain the nutrient balance of soils in the flood plain, larger or more frequent floods could disrupt ecosystems by displacing aquatic life, impairing water quality, and increasing soil erosion [36]. If the frequency of annual floods increases in the future, it could have a significant impact on the secondary production of aquatic insects, which play an important role in river ecosystems. Chironomidae are highly productive in winter when floods do not occur and are thought to play an important role in river ecosystems. Consequently, when looking at secondary production in river ecosystems, it may be necessary to pay more attention to the winter season, which so far has not been a focus of much inquiry.

4. Conclusions

The annual secondary production of each chironomid subfamily in the middle reaches of the Shinano River from 2016 to 2018 was estimated. Diamesinae, about 38,000 AFDW g/one river unit structure/year (46.8%), and Orthocladiinae, about 36,000 AFDW g/one river unit structure/year (44.5%), in the sum of both species, accounted for 91.3% of the total annual secondary production. Thus, Diamesinae and Orthocladiinae were important contributors to annual secondary production. The floods had a great impact on the secondary production of Chironomid midges in the middle reaches of the Shinano River during the Orthocladiinae emergence period (March–May and November–December) and on the huge emergence of Diamesinae in winter, which was due to the low water temperatures during that season.

Funding

Part of the present study was supported by the River Ecology Research Group of Japan and the River Fund of The River Foundation Japan (No. 2018-5211-016).

Institutional Review Board Statement

Not applicable.

Informed Consent Statement

Not applicable.

Data Availability Statement

Primary data (water level and water temperature) of the Shinano River (the results of measurements on hydrological and meteorological stations in Shinano River) are available from downloading. Ministry of Land, Infrastructure and Transport and Tourism, Japan: Water data base in Ikuta Station http://www1.river.go.jp/cgi-bin/SrchWaterData.exe?ID=304031284416030&KIND=1&PAGE=0 (accessed on 1 June 2025).

Acknowledgments

I wish to thank colleagues at the Shinano River Group for their generous support and assistance during the research program. I express our thanks to K. Ohtsuka, H. Namba, S. Okada, S. Choi, F. Ishikawa, and Y. Kanai for their field work support and data analysis.

Conflicts of Interest

The author declares no conflict of interest.

References

  1. Pinder, L.C.V. The habitats of chironomid larvae. In The Chironomidae: Biology and Ecology of Non-Biting Midges; Armitage, P.D., Cranston, P.S., Pinder, L.C.V., Eds.; Chapman & Hall: London, UK, 1995; pp. 107–135. [Google Scholar]
  2. Lindegaard, C. Classification of water-bodies and pollution. In The Chironomidae: Biology and Ecology of Non-Biting Midges; Armitage, P.D., Cranston, P.S., Pinder, L.C.V., Eds.; Chapman & Hall: London, UK, 1995; pp. 385–404. [Google Scholar]
  3. Tokeshi, M. Life cycles and population dynamics. In The Chironomidae: Biology and Ecology of Non-Biting Midges; Armitage, P.D., Cranston, P.S., Pinder, L.C.V., Eds.; Chapman & Hall: London, UK, 1995; pp. 225–268. [Google Scholar]
  4. Tokeshi, M. Production ecology. In The Chironomidae: Biology and Ecology of Non-Biting Midges; Armitage, P.D., Cranston, P.S., Pinder, L.C.V., Eds.; Chapman & Hall: London, UK, 1995; pp. 269–296. [Google Scholar]
  5. Hirabayashi, K.; Wotton, R. Organic matter processing by chironomid larvae. Hydrobiologia 1998, 382, 151–159. [Google Scholar] [CrossRef]
  6. Wotton, R.; Hirabayashi, K. Midge larvae (Diptera: Chironomidae) as engineers in slow sand filter beds. Water Res. 1999, 33, 1509–1515. [Google Scholar] [CrossRef]
  7. Berg, M.B.; Hellenthal, R.A. Secondary production of Chironomidae (Diptera) in a north temperate stream. Freshw. Biol. 1991, 25, 497–505. [Google Scholar] [CrossRef]
  8. Grzybkowska, M.; Witczak, J. Distribution and production of Chironomidae (Diptera) in the lower course of the Grabia River (Central Poland). Freshw. Biol. 1990, 24, 519–531. [Google Scholar] [CrossRef]
  9. Ladle, M.; Cooling, D.A.; Welton, J.S.; Bass, A.B. Studies on Chironomidae in experimental recirculation stream system. II The growth, development and production of a spring generation of Orthocladius (Euothocladius) calvus Pinder. Freshw. Biol. 1985, 15, 243–255. [Google Scholar] [CrossRef]
  10. Iwakuma, T. Factors controlling the secondary productivity of benthic macroinvertebrates in freshwaters: A review. Jpn. J. Ecol. 1986, 36, 169–187. [Google Scholar]
  11. Kitagawa, N. Production of Chironomid larvae in the Takamigawa River. Investig. Product. Yoshino River 1971, 3, 14–15. [Google Scholar]
  12. Wiederholm, T. Chironomidae of Holarctic region. Keys and diagnoses. Part 1. larvae. Entmol. Scand. Suppl. 1983, 19, 1–457. [Google Scholar]
  13. Vallenduuk, H.J.; Moller-Pillot, H.K.M. Chironomidae Larvae. General Ecology and Tanypodinae; KNNV Publishing: Zeist, The Netherlands, 2007; pp. 1–144. [Google Scholar]
  14. Moller-Pillot, H.K.M. Chironomidae Larvae II. Biology and Ecology of the Chironomini; KNNV Publishing: Zeist, The Netherlands, 2009; pp. 1–144. [Google Scholar]
  15. Moller-Pillot, H.K.M. Chironomidae Larvae III. Biology and Ecology of the Aquatic Orthocladiinae; KNNV Publishing: Zeist, The Netherlands, 2013; pp. 1–314. [Google Scholar]
  16. Dolbeth, M.; Cusson, M.; Sousa, R.; Pardal, M.A. Secondary production as a tool for better understanding of aquatic ecosystems. Can. J. Fish Aqua. Sci. 2012, 69, 1230–1253. [Google Scholar] [CrossRef]
  17. Downing, J.A.; Rigler, F.H. A Manual on Methods for the Assessment of Secondary Productivity in Fresh Waters, 2nd ed.; Blackwell Scientific Publication: Oxford, UK, 1984; pp. 1–501. [Google Scholar]
  18. Speir, J.A.; Anderson, N.H. Use of emergence data for estimating annual production of aquatic insects. Limnol. Oceanogr. 1974, 19, 154–156. [Google Scholar] [CrossRef]
  19. Pinder, L.C.V. Biology of the eggs and first-instar larvae. In The Chironomidae: Biology and Ecology of Non-Biting Midges; Armitage, P.D., Cranston, P.S., Pinder, L.C.V., Eds.; Chapman & Hall: London, UK, 1995; pp. 87–106. [Google Scholar]
  20. Hirabayashi, K. Abundance and seasonal trend of dominant Chironomid midges in the middle reach of the Chikuma River. Jpn. J. Ecol. 2002, 52, 281–285. (In Japanese) [Google Scholar]
  21. Okada, S.; Hirabayashi, K. Effect of emergence trap size on catch in the riffles of the middle reaches of the Chikuma River. Jpn. J. Environ. Entomol. Zool. 2020, 31, 87–94. [Google Scholar]
  22. LeSage, L.; Harrison, A.D. Improved traps and techniques for the study of emerging aquatic insects. Entmol. News. 1979, 90, 65–78. [Google Scholar]
  23. Pinder, L.C.V. A key to adult males of British Chironomidae (Diptera) the non-biting midges. Freshw. Biol. Assoc. Sci. Publ. 1978, 37, 1–169. [Google Scholar]
  24. Ministry of Land, Infrastructure, Transport and Tourism, Japan. Water Data Base in Ikuta Station. Available online: http://www1.river.go.jp/cgi-bin/SrchWaterData.exe?ID=304031284416030&KIND=1&PAGE=0 (accessed on 10 March 2025).
  25. Meyer, E.I.; Poepperl, R. Secondary production of invertebrates in a Central European mountain stream (Steina, Black Forest, Germany). Arch. Hydrobiool. 2003, 158, 25–42. [Google Scholar] [CrossRef]
  26. Poff, N.L.; Huryn, A.D. Multi-scale determinants of secondary production in Atlantic salmon (Salmo salar) streams. Can. J. Fish Aqua. Sci. 1998, 55, 201–217. [Google Scholar] [CrossRef]
  27. Waters, T.F. Secondary production in inland waters. Adv. Ecol. Res. 1977, 10, 91–164. [Google Scholar]
  28. Benke, A.C. Secondary production of aquatic insects. In The Ecology of Aquatic Insects; Resh, V.H., Rosenberg, D.M., Eds.; Praeger Publish: New York, NY, USA, 1984; pp. 289–322. [Google Scholar]
  29. Benke, A.C.; Huryn, A.D.; Ward, G.M. Use of empirical models of stream invertebrate secondary production as applies to a functional feeding group. Verh. Internat. Verein. Limnol. 1998, 26, 2024–2029. [Google Scholar]
  30. Benke, A.C. Production dynamics of riverine chironomids: Extremely high biomass turnover rates of primary consumers. Ecology 1998, 79, 899–910. [Google Scholar] [CrossRef]
  31. Cummins, K.W. Ecology and distribution of aquatic insects. In An Introduction to the Aquatic Insects of North America, 3rd ed.; Merrit, R.W., Cummins, K.W., Eds.; Kendall Hunt: Dubuque, IA, USA, 1996; pp. 68–74. [Google Scholar]
  32. Berg, M.B. Larval food and feeding behavior. In The Chironomidae: Biology and Ecology of Non-Biting Midges; Armitage, P.D., Cranston, P.S., Pinder, L.C.V., Eds.; Chapman & Hall: London, UK, 1995; pp. 136–168. [Google Scholar]
  33. Iwakuma, T.; Yasuno, M.; Sugaya, Y. Chironomid production in relation to phytoplankton primary production in Lake Kasumigaura, Japan. Verh. Internat. Verein. Limnol. 1984, 22, 1150–1159. [Google Scholar] [CrossRef]
  34. Cranston, P.S. Biogeography. In The Chironomidae: Biology and Ecology of Non-Biting Midges; Armitage, P.D., Cranston, P.S., Pinder, L.C.V., Eds.; Chapman & Hall: London, UK, 1995; pp. 62–84. [Google Scholar]
  35. Okino, T. The Nature of Rivers Created by Floods; Shinano-Mainichi-Shinbunn Publishing: Nagano, Japan, 2006; pp. 1–253. [Google Scholar]
  36. United State Environmental Protection Agency. Climate Change Indicators: River Flooding. Available online: https://www.epa.gov/climate-indicators/climate-change-indicators-river-flooding (accessed on 20 May 2025).
Figure 1. Map of the middle reaches of the Shinano River, with location of sampling stations. The arrow indicates the direction of water flow.
Limnolrev 25 00027 g001
Figure 2. Daily mean water level during the study period at the Ikuta Water Observatory, which is located about 3.0 km from the Tokida sampling station in the Shinano River, provided by the Ministry of Land, Infrastructure, Transport and Tourism, Japan [24]. Daily mean water level was set as zero at the beginning of the investigation period, i.e., 1 April 2015. Water levels of more than 1.5 m were floods.
Limnolrev 25 00027 g002
Figure 3. Daily mean water temperature at the Tokida (blue line) and Iwano (orange line) areas in the middle reaches of the Shinano River. Red circles indicate the sampling investigation dates.
Limnolrev 25 00027 g003
Figure 4. Seasonal changes in the emergence densities and subfamily ratios of adult chironomid midges at the riffle and pool sites in the Tokida area (a) and Iwano area (b). Vertical bars indicate standard deviation.
Limnolrev 25 00027 g004
Table 1. Annual changes in the emergence densities and biomass of chironomid midges/three emergence traps (subfamily level) at the riffle and pool sites in the Tokida and Iwano areas in the middle reaches of the Shinano River.
OrthocladiinaeChironominaeTanypodinaeDiamesinaeProdiamesinaeUnknownTotal
Total individual number of chironomid midges/3 Emergence traps
Total biomass (wet weight; mg) of chironomid midges/3 Emergence traps
2015 TokidaRiffle (No.)11521453280201357
(wet-weight; mg)420.059.4 22.26.7 0.0 2.5 510.7
Pool (No.)273593629750173792
(wet-weight; mg)1144.2382.2 17.659.8 0.0 2.9 1606.6
sub-totalRiffle + Pool (No.)38871081 61 83 0 37 5149
(wet-weight; mg)1564.2441.5 39.866.5 0.0 5.4 2117.3
2016 TokidaRiffle (No.)1338120 41 539 1 3 2042
(wet-weight; mg)511.129.6 19.9186.5 0.3 0.3 747.7
Pool (No.)3359716 21332 106 14 4548
(wet-weight; mg)1395.5124.9 12.5170.6 121.8 2.1 1827.3
sub-totalRiffle + Pool (No.)4697836 62871 107 17 6590
(wet-weight; mg)1906.6154.5 32.3357.1 122.1 2.4 2574.9
2016 IwanoRiffle (No.)1566531 196194 0 17 2504
(wet-weight; mg)370.593.5 95.584.3 0.0 1.3 645.0
Pool (No.)1137457 11178 4 8 1795
(wet-weight; mg)260.0125.1 5.289.2 4.2 0.6 484.3
sub-totalRiffle + Pool (No.)2703988 207372 4 25 4299
(wet-weight; mg)630.5218.6 100.7173.5 4.2 1.9 1129.3
2017 TokidaRiffle (No.)807207 4872 0 4 1138
(wet-weight; mg)332.248.4 21.5152.1 0.0 0.6 554.8
Pool (No.)1058752 47957 46 2 2862
(wet-weight; mg)147.4157.4 22.350.2 34.3 0.5 412.1
sub-totalRiffle + Pool (No.)1865959 951029 46 6 4000
(wet-weight; mg)479.6205.8 43.8202.3 34.3 1.1 966.9
2017 IwanoRiffle (No.)1641595 3351842 0 2 4415
(wet-weight; mg)229.496.4 139.93.4 0.0 0.1 469.2
Pool (No.)1246805 110 769 1 0 2931
(wet-weight; mg)199.2110.6 57.9 4.6 0.6 0.0 372.9
sub-totalRiffle + Pool (No.)28871400 445 2611 1 2 7346
(wet-weight; mg)428.6207.0 197.8 8.0 0.6 0.1 842.1
2018 TokidaRiffle (No.)188092 51 425 0 0 2448
(wet-weight; mg)1294.540.7 43.8 503.8 0.0 0.0 1882.8
Pool (No.)8599448 60 1938 12 0 11,057
(wet-weight; mg)5652.0255.5 40.8 2511.5 14.9 0.0 8474.7
sub-totalRiffle + Pool (No.)10,479540 111 2363 12 0 13,505
(wet-weight; mg)6946.5296.2 84.6 3015.3 14.9 0.0 10,357.5
2018 IwanoRiffle (No.)1438399 157 839 5 0 2838
(wet-weight; mg)794.9166.0 97.2 983.1 6.2 0.0 2047.4
Pool (No.)767389 64482 4 0 1706
(wet-weight; mg)371.5125.9 50.4509.2 3.9 0.0 1060.9
sub-totalRiffle + Pool (No.)2205788 2211321 9 0 4544
(wet-weight; mg)1166.4291.9 147.61492.3 10.1 0.0 3108.3
Total TokidaRiffle (No.)5177564 1721044 1 27 6985
(4 years)(wet-weight; mg)2557.8178.1 107.4849.1 0.3 3.4 3696.0
Pool (No.)15,7512852 1573302 164 33 22,259
(wet-weight; mg)8339.1919.9 93.22792.1 171.0 5.4 12,320.6
Sub-totalRiffle + Pool (No.)20,9283416 3294346 165 60 29,244
(wet-weight; mg)10,896.91098.0 200.53641.2 171.3 8.8 16,016.6
Total IwanoRiffle (No.)464515256882875 5 19 9757
(3 years)(wet-weight; mg)1394.8355.85332.61070.8 6.21.353161.6
Pool (No.)3150 1651 185 1429 9 8 6432
(wet-weight; mg)830.7 361.6 113.5 603.0 8.7 0.6 1918.1
Sub-totalRiffle + Pool (No.)7795 3176 873 4304 14 27 16,189
(wet-weight; mg)2225.5 717.5 446.1 1673.8 14.9 2.0 5079.7
Tokida + Iwano Tokida + Iwano (No.)28,723 6592 1202 8650 179 87 45,433
%63.214.5 2.6 19.0 0.4 0.2 100.0
(wet-weight; mg)13,122.4 1815.4 646.6 5315.0 186.2 10.8 21,096.3
%62.2 8.6 3.1 25.2 0.9 0.1 100.0
Table 2. Annual mean secondary production values for chironomid subfamilies in the Shinano River, Japan. Values are ash free dry weight g/one river structure/year.
2015201620172018Average%
Tokida areaOrthocoladiinae24,692 29,627 17,580 101,469 43,342 63.0
Chironominae6290 2005 3206 4206 3927 5.7
Tanypodinae791 569 826 1554 935 1.4
Diamesinae907 6925 28,646 43,464 19,986 29.1
Prodiamesinae0 1488 420 192 525 0.8
Unknown111 24 37 0 43 0.1
Sub-total32,766 40,675 50,703 150,885 68,757 100.0
Iwano areaOrthocoladiinae 15,180 29,905 23,070 22,718 27.8
Chironominae 6440 6195 7305 6647 8.1
Tanypodinae 710 3725 3105 2513 3.1
Diamesinae 4980 113,360 30,730 49,690 60.9
Prodiamesinae 150 50 2230 810 1.0
Unknown 55 0 0 18 0.0
Sub-total 27,460 152,825 64,440 81,575 100.0
The middle reaches of the Shinano River (Average of Tokida and Iwano area)Orthocoladiinae 22,404 23,743 62,270 36,139 44.5
Chironominae 4223 4701 5756 4893 6.0
Tanypodinae 640 2276 2330 1748 2.2
Diamesinae 5953 71,003 37,097 38,018 46.8
Prodiamesinae 819 235 1211 755 0.9
Unknown 40 19 0 19 0.0
Sub-total 34,068 101,764 107,663 81,165 100.0
Table 3. Each chironomid subfamily’s annual mean secondary production (ash free dry weight g/m2/year) in the middle reaches of the Shinano River.
YearAreaOrthocladiinaeChironominaeDiamesinaeProdiamesinaeDetritus feeder *TanypodinaeUnknownTotal
AFDW g/m2/year
2015Tokida Riffle4.50 ± 0.180.65 ± 0.280.07 ± 0.040.0 ± 0.05.220.20 ± 0.050.03 ± 0.025.44 ± 0.97
Tokida Pool12.24 ± 1.614.15 ± 1.370.64 ± 0.220.0 ± 0.017.030.16 ± 0.080.03 ± 0.0217.22 ± 2.47
Average of R & P8.37 ± 1.102.40 ± 0.810.36 ± 0.130.0 ± 0.011.13 0.18 ± 0.030.03 ± 0.0111.33 ± 1.67
2016Tokida Riffle5.28 ± 1.110.26 ± 0.072.03 ± 0.220.00 ± 0.017.57 0.15 ± 0.050.0 ± 0.07.73 ± 1.18
Tokida Pool14.92 ± 1.771.21 ± 0.171.84 ± 0.461.30 ± 0.3819.29 0.11 ± 0.100.02 ± 0.0319.40 ± 1.90
Average of R & P10.10 ± 1.250.74 ± 0.101.93 ± 0.150.65 ± 0.1913.43 0.13 ± 0.080.01 ± 0.0213.56 ± 1.16
Iwano Riffle3.94 ± 0.330.92 ± 0.080.90 ± 0.190.0 ± 0.05.78 0.81 ± 0.250.01 ± 0.016.59 ± 0.19
Iwano Pool2.79 ± 0.841.24 ± 0.250.96 ± 0.190.04 ± 0.035.04 0.04 ± 0.040.01 ± 0.015.08 ± 0.63
Average3.37 ± 0.591.08 ± 0.120.93 ± 0.020.02 ± 0.025.41 0.42 ± 0.130.01 ± 0.05.83 ± 0.41
2017Tokida Riffle3.78 ± 0.590.53 ± 0.051.66 ± 0.870.0 ± 0.05.97 0.20 ± 0.050.01 ± 0.016.17 ± 0.87
Tokida Pool7.51 ± 0.721.71 ± 0.2521.61 ± 12.810.37 ± 0.1331.20 0.20 ± 0.100.01 ± 0.0131.40 ± 13.42
Average of R & P5.64 ± 0.191.12 ± 0.1411.63 ± 6.440.18 ± 0.0718.59 0.20 ± 0.330.01 ± 0.0118.79 ± 6.48
Iwano Riffle6.50 ± 0.931.04 ± 0.2541.07 ± 6.700.0 ± 0.048.62 1.27 ± 0.230.0 ± 0.049.89 ± 7.13
Iwano Pool5.55 ± 0.601.20 ± 0.0819.70 ± 3.920.01 ± 0.0126.45 0.53 ± 0.220.0 ± 0.026.98 ± 3.43
Average of R & P6.03 ± 0.761.12 ± 0.0930.39 ± 3.820.0 ± 0.0137.53 0.90 ± 0.100.0 ± 0.038.43 ± 3.88
2018Tokida Riffle13.83 ± 1.210.44 ± 0.325.41 ± 0.770.0 ± 0.019.69 0.37 ± 0.210.0 ± 0.020.06 ± 1.08
Tokida Pool59.97 ± 25.782.77 ± 0.3226.75 ± 1.720.16 ± 0.0589.65 0.37 ± 0.090.0 ± 0.090.02 ± 26.97
Average of R & P36.90 ± 13.411.60 ± 0.1916.08 ± 0.680.08 ± 0.0354.67 0.37 ± 0.090.0 ± 0.055.04 ± 13.85
Iwano Riffle8.55 ± 2.261.80 ± 0.7510.56 ± 4.520.07 ± 0.0620.98 0.88 ± 0.650.0 ± 0.021.86 ± 8.18
Iwano Pool3.99 ± 0.181.35 ± 0.445.40 ± 0.770.04 ± 0.0610.78 0.46 ± 0.100.0 ± 0.011.24 ± 1.10
Average of R & P6.27 ± 1.221.57 ± 0.377.98 ± 2.050.06 ± 0.0215.88 0.67 ± 0.370.0 ± 0.016.55 ± 3.90
AverageTokida area 24.46 ± 20.380.22 ± 0.10
Iwano area 19.61 ± 16.380.66 ± 0.24
* Detritus feeder = Orthocladiinae + Chironominae + Diamesinae + Prodiamesinae.
Disclaimer/Publisher’s Note: The statements, opinions and data contained in all publications are solely those of the individual author(s) and contributor(s) and not of MDPI and/or the editor(s). MDPI and/or the editor(s) disclaim responsibility for any injury to people or property resulting from any ideas, methods, instructions or products referred to in the content.

