1. Introduction
Nuclear aberrations are visible modifications that can be caused by stressors that damage the cell’s homeostasis during mitosis [
1]; their origin is well theorized, and several authors have described different origins during mitosis phases. In fact, the literature has pointed out possible mechanisms for the formation of micronuclei, particularly during anaphase and telophase. In general, it is thought that during mitosis, double-strand breaks (DSBs) or broken chromosome ends may appear during anaphase. If unrepaired, these breaks can lead to the formation of acentric or dicentric fragments, respectively [
2]. Due to their shape and structure, acentric fragments are unable to attach to the mitotic spindle fibers and therefore remain outside the nucleus after the nuclear envelope reforms in telophase. Conversely, dicentric fragments may form anaphase bridges that, during telophase, can evolve into various structures, including micronuclei [
2]. Among nuclear aberrations, micronuclei, frequently reported as “Mn”, are intracellular, round-shaped inclusions made of chromatin fragments or whole chromosomes that fail to join the rest of the nucleus during mitotic events either due to chromosomal breakage or to cytoskeletal dysfunction during the formation of the spindle apparatus [
1,
2,
3]. Upon micronucleus formation, the nucleus is reduced in size as part of the chromatin is detached from it and encapsulated in micronuclei [
4]. Micronuclei can form naturally during cellular metabolism and aging processes, but their formation can also be induced by exposure to environmental factors that have the properties to cause cytogenetic damage [
5]. There are a series of factors that are known in literature to be causing micronuclei [
3]; therefore, the presence of micronuclei in active tissues is a reliable tool to test for exposure to genotoxic contaminants and environmental hazards, with the advantage that micronuclei can be searched in the interphase of all proliferative cell populations regardless of their karyotype [
6]. The Micronucleus tests (MnT) can be carried out on several types of tissues, like epithelial cells derived from gills [
7] or from the oral mucosa [
8], liver [
9], kidney [
10], skin, spleen, lungs [
11], but, most importantly, from peripheral blood [
1,
10,
12]. While micronuclei present in non-circulating cells reflect a cytotoxic damage that occurred over the time span of that cytotype’s cell cycle, micronuclei in peripheral circulating cells (i.e., erythrocytes and leukocytes) are the result of the total exposure to all cytotoxic events that occurred from hematopoiesis and throughout the lifespan of each circulating cytotype [
13]. The piscine Micronucleus Test (piscine MnT) has since been recognized as a straightforward, cost-effective, and reliable method for assessing genotoxicity in fish. It is widely applicable in both wild and laboratory settings, enabling researchers to evaluate the effects of genotoxic compounds under natural environmental exposure or controlled experimental conditions with consistent and reproducible results [
13].
Along with micronuclei, other cytological abnormalities were observed in fish erythrocytes [
14,
15,
16]. These modifications can be described as nuclear abnormalities if they involve the nucleus or cytoplasmic abnormalities when the nucleus appears normal, but the cytoplasm does not. The main nuclear abnormalities include micronuclei and binucleated erythrocytes, when two nuclei (either touching or not) are present and have roughly the same diameter, blebbed nuclei, when a small elongated nuclear projection emerges from the nucleus; notched nuclei, when an incisure is present in one side of the nucleus; budded nuclei, when small rounded projections emerge from the nucleus with a visible constriction; lobed nuclei, when small (but bigger than in budding) rounded projections emerge from the nucleus without a visible constriction; nuclear bridges, when two nuclei, either from the same or from two different erythrocytes are connected by a bridge-like structure made of chromatin; vacuolated nuclei, if depigmented areas are present inside the nucleus; and condensed nuclei, if the nucleus loses its elliptical shape in favor of a more rounder one [
15,
16]. The main cytoplasmic abnormalities include: anisochromatic erythrocytes, that have a pigmented periphery and are depigmented in the center; vacuolated erythrocytes, that present one or more vacuoles in the cytoplasm; echinocytes, erythrocytes with cytoplasmic projections emerging from the periphery of the cytoplasm; enucleated erythrocytes, cells that do not present a nucleus; and microcytes, erythrocytes of significantly reduced size [
14]. For these reasons, both micronuclei and nuclear aberrations have been used as indicators of exposure to mutagenic or genotoxic contaminants in numerous fish species, both in in situ evaluations using wild animals and in exposure-driven experiments with caged animals and arbitrarily selected chemicals [
17,
18].
Lake Piediluco is a freshwater lake situated at the border between the regions of Umbria and Latium, in Central Italy. The lake extends primarily in an East-West direction but also has several branches that extend from North to South, giving an irregular shape to the lake that has a perimeter of 14.84 km and covers a surface area of roughly 1.67 km
2 [
19]. Lake Piediluco plays a key role in the local water management system and electric energy production. In fact, the lake receives inflows from the Medio-Nera channel and the Velino River that are regulated by a series of gates as the water is conveyed in a hydroelectric plant that determines the hydraulic regime of the lake. Water is allowed to accumulate in the lake before being diverted either to the hydroelectric plant or to the man-made Marmore waterfall during weekends and holidays. This daily, human-mediated management of the water significantly influences the lake’s water level and its inflow-outflow pattern throughout the year [
19]. A comprehensive survey carried out in 2010, based on data collected from 1988 to 2004, provided the first data on the fish community in Lake Piediluco [
19]. The survey confirmed the consistent presence of the native European perch (
Perca fluviatilis Linnaeus, 1758) and Southern pike (
Esox cisalpinus Bianco and Dalmastro, 2011 syn.
E. flaviae Lucentini et al. 2011), along with the alien common rudd (
Scardinius erythrophthalmus (Linnaeus, 1758)) in the lake throughout all the sampling seasons. It should be noted that in freshwaters of Central Italy, including in Lake Piediluco, the presence of first- and later-generation hybrids between Southern and Northern pikes has been well documented [
20]. For this reason, in this paper, pikes are referred to as
Esox spp. While reports on aquatic contamination using the micronucleus test are already present for both
P. fluviatilis [
21,
22,
23] and
S. erythrophtalmus [
23,
24], no prior studies were carried out assessing the presence of micronuclei in southern pike or its hybrids, but just in the Northern pike (
Esox lucius Linnaeus 1758) [
25,
26].
The present study aims to compare the occurrence of micronuclei and nuclear aberrations in three teleost species from Lake Piediluco, providing the first report of micronuclei and nuclear aberrations for southern pike and also determining which species is best suited for potential future in situ monitoring applications.
2. Materials and Methods
Three teleost species were used in this study: European perch (
Perca fluviatilis), rudd (
Scardinius erythrophthalmus), and pike. Pikes were grouped by genus (
Esox spp.) as, following Lucentini et al. [
20], without the support of morphometrical and biomolecular data, it is more correct to refer to this
taxon by the genus due to the high frequency of hybrids found between Southern (
Esox flaviae) and Northern pike (
E. lucius). These three
taxa were chosen because they are representative of different ecological strategies and niches within the lake. The artificial hydraulic regulation of the lake makes it so that its waters are daily mixed and changed, ensuring uniformity of potential stressors across different niches. Twenty adult specimens for each of the three species (60 adult specimens in total) were provided by fishermen working on the Piediluco Lake.
To evaluate the presence of micronuclei, five peripheral blood smears were prepared from each fish. To prepare these smears, a total of 0.2–0.4 mL of blood was collected from each fish. Peripheral blood was drawn from the caudal vein approximately 1 cm caudal to the anal fin, using a heparinized 0.5 mL syringe fitted with a 25 G needle.
All slides were independently coded, a single drop of blood was smeared over the slide and air-dried for 24 h at room temperature, and slides were fixed in methanol for 10 min and stained with 10% Giemsa (
v/
v) [
27,
28]. A single slide was randomly chosen and observed for each fish, while the other four were used in case of nonuniform smearing or staining. The slides were analyzed using an BX50 microscope (Olympus, Tokyo, Japan) with a 100× oil-immersion lens; digital images were acquired with a True Chrome HD II S Camera (T Esse Lab, Milan, Italy). For each slide, 1000 erythrocytes were randomly counted, and the number of micronuclei and nuclear aberrations were recorded using two separate tally counters. In order to reach a total count of 1000 erythrocytes, it was necessary to examine several microscopic fields across the slide. To ensure that the same cells were not counted more than once, the fields were consistently analyzed in a linear fashion, moving from left to right. This systematic approach helped maintain accuracy by preventing any backward movement or overlap with previously observed areas. Micronuclei and other nuclear alterations were identified using the criteria described by Fenech et al. [
29]. Furthermore, micronucleus dimension was established by comparing the micronucleus area to the nuclear area [
29]. Areas were evaluated using ImageJ 1.54 g with Mac OS Sequoia 15.2, delineating the nucleus and micronucleus with an Apple Pencil on an iPad in screen mirroring mode. Percentage values were calculated and statistically analyzed as reported below. The measurement of areas is essential for non-rounded structures, such as erythrocytes and their associated nuclei in fish, for which it is not possible to proceed with the identification of a unique diameter. The procedure outlined by Fenech for calculating the ratio between the micronuclei area and one of the main nuclei in a binucleated cell was adapted for non-binucleated cells.
These variables were assessed for normality of distribution. Given that most of the data were not normally distributed, nonparametric tests were applied for the analysis. For these reasons, to compare overall differences between the groups, the Kruskal–Wallis test, a nonparametric version of the Wilcoxon rank sum test, was used to calculate the overall p-value. When the overall p-value was less than 0.05, pairwise comparisons between groups were conducted using the Wilcoxon test for multiple comparisons by reporting results directly in the plots.
The statistical analyses here described were performed using JASP Team (2024), JASP (Version 0.19.3) [Computer software] (
https://jasp-stats.org) (accessed on 12 March 2025), and the R software for Statistical Computing (R version 4.4.2 (2024-10-31)—“Pile of Leaves”) (
https://www.r-project.org/) (accessed on 12 March 2025), under the IDE R Studio Version 2024.12.1+563 (
https://www.rstudio.com/) (accessed on 12 March 2025).
3. Results
The micronuclei and nuclear aberrations analysis was performed for all the sampling sets: 60 slides in total, 20 per species, with one slide analyzed for each individual.
Figure 1 shows eight examples of nuclear aberrations and micronuclei found in the analyzed species.
A total of 60 slides (20 for each species) were inspected for the presence of micronuclei and nuclear aberrations, counting 1000 erythrocytes for each slide. Overall, no micronuclei were observed in
S. erythrophthalmus slides, while 85 (0.42%) and 776 (3.88%) were counted in
P. fluviatilis and
Esox spp., respectively. Nuclear abnormalities were more abundant than micronuclei in both
Esox spp. (4639, 23.18%) and
S. erythrophthalmus (3064, 15.32%), while just 3 nuclear aberrations (0.01%) were detected in
P. fluviatilis.
Table 1 presents descriptive statistics for the three species,
Esox spp.,
P. fluviatilis (Pf), and
S. erythrophthalmus (Se), across the two different categories: micronuclei number and nuclear aberrations number. The descriptive statistics provided for each species include the mean, standard deviation, skewness, kurtosis, Shapiro-Wilk test, and range values.
The micronuclei number ranges from 5 to 128 (range of 123, mean 38.80 ± 36.96) for Esox spp., from 2 to 10 (range of 8, mean 4.25 ± 2.07) for P. fluviatilis, and is equal to 0 for S. erythrophthalmus. The NA number had a much broader range, especially for Esox spp., in which it ranged from 46 to 630 (range of 584, mean 231.95 ± 137.05), and S. erythrophthalmus, in which it ranged from 32 to 372 (range of 340, mean 153.20 ± 80.56). In P. fluviatilis, just one sample showed 3 cells with nuclear aberrations, with a mean value of 0.15 ± 0.67.
To better visualize differences among species and between markers, ranges, median values, and interquartile ranges were reported also in the box plot in
Figure 2.
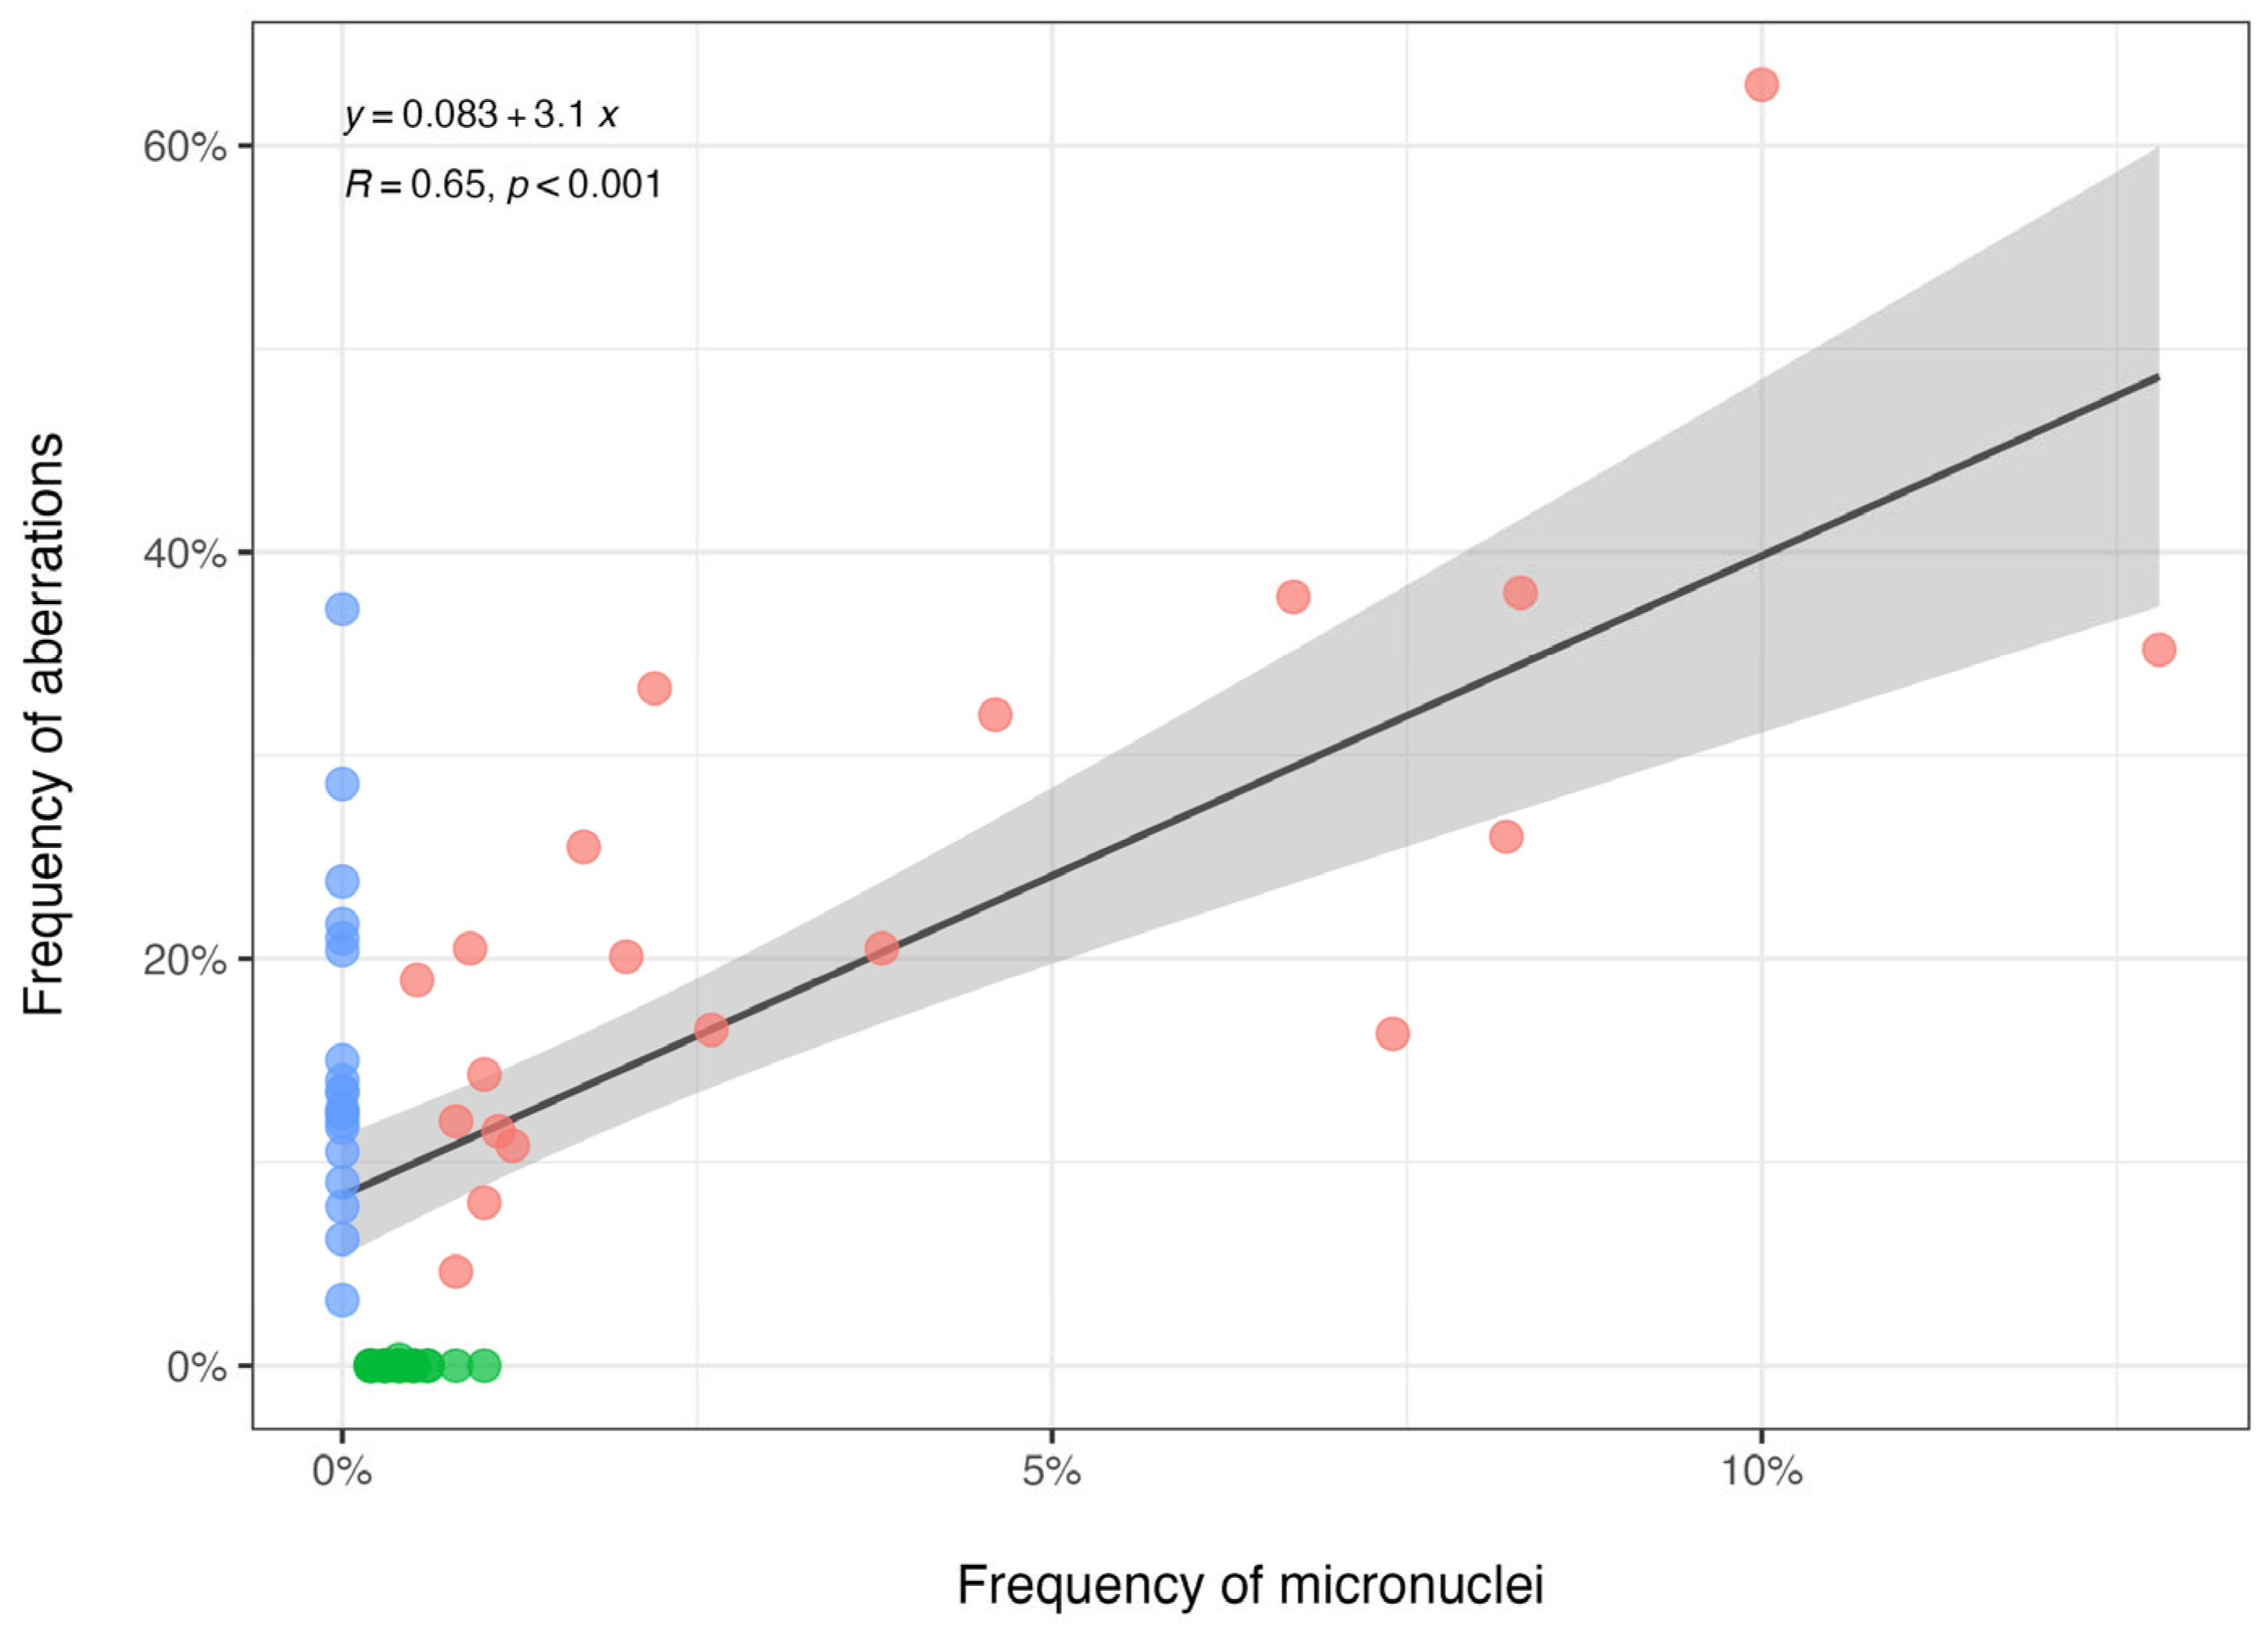
The relationship between the frequency of micronuclei (
x-axis) and the frequency of aberrations (
y-axis) across the three taxa is shown in
Figure 3. The scatterplots show different distributions of aberration frequencies for the three taxa:
Esox spp. (pink circles) exhibited a wide range of aberration frequencies (both micronuclei and nuclear aberrations), and the rudd (blue circles) clustered at a micronuclei frequency equal to zero but showed variability in the NA frequencies. The perch (green circles) remained close to zero for nuclear aberration frequencies, showing a slight variation in micronuclei frequencies. Overall, the regression equation suggests a strong and significant association (R = 0.65,
p < 0.001) between micronuclei presence and chromosomal aberrations, especially driven by the results of
Esox spp.
Skewness values suggested how the distribution of each species data deviated from symmetry. Esox spp. (1.08) and P. fluviatilis (1.32) exhibited moderate positive skewness for the micronuclei number, while S. erythrophthalmus showed no data (NaN). The nuclear aberrations had a highly skewed distribution for P. fluviatilis (4.47) and Esox spp. (1.28), while S. erythrophthalmus (1.17) showed moderate positive skewness. The analysis of the kurtosis underlined that Esox spp. (0.08) and P. fluviatilis (2.01) showed normal or slightly leptokurtic distributions for micronuclei number, while S. erythrophthalmus showed no data (NaN). Furthermore, the nuclear aberrations number for P. fluviatilis (20.00) was highly leptokurtic, indicating a distribution with heavier tails than a normal distribution, while S. erythrophthalmus (1.66) and Esox spp. (2.37) were closer to normal. The normality of data distributions for each species was checked with the Shapiro-Wilk test, which showed the distributions of the micronuclei number for Esox spp. and P. fluviatilis were significantly non-normal (p-values of 0.002 and 0.01, respectively). This test also showed that the distribution of nuclear aberration counts was strongly not normally distributed (p = 0.001) in P. fluviatilis, whereas S. erythrophthalmus nuclear aberration distribution was close to normality (p = 0.06).
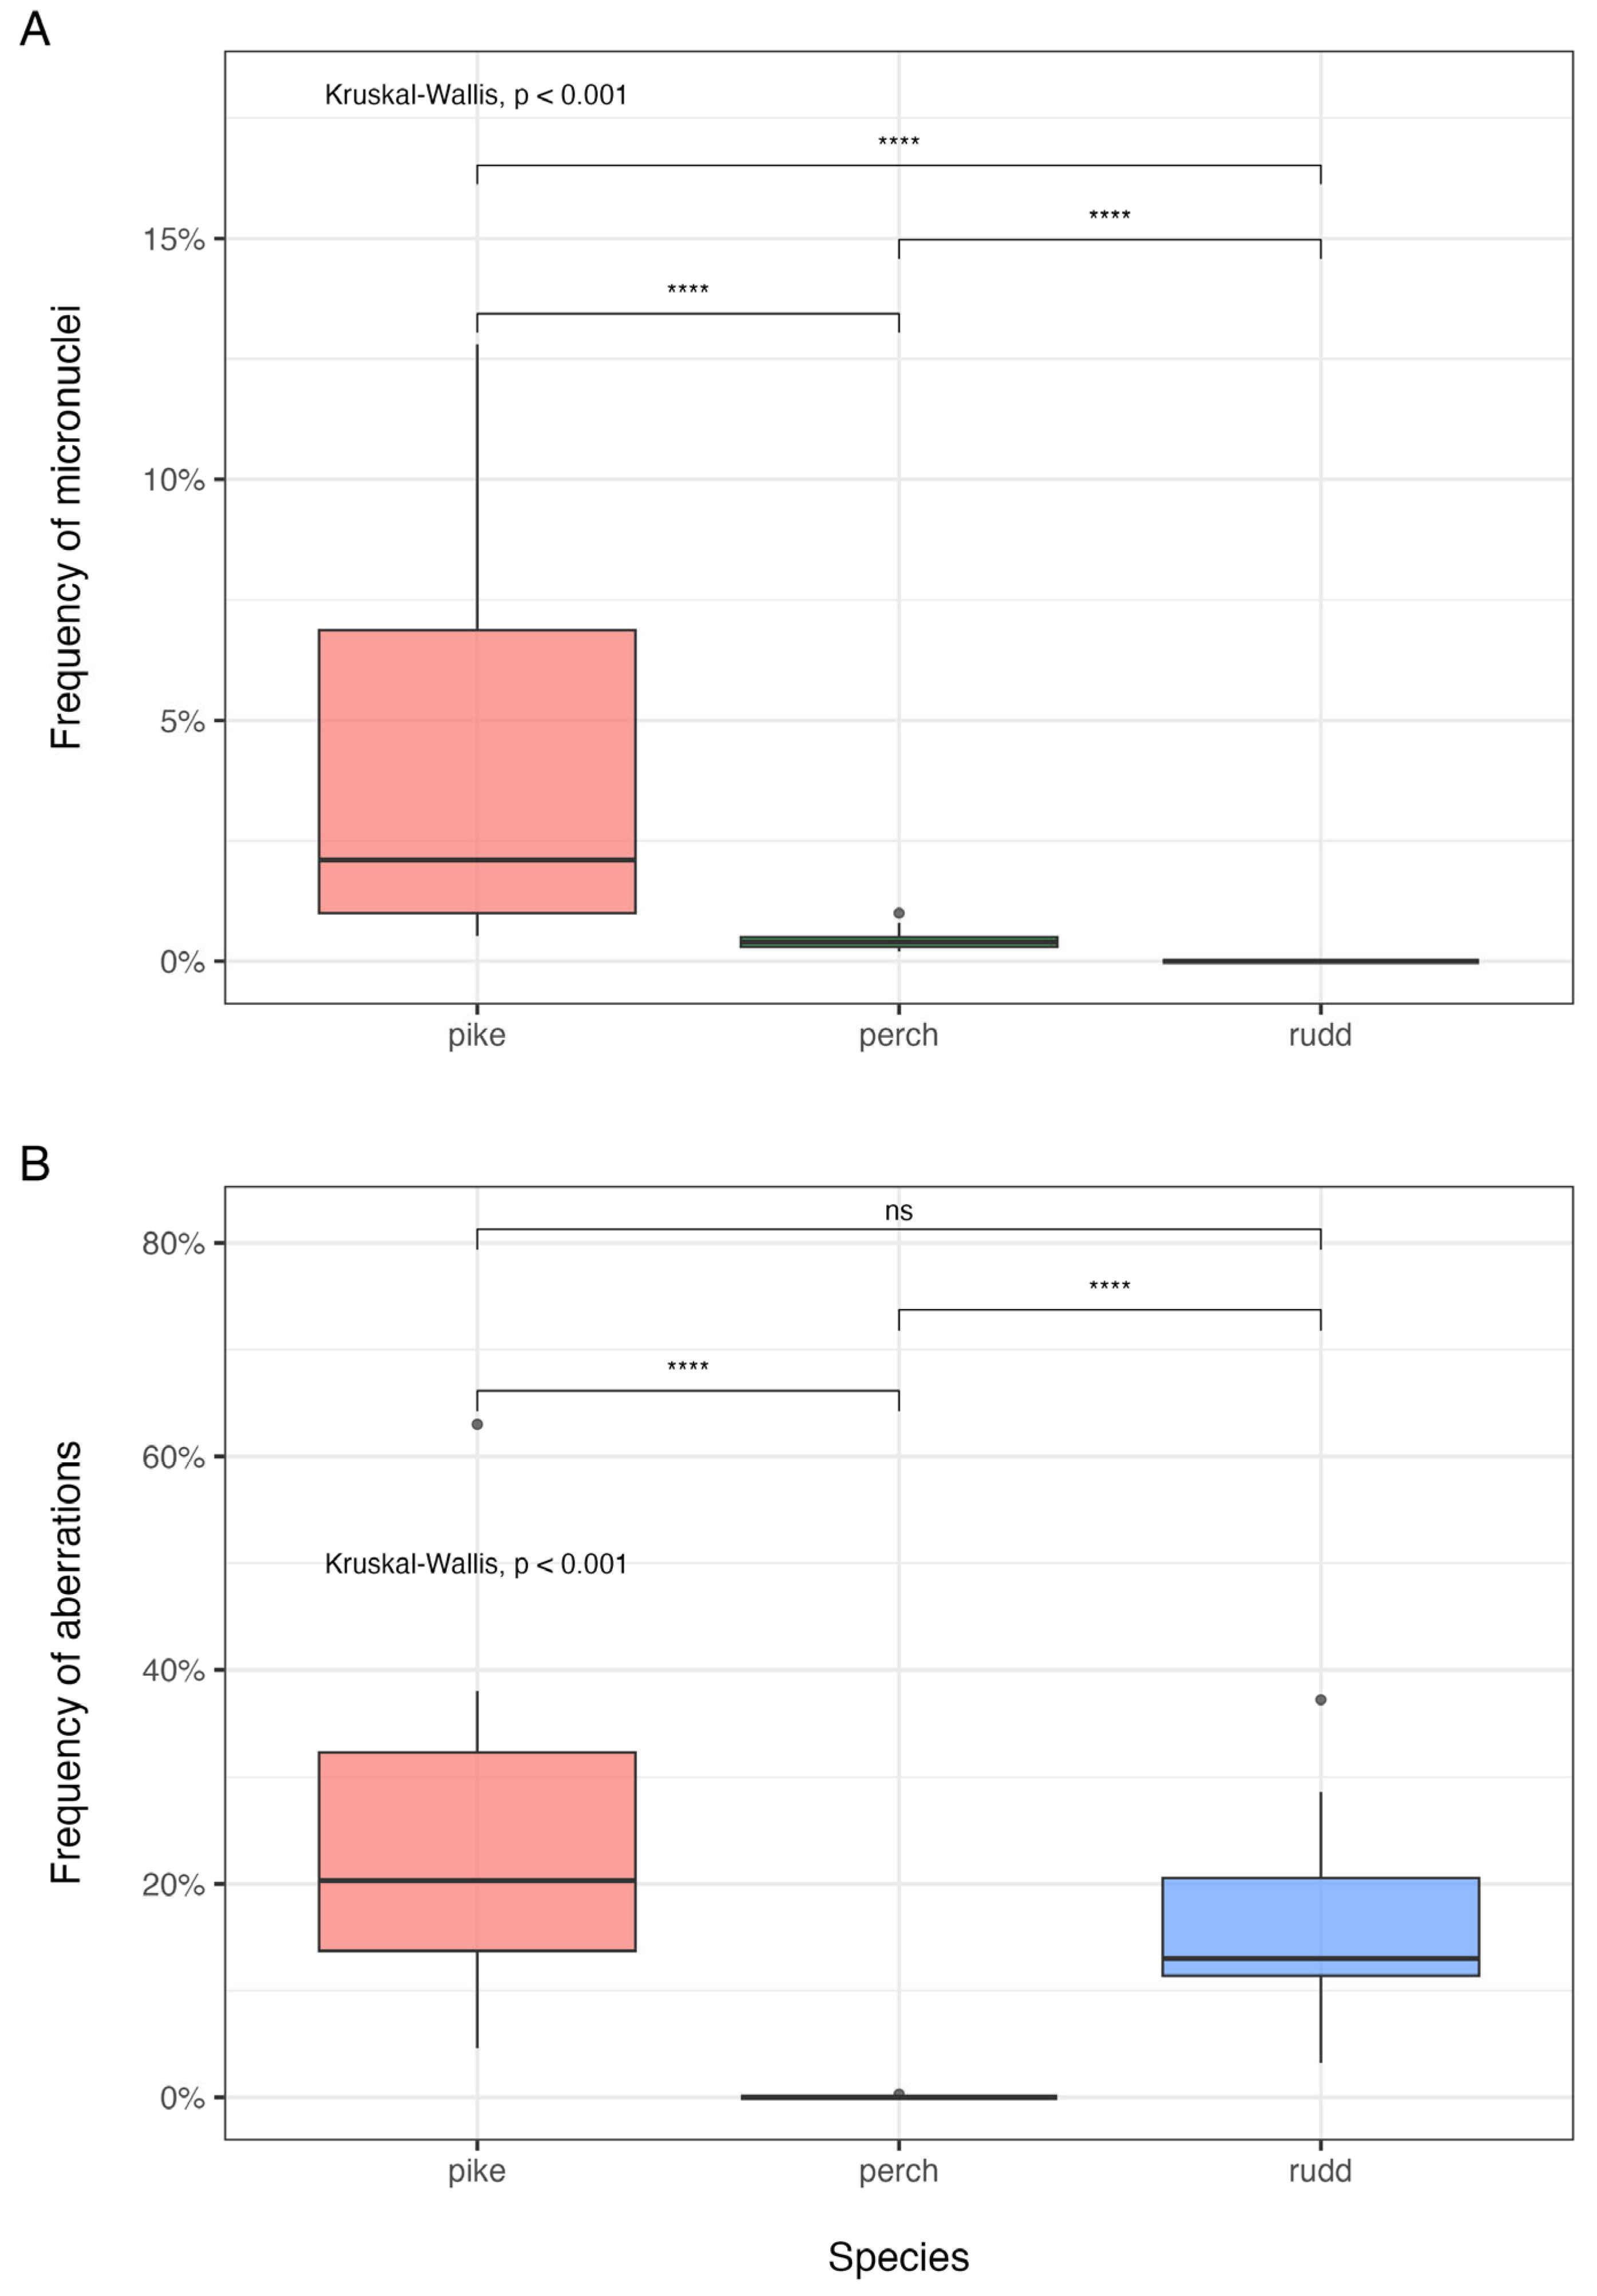
The boxplots (
Figure 2A,B) visualized the frequency of micronuclei (
Figure 2A) and nuclear aberrations (
Figure 2B) across the three species. The analysis reported in
Figure 2A underlined the presence of species-specific differences confirmed by the Kruskal–Wallis test (
p <0.001). There were highly significant pairwise differences between each couple of species, suggesting that each species differs meaningfully from the others.
Esox spp. (pink area) showed the highest variation, with a higher median and a wide interquartile range (IQR), indicating considerable variability in micronuclei frequency and suggesting a possible greater susceptibility to genomic instability or environmental stressors of this taxon. The European perch (green area) had a lower median and a very narrow IQR, suggesting lower micronuclei frequency with minimal variation. The rudd (light blue area) exhibited almost no micronuclei frequency, implying that micronuclei formation is rare or absent in this species. The low micronuclei frequency in the European perch and near-zero values in the rudd suggested species-specific differences in canalization mechanisms and efficiency.
Figure 2B displayed the frequency of aberrations across the three analyzed species. The results of the Kruskal–Wallis test (
p <0.001) were shown, indicating a highly significant difference among them; highly significant differences were highlighted between pikes (pink area) and European perches (green area), and rudds (light blue area) and European perches. Between pikes and rudds, the difference in aberration frequency was not statistically significant. The analysis of species-specific differences showed that pikes (pink) and European perches (blue) have similar distributions, with medians around 20% aberration frequency, even though pikes showed slightly higher variability. European perches have an extremely low frequency of aberrations, with values clustered near zero. The low aberration frequency in European perch suggests a higher canalization for this marker with respect to the other taxa.
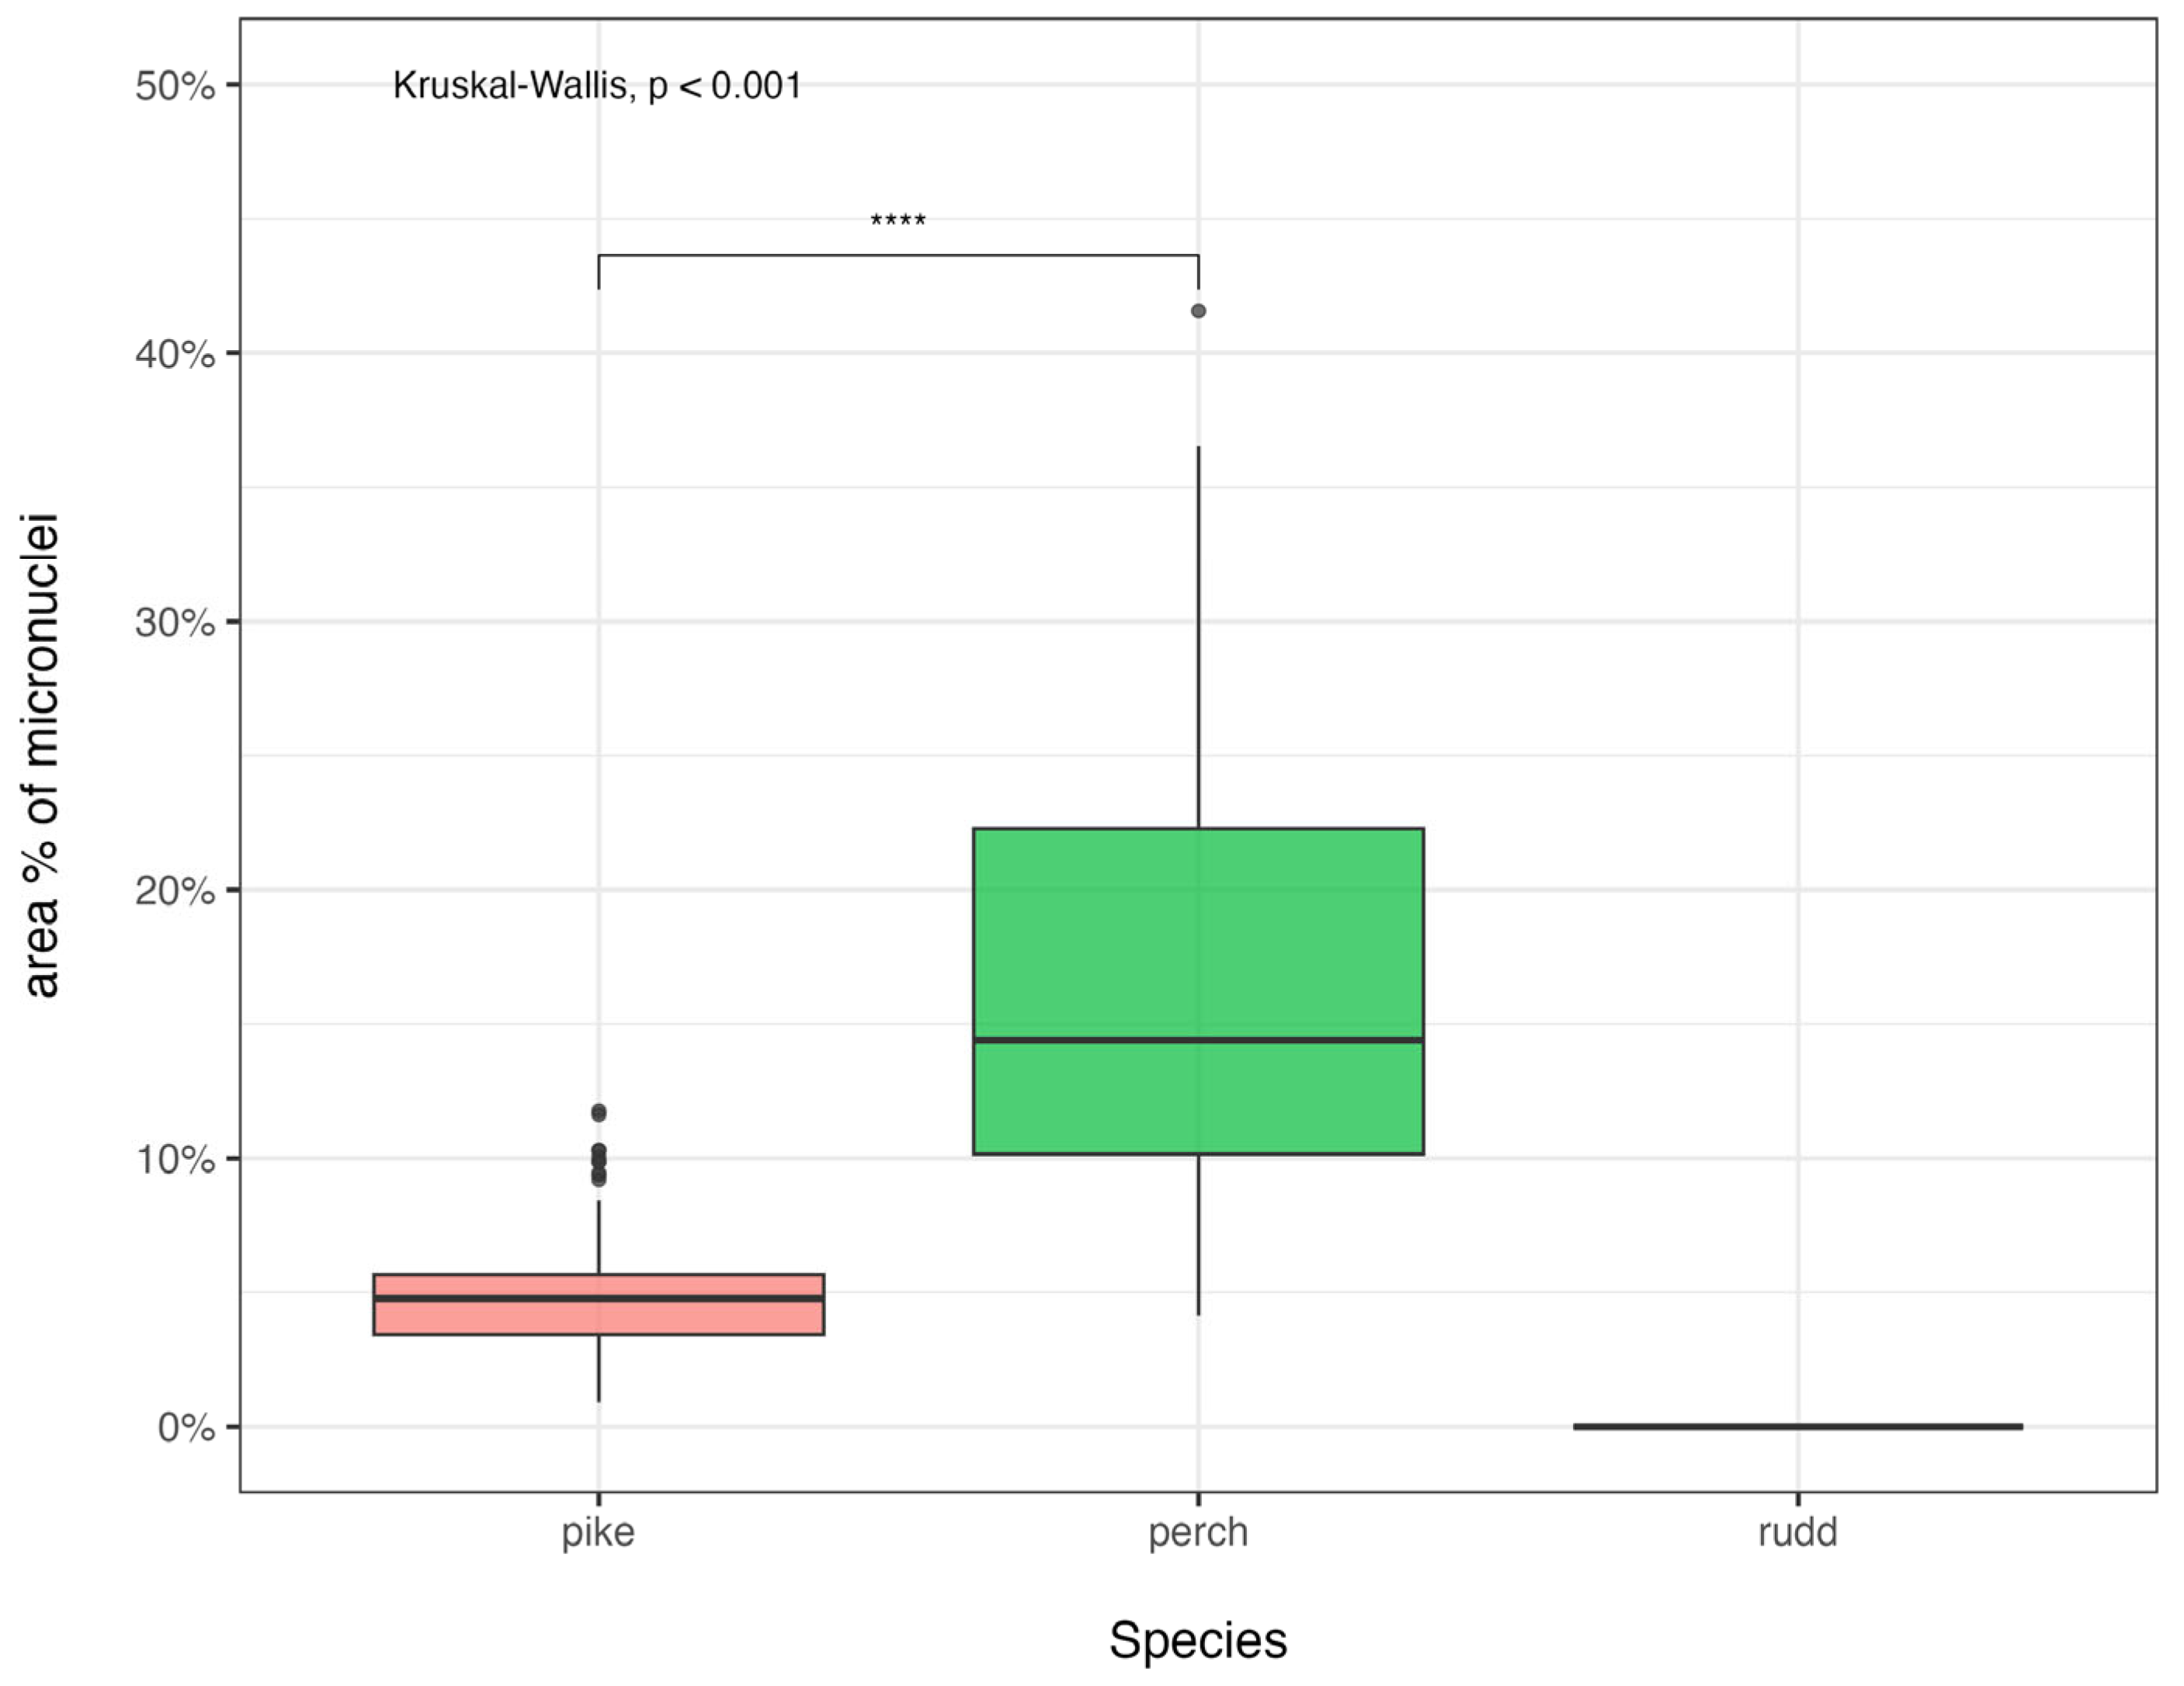
The boxplot in
Figure 4 illustrates the distribution of micronuclei area percentages (with respect to nuclei) across the three taxa. The Kruskal–Wallis test (
p < 0.001) confirms a statistically significant difference between the groups, suggesting that species-specific factors may influence micronuclei formation.
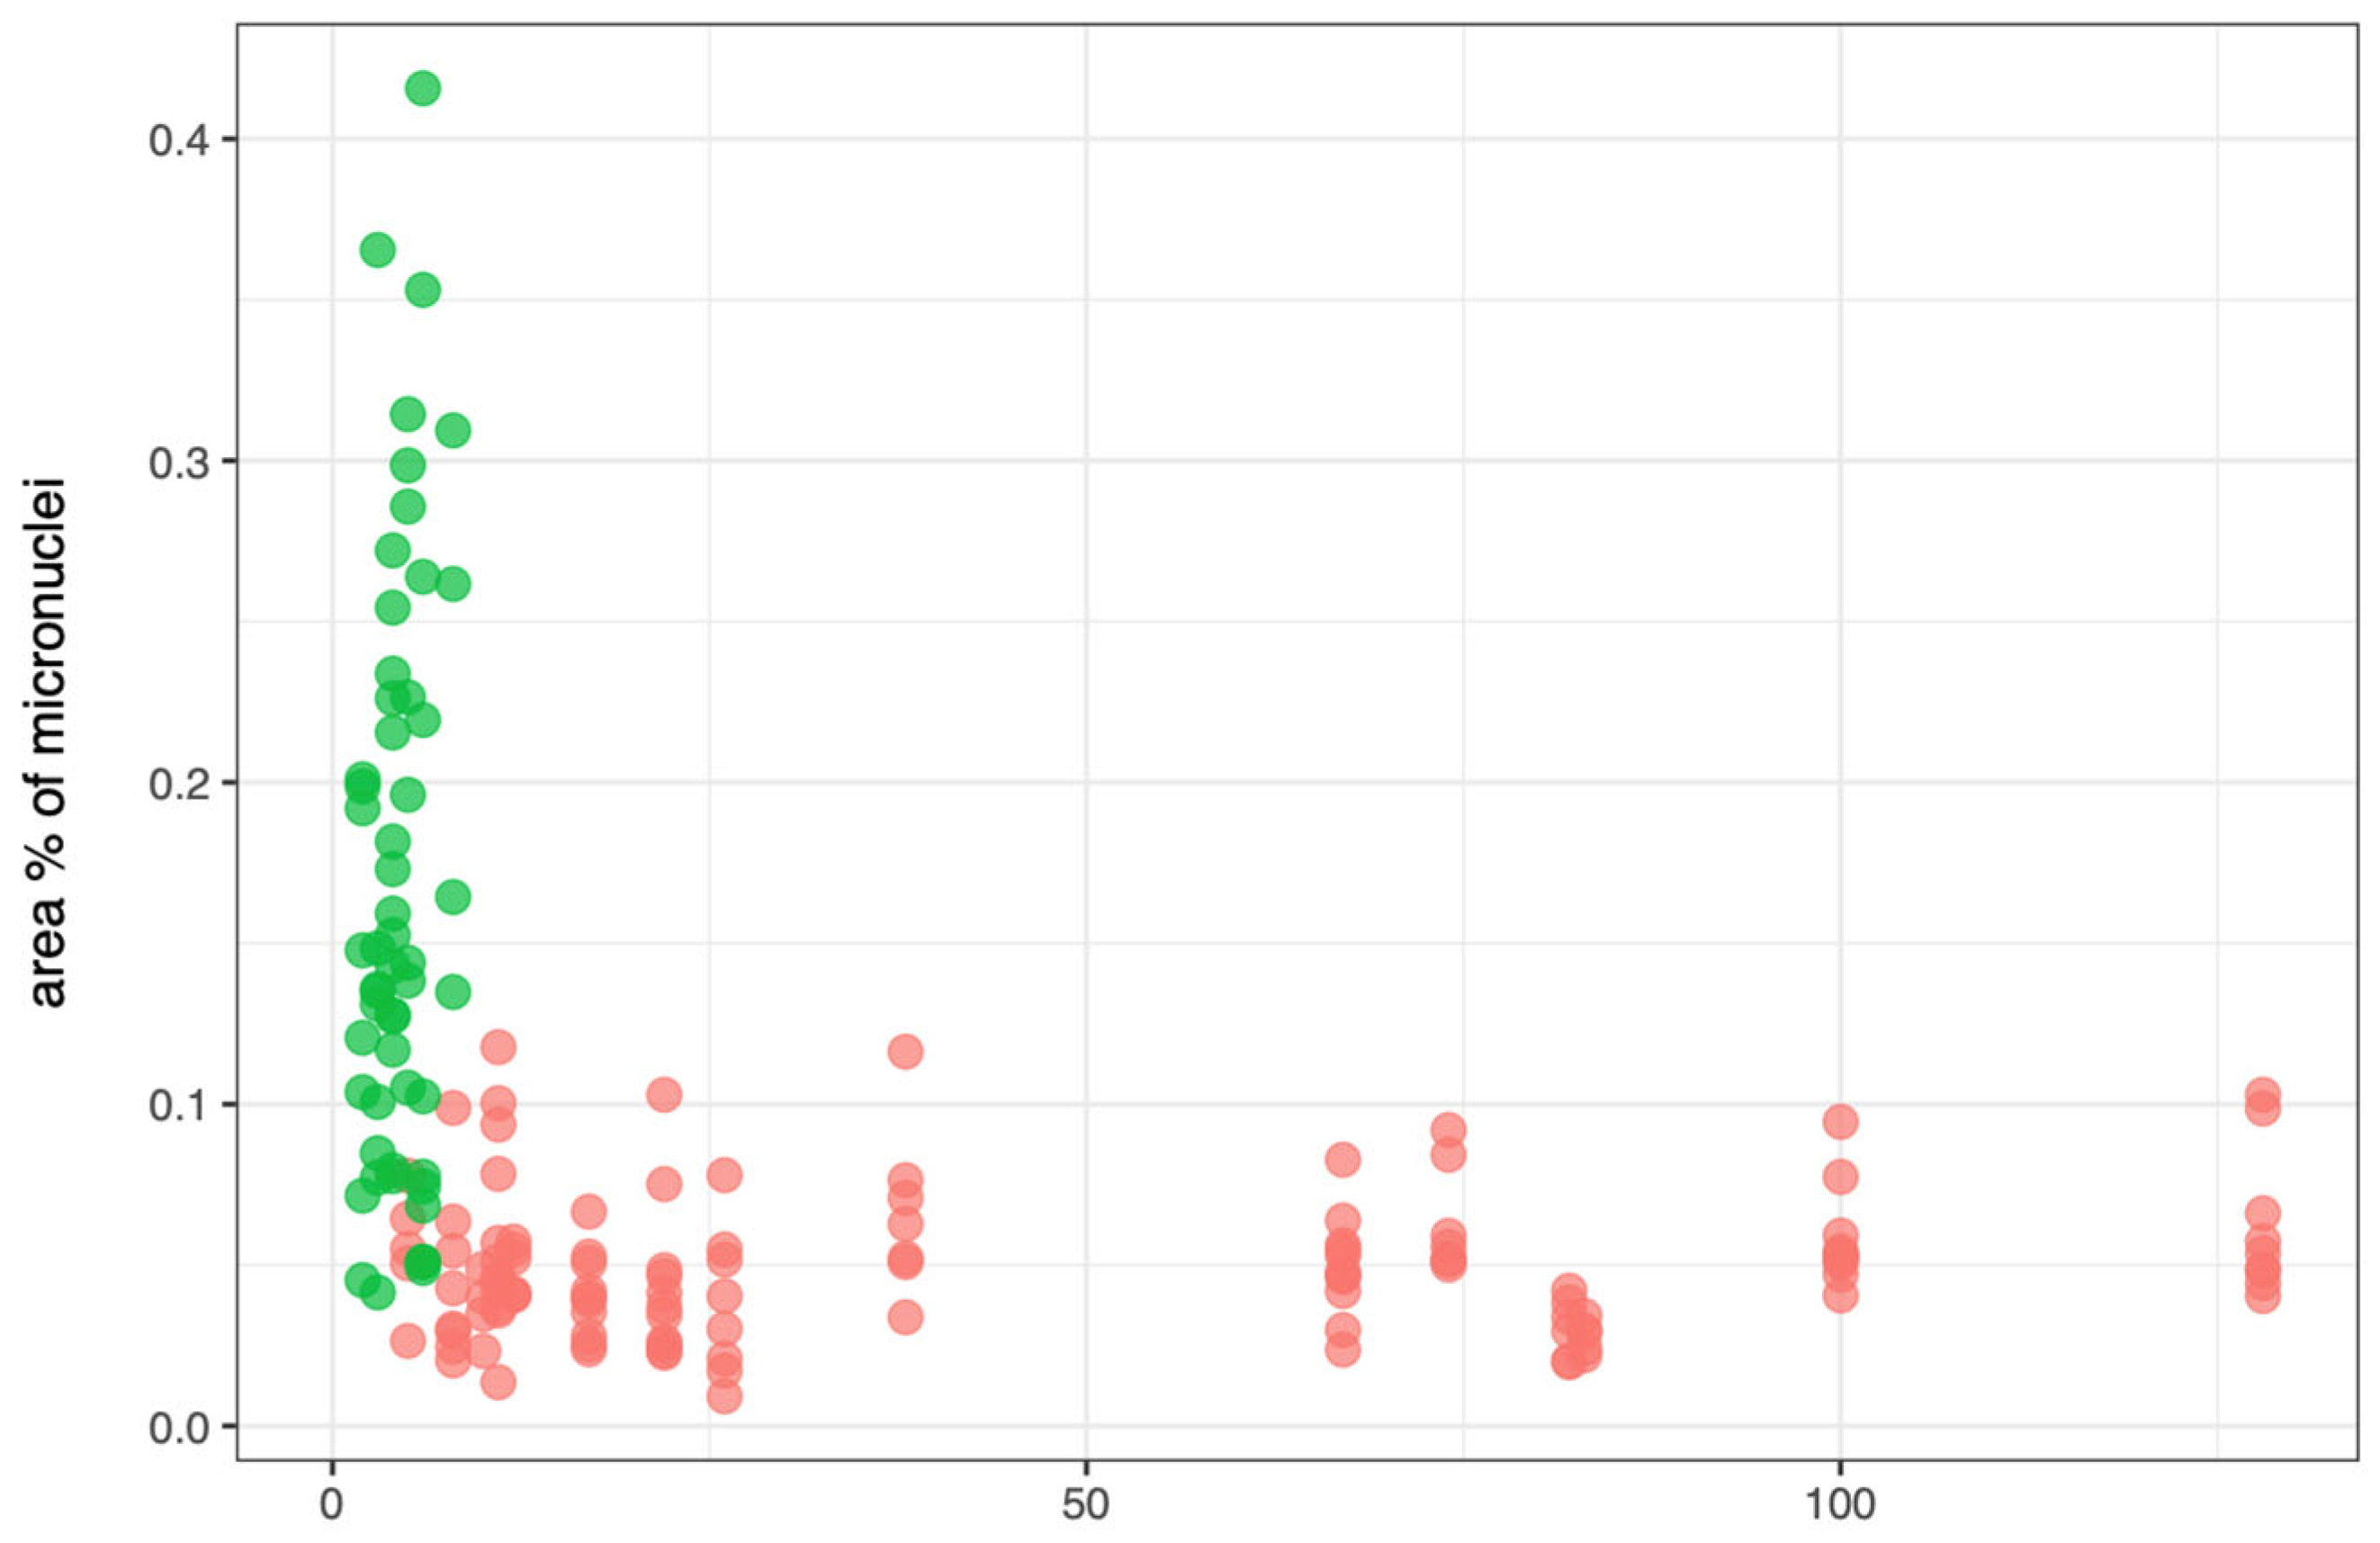
Figure 5 shows the scatterplot of the relationship between the number of micronuclei (
x-axis) and area of micronuclei (percentage respect to nuclei) (
y-axis) across three taxa:
Esox spp. (pink),
P. fluviatilis (green), and
S. erythrophthalmus (blue, absent in this dataset due to the recorded micronuclei equal to zero for this species)
4. Discussion
The data collected in this study highlighted significant differences in cytogenetic homeostasis in the two markers analyzed across the three species of fish from Lake Piediluco. Given the fact that cytogenetic homeostasis underlies the capability of an organism to maintain karyotype and can be assessed through micronuclei counts [
30,
31] and that micronuclei and nuclear aberrations are considered reliable markers of environmental stress in fish [
1].
It can be speculated that pikes, having the highest percentage of both micronuclei and nuclear aberrations, have a lower cytogenetic homeostasis and are less capable of coping with environmental stressors if compared to the European perch and the rudd.
The hydraulic regime of the lake is regulated by human activity to serve a hydroelectric plant, constantly miscelating the water throughout the lake with inflow and outflow that occur on a daily timescale [
32], evenly distributing possible contaminants and genotoxic substances. Therefore, the difference in the presence of micronuclei and nuclear aberrations observed in the investigated species could stem from species-specific differences that make pikes more prone to developing nuclear aberrations compared to other species. The karyotype, along with chromosome morphology and size, might be one of the predictors for the presence and the possibility of a particular species to produce micronuclei and nuclear aberrations [
3]. A comparative study on five species of pikes and two of their hybrids [
33] demonstrated the presence of 50 acrocentric chromosomes in all the species and their hybrids that were similar in size and did not allow morphologically discriminating the five pike species (
E. lucius among them). Conversely, an analogous study carried out on eight species of perches,
P. fluviatilis included [
34], found that all the species shared 48 chromosomes of different morphology. In particular, this study pointed out that the
P. fluviatilis karyotype consisted of 2 metacentric chromosomes, 28 submetacentric chromosomes, 10 telocentric chromosomes, and only 8 acrocentric chromosomes. The karyotype of the rudd is also known, and it is made of 50 chromosomes: 16 metacentric chromosomes, 28 submetacentric-subtelocentric chromosomes, and only 6 acrocentric chromosomes [
35]. Given the fact that the overall number of chromosomes is comparable across the three investigated species, the reason behind the striking difference in the number of nuclear aberrations might be found in the morphology and size of the chromosome. According to experimental inductions of micronuclei formation [
36], micronuclei that are formed by acentric chromosome fragments tend to be much smaller and sometimes difficult to see in light microscopy [
1] than those that arise from the separation of whole lagging chromosomes that detach from the others when the mitotic apparatus is, for whatever reason, impaired. It is therefore possible that the small size of the pike chromosomes promotes the formation of micronuclei caused by the detachment of whole lagging chromosomes compared to the European perch and rudd that have predominantly bigger chromosomes.
The positive correlations between frequencies of the two markers suggested that, for the here reported data, as the frequency of micronuclei increases, the frequency of nuclear aberrations also increases. Data reported highlighted the variations in the species data distributions, underlining the differences in central tendency, dispersion, and distribution shape across the two marker categories. The significant differences observed between species highlight the importance of species-specific factors in micronuclei formation. Furthermore, it is to be noted that a test is meaningless without a baseline comparison. In this study, no comparison is made between sampling sites or different time points, as is typically done in micronucleus studies. Instead, the focus is on comparing the responses of different fish species under the same environmental conditions. The project idea is to determine which of these species is best suited for potential future in situ monitoring applications when choosing both the species and the markers to be investigated. Further studies should both investigate more fish species inhabiting the lake to assess the presence of nuclear aberration and also widen the sampling over a longer time frame to take into account also the possible effect of seasonality on the formation of nuclear aberrations. It is to be noted also that while being a reliable, relatively easy-to-perform, and cost-effective method, ecotoxicological studies should be implementing more than one marker of exposure. For instance, based on the results of our study, the rudd should not be considered a suitable species for assessments using either the micronucleus test or nuclear aberration evaluation. However, it is worth noting that Prychepa et al. [
37] evaluated some biochemical parameters that suggest the rudd is a suitable species for monitoring freshwater habitats.


 ,
, 


