Article

Nutrient, Organic Matter and Shading Alter Planktonic Structure and Density of a Tropical Lake

by
Marina Isabela Bessa da Silva
1,
Luciana Pena Mello Brandão
1,
Ludmila Silva Brighenti
2,
Peter A. U. Staehr
3,
Cristiane Freitas de Azevedo Barros
4,
Francisco Antônio Rodrigues Barbosa
1 and
José Fernandes Bezerra-Neto
1,*
1
Limnea, ICB, Universidade Federal de Minas Gerais, Av. Antônio Carlos 6627, Pampulha, Belo Horizonte 31270-901, Minas Gerais, Brazil
2
Universidade do Estado de Minas Gerais, Unidade Divinópolis, Av. Paraná, 3001, Divinópolis 35501–170, Minas Gerais, Brazil
3
Department of Ecoscience, Aarhus University, Frederiksborgvej 399, 4000 Roskilde, Denmark
4
Universidade do Estado de Minas Gerais, Unidade Ibirité, Avenida São Paulo 3996, Vila Rosário, Ibirité 32412-190, Minas Gerais, Brazil
*
Author to whom correspondence should be addressed.
Limnol. Rev. 2025, 25(2), 16; https://doi.org/10.3390/limnolrev25020016
Submission received: 11 March 2025 / Revised: 11 April 2025 / Accepted: 15 April 2025 / Published: 29 April 2025

Abstract

The structure and density of plankton communities greatly influence carbon and nutrient cycling as well as the environmental status of lake ecosystems. This community can respond to a range of environmental drivers, including those influenced by human perturbations on local and regional scales, causing abrupt changes and imbalances. While the implications of climate and land-use changes are evident for a range of tropical lake conditions, their impacts on planktonic population dynamics are less understood. In this study, we aimed to investigate how distinctive levels of nutrients, allochthonous organic matter (OM), and sunlight availability change phytoplankton and zooplankton density and structure in a natural tropical lake. Using an in situ mesocosm facility, we manipulated the addition of nutrients and OM, in addition to sunlight availability and a combination of these treatments. We monitored limnological parameters, plankton count, and identification for 12 days. The mesocosms included eight different combinations in a 2 × 2 × 2 factorial design, each with two replicates. Inorganic nutrient addition reduced phytoplankton species richness, favoring the dominance of opportunistic species such as Chlorella sp. at much higher densities. Organic matter also increased light attenuation and caused the substitution of species and changes in dominance from Pseudanabaena catenata to Aphanocapsa elachista. On the other hand, physical shading had less influence on these communities, presenting densities similar to those found in the control mesocosms. Zooplankton presented a group dominance substitution in all mesocosms from copepod to rotifer species, and copepod growth seemed to be negatively affected by Chlorella sp. density increase. Furthermore, this community was associated with the light attenuation indices and bacterioplankton. These results indicate that tropical planktonic responses to environmental changes can effectively occur in just a few days, and the responses can be quite different depending on the nutritional source added. The punctual nutrient addition was sufficient to provide changes in this community, evidencing the strength of anthropic events associated with strong nutrient input. Understanding tropical plankton dynamics in response to environmental changes, such as those simulated in this work, is important for understanding the effects of climate and anthropogenic changes on tropical lake functioning. This knowledge can strengthen measures for the conservation of freshwater systems by allowing predictions of plankton community changes and the possible consequences for the aquatic food chain and water quality.

1. Introduction

Freshwater plankton are composed of a diversity of organisms that vary in form, size, life cycle, reproduction, and functional roles, and can influence many environmental responses. Phytoplankton, represented by algae and cyanobacteria, assimilate light and carbon through photosynthesis and release oxygen. This essential process for life maintenance on Earth can serve as an indicator of environmental conditions such as ecosystem metabolic rates and water quality [1,2]. In addition to photosynthesis, mixotrophic phytoplankton species can use dissolved organic carbon (DOC) as a carbon source [3]. Lacustrine zooplankton are mainly composed of protozoans, rotifers, and microcrustaceans, reaching species diversity that occupies different trophic levels and taxonomic categories. Its importance is particularly associated with the transfer of matter and energy to higher trophic levels [4]. Owing to their short generation time, planktonic organisms commonly respond quickly to a range of biotic and abiotic environmental changes. For example, the composition and abundance of phytoplankton have a strong influence on the associated grazing zooplankton communities [5], changing the structure of the zooplankton community within a few weeks.
Nutrients, especially phosphorus and nitrogen, are limiting resources that affect phytoplankton growth in tropical lakes [6]. Environmental factors such as precipitation, sunlight, and drainage basins naturally control the availability of nutrients in freshwater ecosystems [7]. Internal factors, such as turbulence and thermal stratification, can also act on this control in addition to the organism’s decomposition rates [8] and the concentration and quality of dissolved organic matter (DOM). DOM can be formed by phosphate and nitrogen compounds [9] and nutrients become available through the photodegradation and decomposition [10,11]. Despite its nutritional availability, DOM can also impact phytoplankton growth and metabolism rates because of the reduction in the euphotic zone and the mixing layer depth due to the ability of chromophoric molecules of DOM to absorb solar radiation. Ref. [12] observed that in a northern temperate lake, the positive effect on phytoplankton growth caused by a nutritional increase by DOM was greater than the negative effects caused by shading, but these effects vary according to the concentration and quality of DOM in addition to community conditions.
The particularities of watershed organic materials and their provision to water bodies greatly influence plankton communities. In addition to the increase in nutrient availability to the lake, allochthonous DOM strongly influences the plankton food web through the microbial loop [13,14]. In addition, DOM can function as a facilitator of primary production due to protection from ultraviolet B solar radiation [15,16], or as an inhibitor by absorbing light and reducing water transparency [17]. In contrast, autochthonous DOM from mostly algal sources is much less chromophoric and is easily degraded and reutilized by organisms in water columns [18].
Light is essential for photosynthetic organisms, as it transforms solar energy into chemical energy, which is the main source of energy for consumers in the food chain. In water, light availability is affected by the presence of particles that absorb or scatter sunlight [19], as seasonality does not affect sunlight presence as in temperate environments. However, lakes with greater amounts of suspended particles have greater light attenuation and therefore present a darker water column. These lakes also present a smaller euphotic zone, where photosynthetic organisms, such as algae and cyanobacteria, are located. However, if exposed to high intensities of light, these organisms can suffer from photoinhibition, causing an increase in ecosystem respiration and a decrease in productivity [14].
The increase in human population and associated resource needs have also increased the release and input of both inorganic and organically bound nutrients, such as sewage discharge into water bodies and fertilizers used in crops contained in the basin, causing eutrophication in many aquatic ecosystems and compromising water quality [20]. Nutrient enrichment can lead to phytoplankton and macrophyte blooms, and ecosystem responses can be atypical and even unknown, such as toxin production, metabolism changes, and water column shading [21]. Land use changes in the surrounding lakes (e.g., urbanization, monocultures, and pastures) can change the quantity and quality of DOM and nutrients from the drainage basin to the aquatic environment, and responses to these impacts are still less known, especially in tropical environments, where fewer studies are performed and great differences from temperate environments are observed. With recent changes in climate, rainfall in several regions of the world has been drastically modified, altering the seasonal balance in allochthonous input even more [22].
The lake system of the Middle Rio Doce is a complex formed by approximately 300 natural lakes in the Atlantic Forest, of which 40 water bodies are located inside the State Park of Rio Doce (PERD) [23]. Despite being legally protected, there are different impacts on and outside the park borders, such as pesticide use, sewage dumps, and management of eucalyptus forests [24], for example. Recent studies performed in some of these lakes have shown the importance of the input of allochthonous material from the native forest during summer (with rains) to the water optical properties, water transparency, and ecosystem metabolism [25,26]. Primary production in PERD lakes is more expressive during the dry season (mixing period); when solar radiation is lower, the water is less transparent, and the lake circulation causes DOM and nutrient resuspension, which has been stored in the hypolimnion since the rainy season [27,28]. The ecological balance observed in these lakes is strongly affected by basin nutritional input during the rainy season and the later distribution of nutrients and organic matter in the water column during the mixing of water in the dry season. Previous studies have shown the possible frequency and intensity of rain events under different climate change scenarios in this area [29]. However, the temperature increase observed during the dry season affects the already threatened Atlantic Forest [30]. Tropical lakes are biodiversity hotspots and little is known about the effects of climate change on these systems.
To investigate how phytoplankton and zooplankton communities in tropical lakes change due to the most common anthropogenic impacts (e.g., modifications in nutrient availability and organic matter), we developed a mesocosm experiment in Carioca Lake, located inside the PERD, where we could then manipulate nutrient and allochthonous organic matter (OM) levels and light conditions. We expected that nutrient addition would increase algal growth in opportunistic species, similar to eutrophicated environments [31,32], while zooplankton filter species would dominate due to phytoplankton increase in bottom-up control. In comparison, we hypothesized that OM addition would facilitate an increase in mixotrophic phytoplankton, in addition to favoring bacteriophage zooplankton. OM addition also increased solar radiation attenuation, supporting the growth of low light-resistant species, as it would occur in shaded mesocosms. We investigated how planktonic communities responded to these three combined effects (nutrients, OM, and light).

2. Methods

2.1. Study Site

This study was conducted in Carioca Lake (19°45′26.0″ S, 42°37′06.2″ W), a natural lake in the Middle Rio Doce lacustrine system (Minas Gerais, Brazil), located in the southern part of the State Park of Rio Doce (PERD), which is the largest remnant of the Atlantic Forest in Minas Gerais covering 36,000 ha (Figure S1). The lake is mesotrophic (total phosphorus: 0.18–0.69 μM, epilimnion annual mean: 0.44 μM; chlorophyll-a: 1.3–16.6 μg L−1, epilimnion annual mean: 7.7 μg L−1, see [23,28]. It is a warm-monomictic lake, with a mixing period during the dry season (May to August) and thermal stratification during the rest of the year (rainy season, September to April, Figure S2, from [33]). This lake covers 14.4 ha, with a perimeter of 1718.6 m and 11.8 m of maximum depth, and a mean depth of 4.8 m [34]. Lake monitoring has been conducted for more than 20 years, including water quality parameters and aquatic biota, as part of the Brazilian LTER Program (PELD-CNPq) [35]. Among the phytoplankton, cyanobacteria formed the most abundant group observed in this lake during the last 12 years of monthly monitoring, representing 59% of the phytoplankton species counts sampled. Within the zooplankton community, copepods represented 73% of the observations (Figure S2, from [33]).

2.2. Experimental Design and Sampling

To test the effect of nutrient and organic matter input and sunlight availability on planktonic communities, we conducted an in situ experiment using cylindrical mesocosms of 1.3 m diameter, depth of 1.5 m, and 2 m3 volume. Sampling was performed between 20 January and 1 February 2015, using daily measurements. Water samples (3 L at 0.5 m depth) for nutrient and dissolved organic matter analysis and community samples were obtained every 3 days. The mesocosms included eight different combinations in a 2 × 2 × 2 factorial design, each with two replicates. Three factors were manipulated: (1) with and without nutrient (NUT) addition (NaNO3 K2HPO4, and NH4Cl), (2) with and without addition of organic matter (OM) extracted from leaves surrounding the lake, and (3) with and without 50% of shading (SH) from solar radiation (Figure 1, from [36]). Treatments with the addition of nutrients are represented by the initials NUT, those with organic matter by OM, and those that were shaded by SH. The combinations of these treatments were nominated with junctions of these initials.
The mesocosms were lightly stirred every day to avoid stratification, and the temperature was measured daily using Hydrolab DS5 (Hach Environmental, Loveland, CO, USA). Vertical profiles of photosynthetically active radiation (PAR) and ultraviolet (UV) radiation (340 nm) were obtained using a BIC radiometer (Biospherical Instruments, San Diego, CA, USA). The diffusive attenuation coefficients (KdPAR and KdUV) were calculated as the linear slope between the depth and the natural logarithm of the downwelling radiation. Water samples were filtered immediately after collection to determine chlorophyll-a (Chl-a), nutrients (0.47 μm filter), suspension solids (TSM; Filter AP040), and DOC (Millipore 0.22 μm). The Chl a concentration corrected by pheophytin (μg L−1) was obtained by acetone extraction (90%), measured in a spectrophotometer (UV-VIS Shimadzu) at 665 and 750 nm, and calculated using the protocol provided in APHA (1998). The TSM (mg L−1) was determined by the gravimetric method, considering the difference between the dry weights of the AP40 Millipore filters (105 °C for 2 h) before and after the filtration of water samples (APHA, 1998). The DOC concentration (mg L−1) was obtained by catalytic oxidation at high temperatures using a TOC analyzer (Shimadzu TOC—5000A, Kyoto, Japan). Unfiltered water samples were taken for total nitrogen (mg L−1), analyzed using a TOC analyzer (Shimadzu TOC—5000A, Kyoto, Japan), and for total phosphorus (μg L−1), according to [37].
Mesocosm data on bacterial density were obtained by [38], using sampling and data from the same mesocosm experiment. The details of the sample processing related to carbon and nutrient counting are available in [36].

2.3. Nutrient Addition

On the first day of experiment, nutrient addition was made in a combination of 6.10 g of NaNO3 to Nitrate (NO3) addition, 0.42 g of NH4Cl to ammonium addition (NH4+), and 1.15 g of K2HPO4 to phosphate (PO43−) addition, on the eight mesocosms designated to receive this treatment. Nitrogen levels were defined through experiments performed in other studies [39,40] and in a pilot performed in July 2014. The PO43− levels were planned to be similar to those found in a eutrophic reservoir in Minas Gerais [41]. The initial concentration of nutrients (TN, TP) on the eight mesocosms with nutrient addition were 0.04 ± 2.68 μM (mean ± standard deviation) for NO3, 3.93 ± 1.16 μM for NH4+, and 1.68 ± 0.43 μM for PO43−.

2.4. Organic Matter Addition

The OM addition was composed of organic matter extracted from leaves and adhered soil particles collected around the lake (four cylinders, 20 L capacity each). The material was stored for one week in buckets with distilled water (60 L) at room temperature (25 °C) to stimulate decomposition. The water was then filtered through a 20 μm mesh and 7.5 L of this water was added to each mesocosm designated on the first day of the experiment. One week was sufficient for labile DOM present in the leaves and debris to degrade before being added to the mesocosms. After the addition of OM, the initial mean concentration on these eight mesocosms was 8.6 ± 0.1 mg L−1 for DOC, and 21.4 ± 0.5 m−1 for aCDOM254 (CDOM absorbance at 254 nm). The mesocosms without OM addition had an initial mean concentration of 8.0 ± 0.4 mg L−1, and 17.1 ± 0.4 m−1 of aCDOM254. As previously mentioned, an initial pilot experiment was performed in July 2014, and we observed that this method was sufficient to change OM quality and light attenuation (measured by the coefficient of the diffusive visible radiation attenuation (KdPAR) on correspondent mesocosms (With OM addition: aCDOM254 22.3 m−1, KdPAR 1.7 m−1; without OM addition: aCDOM254 16.7 m−1, KdPAR 0.99 m−1).

2.5. Shading

The eight shaded mesocosms were covered with a screen that reduced irradiance by ~50%. To test and guarantee that the filter was spectrally neutral, we measured the light attenuation using a BIC radiometer (Biospherical Instruments, San Diego, CA, USA). The light was attenuated to 47% of initial condition, and no differences were observed in ultraviolet radiation (UV) and photosynthetically active radiation (PAR). The screens were quickly opened for sampling and measurement once per day.

2.6. Plankton Sampling and Analysis

Plankton sampling was performed every three days after mesocosm water mixing. For phytoplankton samples, water from a 0.5 m depth was collected in each mesocosm, fixed with Lugol’s iodine solution, and kept sheltered from light until analysis. For zooplankton samples, 30 L of water from each mesocosm was filtered through 68 μm net, fixed with formaldehyde (8%), and colored with rose Bengal.
Phytoplankton counting was performed using the [42] sedimentation method, under an inverted microscope, utilizing chambers of 10 mL. Up to 100 individuals of the most abundant species were counted, ensuring about 20% of error to a confidence interval of 95% [43]. Phytoplankton density was calculated according to [44]. Each zooplankton sample was identified and counted under an optical microscope in Sedgewick–Rafter chambers, with standardized counting to 20% of the total sample.

2.7. Data Analysis

To identify the relative abundance of each planktonic group found in mesocosms, we multiplied by 100 each species density in each treatment, and divided this value by general total density on the same treatment [(specific density × 100)/total community density]. Groups that exhibited the highest abundance in the treatments (Tables S1 and S2) were selected for the statistical tests. An item with the sum of each community studied in this experiment was added to the data to guarantee that the total density was considered in the analysis.
Linear mixed-effects models with restricted maximum likelihood estimation were performed to test for the effects of the different treatments using the “lmerTest” package [45] in the statistical software R version 4.4.3 [46]. The variables added (nutrients, OM, and shading) and their interactions were treated as fixed effects factors, whereas biotic variables (phytoplankton and zooplankton densities) were treated as numeric, and sampling days were treated as random effects (lmer (log(group) ~ organic matter + nutrients + shade + organic matter*nutrients*shade + (1|days)). As the initial conditions were similar in all mesocosms, the first day of the experiment (day 0) was excluded from the analysis, once the sampling on that day was performed before variable addition in the mesocosms, and the same value was considered for all of them. We performed Levene’s test to check the homogeneity of variances and the Shapiro–Wilk test to check for residual normality in each constructed model.
Spearman correlation analysis was performed using the Hmisc package version 4.4-1 [47], using planktonic groups and measured variables (TN, TP, DOC, Chl-a, KdPAR, and bacterial density). A principal component analysis (PCA) was performed with the same variables using the FactoMineR package version 2.11 [48], search for proximity patterns between plankton and the other variables. In this analysis, we disregarded the shading treatment division to simplify the observation, because this treatment did not represent importance in the analysis results. In addition, a species richness calculation was performed using the Vegan package version 2.6-10 [49], to observe the differences in this value between the treatments.

3. Results

3.1. Environmental Variations Among Mesocosms

The mean and standard deviation of the limnological parameters measured for each treatment are shown in Table S3. The mesocosm temperature during the experiment varied between 28.4 and 31.3 °C (average 30.8 °C). The mean pH observed during the experiment was 6.9 ± 0.8. Higher pH occurred in mesocosms with nutrient addition (7.4 ± 0.8), and the lowest pH was measured in the control mesocosms (6.2 ± 0.2).
Mesocosms treated with nutrient addition presented a 1.8 times higher average total nitrogen (TN) concentration than mesocosms without nutrient addition. For total phosphorus (TP), this average was more than four times higher. The DOC average was higher in mesocosms where OM was added, but the average in this group was only 0.6 mg L−1 higher in relation to the mesocosms without OM addition. Although the DOC concentration was slightly higher in the mesocosms with OM addition, the quality of the organic matter changed substantially, as evidenced by the spectral indices of colored dissolved organic matter (CDOM). As described by [36] in the same experiment, the mean values of spectral indexes on OM addition mesocosms was as follows: the highest absorbance at 254 nm (aCDOM254) = 21.9 m−1 and at 440 nm (aCDOM440) = 0.7 m−1; smaller spectral slope values in the range of 275–295 nm (S275–295); and higher specific absorbance of DOC at 254 nm (SUVA254) = 2.5 m2 mg−1 C). These indices indicate a higher concentration and aromaticity of carbon molecules in the mesocosms with added OM.
The diffusive attenuation coefficient of PAR radiation (KdPAR) was highest in mesocosms that only added nutrients (mean 1.4 m−1 ± 0.6 m−1), with a maximum value of 2.7 m−1. The lowest mean values were found in the control (0.9 m−1 ± 0.3 m−1), with a minimum of 0.6 m−1. The diffusive attenuation coefficient of ultraviolet radiation (KdUV) had its highest values in treatments with only OM added (OM, 10.9 m−1), and the lowest values in the only shaded treatment (SH, 3.5 m−1). Daily variations in precipitation, wind speed, and air temperature are presented in Supplementary Materials Table S4.

3.2. Plankton Distribution Between Mesocosms

The means and standard deviations of all organisms from the different classes of phytoplankton found in the treatments are presented in Table S5. Cyanobacteria was the major group in abundance found in mesocosms before the addition of treatments (day 0), with Pseudanabaena catenata Lauterborn as the most abundant species (4216 individuals mL−1), representing 55% of total phytoplankton density at the beginning of the experiment. The sum of all Chlorophyceae species abundance represented only 8.7% of the initial phytoplankton community, and the most abundant species in this group was Chlorella sp. (411 individuals mL−1), accounting for 5.4% of the total.
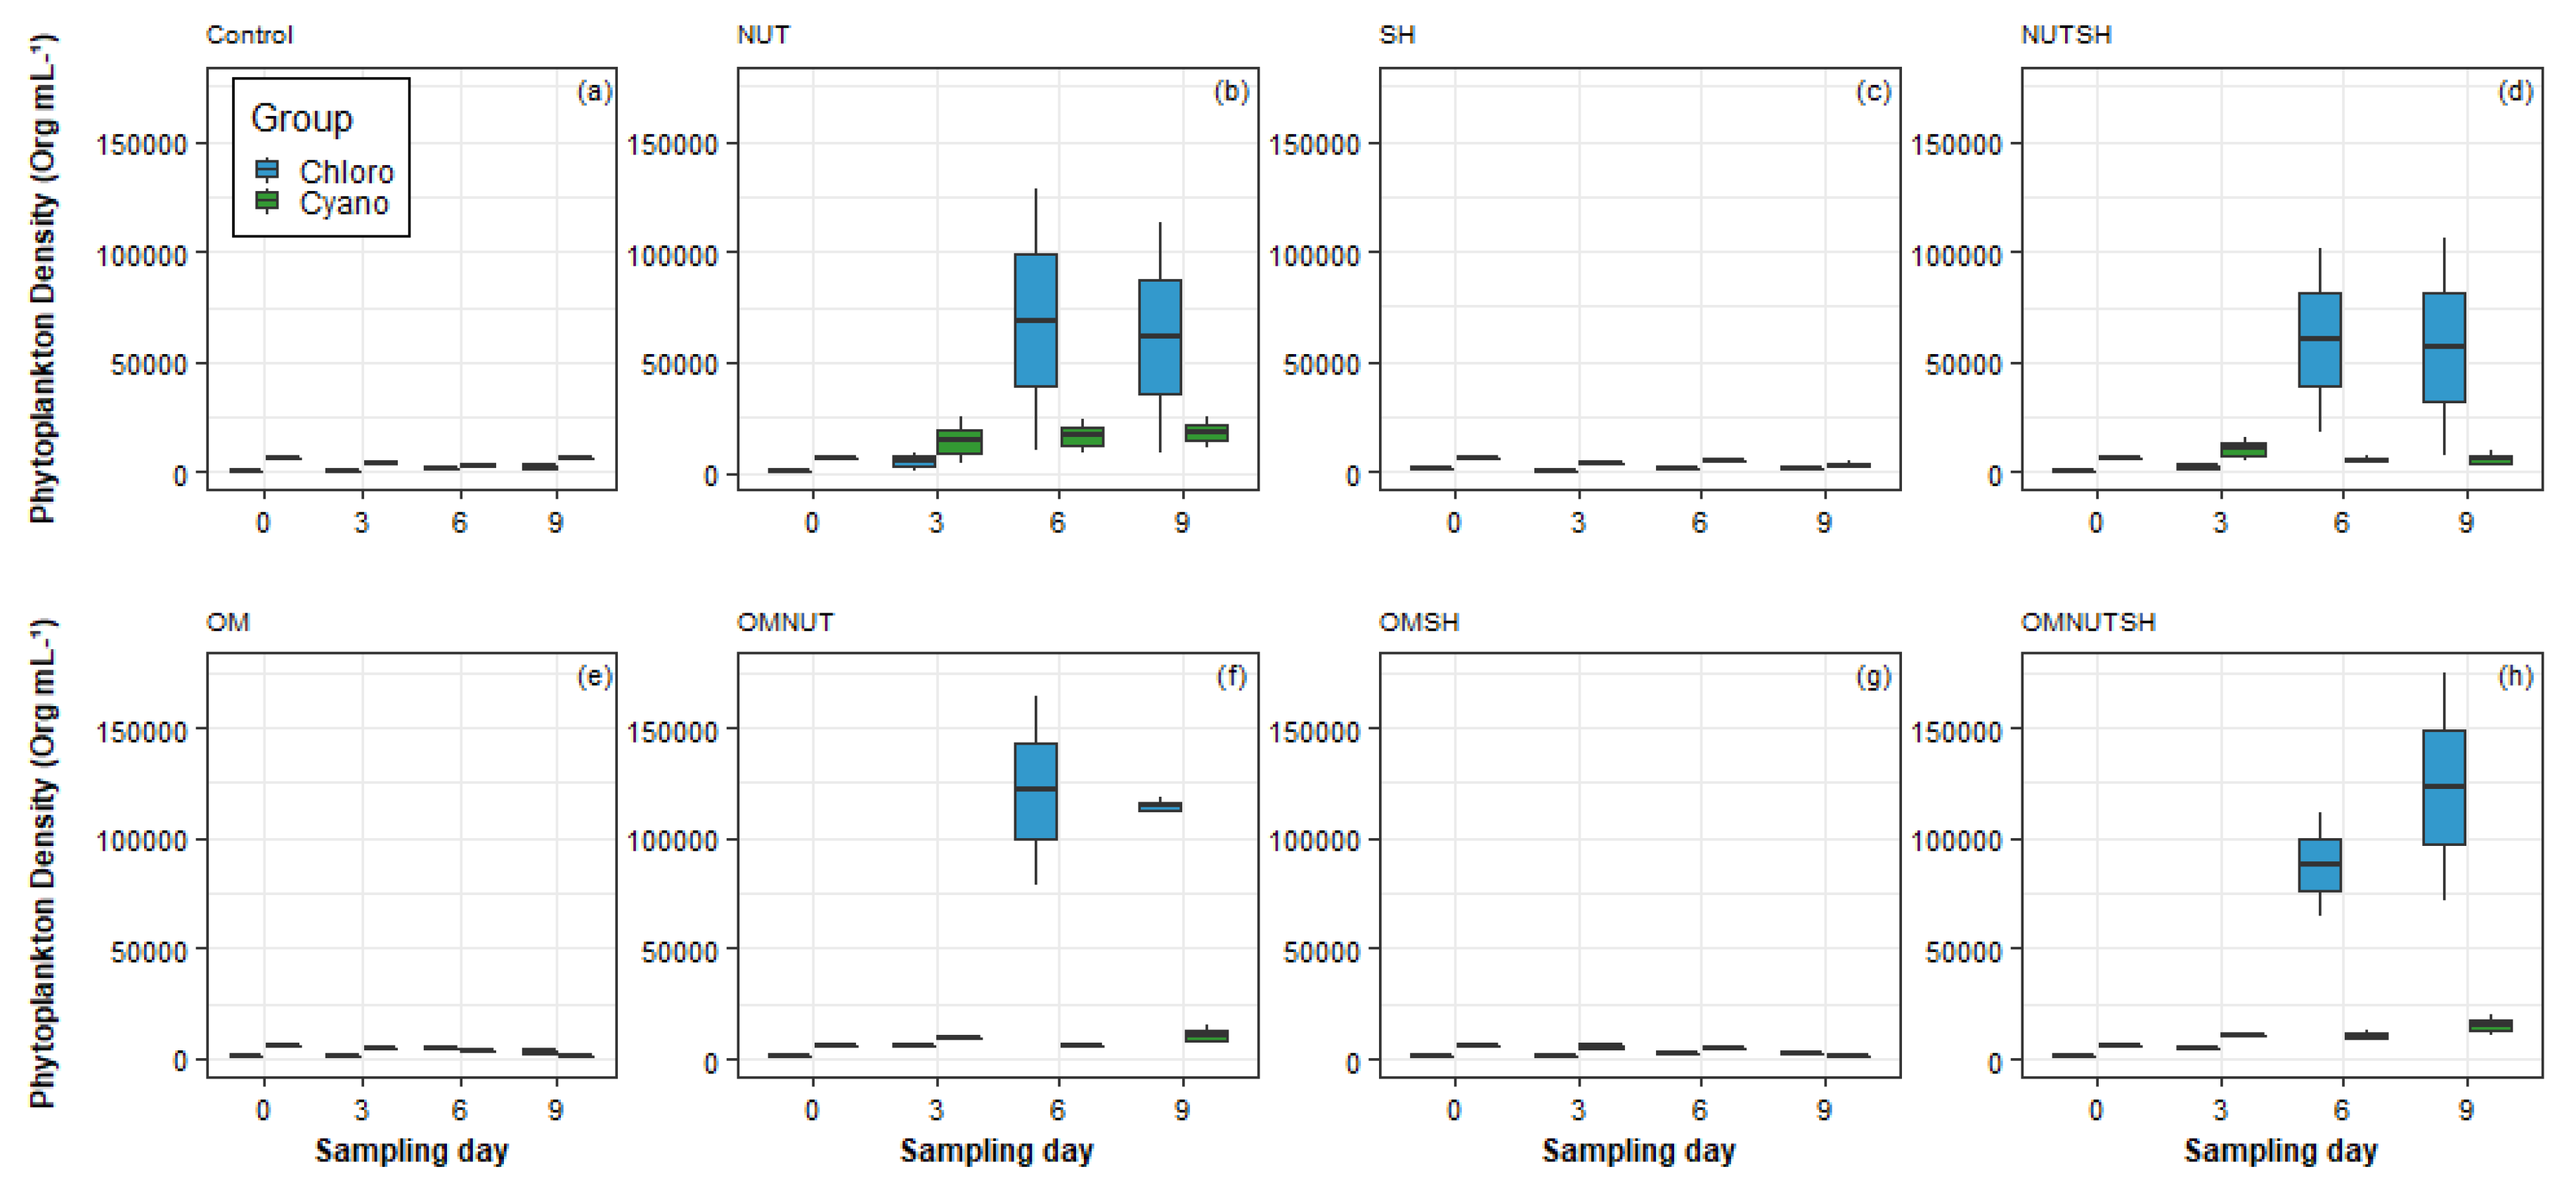
All treatments had an effect on plankton communities, with significant differences from the controls on at least one sampling day (Figure 2 and Figure 3). The highest phytoplankton densities were 8-fold higher in mesocosms with nutrient addition (NUT, NUTSH, OMNUT, OMNUTSH), with a mean of 55,701 ± 57,513 individuals mL−1, whereas treatments without nutrient addition (Control, OM, SH, OMSH) presented a mean of 6804 ± 1832 individuals mL−1. The highest phytoplankton densities were found in mesocosms where all three treatments were combined (OMNUTSH) on the 9th day of the experiment (194,700 individuals mL−1), while the lowest densities were found on the same day in the shaded mesocosms (SH), with a total phytoplanktonic density of 3169 individuals mL−1.
Chlorophyceae was the prevailing class in all mesocosms with nutrient addition, including when these nutrients were combined with OM and shading addition (NUT, OMNUT, NUTSH, and OMNUTSH). This class represented 86.4% of the total density of these mesocosms (Table S1). Chlorella sp. was responsible for the dominance of Chlorophyceae in these mesocosms, presenting densities higher than 100,000 individuals mL−1 on the 6th and 9th experimental days.
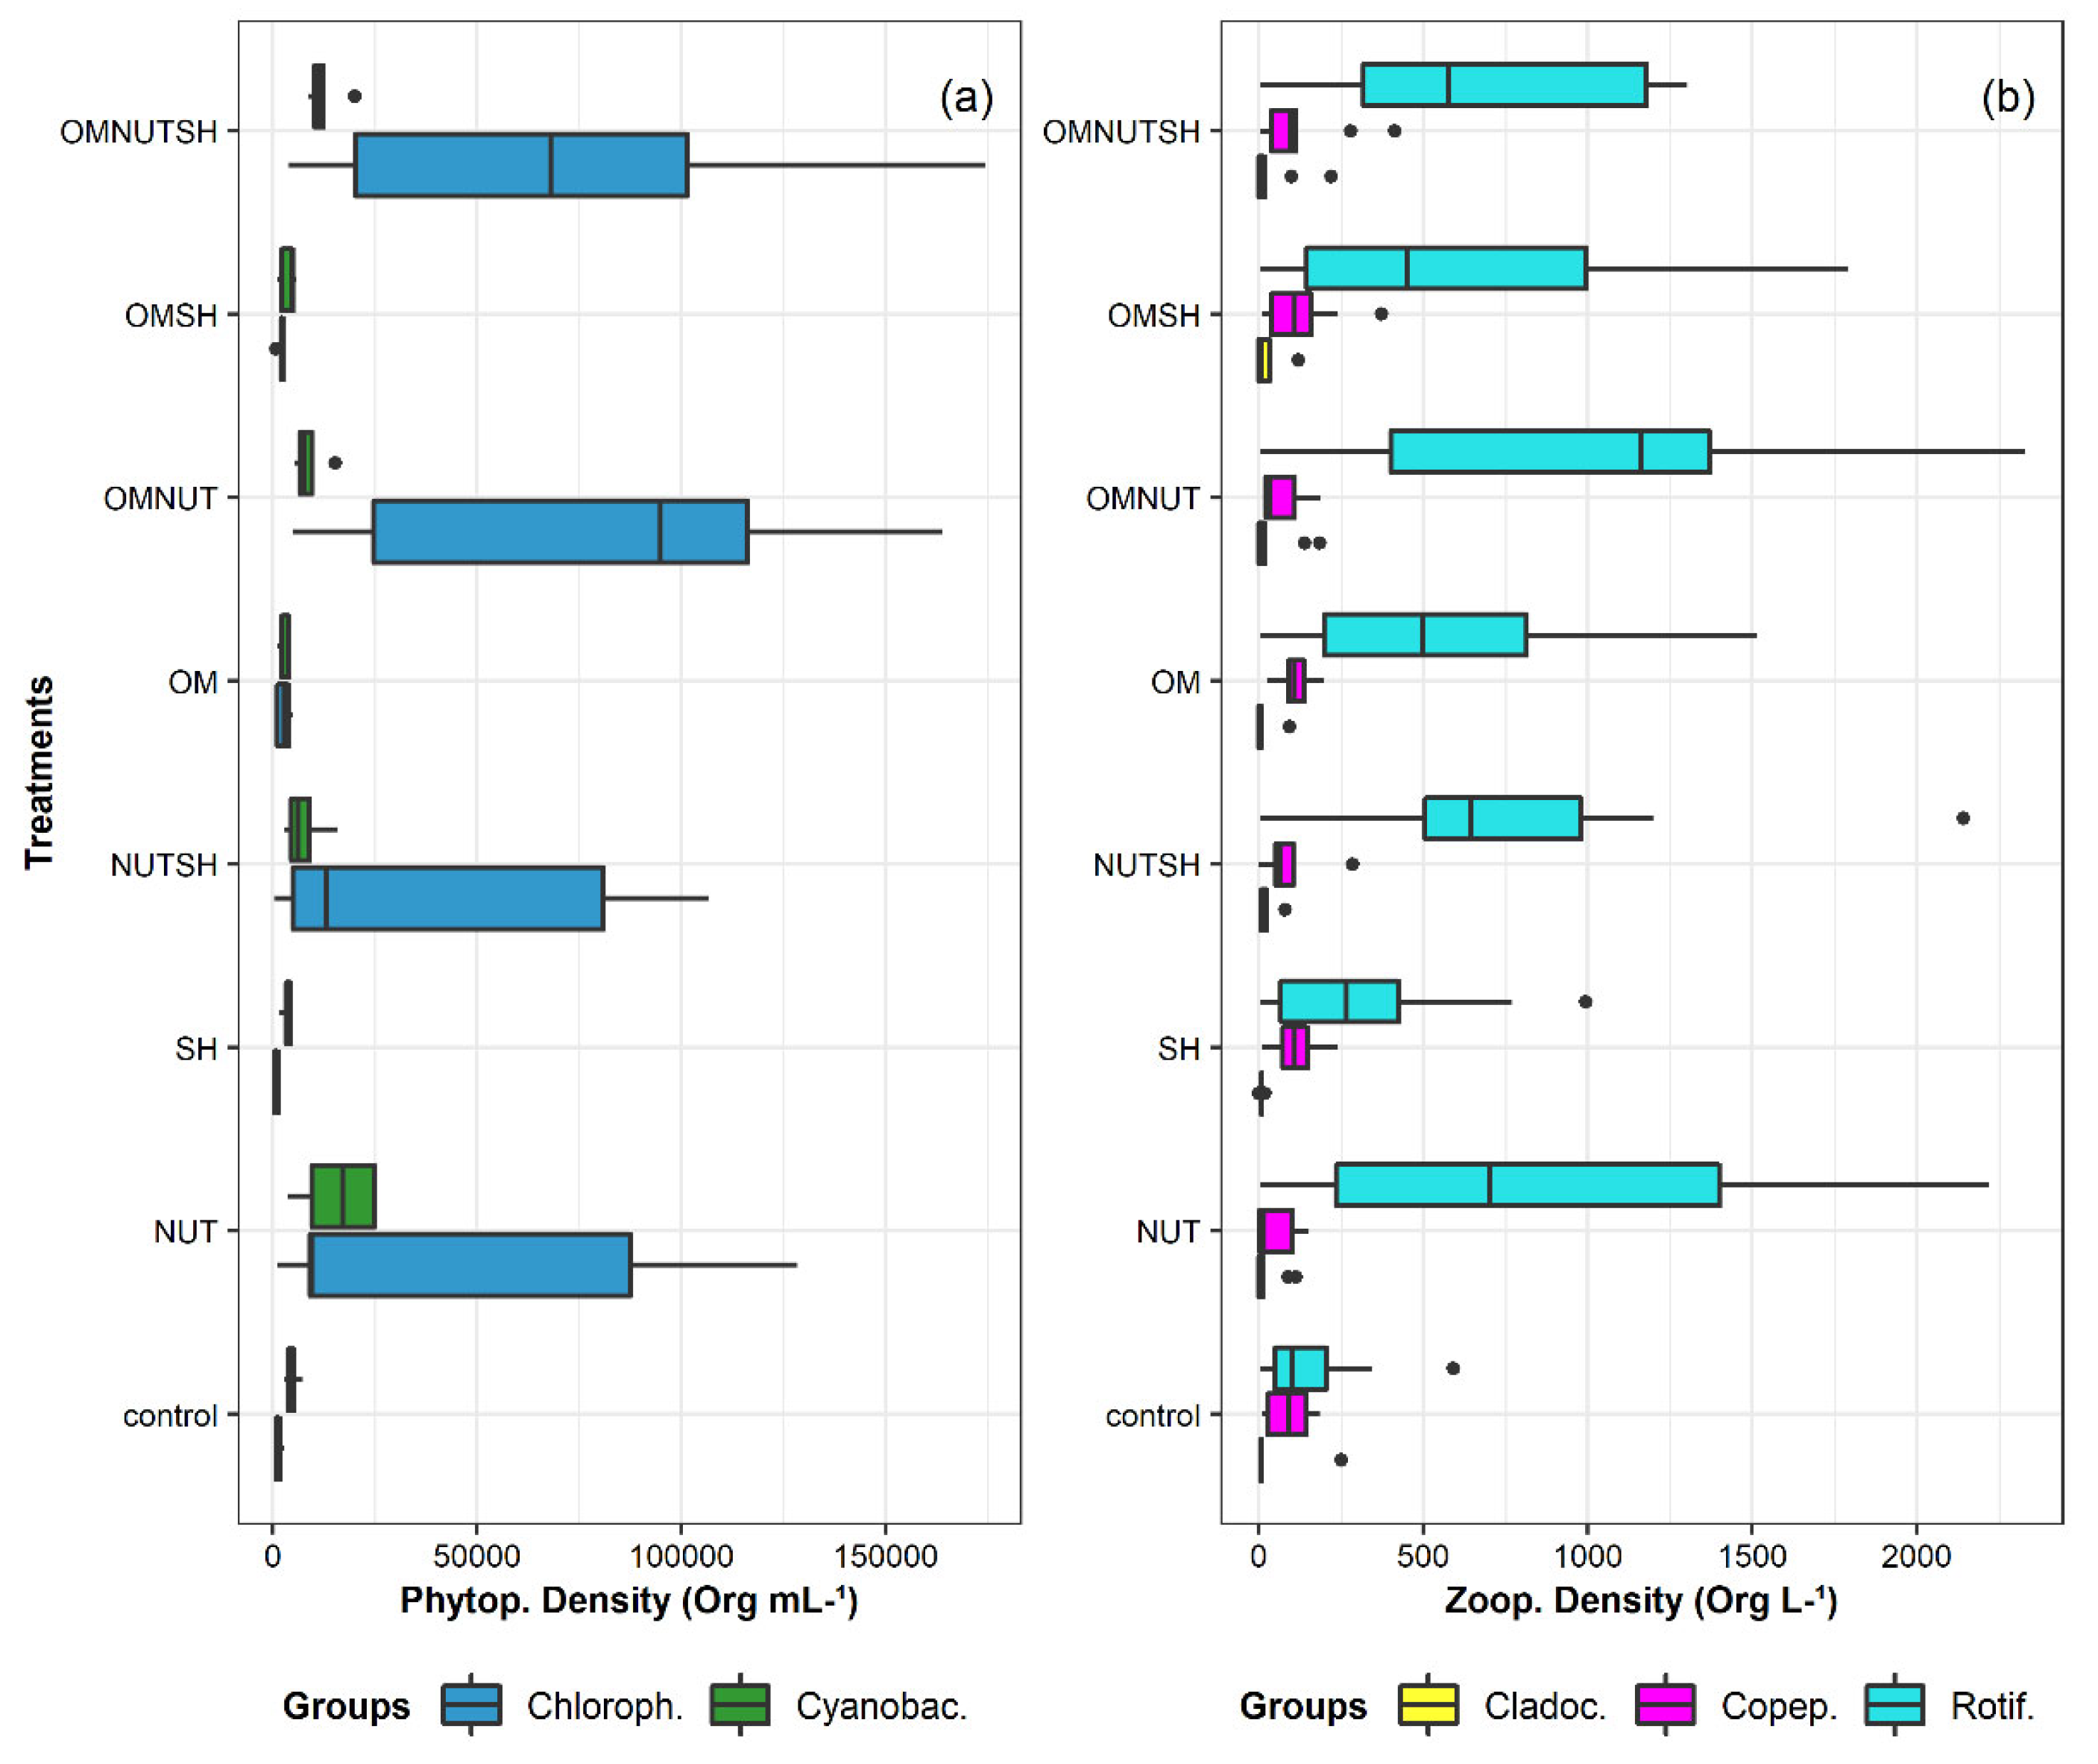
The mesocosms that did not receive nutrients (control, OM, SH, OMSH) remained dominated by cyanobacteria, representing up to 74% of the total phytoplankton density (Table S1). On the first day, the dominant cyanobacteria species was P. catenata, and in the next sampling, dominance was replaced by Aphanocapsa elachista West and G.S West for these treatments (control, OM, SH, and OMSH). It is important to note that even in dominance, A. elachista (mean of 4417 ± 1724 individuals mL−1) exhibited 10-fold lower densities in comparison with Chlorophyceae (mean density of 44,700 ± 56,644 individuals mL−1) in mesocosms with nutrient addition. Although cyanobacteria never became dominant in the nutrient-added mesocosms, their numbers almost doubled (9937 ± 6090 individuals mL−1) compared to the initial levels (Figure 4a), and Geitlerinema sp. was the main cyanobacteria species that grew in these treatments.
Concerning zooplankton, copepods were initially dominant (day 0) in all mesocosms, similar to normal lake conditions. The young forms of copepods initially dominated this group, with nauplii of Cyclopoida and copepodites from genus Thermocyclops initially responsible for 79% of the total zooplankton density. The adult forms of Thermocyclops minutus represented approximately 10% of the initial densities, whereas rotifers and cladocerans accounted together, contributed to 11%.
The mean density of zooplankton among all mesocosms was 759 ± 634 individuals L−1. Rotifera was the dominant group in all treatments, representing 91% of total density found in different treatments (Table S2). The species found in high abundance was Keratella americana, which is dominant in almost all mesocosms (NUT, SH, NUTSH, OM, and OMNUT). The control mesocosms and those treated with a combination of all conditions (OMNUTSH) were dominated by Hexarthra sp., whereas the OMSH mesocosms were dominated by Conochilus coenobasis. Copepoda was the second most abundant group, with higher mean densities in mesocosms with OM and shading combined (OMSH, 126 ± 113 Org L−1), followed by cladocerans, which were recurrently observed, with a higher mean density in OMNUT mesocosms (37 ± 68 Org L−1) (Figure 4b).
The bacterioplankton community presented a mean density of 1089,211± 578,801 individuals mL−1 in all mesocosms [38]. The OMNUT treatment presented the highest mean density of bacteria, with 1,718,987 ± 637,544 individuals mL−1. The smallest mean density was found in the SH mesocosms, without any nutrient or OM addition, with 490,109 ± 132,879 individuals mL−1.

3.3. Plankton Responses to Nutrients, Organic Matter and Shade Additions

From the linear mixed models, we observed that the total phytoplankton density strongly responded to nutrient addition, indicating a significant nutritional influence on the dominance of Chlorophyceae and cyanobacteria. Chlorophyceae also presented a significant increase in OM treatments, and for cyanobacteria, this increase was observed only when OM was added with shading (OMSH treatment). The zooplankton total density also responded in an expressive way to OM and nutrient addition. Cladocera was the only zooplankton group that did not respond effectively to treatments related to density changes (Table 1).
While cyanobacteria numbers were positively correlated with concentrations of total N and P, Chlorophyceae were positively correlated with concentrations of these nutrients, as well as with DOC (Table 2). The total density of the zooplankton groups increased with UV attenuation and ecosystem respiration. In particular, rotifers were favored by Chl-a and nutrient concentrations. On the other hand, copepod growth was negatively affected by an increase in Chlorophyceae.
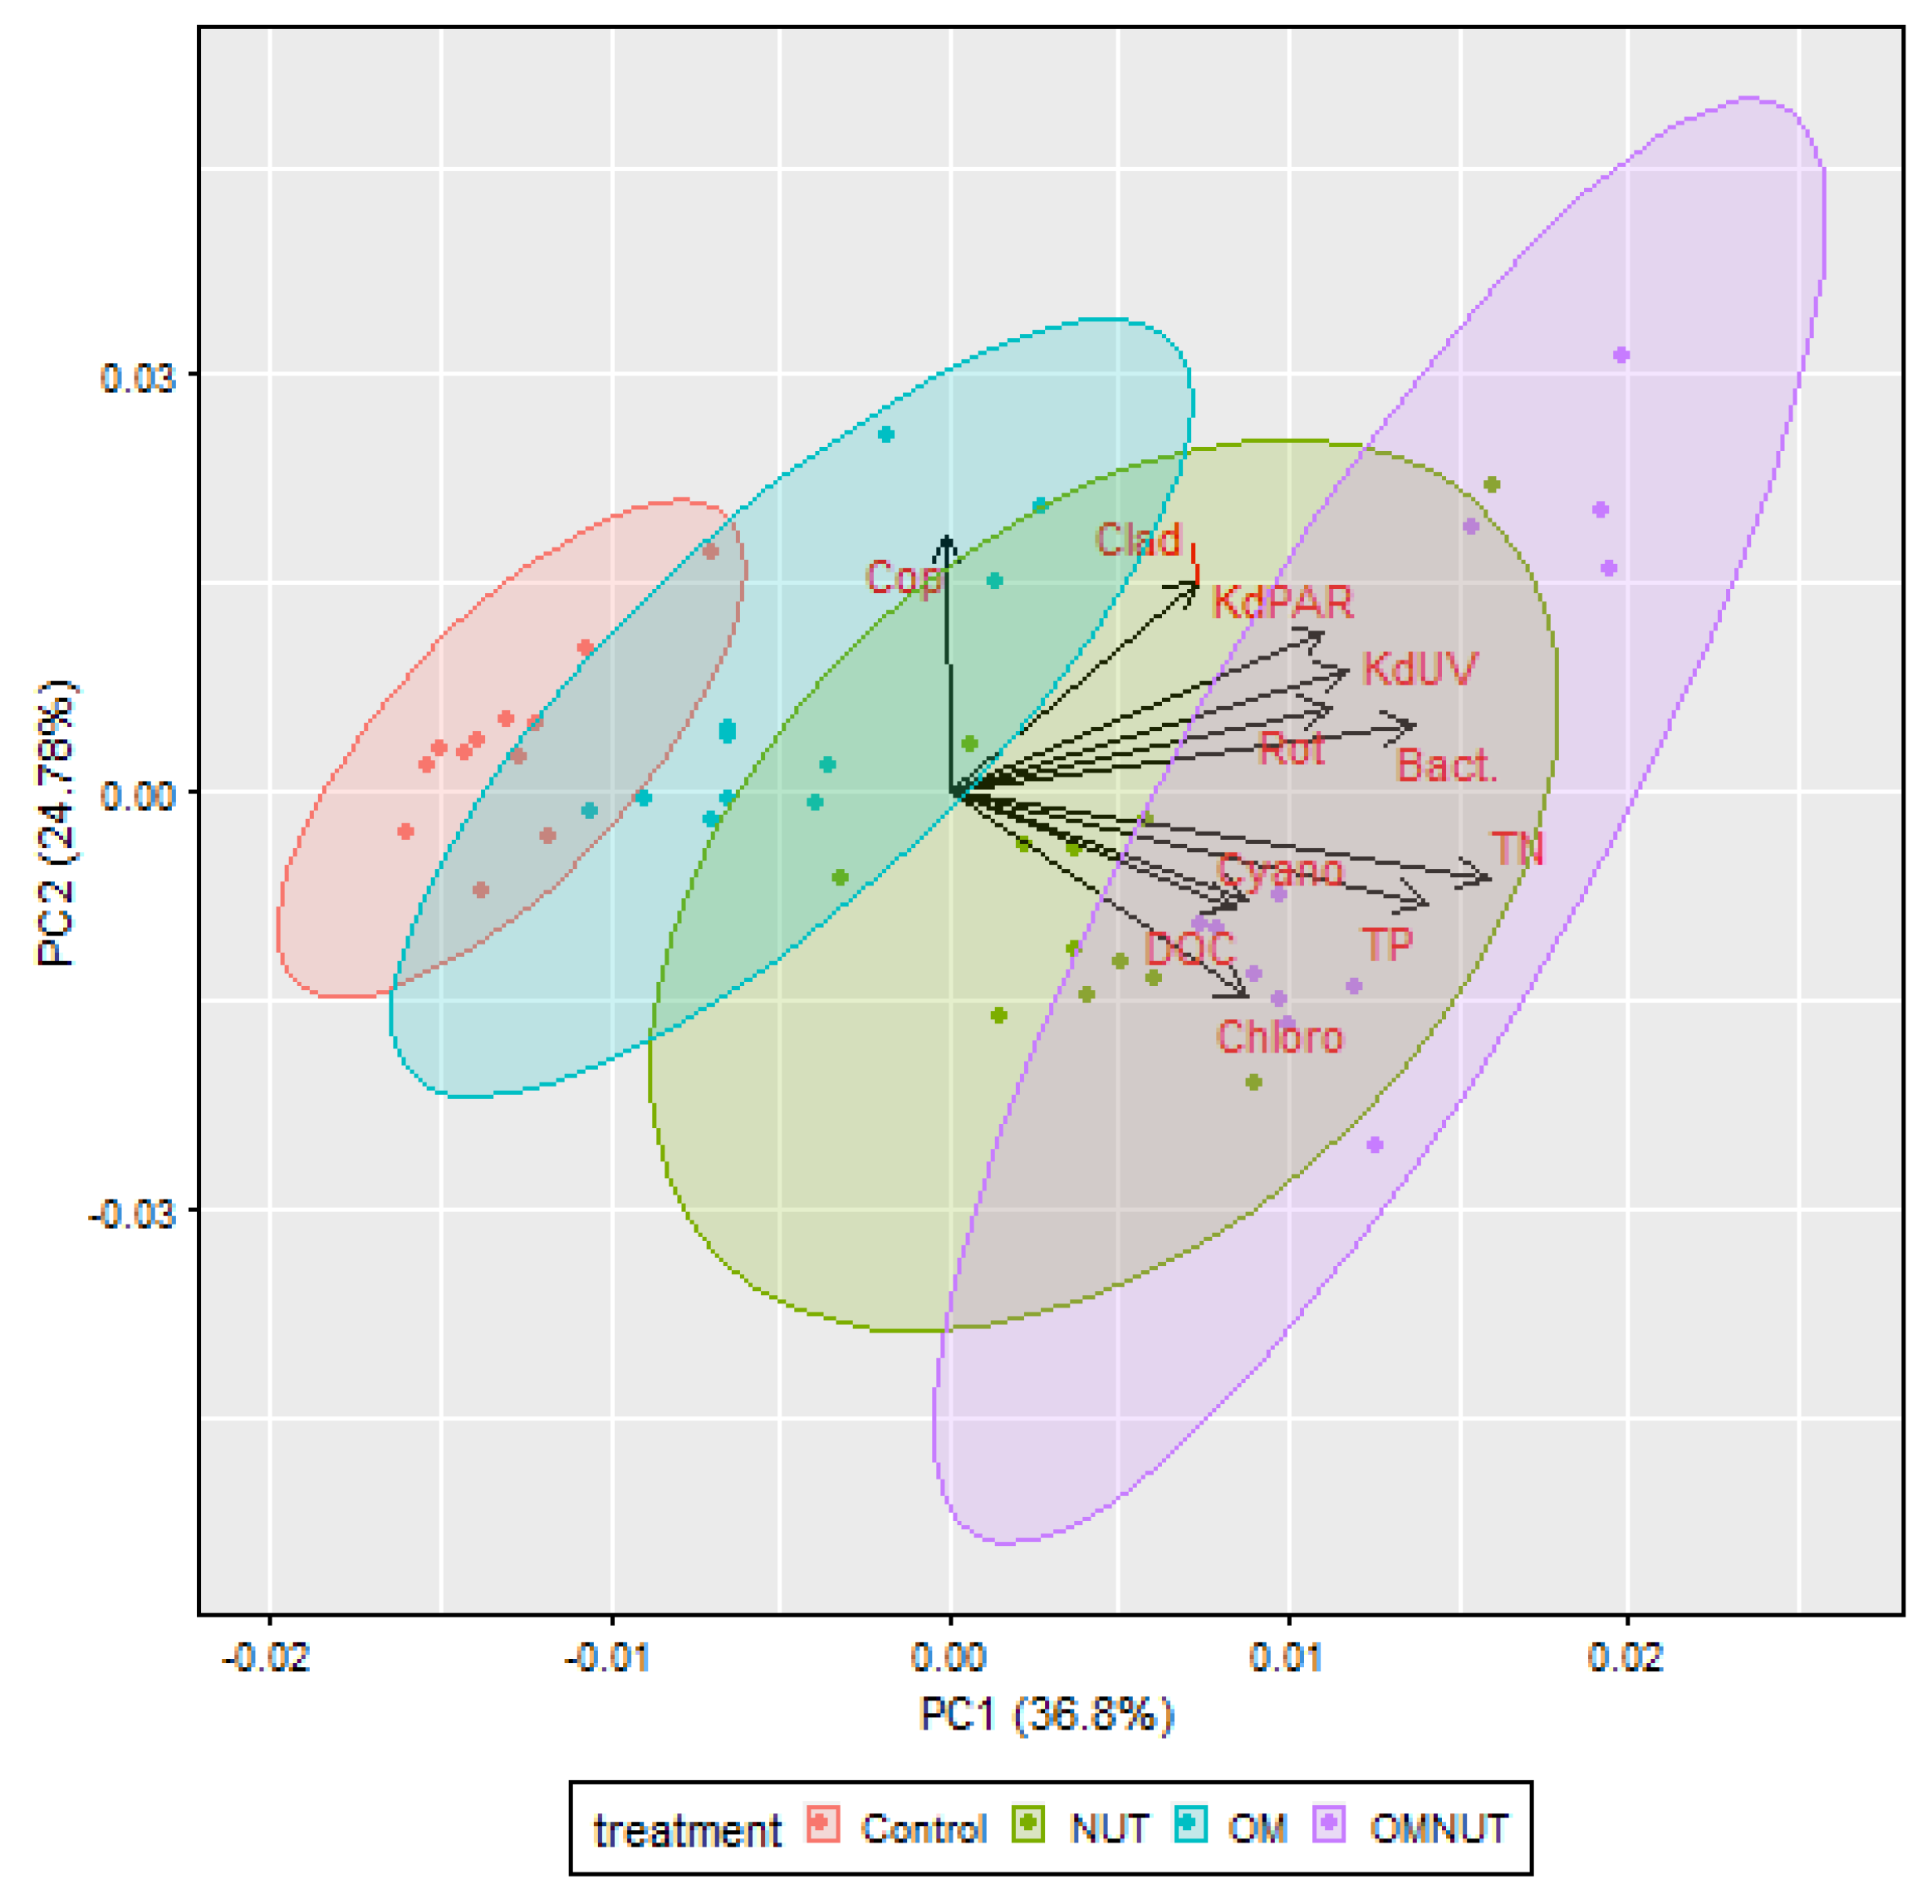
Principal component analysis identified clear segregation of phytoplankton and zooplankton communities among the different experimental treatments (Figure 5). The phytoplankton community was mostly explained by principal component axis 1, which was strongly governed by parameters related to the addition of nutrients and allochthonous carbon (DOC, TN, and TP). The zooplankton community was strongly associated with principal component 2 as well as with bacteria, KdPAR and KdUV.
The mesocosm treatment with the highest richness for phytoplankton was OM, whereas the lowest richness was observed in treatments with NUT, NUT, and OMNUT. For zooplankton, all mesocosms presented similar richness, ranging between 27 species (NUT mesocosms) and 31 species (OMNUTSH mesocosms). Richness data are presented in Supplementary Table S4.

4. Discussion

4.1. Phytoplankton Responses to Nutrients, OM, and Shading Addition

This mesocosm experiment showed significant changes in both phyto- and zooplankton species composition three days after alterations in nutrient availability, increased input of allochthonous material, and reduced light availability. This indicates that tropical planktonic communities can respond quickly to human perturbations, altering the availability of nutrients, land-derived organic material, and changes in light availability. Initially, the phytoplankton community was dominated by Cyanophyceae (Pseudanabaena catenata, which represented approximately 55% of total phytoplankton abundance before variable addition). Higher densities of Cyanophyceae have been observed in tropical mesotrophic environments [50,51]. As expected, the addition of nutrients stimulated a rapid increase in phytoplankton density, favoring the dominance of Chlorophyceae and Cyanophyceae in shallow and nutrient-enriched tropical environments [52,53], and reducing other groups already found in lower densities in the lake, such as Dinophyceae, Conjugatophyceae, Cryptophyceae, and Trebouxiophyceae, as evidenced by the lowest richness values observed in mesocosms with nutrient addition.
The nutrient-enriched mesocosms presented higher nitrogen (N) and phosphorus (P) concentrations that were considered limiting [54] until the end of the experiment (12th day), and had Chlorophyceae density expressively elevated with Chlorella sp. dominating phytoplankton, different from that observed naturally in the lake. Although cyanobacteria was the dominant group in treatments without nutrient addition (control, OM, SH, and OMSH), cyanobacteria also increased in the NUT mesocosms (NUT, OMNUT, NUTSH, OMNUTSH) (Table 1, F = 42.63, p < 0.001), but exhibited a substitution of the dominant species of this group (from P. catenata on day 0 to A. elachista) observed in all mesocosms. Similar to Chlorella sp., A. elachista is normally associated with shallow and eutrophic environments [55], which can explain its co-occurrence at higher densities in NUT-enriched mesocosms. Although A. elachista was the dominant cyanobacterium during the experiment, our results suggest that this species may be inhibited by Chlorella sp. growth. Small algae cells with large surface–volume ratios, such as Chlorella sp., are better nutrient absorbers from the environment, especially when they are found in abundance, as occurs in mesocosms enriched with nutrients [56]. This genus is well known because of its rapid population growth and short generation time, and its development is essential for the development of other phytoplankton species, as it is considered a pioneer species [57]. Geitlerinema sp., a species that also presented an increase in nutrient-enriched treatments, is a shade-adapted species that is common in turbid mixed environments [55]; the lack of dominance of this group in this experiment can be associated with cellular morphology, as this species has a smaller surface–volume ratio than the observed Chlorella sp. dominant species [58].
Allochthonous OM addition did not change the phytoplankton structure observed on the initial day, although it stimulated an increase in the densities of Chlorophyceae. However, the increase in Chlorophyceae with OM addition (Table 1, F = 13.76, p < 0.001) was much lower than that observed in nutrient-enriched mesocosms (see Figure 2). Although phytoplankton responded strongly to nutrient addition, this response seemed to be even higher when OM and nutrients were combined (OMNUT and OMNUTSH). The effect of allochthonous OM on phytoplankton growth can be direct, by increasing carbon and other nutrient bioavailability due to photo- and biodegradation of organic compounds made by bacteria [59], which are abundant in these treatments [38]. In addition, the indirect effects of OM on phytoplankton are associated with water transparency reduction through the high absorption of visible and UV radiation by aromatic compounds present in allochthonous OM [60]. Ref. [28] reported the photoinhibition of primary production in Carioca Lake. In the present study, photoinhibition was commonly detected in treatments without OM addition [61]. Our results indicate an exacerbated effect on phytoplankton, especially in Chlorophyceae, when OM was added together with nutrients (OMNUT, OMNUTSH). This effect might be associated with the enormous nutritional availability from two different qualities and sources, in addition to water transparency reduction caused by allochthonous OM. The degradation of OM (by bacteria and photodegradation) is responsible for the gradual availability of nutrients from this source, which can be the main reason for Chlorella sp. population. Ref. [62] demonstrated an increase in Chlorella sp. cultures in an experiment with CO₂ bubbles, the main product of decomposition performed by bacteria, which are abundant in OM treatments. In addition, some studies have demonstrated through experiments performed with species from Chlorella genus that a biomass increase is observed on these organisms when an organic carbon source is offered, as occurred in a mixotrophic growth condition, while inorganic carbon availability increased (simulating phototrophic conditions) did not provoke the same effect in Chlorella’s biomass [63,64].
The shaded mesocosms, including those combined with OM addition (SH, OMSH), showed phytoplankton densities as low as those found on day zero of the experiment and those found in the control mesocosms. The cyanobacteria A. elachista was the most abundant species in these mesocosms after day zero, suggesting the competitive success of this species in confined environments, once the dominant species on day zero was P. catenata. In addition, A. elachista is a colonial free-floating species surrounded by mucilage that provides vertical locomotion to the most luminous or nutrient-rich regions of the water column [56]. We expected that mesocosms with less light availability would be dominated by phytoplankton species tolerant to low light and confined conditions; however, A. elachista dominance was observed in all treatments without nutrient addition.
Although nutrient and allochthonous OM addition caused significant alterations in phytoplankton composition and abundance, these effects must be observed cautiously. In addition to promoting bacterioplankton growth, the presence of large amounts of humic substances can restrict the primary production of phytoplankton through light absorption [65]. However, the bacterial density data described by [38] for this experiment included cyanobacteria in its final count, but this group does not seem to have been overestimated in the analysis performed, once bacteria and cyanobacteria are separated in the PCA performed (see Figure 5), as ecosystem respiration strongly associates with bacterioplankton, and not with cyanobacteria.

4.2. Zooplankton Responses to Nutrients, OM, and Shading Addition

The zooplankton communities displayed responses distinct from those observed in the phytoplankton community. Before the addition of OM and NUT, zooplankton were dominated by young forms of copepods. Approximately 56% of total abundance on day zero of the experiment was Cyclopoida nauplii, 23% was Thermocyclops copepodites, and only 9% were adult forms of T. minutus. Rotifers represented only 5% of total organisms found, and it was in majority K. americana, whereas the main representative of cladocerans was Bosmina tubicen, with 6% of the total of organisms found. Young Cyclopoida dominance in habitual conditions can be a signal of the survival strategy of these organisms, as adults and bigger copepods are more predated by visual predators than smaller adults and young forms [27].
On the days following the experiment, rotifers dominated all mesocosms, including the control. However, the initial community of the mesocosms, similar to that usually found in the lake, is not naturally dominated by this group. The confinement of small portions of the original zooplankton community of the lake in the mesocosms can explain this dominance, as it evidences the opportunistic features of Rotifera [66]. Keratella americana and Hexarthra sp. were the main species with increasing densities. The NUT mesocosms, including those combined with other variables (NUT, OMNUT, NUTSH, and OMNUTSH), had the highest densities of rotifers. However, the highest mean density of rotifers was observed in the OMNUT mesocosms, which might be related to phytoplankton increase in this treatment, through the bottom–up effect, once the main rotifers found in the mesocosms were filtered [67,68]. Moreover, a large quantity of bacteria was added, associated with the allochthonous OM, and zooplankton presented a close relationship with bacterioplankton (Figure 5), suggesting a microbial loop effect within the trophic relationships in the mesocosms. Bacterioplankton can actively participate in the aquatic food chain as food for zooplankton, not only through organic matter biodegradation [69,70].
In contrast, nutritional limitations and shading seemed to have positive effects on copepods, mainly in the young forms of Cyclopoida. These organisms presented the highest densities, besides on day zero, in mesocosms that were only shaded (SH). The density values observed for copepods were negatively related to those found for Chlorophyceae, which had the highest growth in the UTT-treated mesocosms (NUT, OMNUT, NUTSH, and OMNUTSH), and this comes together with the decrease in other phytoplankton groups that were naturally found in low densities in the lake, such as Dinophyceae, Conjugatophyceae, and Cryptophyceae. Previous studies have reported a negative trophic relationship between copepods and some species of the genus Chlorophyceae found in tropical freshwater [71]. In addition to Copepoda, all zooplankton groups were positively influenced by shading in the different treatments (Figure 4, Table 2. Ref. [72] performed a 30-day mesocosm experiment with different simulations of light scenarios to assess zooplankton response to artificial shading, and found that anoxia is the major driving force of the zooplankton response to shading simulation. In addition, the availability of feeding resources, that is phytoplankton production under shading conditions, did not seem to have a strong effect on the response of this community. Anoxia was not present in our experiment once all mesocosms were homogenized daily. In other words, zooplankton growth in our experiment was not affected by shading because our mesocosm experiment did not assess anoxic conditions. However, the zooplankton increase was not harmed, and in fact, was even greater than that observed in the lake. This might have occurred because of the controlled environmental nature of the experiment, since no zooplankton main predators, such as Chaoborus larvae and planktivorous fish, were present in the mesocosms.
Nevertheless, the shading effect observed in zooplankton can be collateral and more related to Chlorella sp. inhibition growth. The mean phytoplankton density was nine times lower in mesocosms without nutrient addition (control, OM, SH, and OMSH) than in those with nutrient addition (NUT, OMNUT, NUTSH, and OMNUTSH), which might be evidence that high densities of Chlorella sp. harm some zooplankton species, even if this species can serve as food for some representatives of this community. In general, eutrophication has a considerable impact on zooplankton diversity and species abundance. Eutrophic lakes can have high zooplankton biomass with low species richness [73].

4.3. The Food Chain Relationship and the Bottom–Up Effect

The bottom–up effect was evidenced by nutritional availability (nutrients and OM addition) and phytoplankton density with dominance of typical enrichment-environment species (e.g., Chlorella sp.). In contrast, although a considerable increase was observed in rotifers with filtering potential (e.g., K. americana, C. coenobasis, Hexarthra sp.) in nutrient- or OM-enriched mesocosms, no direct relationship was observed between phytoplankton and zooplankton. A possible explanation is that it would be necessary for more than 12 days of experimental observation to detect trophic relationships between these communities.
The segregation of phytoplankton and zooplankton in this study (Figure 5) suggests that the high density of bacteria in the mesocosms is an important food source for some species. The OM addition in the corresponding mesocosms (OM, OMNUT, OMSH, OMNUTSH) was combined with a bacterial addition associated with that matter, and it can be responsible for the presence of bacteria observed in these mesocosms [74]. Nevertheless, community segregation in this experiment may have been caused by the quality of the algae produced in mesocosms enriched with nutrients. In a controlled experiment, Chlorella vulgaris was found a trade-off between avoiding predation and becoming competitive. Exposure of these cells to Brachionus calyciflorus, a grazing rotifer species, induced a rapid evolutionary response, and subsequent generations of C. vulgaris were smaller and less nutritious, that is, smaller concentrations of nitrogen and carbon per cell. Hence, these cells are less competitive than those cultivated in the absence of predators [75]. Furthermore, ref. [76] demonstrated that some non-toxic species of the genus Chlorella can be indigestible to grazers, act as a potential oxidative stress, and cause slow growth in Chironomidae larvae. The authors also showed that Chlorella sp. is normally dominant, and, especially if nutrients and temperature are favorable, it is common to observe blooms of these algae in lentic systems. Our experiment was performed during summer, and nutrient addition, especially nitrogen, seemed to be the key factor for the growth of this species in the corresponding mesocosms. Carioca Lake is not usually dominated by Chlorella sp., probably because it is a mesotrophic lake [23,28], and the only organic matter inputs are through seasonal inputs of OM from the Atlantic Forest, especially during the rainy season [77].

4.4. Ecological Implications

The observed effects of nutrients and allochthonous OM addition and the reduction of light availability on tropical plankton of Carioca Lake can help predict community responses to the many impacts to which similar aquatic ecosystems are exposed. Some of these impacts are changes in rainfall due to climate change, which has become more prevalent around the world, and eutrophication. Changes in rain patterns are already a reality in the Middle Rio Doce region, where the Carioca Lake is located. This lake has lost 60% of its volume since 2013 after prolonged drought events in the region [78]. As a consequence of the lower volume, the concentrations of nutrients and aromatic carbon have increased dramatically, and the transparency of the water has decreased considerably (PELD monitoring, unpublished data). In addition, the substitution of native vegetation by Eucalyptus plantations around lakes is increasing in the region, altering the quality and quantity of allochthonous OM that enters the lakes, in addition to light conditions along the water column. As demonstrated in this study, OM input causes great changes in aquatic ecosystems, similar to urbanization and land use changes [79]. Thus, predicting the consequences of these impacts on planktonic communities, which represent the basis of the aquatic food chain, is of crucial importance to higher trophic levels and lake functioning, with final consequences for human and ecosystem services.
Through this experiment, we demonstrated that changes in allochthonous OM and nutrient availability, even in smaller quantities, as in OM-treated mesocosms, were capable of drastically altering the structure of the plankton community in this tropical lake over a short period. Chlorophyceae and Rotifera dominance was evidenced by nutrient and OM increases, with losses to the diversity of organisms. Therefore, predicting the consequences of these problems in the functioning of aquatic biota can be fundamental for protecting and conserving aquatic tropical systems.

5. Conclusions

Our results led us to conclude that the anthropogenic impacts simulated in our mesocosm experiment were capable of supporting the disturbances that they can cause in the plankton community. The substitution of dominant species and the high population density of a small number of species present in the mesocosms were the main effects observed, common in a community with rapid response, and are ephemeral and adaptable generations. An apparent loss in phytoplankton nutritional quality was observed, which seems to be the reason for zooplankton preference for microbial loop grazing, instead of phytoplankton. Our experiments also suggest that climate change could be an important driver of the alterations observed in these communities. For example, the occurrence of torrential rains can cause huge allochthonous OM input to the lake and unbalance these communities, which can act as the basis of the aquatic food chain and trigger an imbalance in superior ecological levels. This can lead to increasingly vulnerable tropical environments with ecological and economic losses.

Supplementary Materials

The following supporting information can be downloaded at: https://www.mdpi.com/article/10.3390/limnolrev25020016/s1, Figure S1 Location of Carioca lake in the State of Minas Gerais, Brazil; Figure S2 Physicochemical components and planktonic groups found on Carioca Lake; Figure S3 Photos of the dominant species recorded in the mesocosms; Table S1 Relative abundance of main phytoplankton groups and species, separated by mesocosms treatment; Table S2 Relative abundance of main zooplankton groups and species, separated by mesocosms treatments; Table S3 Mean and standard deviation from the main parameters measured in mesocosms, separated by treatment; Table S4 Daily averages of wind speed, precipitation and air temperature; Table S5 Mean values and standard deviations of organisms from different phytoplankton classes observed in each treatment; Table S6 Total species richness on phytoplankton and zooplankton community, separated by mesocosms treatments.

Author Contributions

Conceptualization, L.P.M.B., L.S.B., P.A.U.S., F.A.R.B. and J.F.B.-N.; methodology, L.P.M.B., L.S.B., P.A.U.S., F.A.R.B. and J.F.B.-N.; software, M.I.B.d.S. and L.P.M.B.; validation, L.P.M.B., L.S.B., P.A.U.S., F.A.R.B. and Bezerra-Neto, J.F; formal analysis, L.P.M.B., L.S.B., M.I.B.d.S. and C.F.d.A.B.; investigation, L.P.M.B., L.S.B., P.A.U.S., F.A.R.B. and J.F.B.-N.; resources, P.A.U.S., F.A.R.B. and J.F.B.-N.; data curation, L.P.M.B., L.S.B., P.A.U.S., F.A.R.B. and J.F.B.-N.; writing—original draft preparation, M.I.B.d.S. and L.P.M.B.; writing—review and editing, M.I.B.d.S., L.P.M.B., L.S.B., P.A.U.S., F.A.R.B., C.F.d.A.B. and J.F.B.-N.; visualization, M.I.B.d.S., L.P.M.B., L.S.B., P.A.U.S., F.A.R.B., C.F.d.A.B. and J.F.B.-N.; supervision, J.F.B.-N.; and L.P.M.B.; project administration, J.F.B.-N.; funding acquisition, J.F.B.-N. All authors have read and agreed to the published version of the manuscript.

Funding

This research was funded by COCLAKE project (CAPES Proc. Ne. 88881.030499/2013-01).

Institutional Review Board Statement

Not applicable.

Informed Consent Statement

Not applicable.

Data Availability Statement

The data used in this research are prepared for publication in the Global Biodiversity Information Facility (www.gbif.org) repository. In addition to the data, metadata were provided.

Acknowledgments

The authors thank the Forestry Institute of Minas Gerais (IEF-MG) for the sampling permit and all staff of Rio Doce State Park, as well as the team of Laboratório de Limnologia, Ecotoxicologia e Ecologia Aquática (LIMNEA) of Instituto de Ciências Biológicas in Universidade Federal de Minas Gerais (ICB/UFMG). Finally, we would like to thank especially Denise Tonetta, Marcelo Ávila, Ralph Tomé, Gustavo Turci, Patrícia Ferreira, and Marcelo Costa for their contributions to sampling and analysis in this project.

Conflicts of Interest

The authors declare no conflicts of interest associated with this manuscript.

References

  1. Parmar, T.K.; Rawtani, D.; Agrawal, Y.K. Bioindicators: The natural indicator of environmental pollution. Front. Life Sci. 2016, 9, 110–118. [Google Scholar] [CrossRef]
  2. Hosmani, S.P. Fresh Water Algae as Indicators of Water Quality. Univers. J. Environ. Res. Technol. 2013, 3, 473–482. [Google Scholar]
  3. Pålsson, C.; Granéli, W. Nutrient limitation of autotrophic and mixotrophic phytoplankton in a temperate and tropical humic lake gradient. J. Plankton Res. 2004, 26, 1005–1014. [Google Scholar] [CrossRef]
  4. Carpenter, S.R.; Kitchell, J.F. (Eds.) The Trophic Cascade in Lakes; Cambridge University Press: Cambridge, UK, 1996. [Google Scholar]
  5. Munawar, M.; Wilson, J.B. Phytoplankton-zooplankton associations in Lake Superior: A statistical approach. J. Great Lakes Res. 1978, 4, 497–504. [Google Scholar] [CrossRef]
  6. Henry, R.; Tundisi, J.G.; Curi, P.R. Effects of phosphorus and nitrogen enrichment on the phytoplankton in a tropical reservoir (Lobo Reservoir, Brazil). Hydrobiologia 1984, 118, 177–185. [Google Scholar] [CrossRef]
  7. Verburg, P.; Schallenberg, M.; Elliott, S.; McBride, C.G. Nutrient budgets in lakes. In Lake Restoration Handbook; Springer: Cham, Germany, 2018; pp. 129–163. [Google Scholar]
  8. Reynolds, C.S. Phytoplankton assemblages and their periodicity in stratifying lake systems. Ecography 1980, 3, 141–159. [Google Scholar] [CrossRef]
  9. Jansson, M. Nutrient limitation and bacteria—Phytoplankton interactions in humic lakes. In Aquatic Humic Substances; Springer: Berlin/Heidelberg, Germany, 1998; pp. 177–195. [Google Scholar]
  10. Carlsson, P.; Granéli, E. Availability of humic bound nitrogen for coastal phytoplankton. Estuar. Coast. Shelf Sci. 1993, 36, 433–447. [Google Scholar] [CrossRef]
  11. Vähätalo, A.V.; Salonen, K.; Münster, U.; Järvinen, M.; Wetzel, R.G. Photochemical transformation of allochthonous organic matter provides bioavailable nutrients in a humic lake. Arch. Für Hydrobiol. 2003, 156, 287–314. [Google Scholar] [CrossRef]
  12. Klug, J.L. Positive and negative effects of allochthonous dissolved organic matter and inorganic nutrients on phytoplankton growth. Can. J. Fish. Aquat. Sci. 2002, 59, 85–95. [Google Scholar] [CrossRef]
  13. Jurgens, K. Impact of Daphnia on planktonic. Mar. Microb. Food Webs 1994, 8, 295–324. [Google Scholar]
  14. de Melo, M.L.; Kothawala, D.N.; Bertilsson, S.; Amaral, J.H.; Forsberg, B.; Sarmento, H. Linking dissolved organic matter composition and bacterioplankton communities in an Amazon floodplain system. Limnol. Oceanogr. 2020, 65, 63–76. [Google Scholar] [CrossRef]
  15. Morris, D.P.; Zagarese, H.; Williamson, C.E.; Balseiro, E.G.; Hargreaves, B.R.; Modenutti, B.; Moeller, R.; Queimalinos, C. The attenuation of solar UV radiation in lakes and the role of dissolved organic carbon. Limnol. Oceanogr. 1995, 40, 1381–1391. [Google Scholar] [CrossRef]
  16. Litchman, E. Competition and coexistence of phytoplankton under fluctuating light: Experiments with two cyanobacteria. Aquat. Microb. Ecol. 2003, 31, 241–248. [Google Scholar] [CrossRef]
  17. Cory, R.M.; Kling, G.W. Interactions between sunlight and microorganisms influence dissolved organic matter degradation along the aquatic continuum. Limnol. Oceanogr. Lett. 2018, 3, 102–116. [Google Scholar] [CrossRef]
  18. McKnight, D.M.; Boyer, E.W.; Westerhoff, P.K.; Doran, P.T.; Kulbe, T.; Andersen, D.T. Spectrofluorometric characterization of dissolved organic matter for indication of precursor organic material and aromaticity. Limnol. Oceanogr. 2001, 46, 38–48. [Google Scholar] [CrossRef]
  19. Davies-Colley, R.J.; Smith, D.G. Turbidity suspended sediment, and water clarity: A review. JAWRA J. Am. Water Resour. Assoc. 2001, 37, 1085–1101. [Google Scholar] [CrossRef]
  20. Welch, E.B.; Cooke, G.D. Internal phosphorus loading in shallow lakes: Importance and control. Lake Reserv. Manag. 2005, 21, 209–217. [Google Scholar] [CrossRef]
  21. Qin, B.; Gao, G.; Zhu, G.; Zhang, Y.; Song, Y.; Tang, X.; Xu, H.; Deng, J. Lake eutrophication and its ecosystem response. Chin. Sci. Bull. 2013, 58, 961–970. [Google Scholar] [CrossRef]
  22. Hagemann, S.; Chen, C.; Clark, D.B.; Folwell, S.; Gosling, S.N.; Haddeland, I.; Hanasaki, N.; Heinke, J.; Ludwig, F.; Voss, F.; et al. Climate change impact on available water resources obtained using multiple global climate and hydrology models. Earth Syst. Dyn. 2013, 4, 129–144. [Google Scholar] [CrossRef]
  23. Petrucio, M.M.; Barbosa, F.A.; Furtado, A.L. Bacterioplankton and phytoplankton production in seven lakes in the Middle Rio Doce basin, south-east Brazil. Limnologica 2006, 36, 192–203. [Google Scholar] [CrossRef]
  24. Gontijo, B.M.; Britto, C.Q. Identificação e classificação dos impactos ambientais no Parque Florestal Estadual do Rio Doce–MG. Geonomos 1997. [Google Scholar] [CrossRef]
  25. Brandão, L.P.M.; Brighenti, L.S.; Staehr, P.A.; Barbosa, F.A.R.; Bezerra-Neto, J.F. Partitioning of the diffuse attenuation coefficient for photosynthetically available irradiance in a deep dendritic tropical lake. Ann. Braz. Acad. Sci. 2017, 89 (Suppl. 1), 469–489. [Google Scholar] [CrossRef]
  26. Gagliardi, L.M.; Brighenti, L.S.; Staehr, P.A.; Barbosa, F.A.R.; Bezerra-Neto, J.F. Reduced rainfall increases metabolic rates in upper mixed layers of tropical lakes. Ecosystems 2019, 22, 1406–1423. [Google Scholar] [CrossRef]
  27. Fiksen, Ø.; Giske, J. Vertical distribution and population dynamics of copepods by dynamic optimization. ICES J. Mar. Sci. 1995, 52, 483–503. [Google Scholar] [CrossRef]
  28. Brighenti, L.S.; Staehr, P.A.; Gagliardi, L.M.; Brandão, L.P.M.; Elias, E.C.; de Mello, N.A.S.T.; Barbosa, F.A.R.; Bezerra-Neto, J.F. Seasonal changes in metabolic rates of two tropical lakes in the Atlantic forest of Brazil. Ecosystems 2015, 18, 589–604. [Google Scholar] [CrossRef]
  29. Roland, F.; Huszar, V.L.M.; Farjalla, V.F.; Enrich-Prast, A.; Amado, A.M.; Ometto, J.P.H.B. Climate change in Brazil: Perspective on the biogeochemistry of inland waters. Braz. J. Biol. 2012, 72, 709–722. [Google Scholar] [CrossRef] [PubMed]
  30. Vieira, S.A.; Alves, L.F.; Aidar, M.; Araújo, L.S.; Baker, T.; Batista, J.L.F.; Campos, M.C.; Camargo, P.B.; Chave, J.; Delitti, W.B.C.; et al. Estimation of biomass and carbon stocks: The case of the Atlantic Forest. Biota Neotrop. 2008, 8, 21–29. [Google Scholar] [CrossRef]
  31. Silva, L.H.S. Fitoplâncton de um reservatório eutrófico (Lago Monte Alegre), Ribeirão Preto, São Paulo, Brasil. Rev. Bras. Biol. 1999, 59, 281–303. [Google Scholar] [CrossRef]
  32. Tucci, A.; Sant’Anna, C.L.; Gentil, R.C.; Azevedo, M.D.P. Fitoplâncton do Lago das Garças, São Paulo, Brasil: Um reservatório urbano eutrófico. Hoehnea 2006, 33, 147–175. [Google Scholar]
  33. Pujoni, D.G.F. Padrões Espaço-Temporais da Comunidade Planctônica do Complexo Lacustre do Médio Rio Doce. Doctoral Dissertation, Universidade Federal de Minas Gerais, Belo Horizonte, Brazil, 2015. [Google Scholar]
  34. Bezerra-Neto, J.F.; Briguenti, L.S.; Pinto-Coelho, R.M. A new morphometric study of Carioca Lake, Parque Estadual do Rio Doce (PERD), Minas Gerais State, Brazil. Acta Sci. Biol. Sci. 2010, 32, 49–54. [Google Scholar] [CrossRef]
  35. Barbosa, F.A.; Padisák, J. The forgotten lake stratification pattern: Atelomixis, and its ecological importance. Int. Ver. Für Theor. Und Angew. Limnol. Verh. 2002, 28, 1385–1395. [Google Scholar] [CrossRef]
  36. Brandão, L.P.M.; Brighenti, L.S.; Staehr, P.A.; Asmala, E.; Massicotte, P.; Tonetta, D.; Barbosa, F.A.R.; Pujoni, D.; Bezerra-Neto, J.F. Distinctive effects of allochthonous and autochthonous organic matter on CDOM spectra in a tropical lake. Biogeosciences 2018, 15, 2931–2943. [Google Scholar] [CrossRef]
  37. Mackereth, F.J.H.; Heron, J.; Talling, J.F. Water analysis and some revised methods for limnologists. Freshw. Biol. Assoc. Sci. Pub. 1978, 36, 117. [Google Scholar]
  38. Ávila, M.P.; Brandão, L.P.; Brighenti, L.S.; Tonetta, D.; Reis, M.P.; Stæhr, P.A.; Asmala, E.; Amado, A.M.; Barbosa, F.A.; Bezerra-Neto, J.F.; et al. Linking shifts in bacterial community with changes in dissolved organic matter pool in a tropical lake. Sci. Total Environ. 2019, 672, 990–1003. [Google Scholar] [CrossRef]
  39. Staehr, P.A.; Sand-Jensen, K.A.J. Seasonal changes in temperature and nutrient control of photosynthesis, respiration and growth of natural phytoplankton communities. Freshw. Biol. 2006, 51, 249–262. [Google Scholar] [CrossRef]
  40. Jakobsen, H.H.; Blanda, E.; Staehr, P.A.; Højgård, J.K.; Rayner, T.A.; Pedersen, M.F.; Jepsen, P.M.; Hansen, B.W. Development of phytoplankton communities: Implications of nutrient injections on phytoplankton composition, pH and ecosystem production. J. Exp. Mar. Biol. Ecol. 2015, 473, 81–89. [Google Scholar] [CrossRef]
  41. Brandão, L.P.M.; Staehr, P.A.; Bezerra-Neto, J.F. Seasonal Changes in Optical Properties of Two Contrasting Tropical Freshwater Systems. J. Limnol. 2016, 75, 508–519. [Google Scholar] [CrossRef]
  42. Utermöhl, H. Zur vervollkommnung der quantitativen phytoplankton-methodik: Mit 1 Tabelle und 15 abbildungen im Text und auf 1 Tafel. Int. Ver. Für Theor. Und Angew. Limnol. Mitt. 1958, 9, 1–38. [Google Scholar] [CrossRef]
  43. Lund, J.W.G.; Kipling, C.; Le Cren, E.D. The inverted microscope method of estimating algal numbers and the statistical basis of estimations by counting. Hydrobiologia 1958, 11, 143–170. [Google Scholar] [CrossRef]
  44. Villafañe, V.E.; Reid, F.M.H. Métodos de microscopía para la cuantificación del fitoplancton. In Manual de Métodos Ficológicos; Alveal, K., Ferreiro, M.E., Oliviera, E.C., Ferreiro, M.A., Eds.; Universidad de Concepción: Concepción, Chile, 1995; pp. 169–185. [Google Scholar]
  45. Kuznetsova, A.; Brockhoff, P.B.; Christensen, R.H. lmerTest package: Tests in linear mixed effects models. J. Stat. Softw. 2017, 82, 1–26. [Google Scholar] [CrossRef]
  46. R Core Team. R: A Language and Environment for Statistical Computing. R Foundation for Statistical Computing; R Core Team: Vienna, Austria, 2013. [Google Scholar]
  47. Harrell, F.E. Hmisc: Harrell Miscellaneous; R package Version 4.0-1; with contributions from Charles Dupont and many others (2017); CRAN-R: Vienna, Austria, 2020. [Google Scholar] [CrossRef]
  48. Lê, S.; Josse, J.; Husson, F. FactoMineR: An R package for multivariate analysis. J. Stat. Softw. 2008, 25, 1–18. [Google Scholar] [CrossRef]
  49. Oksanen, J.; Kindt, R.; Legendre, P.; O’Hara, B.; Stevens, M.H.H.; Oksanen, M.J.; Suggests, M.A.S.S. The vegan package. Community Ecol. Package 2007, 10, 719. [Google Scholar]
  50. Barros, C.F.A. Diversidade e Ecologia do Fitoplâncton em 18 Lagoas Naturais do Médio Rio Doce. Doctoral Dissertation, Universidade Federal de Minas Gerais, Belo Horizonte, Brazil, 2010. [Google Scholar]
  51. de J Magalhães, A.A.; da Luz, L.D.; de Aguiar Junior, T.R. Environmental factors driving the dominance of the harmful bloom-forming cyanobacteria Microcystis and Aphanocapsa in a tropical water supply reservoir. Water Environ. Res. 2019, 91, 1466–1478. [Google Scholar] [CrossRef] [PubMed]
  52. Calijuri, M.D.C.; Dos Santos, A.C.A.; Jati, S. Temporal changes in the phytoplankton community structure in a tropical and eutrophic reservoir (Barra Bonita, SP—Brazil). J. Plankton Res. 2002, 24, 617–634. [Google Scholar] [CrossRef]
  53. Soares, M.C.S.; Rocha, M.I.D.A.; Marinho, M.M.; Azevedo, S.M.; Branco, C.W.; Huszar, V.L. Changes in species composition during annual cyanobacterial dominance in a tropical reservoir: Physical factors, nutrients and grazing effects. Aquat. Microb. Ecol. 2009, 57, 137–149. [Google Scholar] [CrossRef]
  54. Reynolds, C.S. Non-determinism to probability, or N: P in the community ecology of phytoplankton. Arch. Für Hydrobiol. 1999, 146, 23–35. [Google Scholar] [CrossRef]
  55. Padisák, J.; Crossetti, L.O.; Naselli-Flores, L. Use and misuse in the application of the phytoplankton functional classification: A critical review with updates. Hydrobiologia 2009, 621, 1–19. [Google Scholar] [CrossRef]
  56. Reynolds, C.S. Variability in the provision and function of mucilage in phytoplankton: Facultative responses to the environment. Hydrobiologia 2007, 578, 37–45. [Google Scholar] [CrossRef]
  57. Krichen, E.; Rapaport, A.; Le Floc’h, E.; Fouilland, E. Demonstration of facilitation between microalgae to face environmental stress. Sci. Rep. 2019, 9, 16076. [Google Scholar] [CrossRef]
  58. Bittencourt-Oliveira, M.D.C.; Moura, A.D.N.; De Oliveira, M.C.; Massola, N.S., Jr. Geitlerinema species (Oscillatoriales, Cyanobacteria) revealed by cellular morphology, ultrastructure, and DNA sequencing (1). J. Phycol. 2009, 45, 716–725. [Google Scholar] [CrossRef]
  59. Tranvik, L.J. Bacterioplankton growth on fractions of dissolved organic carbon of different molecular weights from humic and clear waters. Appl. Environ. Microbiol. 1990, 56, 1672–1677. [Google Scholar] [CrossRef] [PubMed]
  60. Zhou, Q.; Wang, W.; Huang, L.; Zhang, Y.; Qin, J.; Li, K.; Chen, L. Spatial and temporal variability in water transparency in Yunnan Plateau lakes, China. Aquat. Sci. 2019, 81, 36. [Google Scholar] [CrossRef]
  61. Brighenti, L.S.; Staehr, P.A.; Brandão, L.P.M.; Barbosa, F.A.; Bezerra-Neto, J.F. Importance of nutrients, organic matter and light availability on epilimnetic metabolic rates in a mesotrophic tropical lake. Freshw. Biol. 2018, 63, 1143–1160. [Google Scholar] [CrossRef]
  62. Faria, G.R.; Paes, C.R.P.S.; Castro, D.J.F.A.; Tinoco, N.A.; Barbarino, E.; Lourenço, S.O. Effects of the availability of CO2 on growth, nutrient uptake, and chemical composition of the marine microalgae Chlorella sp. and Nannochloropsis oculata, two potentially useful strains for biofuel production. Int. Res. J. Biotechnol. 2012, 3, 65–75. [Google Scholar]
  63. Heredia-Arroyo, T.; Wei, W.; Ruan, R.; Hu, B. Mixotrophic cultivation of Chlorella vulgaris and its potential application for the oil accumulation from non-sugar materials. Biomass Bioenergy 2011, 35, 2245–2253. [Google Scholar] [CrossRef]
  64. Rosa, A.P.C.D.; Moraes, L.; Morais, E.G.D.; Costa, J.A.V. Fatty Acid Biosynthesis from Chlorella in Autotrophic and Mixotrophic Cultivation. Braz. Arch. Biol. Technol. 2020, 63, e20180534. [Google Scholar] [CrossRef]
  65. Jansson, M.; Bergström, A.K.; Blomqvist, P.; Drakare, S. Allochthonous organic carbon and phytoplankton/bacterioplankton production relationships in lakes. Ecology 2000, 81, 3250–3255. [Google Scholar] [CrossRef]
  66. Rodríguez, M.P.; Matsumura-Tundisi, T. Variation of density, species composition and dominance of rotifers at a shallow tropical reservoir (Broa Reservoir, SP, Brazil) in a short scale time. Rev. Bras. Biol. 2000, 60, 01–09. [Google Scholar] [CrossRef]
  67. Gilbert, J.J.; Bogdan, K.G. 5. Rotifer Grazing. Trophic Interact. Within Aquat. Ecosyst. 1984, 85, 97. [Google Scholar]
  68. Schmid-Araya, J.M.; Schmid, P.E. Trophic relationships: Integrating meiofauna into a realistic benthic food web. Freshw. Biol. 2000, 44, 149–163. [Google Scholar] [CrossRef]
  69. Porter, K.G. Integrating the microbial loop and the classic food chain into a realistic planktonic food web. In Food Webs; Springer: Boston, MA, USA, 1996; pp. 51–59. [Google Scholar]
  70. Hambright, K.D.; Zohary, T.; Güde, H. Microzooplankton dominate carbon flow and nutrient cycling in a warm subtropical freshwater lake. Limnol. Oceanogr. 2007, 52, 1018–1025. [Google Scholar] [CrossRef]
  71. Perbiche-Neves, G.; Serafim-Júnior, M.; Ghidini, A.R.; Brito, L.D. Spatial and temporal distribution of Copepoda (Cyclopoida and Calanoida) of an eutrophic reservoir in the basin of upper Iguaçu River, Paraná, Brazil. Acta Limnol. Bras. 2007, 19, 393–406. [Google Scholar]
  72. Fontanarrosa, M.S.; Chaparro, G.; de Tezanos Pinto, P.; Rodriguez, P.; O’Farrell, I. Zooplankton response to shading effects of free-floating plants in shallow warm temperate lakes: A field mesocosm experiment. Hydrobiologia 2010, 646, 231–242. [Google Scholar] [CrossRef]
  73. Gannon, J.E.; Stemberger, R.S. Zooplankton (especially crustaceans and rotifers) as indicators of water quality. Trans. Am. Microsc. Soc. 1978, 16–35. [Google Scholar] [CrossRef]
  74. Work, K.A.; Havens, K.E. Zooplankton grazing on bacteria and cyanobacteria in a eutrophic lake. J. Plankton Res. 2003, 25, 1301–1306. [Google Scholar] [CrossRef]
  75. Yoshida, T.; Hairston, N.G., Jr.; Ellner, S.P. Evolutionary trade–off between defence against grazing and competitive ability in a simple unicellular alga, Chlorella vulgaris. Proc. R. Soc. London. Ser. B Biol. Sci. 2004, 271, 1947–1953. [Google Scholar] [CrossRef] [PubMed]
  76. Stanković, N.; Kostić, I.; Jovanović, B.; Savić-Zdravković, D.; Matić, S.; Bašić, J.; Cvetković, T.; Simeunović, J.; Milošević, D. Can phytoplankton blooming be harmful to benthic organisms? The toxic influence of Anabaena sp. and Chlorella sp. on Chironomus riparius larvae. Sci. Total Environ. 2020, 729, 138666. [Google Scholar] [CrossRef]
  77. Reynolds, C.S. Hydrodynamics and mixing in lakes, reservoirs, wetlands and rivers. In Biogeochemistry of Inland Waters: A Derivative of Encyclopedia of Inland Waters; Cary Institute of Ecosystem Studies: Millbrook, NY, USA, 2009. [Google Scholar]
  78. Antunes, D.A.; Cupolillo, F. Análise do balanço hídrico climatológico decendial do Parque Estadual do Rio Doce—PERD e entorno: Climatologia de 2005–2015 comparada com o ano anômalo 2013–2014. Rev. Bras. Climatol. 2018, 1. [Google Scholar] [CrossRef]
  79. Wantzen, K.M.; Yule, C.M.; Mathooko, J.M.; Pringle, C.M. Organic matter processing in tropical streams. In Tropical Stream Ecology; Academic Press: New York, NY, USA, 2008; pp. 43–64. [Google Scholar]
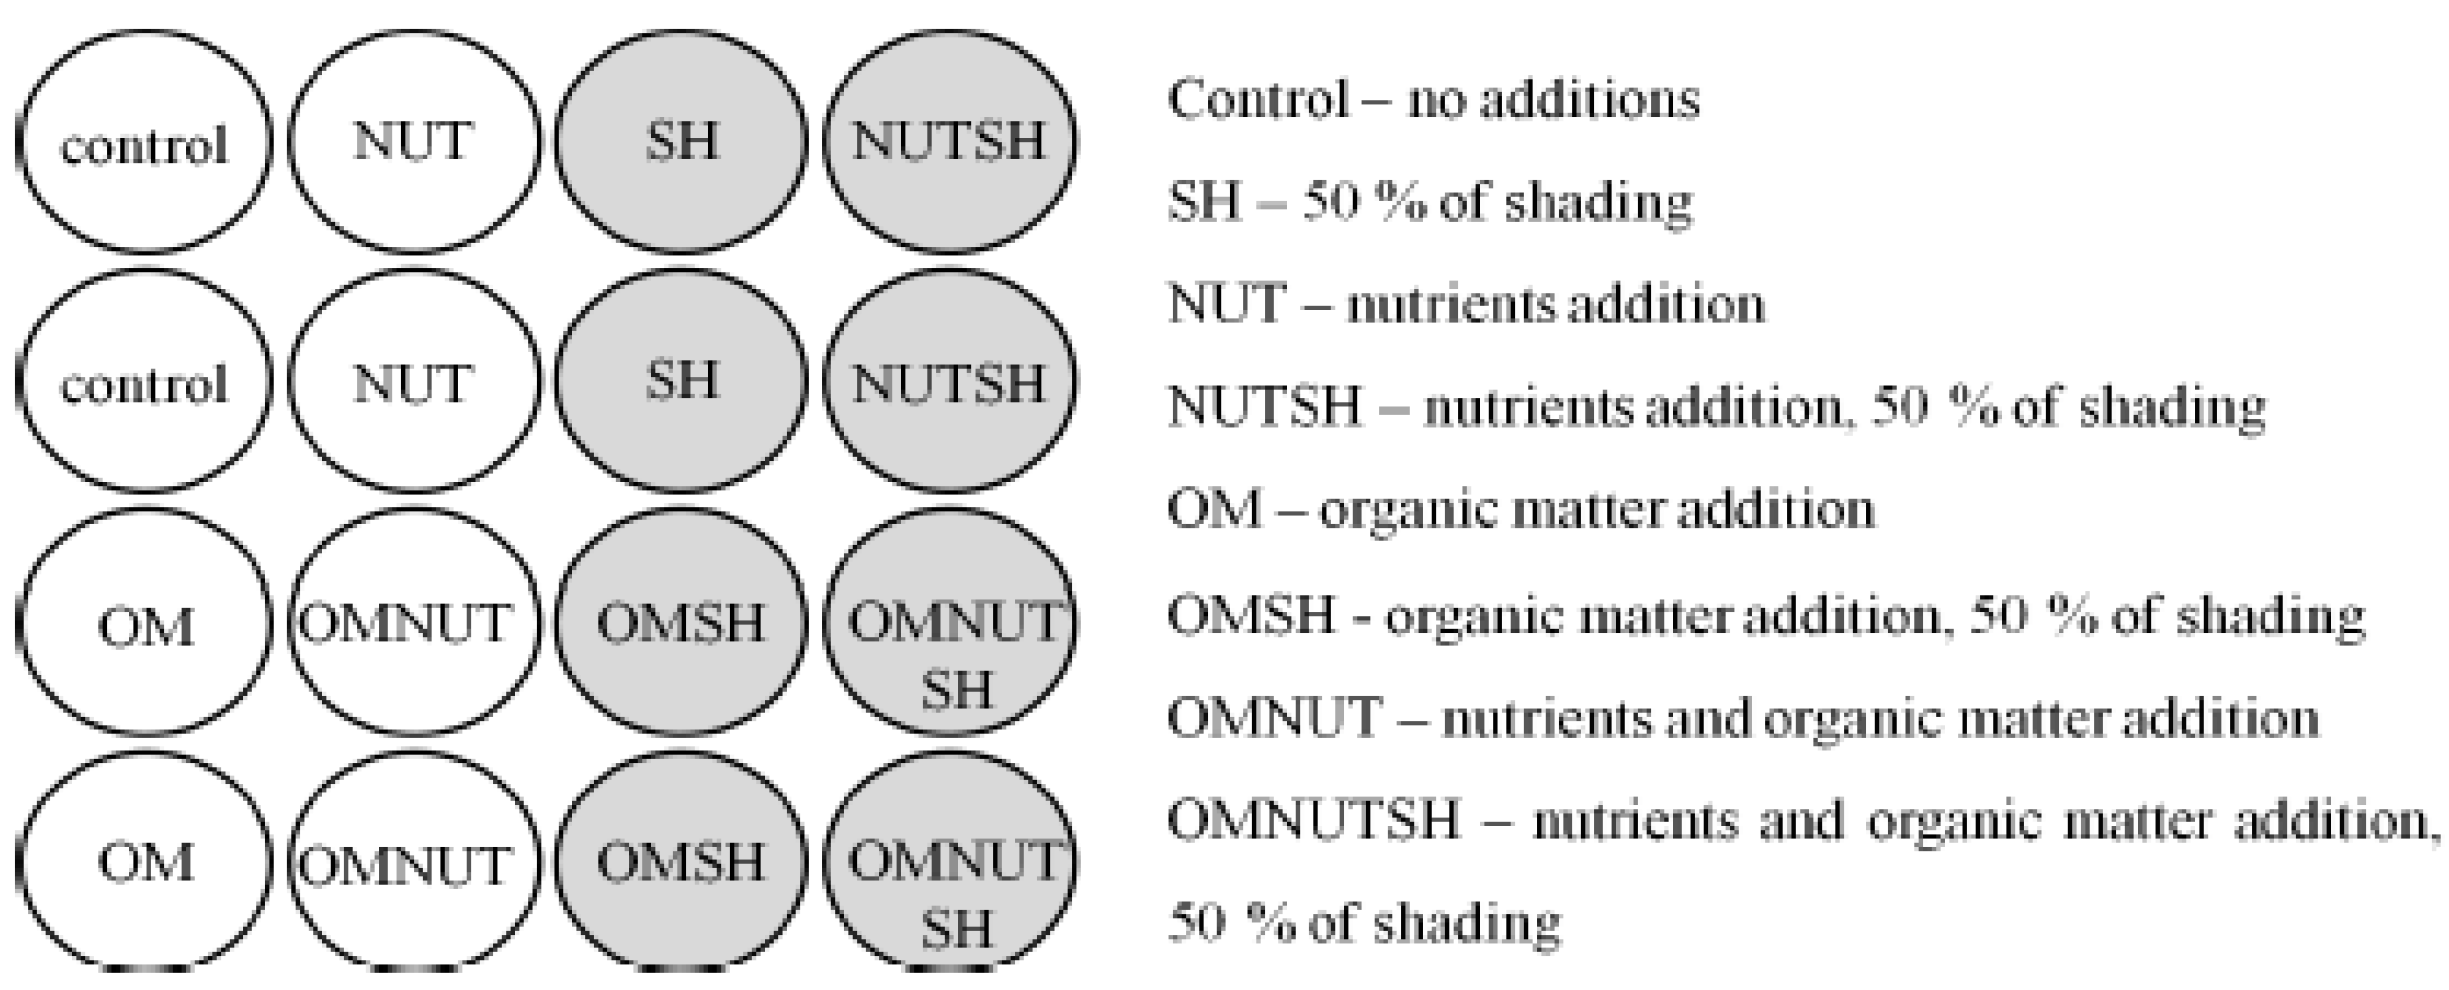
Figure 1. Schematic figure of the factorial design of the mesocosms experiment. (Source: [36]).
Limnolrev 25 00016 g001
Figure 2. Temporal variation of different treatments from mesocosms to the phytoplanktonic community. Central line: median, 25% to 75% percentile; 95% of confidence interval. Black circles: outliers. (2-column fitting image). Each box represents a treatment over the days of the experiment and how the main groups of phytoplankton Chlorophyceae and Cyanobacteria behaved over time.
Limnolrev 25 00016 g002
Figure 3. Temporal variation of different treatments from mesocosms to the zooplanktonic community. Central line: median, 25% to 75% percentile; 95% of confidence interval. Black circles: outliers. (2-column fitting image). Each box represents a treatment over the days of the experiment and how the main groups of zooplankton Cladocera, Copepoda and Rotifera behaved over time.
Limnolrev 25 00016 g003
Figure 4. Variation of main groups on phytoplankton (a) and zooplankton (b) in different treatments of mesocosms. Central line: median, 25% to 75% percentile; 95% of confidence interval. Black circles: outliers. (1.5-column fitting image).
Limnolrev 25 00016 g004
Figure 5. The first two principal components obtained through a PCA. The circles represent the space in which the points for each treatment are distributed along the axes. Shading treatment was disregarded to observe the effect of nutrient enrichment on variables. The data were analyzed in the following units of measurements: TN, total nitrogen (μM); TP, total phosphorus (μM); KdPAR, attenuation of photosynthetically active radiation (m−1); KdUV, attenuation of ultraviolet radiation (m−1); DOC, dissolved organic carbon (mg L−1); Rot, Rotifera density (Org L−1); Clad, Cladocera density (Org L−1); Cop, Copepoda density (Org L−1); Cyano, Cyanobacteria density (Org mL−1); Chloro, Chlorophyceae density (Org mL−1); Bact, bacteria density (org. mL−1). (1.5-column fitting image).
Limnolrev 25 00016 g005
Table 1. Variance analysis of linear mixed-effects models testing different factors effects and their interaction with planktonic communities on mesocosms experiment. The random effect utilized for each model was sampling days. C: Carbon (organic matter added); N: nutrient addition; and SH: shading addition. Statistical significance corresponds to p < 0.05 (* p < 0.05; ** p < 0.01; *** p < 0.001).
Random Effects Sources of Variation DF Sum Sq F Value p-Value
log(sumphyto) 1|~daysC11.904.000.05
N147.4199.66 ***0.00
SH10.290.600.45
C:N10.531.120.30
C:SH10.290.610.44
N:SH10.040.080.78
C:N:SH10.000.000.99
log(Chlorophyceae) 1|~daysC19.9113.76 ***0.00
N198.68137.02 ***0.00
SH10.811.120.30
C:N10.170.240.63
C:SH10.360.500.49
N:SH10.040.050.82
C:N:SH10.280.390.54
log(Cyanobacteria) 1|~daysC10.110.380.54
N112.5042.63 ***0.00
SH10.170.570.45
C:N10.341.150.29
C:SH11.725.88 *0.02
N:SH10.050.170.68
C:N:SH10.351.200.28
log(sumzoo) 1|~daysC11.835.03 *0.03
N12.506.85 *0.01
SH11.092.990.09
C:N10.671.850.18
C:SH10.160.440.51
N:SH11.193.270.08
C:N:SH10.050.130.73
log(Rotifera) 1|~daysC12.526.70 *0.01
N15.0413.41 ***0.00
SH11.153.070.09
C:N11.383.680.06
C:SH10.391.050.31
N:SH12.657.07 *0.01
C:N:SH10.010.020.90
Copepoda 1|~daysC119,444.784.010.05
N138,936.728.02 **0.01
SH119,711.364.060.05
C:N15648.511.160.29
C:SH15218.751.080.31
N:SH122.280.000.95
C:N:SH12306.030.480.50
Cladocera 1|~daysC12658.160.850.79
N12405.500.770.41
SH11559.520.500.85
C:N11561.800.500.58
C:SH11559.520.500.79
N:SH1386.470.120.86
C:N:SH1750.500.240.47
Table 2. Spearman correlation between environmental variables and planktonic communities.
Rot Clad Cop Cyano Chloro Bact SumPhyto SumZoo
TN 0.43 ** 0.59 ***0.58 ***0.53 ***0.62 ***0.41 **
TP 0.38 ** −0.32 *0.57 ***0.54 ***0.50 ***0.59 ***0.34 *
Chl-a 0.47 *** 0.40 **0.61 ***0.66 ***0.64 ***0.41 **
KdPAR 0.38 **0.57 ***0.42 ** 0.41 ** 0.43 **
KdUV 0.31 *0.46 ***0.36 * 0.51 *** 0.36 *
DOC 0.59 ***0.37 *0.59 ***
Rot 0.35 * 0.62 *** 0.97 ***
Clad 0.48 *** 0.38 ** 0.47 ***
Cop −0.50 *** −0.51 ***0.35 *
Only significant correlation (p < 0.05) was shown. The data were analyzed in the following units of measurements: TN, total nitrogen (μM); TP, total phosphorus (μM); Chl-a, chlorophyll-a (μg L−1); KdPAR, attenuation of photosynthetically active radiation (m−1); KdUV, attenuation of ultraviolet radiation (m−1); DOC, dissolved organic carbon (mg L−1); Rot, Rotifera density (Org L−1); Clad, Cladocera density (Org L−1); Cop, Copepoda density (Org L−1); Cyano, Cyanobacteria density (Org mL−1); Chloro, Chlorophyceae density (Org mL−1); SumPhyto, the sum of phytoplanktonic organisms (Org mL−1), SumZoo, the sum of zooplanktonic organisms ((Org L−1) and Bact, bacteria density (Org mL−1). * p < 0.05; ** p < 0.01; *** p < 0.001.
Disclaimer/Publisher’s Note: The statements, opinions and data contained in all publications are solely those of the individual author(s) and contributor(s) and not of MDPI and/or the editor(s). MDPI and/or the editor(s) disclaim responsibility for any injury to people or property resulting from any ideas, methods, instructions or products referred to in the content.