Abstract
Nitrate (NO3−) is a vulnerable natural contaminant that can be found in groundwater. The estimated nitrate concentrations for four categories of wells in the northeastern arid regions of Saudi Arabia—commercial treated water stations for drinking, commercial stations of untreated water for domestic uses, private wells of residences for households, and private wells for agricultural uses—were found to be in the 16–380 mg/L range. Drinking water from all commercial treated water stations has lower nitrate levels, based on the WHO standard of 50 mg/L. In contrast, almost 33% of commercial stations with untreated water (used only for domestic purposes) in the studied areas had higher nitrate levels that were unsuitable for drinking. Approximately half of the private wells of residences and wells for agricultural uses had very high nitrate levels. They can be considered unsuitable for drinking due to excessive levels of nitrates but can be used for domestic and agricultural purposes. Thus, adopting specific strategies to reduce nitrate levels in public wells in the studied areas is crucial. The data obtained in the present study are essential for equipping decision-makers with valuable insights, allowing them to enact appropriate measures, as needed, and uphold community health in the studied regions.
1. Introduction
Nitrate (NO3−) is a highly soluble natural compound in groundwater [1,2]. Nitrate can also result from human activities such as agriculture, where fertilizers containing nitrogen are commonly used. An increase in nitrate concentration in groundwater can cause adverse health effects. Although nitrate is less harmful, it can be converted to nitrite (NO2−) in the oral cavity [3]. Nitrite can then react with other substances in the body to form compounds that may pose health risks. Of particular concern is the potential formation of nitrosamines, which are known to have carcinogenic properties. Higher levels of nitrates in drinking water are linked to congenital disabilities, blood disorders, complications during pregnancy, and methemoglobinemia [4,5,6]. A weak association was found with thyroid gland function [7]. However, various international organizations have set higher levels of nitrates in drinking water. The nitrate concentration recommended by the United States Environmental Protection Agency (USEPA) is 10 mg/L for nitrogen (N), while the World Health Organization (WHO) suggests a maximum acceptable level of 50 mg/L. The USEPA guideline is intended to protect against methemoglobinemia, alternatively referred to as “blue baby syndrome”, a medical condition in which nitrate in drinking water can potentially diminish the blood’s ability to carry oxygen in infants under six months old.
The nitrate level in rainwater is within an acceptable range, approximately 8 mg/L in the searched areas. Concentrations are supposed to be lower in rural areas [8] but can reach as high as several hundred milligrams per liter due to agricultural runoff, refuse dump runoff, or contamination with human or animal wastes [9]. For example, levels reaching 1500 mg/L were detected in groundwater within an agricultural region of India [10]. In Denmark and the Netherlands, nitrate concentrations are increasing by 0.2–1.3 mg/L per year in some areas [9]. In contrast, in the United States, nitrate concentrations do not usually exceed 4–9 mg/L [11,12,13]. The variation in nitrate levels might depend on climate, groundwater age, soil type, nitrogen sources, geochemistry, and the land surface area covered by the wells [14]. Nonetheless, potential sources for elevating nitrate contamination in groundwater include agricultural practices (use of inorganic fertilizers, organic nitrate from livestock manures), discharge of wastewater, industrial waste, operations related to animal breeding, leachate from landfills, organic nitrogen in the soil, and the deposition of nitrogen oxide compounds from the atmosphere [15,16].
Recently, many agricultural and industrial plants have been grown in the arid northeast regions of searched areas. Therefore, studies should be performed on nitrate concentrations to manage groundwater resources. Due to severe water shortages and the high consumption of chemical fertilizers and pesticides, it is important to investigate the nitrate status of these water sources. Many investigations have been conducted in different areas of Saudi Arabia, but only a few studies have been conducted on groundwater in the northeast arid region. For example, the nitrate concentration ranged from 5.5 to 98.2 mg/L, with an average value of 39.3 mg/L for the Wasia aquifer of the Al Kharj area, central Saudi Arabia [17]. Elevated nitrate levels were found primarily for agricultural activities, such as using fertilizers and animal waste. Al-Bassam [18,19] found high nitrate levels in most of the wells, making them potentially harmful to human health. Further investigations are recommended to identify the sources of these contaminants and develop appropriate strategies for their management and mitigation. A study by Alharbi [20] examined the impact of climate change on water resources in the same area. The researchers used historical data on temperature, precipitation, and groundwater levels to create a groundwater flow model that could simulate different climate change scenarios. This study revealed that climate change could decrease groundwater recharge and increase evapotranspiration, reducing groundwater availability in the future.
Various methods are utilized to quantify nitrate levels in water samples, including colorimetric techniques, ion-selective electrode measurements, UV spectrophotometry, HPLC, mass spectrometry, continuous flow analyzers, and titration. These methods offer diverse approaches for accurate and efficient assessment of nitrate concentrations, catering to different needs in terms of sensitivity, precision, cost, and sample volume. Isotopic analyses, specifically δ15N-NO3− and δ18O-NO3−, trace the origins of nitrate contamination and assess its environmental implications [21]. The isotopic signatures of nitrate pollutants provide insights into effective management strategies for mitigating nitrate pollution, such as targeted agricultural practices, improved wastewater treatment, and land use planning measures. The findings underscore the importance of utilizing isotopic approaches to address nitrate pollution and safeguard water quality in surface and groundwater systems. Another study employed spatial data and machine learning algorithms to analyze groundwater nitrate levels and various environmental factors, such as land use, soil types, and proximity to potential pollution sources, which enabled the development of accurate predictive models for estimating nitrate concentrations across different locations [22].
However, in the present study, a classical method was used where the nitrate ions were converted to nitrite ions by reacting them in an acidic solution. The resulting nitrite ions were then detected using colorimetric techniques, where a reagent was added to form a colored dye. The intensity of the color produced is proportional to the concentration of nitrite ions, which indirectly reflects the nitrate concentration in the original groundwater sample. This method is widely used due to its simplicity, cost-effectiveness, and reliability for routine analysis of nitrate in groundwater samples.
Our previous studies evaluated the radon and tritium exposure levels in groundwater and assessed their health risks [23,24]. Evaluating nitrate is crucial for determining the safety of these water sources for drinking purposes. This research focused on examining the nitrate levels in groundwater wells located in the northeastern arid regions of Saudi Arabia. Additionally, this study aimed to identify various factors influencing nitrate levels. Such comprehensive data are vital for providing decision-makers with valuable information, enabling them to implement appropriate interventions, when necessary, and safeguard community health in the studied regions. To our knowledge, this investigation is the first attempt in northeast Saudi Arabia.
2. Materials and Methods
2.1. Geology of the Study Areas
Hafr Al Batin is located between 28°26′3″ N and 45°57′49″ E (Figure 1). The dry valley of Wadi Al Batin, part of the more extensive valley of Wadi Al Rummah (the largest and longest dry river in the Arabian Peninsula), measures approximately 2000 km [20,25,26]. Hence, the valley is called Hafr Al Batin (Al Batin Valley) [20]. Winter evening temperatures decrease to 2 to 8 °C, while summer days are dry and hot (40 to 50 °C). In winter, rainfall is infrequent, and rain is typically absent in the summer. The hydrogeology of Hafr Al Batin is characterized by its complex geological formations and aquifer systems, which play a critical role in sustaining water resources in the region. Hafr Al Batin benefits from several aquifers, including the Eastern Arabian Aquifer System. These aquifers are primarily composed of sedimentary rocks with varying degrees of permeability and hydraulic conductivity. Groundwater recharge in Hafr Al Batin primarily occurs through infiltration from precipitation and surface water sources. However, the region’s arid climate and limited rainfall pose challenges to groundwater replenishment. Human activities, such as agriculture and urbanization, also impact the hydrogeology of Hafr Al Batin, leading to groundwater depletion and contamination issues in some areas. Sustainable management of groundwater resources is essential to ensure the long-term availability and quality of water for various purposes, including drinking water supply, irrigation, and industrial use, in Hafr Al Batin and its surrounding areas Thybiyah and Qaisumah.
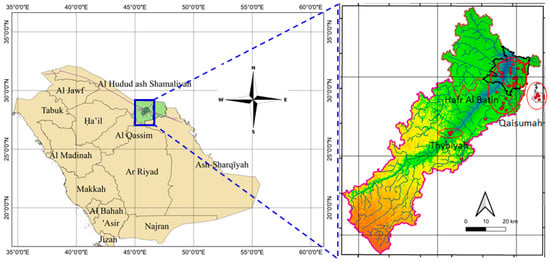
Figure 1.
Location of the monitoring groundwater wells in the northeast arid regions of Saudi Arabia.
Due to the diverse geological settings, the northeast regions have high-quality water [27]. The principal aquifers are based on primary and secondary groups, as Vincent and Alsharhan suggested. The Wadi system comprises several primary-origin aquifers, including Quaternary sands, quartz sandstones, and conglomerates with primary porosity, as well as calcarenite, coquinite, and oolitic limestone with secondary porosity [27,28]. Deep wells in the Quaternary sand aquifer of Hafr Al Batin generally provide water better than shallow wells.
2.2. Samples
Groundwater samples from 45 different wells in the four categories were collected. Among them, thirteen deep wells are used as commercial treated water stations for drinking, three shallow wells are used as commercial stations of untreated water for domestic uses, twenty-six private shallow wells are used for residences for household use, and three private shallow wells are used for agricultural and garden uses. Groundwater samples were collected from various locations across the three regions, and their respective information, longitudes, and latitudes were documented using a GPS device. The water samples were collected directly from the monitoring wells and promptly stored in sealed glass bottles. Measurements were typically conducted within a week of sample collection to ensure accuracy.
In this study, two standard samples from Horiba, Kyoto, Japan containing nitrate concentrations of 150 mg/L and 2000 mg/L, respectively, were used. The standard solution was diluted to create reference samples, resulting in five more samples. These reference samples played a critical role in calibrating and validating the analytical methods used in this study. The nitrate concentration in each reference sample was determined by considering the dilution factor. This determination relied on knowing the dilution factor and concentration of the original standard solution. These reference samples, which had varying nitrate concentrations, served the purposes of calibration and quality control. They provided a known range of nitrate levels, allowing for accurate measurements and comparisons with other samples whose nitrate concentrations were unknown.
2.3. Nitrate Measurements Using a Colorimetric Method
The nitrate concentration in the groundwater samples was measured using a colorimetric procedure with a YSI 9500 photometer (YSI, Yellow Springs, OH, USA). In this procedure, nitrate is first converted to nitrite and used in a diazonium reaction to produce a reddish dye. The reduction step was performed by applying a special zinc-based Nitratest powder and Nitratest tablet, facilitating rapid flocculation after one minute of contact. A unique Nitratest tube was used for the test; it is a graded sample container with a hopper bottom to aid in sample accomplishment and decanting. In the presence of N-(1-naphthyl)-ethylene diamine, SAA reacts with the nitrite remaining after the reduction stage to create a crimson color. Finally, a Nitricol tablet containing the reagents was added to the test solution. The absorbance of the red dye was measured at a certain web length using a photometer by diluting 10 mL of water and then comparing it with the absorbance of the blank sample of distilled water.
A YSI 9500 photometer (Ohio, USA) is a device designed to measure the intensity of colors. Light passes through Palintest™ glass test tubes of a photometer (PT595/5, Fisher Scientific, Loughborough, UK) containing the sample solution, which is filtered and detected using a photodetector (Figure 2). The automatic choice of filters allows specific wavelengths of light to pass through. In the case of a colorless solution, the sample is transparent to light. However, colored samples absorb light, decreasing the amount of light passing through the sample. In the present investigations, a photometer was used to detect the color produced when chemical reagents reacted with a water sample. The intensity of the color decreased as the concentration of nitrate increased. The photometer was equipped with preprogrammed calibrations for each test. It runs several methods at different wavelengths to maximize the sensitivity. The device automatically selects the appropriate wavelength and requires a unique program number to access the calibrations at the start of each test operation. The photometer chooses the correct wavelength filter and converts the photodiode response into a concentration value. The instrument directly reads and displays the test results.
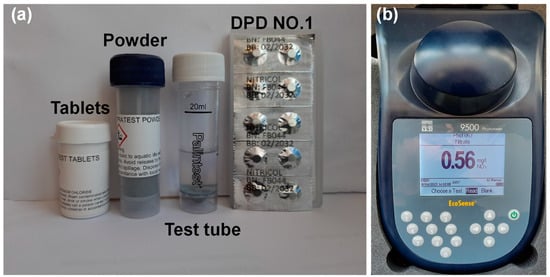
Figure 2.
Materials used for nitrate measurement: (a) Nitratest tablet, powder, and DPD tablets and (b) YSI 9500 photometer.
The photometer is versatile and well-suited for various analytical tasks. It can be used as a general-purpose analytical tool and as a laboratory or field photometer with user-generated calibration graphs for standard analytical techniques or for comparing colored solutions. It offers the option to perform transmittance (test program 0) or absorbance (test program 1) for common analytical purposes. Figure 3 shows a schematic diagram of measuring the nitrate concentration in the groundwater sample using the photometric method. Here, it is important to note that we generally used the full volume (20 mL) of water samples in the “Palintest tube” to analyze the nitrate levels in groundwater samples. There is a limitation in the detection ability of the photometer, but the original water sample can be diluted with DI water. By doing so, one can multiply the data obtained by the photometer with the corresponding dilution factor to accurately assess the nitrate levels. Hence, this provides is a flexible approach wherein one can use a range of water volumes, varying from 20 mL down to 1 mL, and dilute them with DI water, as needed. This strategy ensures that one can effectively analyze both low and high nitrate concentration samples while maintaining accuracy in the measurements.

Figure 3.
A schematic diagram for measuring the nitrate concentration using a photometric analysis technique.
3. Results and Discussion
3.1. Nitrate Concentrations as a Function of Reaction Time
During the nitrate measurement procedure, the nitrate concentration (immediately following the crushing of the Nitracol tablet) may change over time—a critical factor in colorimetric analysis, particularly in evaluating water quality and environmental monitoring. The correlation elucidates the progression of nitrate levels in a solution through the Nitratest method. Figure 4 shows the nitrate concentration as a function of time immediately after the addition and crushing of the Nitrocol tablet.
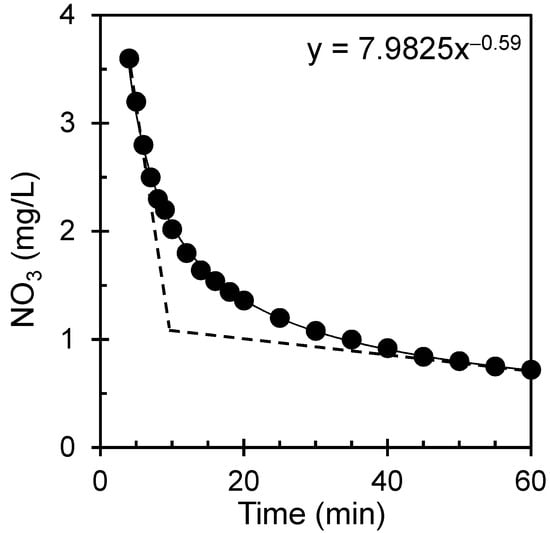
Figure 4.
The nitrate concentration as a function of time due to the chemical reaction in the Nitratest method for a standard solution (150 mg/L) with a dilution factor of 0.3.
The curve illustrates a power law relationship, signifying the diminishing nitrate concentration over time. The nitrate concentration undergoes a notable reduction in one hour, reaching approximately 20% of its initial value. This signifies a substantial decline in nitrate ion concentration within a relatively brief period. The graph also demonstrates a point in the colorimetric reaction where the color change stabilizes or reaches a plateau, indicating the reaction’s endpoint. Beyond this point, additional reaction time did not significantly alter the color. The intensity of the color at this plateau is directly proportional to the nitrate concentration in the sample. The anticipated time to reach this plateau is approximately 10 min. Unlike exponential decay, where the rate of change is proportional to the current concentration, power-law decay involves a more intricate relationship between time and concentration. The outcomes suggest that the reduction process follows complex kinetics, potentially influenced by reaction mechanisms, reactant concentrations, and environmental conditions, deviating from a simple exponential decay model. One should wait at least 10 min to reach a plateau after adding a Nitracol tablet.
3.2. Nitrate Concentration Dependence on Dilution
The dilution ratio, often expressed as a fraction or ratio, indicates the relationship between the volume of a solute (the substance being dissolved) and the volume of the solvent (the substance in which the solute is dissolved) used to create a diluted solution. In the present study, two standard nitrate solutions (150 mg/L and 2000 mg/L) were diluted with distilled water, and the resulting concentrations were measured using a Horiba nitrate meter. The concentrations corresponding to different dilution ratios are depicted in Figure 5.
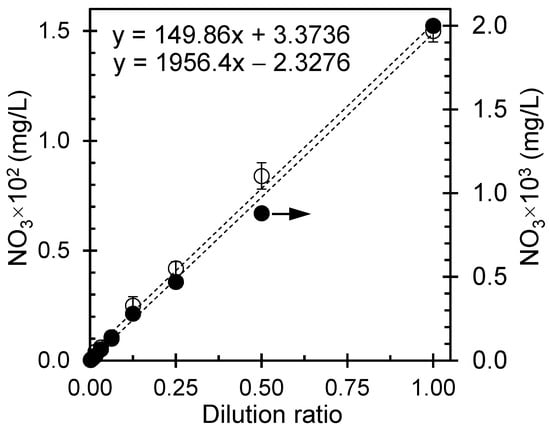
Figure 5.
Nitrate concentration with dilution ratios for reference samples prepared from standard nitrate solutions of 150 mg/L (open symbols, primary axis) and 2000 mg/L (solid symbol, secondary axis).
The direct correlation between the nitrate concentration and dilution ratio implies a consistent and predictable decrease in nitrate concentration as the solution undergoes successive dilution by adding water. Mathematically, the linear relationship between the nitrate concentration (C) and dilution ratio (DR) can be expressed as:
where C1 is the initial concentration, DR is the dilution ratio, and C2 is the final concentration. The equation demonstrates the direct proportionality between a diluted solution’s initial and final concentrations. As the dilution factor increases, C2 decreases linearly, and the slope shows the real nitrate concentration. The practical significance of this linear association between the nitrate concentration and dilution ratio has become evident in diverse applications. For example, in water quality assessment, it becomes imperative to dilute water samples when their nitrate concentrations surpass the measurement capabilities of analytical instruments. This linear relation facilitates the precise determination of nitrate concentrations within the detection limits of the instrumentation used.
C1 × DR = C2
3.3. Nitrate Concentrations in Reference Samples
A reference solution with a known nitrate concentration was prepared through a two-step dilution process using standard solutions from Horiba, Japan (150 mg/L and 2000 mg/L). In the first step, a precise 150 mg/L nitrate standard solution was taken and diluted with an appropriate solvent to achieve a 75.00 mg/L intermediate standard solution. Great care was taken to ensure accurate measurement and thorough mixing of the solutions to maintain precision and minimize errors in the dilution process. Subsequently, the intermediate standard solution underwent a second dilution step to produce a series of standard solutions with varying concentrations. For simplicity, the concentrations for this series were chosen with a half factor. This meticulous process was repeated for each concentration in the series, ensuring the consistency and accuracy of the method. The outcome was a set of reference solutions with known nitrate concentrations, which served as reference samples to calibrate the analysis. The prepared series of reference solutions covered a spectrum of concentrations, enabling precise determination of the nitrate levels in the unknown samples through calibration curves.
The computed nitrate concentration was calculated mathematically by considering the dilution factor. Conversely, experimental methods or specialized instruments can directly measure nitrate concentrations. Notably, the calculated and measured nitrate concentrations exhibit almost unique values, as shown in Figure 6 for standard samples, indicating significant agreement between the values derived from these two distinct approaches. These findings highlight the importance of precise calibration and accuracy in measurement and calculation techniques to achieve accurate results.
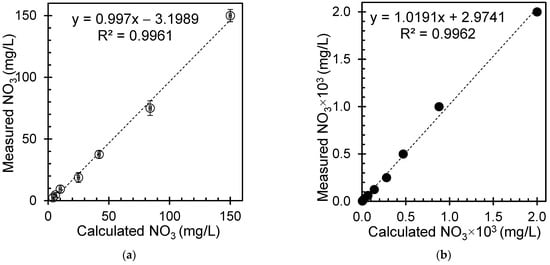
Figure 6.
Calculated and measured nitrate concentrations for reference samples prepared from standard nitrate solutions of (a) 150 mg/L (open symbols) and (b) 2000 mg/L (solid symbols).
3.4. Nitrate in Groundwater Samples
Nitrate levels were measured in 45 water samples collected from different wells in northeastern Saudi Arabia. Table 1 shows the nitrate concentrations in the searched areas according to well type, purpose, and process type. The findings revealed that the nitrate concentration in the commercial water stations (drinking water) before treatment ranged from 33 mg/L to 49 mg/L, averaging 41.7 mg/L. In contrast, after treatment, they ranged from 16 mg/L to 43 mg/L, with an average of 23 mg/L. These treated stations followed the World Health Organization (WHO) recommended values (>50 mg/L) for nitrate concentrations, even before treatment. All commercially treated water stations use deep well water, and the treated water stations are known to provide good-quality water for several reasons. First, these stations employ advanced water treatment processes that effectively remove impurities, contaminants, and pathogens from the water. Techniques such as filtration, disinfection, and chemical treatment are commonly used to eliminate harmful substances and ensure water is safe for consumption. Additionally, treated water stations typically adhere to strict quality control measures and regulatory standards set by relevant authorities. The water quality is regularly tested and monitored to ensure it met or exceeded the established guidelines. This helps to maintain the overall purity and safety of the water supplied by these stations. Moreover, treated water stations often source their water from reliable and well-protected sources such as reservoirs, groundwater, or surface water bodies. These sources are selected based on their initial water quality and potential for effective treatment. Furthermore, trained and skilled professionals operate and maintain treated water stations, ensuring that the water treatment processes are carried out accurately and efficiently. Overall, a combination of advanced treatment processes, stringent quality control measures, reliable water sources, and competent operation and maintenance contributes to treated water stations consistently delivering high-quality water to consumers.

Table 1.
Estimated nitrate concentrations in groundwater wells used for different purposes.
On the other hand, the untreated commercial stations and all other private water sources exhibited elevated nitrate levels. For example, in untreated commercial stations, the groundwater nitrate concentration varies from 37 to 120 mg/L, averaging 47.3 mg/L. Conversely, in private wells for domestic and household uses, the range is 12–380 mg/L, and the mean value is 114.6 mg/L. The private wells for agriculture and gardening have a range of 80–250 mg/L with a mean value of 80 mg/L, and the overall mean nitrate concentration exceeds the acceptable threshold of 50 mg/L for nitrate levels. A comparison of nitrate levels in different regions across the Kingdom of Saudi Arabia revealed varying concentrations ranging from 1.1 to 884.0 mg/L. The average nitrate levels were found to be 65.7 (Jizan), 60.3 (Asir), 60.0 (Qassim), 51.3 (Hail), 41.8 (Makkah Al Mukaromah), 41.3 (Madina Al Munawara), 38.0 (Al Baha), 37.0 (Najran), 30.7 (Tabuk), 25.2 (Eastern Province), 18.8 (Riyadh), 15.8 (Al Jouf), and 9.1 (Hawed Shamalyah) [29]. Groundwater nitrate levels across Saudi Arabia vary due to various factors like agricultural activities, industrialization, and urbanization. The Eastern Province, with intensive agriculture and industry, may have higher nitrate levels, while other regions may experience lower concentrations due to fewer anthropogenic influences. Coastal areas like Jeddah may face additional challenges from seawater intrusion. Surrounding the present study areas, the nitrate level was reported to be between 3 and 20 mg/L in the Sultanate of Oman [1,30], whereas in Qatar and Kuwait it was between 4.8 and 40.14 mg/L [31] and 8–40 mg/L [32], respectively. Monitoring and managing nitrate levels are crucial for ensuring water quality and sustainable groundwater resources nationwide. The elevated levels of nitrate in groundwater can be attributed to several factors. For example, nitrate-containing fertilizers, manure, and other agricultural practices contribute to high nitrate levels in groundwater. These sources can leach nitrate into the soil, which may then infiltrate the underlying groundwater. Improperly maintained septic systems or inadequate wastewater treatment can release nitrate-rich effluent into the ground. Over time, this can result in elevated nitrate concentrations in the groundwater. Certain industries, such as manufacturing, mining, and chemical plants, may release nitrates or nitrogen-containing compounds as byproducts. If these contaminants are not properly managed or disposed of, they can seep into the groundwater and increase nitrate levels. Landfills and waste disposal sites that accept organic waste can generate nitrate as a result of the decomposition process. If these sites are not properly engineered or managed, nitrate can seep into the groundwater, leading to elevated nitrate levels. Naturally occurring sources, such as nitrogen-rich geological formations or organic matter in the soil, can also contribute to high nitrate levels in groundwater. In some cases, geological factors may allow nitrate to accumulate and persist in groundwater sources [33,34].
3.5. Spatial Distributions of Nitrate Concentrations in Deep and Shallow Wells
The present study employed diverse GIS techniques, focusing on enhancing results by applying the inverse distance weighting (IDW) interpolation method. The outcomes of this methodology are illustrated in Figure 7, which shows the regional distribution of nitrate concentrations in groundwater sources. The depiction employs distinct colors, with light to dark green indicating lower to higher nitrate concentrations, respectively.
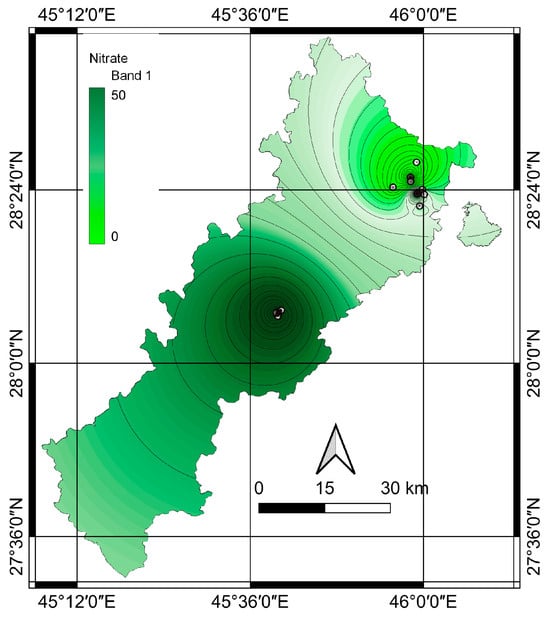
Figure 7.
Spatial distribution of nitrate concentration in deep wells.
Figure 7 shows the nitrate levels determined via the IDW technique for deep wells in the studied areas. The central regions (river valley) exhibit relatively elevated nitrate concentrations, while lower nitrate concentrations are observed in the northern hillside areas. Nitrate levels can vary in deep wells for several reasons, including geological, hydrological, and anthropogenic factors. For example, naturally occurring nitrate-rich geological formations, such as deposits of nitrogen-containing minerals or organic matter, can lead to higher nitrate levels in groundwater extracted from deep wells. The composition and characteristics of the underlying geology can vary, resulting in variations in nitrate concentrations. The movement and flow of groundwater can influence nitrate levels in deep wells. Factors such as the direction and rate of groundwater flow, recharge patterns, and interactions with surface water bodies can impact nitrate concentrations. Variations in these hydrological factors across different regions or depths can result in differences in nitrate levels in deep wells. Moreover, if a deep well is located close to agricultural activities, septic systems, industrial facilities, or waste disposal sites, nitrate levels in groundwater can be significantly affected. Such sources may exhibit higher nitrate concentrations than wells in areas with less contamination. Nitrate levels can also vary based on groundwater depth and residence time in aquifers. Deep wells may tap into older groundwater with a longer interaction time with nitrate sources, potentially leading to higher concentrations. In contrast, shallower wells may draw from more recently recharged groundwater with lower nitrate levels. The specific characteristics of an aquifer, such as its permeability, porosity, and hydraulic conductivity, can affect the movement and mixing of groundwater and nitrate. Variations in these hydrogeological conditions can result in differences in nitrate levels among deep wells, even within the same region.
Figure 8 shows the nitrate levels measured via the IDW technique for shallow wells, where the nitrate concentrations are categorized as less than 50 mg/L and greater than 50 mg/L. The figure reveals elevated concentrations in the northern regions, while lower concentrations are observed in the southern areas. The high nitrate content in these regions is likely associated with bedrock sources [35]. Conversely, regions with intensive anthropogenic activities, including waste disposal sites, industrial estates, and agriculture employing pesticides and fertilizers, threaten groundwater. Research conducted in a Tunisian aquifer demonstrated a significant correlation between hydrogeological and hydrochemical datasets, indicating more polluted zones in areas with compromised water quality [36]. Numerous studies have highlighted the connection between elevated nitrate concentrations in groundwater and proximity to agricultural, industrial, and residential areas. To elaborate, excessive fertilizer use, stream water pollution entering groundwater, animal operations, wastewater disposal, and industrial waste in the area can contribute to groundwater pollution.
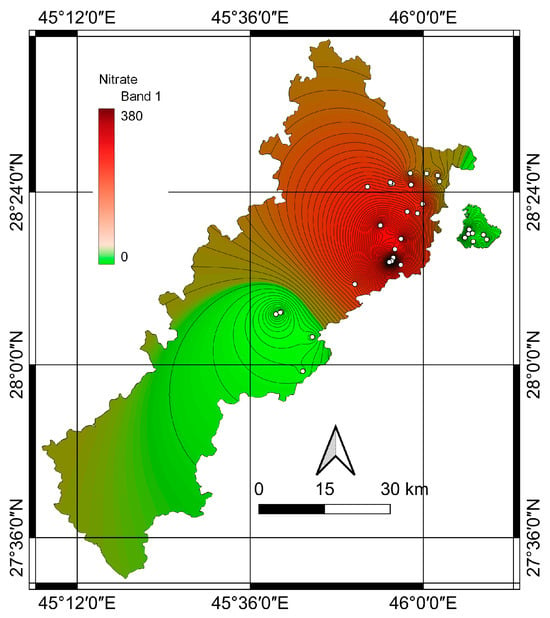
Figure 8.
Spatial distribution of nitrate concentrations in shallow wells.
The nitrate concentrations in shallow and deep wells exhibit significant variations, influenced by geological conditions, land use, and human activities. Shallow wells are closer to the Earth’s surface and more prone to contamination from surface activities such as agriculture, septic systems, and industrial runoff. Nitrate-rich fertilizers and animal waste from agricultural practices can permeate into groundwater, resulting in elevated nitrate levels. Contaminants in shallow wells can swiftly reach groundwater due to the shorter distance they must traverse through the unsaturated zone (the area of soil and rock above the water table), leading to accelerated nitrate infiltration. On the other hand, deep wells, drilled deeper into the Earth’s crust, access groundwater from substantial depths. This depth acts as a natural barrier against surface contamination, diminishing the risk of nitrate infiltration. Moreover, water in deep wells tends to have an extended residence time in the subsurface before reaching the well. This prolonged contact with geological formations can lead to natural attenuation processes that decrease nitrate levels. Deep wells are generally less susceptible to seasonal fluctuations in nitrate levels, tapping into older and more stable groundwater sources with reduced influence from surface activities. Due to their decreased vulnerability to surface contamination, deep wells are often deemed more dependable and consistent for use as community drinking water sources.
In summary, nitrate concentrations in shallow and deep wells differ based on their depth, susceptibility to surface contamination, and geological characteristics. Consistent monitoring and appropriate management practices are crucial for safeguarding groundwater quality from both types of wells, ensuring that nitrate levels remain within safe limits for human consumption.
4. Conclusions
The present study examined nitrate levels in various wells used for drinking, domestic, and agricultural purposes. The measured concentrations varied widely, ranging from as low as 16 mg/L to as high as 380 mg/L. The nitrate concentrations in shallow and deep wells vary significantly due to geological conditions, land use, and human activities. Shallow wells closer to the Earth’s surface are more susceptible to contamination from agriculture, septic systems, and industrial runoff. Nitrate-rich fertilizers and animal waste can seep into groundwater, causing high nitrate levels. In contrast, deep wells drilled deeper into the Earth’s crust access groundwater from greater depths, acting as a natural barrier against surface contamination and reducing the risk of nitrate infiltration. Water in deep wells has a longer residence time in the subsurface, allowing natural processes to decrease nitrate levels through interactions with geological formations. Due to their reduced vulnerability to surface contamination, deep wells are considered dependable and consistent water sources for communities. The findings indicate that commercial drinking water treatment stations adhere to the World Health Organization’s (WHO) recommended limit of 50 mg/L, ensuring an acceptable range for human consumption. However, it is troubling to observe that an appreciable percentage, approximately 47%, of untreated water stations used for domestic purposes surpass this recommended limit. This poses a significant risk to individuals who rely on these water sources. Additionally, private wells associated with residences and those designated for agricultural use displayed notably high nitrate concentrations, making them unsuitable for drinking due to excessive nitrate levels. However, some well water can still be used for domestic activities and agricultural practices, albeit with necessary precautions. It is necessary to continuously assess and monitor groundwater quality using modern technologies in conjunction with classical methods to identify and prioritize areas of concern, detect contaminations, and track changes in groundwater quality over time. Investigating the potential health effects of long-term exposure to contaminants in groundwater and developing strategies to mitigate health risks will be undertaken in the near future.
Author Contributions
Conceptualization, A.M.; methodology, A.M.; formal analysis, A.M.; investigation, A.M.; data curation, A.M.; writing—original draft preparation, A.M.; writing—review and editing, A.M.; visualization, A.M.; supervision, H.O.S.; project administration, A.M.; funding acquisition, A.M. All authors have read and agreed to the published version of the manuscript.
Funding
This research was funded by the Institutional Funding Project (IFP-A-202-1-3) from the Ministry of Education, Saudi Arabia.
Data Availability Statement
The data presented in this study are available in this article.
Acknowledgments
The authors thank the Deanship of Scientific Research, University of Hafr Al Batin, for the use of their experimental facilities.
Conflicts of Interest
The authors declare no conflicts of interest. The funders had no role in the study’s design, data collection, analysis, interpretation, manuscript writing, or decision to publish the results.
References
- Wongsanit, J.; Teartisup, P.; Kerdsueb, P.; Tharnpoophasiam, P.; Worakhunpiset, S. Contamination of nitrate in groundwater and its potential human health: A case study of lower Mae Klong river basin, Thailand. Environ. Sci. Pollut. Res. 2015, 22, 11504–11512. [Google Scholar] [CrossRef] [PubMed]
- International Agency for Research on Cancer. Ingested nitrate and nitrite, and cyanobacterial peptide toxins. In IARC Monographs on the Evaluation of Carcinogenic Risks to Humans; IARC Press, International Agency for Research on Cancer: Lyon, France, 2010; Volume 94. [Google Scholar]
- Brender, J.D.; Weyer, P.J.; Romitti, P.A.; Mohanty, B.P.; Shinde, M.U.; Vuong, A.M.; Sharkey, J.R.; Dwivedi, D.; Horel, S.A.; Kantamneni, J. Prenatal nitrate intake from drinking water and selected birth defects in offspring of participants in the national birth defects prevention study. Environ. Health Perspect. 2013, 121, 1083–1089. [Google Scholar] [CrossRef] [PubMed]
- Achadi, E.; Hansell, M.; Sloan, N.; Anderson, M. Women’s nutritional status, iron consumption and weight gain during pregnancy in relation to neonatal weight and length in West Java, Indonesia. Int. J. Gynecol. Obstet. 1995, 48, S103–S119. [Google Scholar] [CrossRef] [PubMed]
- Knobeloch, L.; Salna, B.; Hogan, A.; Postle, J.; Anderson, H. Blue babies and nitrate-contaminated well water. Environ. Health Perspect. 2000, 108, 675–678. [Google Scholar] [CrossRef] [PubMed]
- World Health Organization. Nitrate and Nitrite in Drinking-Water: Background Document for Development of WHO Guidelines for Drinking-Water Quality; World Health Organization: Geneva, Switzerland, 2003. [Google Scholar]
- Gilchrist, M.; Winyard, P.G.; Benjamin, N. Dietary nitrate–good or bad? Nitric Oxide 2010, 22, 104–109. [Google Scholar] [CrossRef] [PubMed]
- Van Duijvenboden, W.; Matthijsen, A. Integrated Criteria Document Nitrate; RIVM Report No. 758473012; National Institute for Public Health and the Environment: Bilthoven, The Netherlands, 1989. [Google Scholar]
- Woo, E. Banded Crystalline Spherulites in Polymers and Organic Compounds: Interior Lamellar Structures Correlating with Top-Surface Topology. J. Adv. Chem. Eng. 2015, 5, 120–126. [Google Scholar] [CrossRef]
- Jacks, G.; Sharma, V. Nitrogen circulation and nitrate in groundwater in an agricultural catchment in southern India. Environ. Geol. 1983, 5, 61–64. [Google Scholar] [CrossRef]
- USEPA. National primary drinking water regulations; Radionuclides, proposed rule. Fed. Reg. 1991, 56, 33050–33127. [Google Scholar]
- Burkart, M.R.; Stoner, J.D. Nitrate in aquifers beneath agricultural systems. Water Sci. Technol. 2002, 45, 19–29. [Google Scholar] [CrossRef]
- Burow, K.R.; Nolan, B.T.; Rupert, M.G.; Dubrovsky, N.M. Nitrate in groundwater of the United States, 1991−2003. Environ. Sci. Technol. 2010, 44, 4988–4997. [Google Scholar] [CrossRef]
- Matiatos, I. Nitrate source identification in groundwater of multiple land-use areas by combining isotopes and multivariate statistical analysis: A case study of Asopos basin (Central Greece). Sci. Total Environ. 2016, 541, 802–814. [Google Scholar] [CrossRef] [PubMed]
- Lassaletta, L.; García-Gómez, H.; Gimeno, B.S.; Rovira, J.V. Agriculture-induced increase in nitrate concentrations in stream waters of a large Mediterranean catchment over 25 years (1981–2005). Sci. Total Environ. 2009, 407, 6034–6043. [Google Scholar] [CrossRef] [PubMed]
- Gao, Y.; Yu, G.; Luo, C.; Zhou, P. Groundwater nitrogen pollution and assessment of its health risks: A case study of a typical village in rural-urban continuum, China. PLoS ONE 2012, 7, e33982. [Google Scholar] [CrossRef]
- Khogali, A.; Birkle, P.; Al-Shaibani, A.; Keller, M.; Tawabini, B.; Makkawi, M. Geochemical Assessment of Potential Sources for Nitrate in the Wasia Aquifer, Al Kharj Area, Central Saudi Arabia. Water 2020, 12, 1479. [Google Scholar] [CrossRef]
- Musaed, H.A.; Al-Bassam, A.M.; Zaidi, F.K.; Alfaifi, H.J.; Ibrahim, E. Hydrochemical assessment of groundwater in mesozoic sedimentary aquifers in an arid region: A case study from Wadi Nisah in Central Saudi Arabia. Environ. Earth Sci. 2020, 79, 147. [Google Scholar] [CrossRef]
- Al-Omran, A.; Al-Barakah, F.; Altuquq, A.; Aly, A.; Nadeem, M. Drinking water quality assessment and water quality index of Riyadh, Saudi Arabia. Water Qual. Res. J. 2015, 50, 287–296. [Google Scholar] [CrossRef]
- Aly, A.A.; Al-Omran, A.M.; Alharby, M.M. The water quality index and hydrochemical characterization of groundwater resources in Hafar Albatin, Saudi Arabia. Arab. J. Geosci. 2015, 8, 4177–4190. [Google Scholar] [CrossRef]
- Kazakis, N.; Matiatos, I.; Ntona, M.-M.; Bannenberg, M.; Kalaitzidou, K.; Kaprara, E.; Mitrakas, M.; Ioannidou, A.; Vargemezis, G.; Voudouris, K. Origin, implications and management strategies for nitrate pollution in surface and ground waters of Anthemountas basin based on a δ15N-NO3− and δ18O-NO3− isotope approach. Sci. Total Environ. 2020, 724, 138211. [Google Scholar] [CrossRef] [PubMed]
- Liang, Y.; Zhang, X.; Gan, L.; Chen, S.; Zhao, S.; Ding, J.; Kang, W.; Yang, H. Mapping specific groundwater nitrate concentrations from spatial data using machine learning: A case study of chongqing, China. Heliyon 2024, 10, e27867. [Google Scholar] [CrossRef]
- Mamun, A. Estimation of Tritium Concentration in the Rain- and Groundwater in the Dry River of Hafr Al Batin, Saudi Arabia. Limnol. Rev. 2023, 23, 93–107. [Google Scholar] [CrossRef]
- Mamun, A.; Alazmi, A.S. Risk Assessment of Radon Exposure by Ingestion and Inhalation of Groundwater Within Different Age Groups. Groundw. Monit. Remediat. 2023, 43, 69–77. [Google Scholar] [CrossRef]
- El-Taher, A.; Al-Turki, A. Radon activity measurements in irrigation water from Qassim Province by RAD7. J. Environ. Biol. 2016, 37, 1299–1302. [Google Scholar] [PubMed]
- El-Taher, A.M.; Abojassim, A.A.; Najam, L.A.; Mraity, H.A.A.B. Assessment of Annual effective Dose for Different Age Groups based on Radon Concentrations in the Groundwater of Qassim, Saudi Arabia. Iran. J. Med. Phys. 2020, 17, 15–20. [Google Scholar] [CrossRef]
- Vincent, P. Saudi Arabia: An Environmental Overview, 1st ed.; CRC Press: London, UK, 2008. [Google Scholar]
- Alsharhan, A.S.; Rizk, Z.A.; Nairn, A.E.M.; Bakhit, D.W.; Alhajari, S.A. Hydrogeology of an Arid Region: The Arabian Gulf and Adjoining Areas. In Hydrogeology of an Arid Region: The Arabian Gulf and Adjoining Areas; Elsevier Science B.V.: Amsterdam, The Netherlands, 2001; p. vi. [Google Scholar]
- Alabdula’aly, A.I.; Al-Rehaili, A.M.; Al-Zarah, A.I.; Khan, M.A. Assessment of nitrate concentration in groundwater in Saudi Arabia. Environ. Monit. Assess. 2010, 161, 1–9. [Google Scholar] [CrossRef] [PubMed]
- Zidi, C.; Jamrah, A.; Al-Issai, L. Assessment of groundwater quality in Al-Buraimi, Sultanate of Oman. J. Mater. Environ. Sci. 2017, 8, 1266–1276. [Google Scholar]
- Al-Naimi, L.S.; Mgbeojedo, T.I. Assessment of Groundwater Quality around Al Khor and Environs, Qatar. J. Appl. Geol. Geophys. 2018, 6, 6. [Google Scholar]
- Al-Senafy, M.; Hadi, K.; Fadlelmawla, A.; Al-Fahad, K.; Al-Khalid, A.; Bhandary, H. Causes of Groundwater Rise at Al-Qurain Residential Area, Kuwait. Procedia Environ. Sci. 2015, 25, 4–10. [Google Scholar] [CrossRef]
- Rajmohan, N.; Elango, L. Nutrient chemistry of groundwater in an intensively irrigated region of southern India. Environ. Geol. 2005, 47, 820–830. [Google Scholar] [CrossRef]
- Jamaludin, N.; Sham, S.M.; Ismail, S.N.S. Health risk assessment of nitrate exposure in well water of residents in intensive agriculture area. Am. J. Appl. Sci. 2013, 10, 442. [Google Scholar] [CrossRef]
- Enwright, N.; Hudak, P.F. Spatial distribution of nitrate and related factors in the High Plains Aquifer, Texas. Environ. Geol. 2009, 58, 1541–1548. [Google Scholar] [CrossRef]
- Tabatabaei, S.-H.; Nourmahnad, N.; Golestani Kermani, S.; Tabatabaei, S.-A.; Najafi, P.; Heidarpour, M. Urban wastewater reuse in agriculture for irrigation in arid and semi-arid regions—A review. Int. J. Recycl. Org. Waste Agric. 2020, 9, 193–220. [Google Scholar]
Disclaimer/Publisher’s Note: The statements, opinions and data contained in all publications are solely those of the individual author(s) and contributor(s) and not of MDPI and/or the editor(s). MDPI and/or the editor(s) disclaim responsibility for any injury to people or property resulting from any ideas, methods, instructions or products referred to in the content. |
© 2024 by the authors. Licensee MDPI, Basel, Switzerland. This article is an open access article distributed under the terms and conditions of the Creative Commons Attribution (CC BY) license (https://creativecommons.org/licenses/by/4.0/).