1. Introduction
The truck and trailer routing problem (TTRP) is a well-recognized combinatorial optimization issue. It is found in wide and diverse applications in industry [
1,
2,
3,
4,
5,
6,
7,
8,
9]. Studies of TTRP in real-world cases can be found in [
10,
11,
12].
Unlike classical vehicle routing, the TTRP considers the use of trailers. There exists the possibility to deliver products by a single truck or by a complete vehicle, i.e., a truck pulling a trailer. However, as with any real situation, constraints prevent the use of a trailer in certain places. This is due to road conditions, narrow roads, small bridges, heavy traffic, limited parking spaces, limited maneuvering space at customer sites, government regulations, and others. Therefore, during a trip, the trailer is often parked at some feasible place while the truck goes on to deliver products along a certain route. Finally, it goes back to hitch the trailer and continue the trip.
Due to the Vehicle Routing Problem (VRP) being an NP-hard problem, it is commonly solved using a heuristics approach. The exact approach can solve small VRP instances; meanwhile, the heuristic approach yields the best performance in real-world cases. As with other combinatorial optimization problems, the VRP family of problems has been tackled efficiently using heuristics and meta-heuristics [
13]. From the study described in [
14], it is possible to conclude that all kinds of vehicle routing problems are NP-hard, due to the fact that they cannot be solved in polynomial time. Since TTRP is part of the VRP family of problems, it is usually tackled using heuristics and/or metaheuristics, as with other routing problems. If the size of the problem is too large, no exact algorithm can find optimal tours within reasonable computing time [
15]. As with other routing problems, the TTRP is also NP-hard. In addition, because routing optimization problems are solved with heuristics and/or metaheuristics, it is normal to address the TTRP using the same approach. As an example, Ref. [
16] proposed a simulated annealing (SA) technique to tackle the TTRP.
Other metaheuristics based on evolutionary computing are the Estimation of Distribution Algorithms (EDAs). These algorithms have shown to be efficient in tackling combinatorial optimization problems. It can be considered that there are two classifications for EDAs, i.e., pure EDAs and hybrid EDAs.
Pure EDAs base their performance on a probability model to find new solutions from previous solutions. A set of pure EDAs is cited in [
17].
Hybrid EDAs base their performance on an interaction between a probability model and some other techniques or methods to generate offspring and/or to improve the efficiency of the algorithm. Hybrid EDAs are considered [
18] for solving synthetic optimization problems and [
19] as an algorithm for the quadratic assignment problem. Hybrid EDAs were studied in [
20] for the permutation flow-shop scheduling problem, in [
21] as a method for the flexible job-shop scheduling problem, in [
22] as an algorithm for the stochastic resource-constrained project-scheduling problem, and in [
23] in research for the distributed permutation flow-shop scheduling problem under machine breakdown.
Recently, new EDAs utilized permutation-based representation as a solution to find solutions for optimization problems. This category is named distance-based ranking models. The following are currently published papers belonging to this category: The proposed EDA by [
24] approached the flow-shop scheduling problem. The study [
25] approached the school bus routing problem with bus stop selection. The algorithm of [
26] approached the flexible job-shop-scheduling problem with process plan flexibility, and the technique from [
27] approached the vehicle routing problem with time windows.
From the previous classification, there exists a gap to improve EDAs. The development of new probability models continues to be attractive for practitioners and researchers. The proposal of identifying new probability models to be more efficient in the EDAs is the aim and scope of any research in this field. Therefore, as a contribution to this research, the proposed EDA generates solutions based on a radial probability model.
The proposed EDA, called RHEDA-TTRP (Radial Hybrid Estimation of Distribution Algorithm for the Truck and Trailer Routing Problem), is compared with those recent algorithms that efficiently solve the TTRP.
2. Related Work
There are other studies similar to TTRP. For example, Ref. [
10] discussed a vehicle routing problem (VRP) using trailers under accessibility restrictions. The authors employed a clustering-based construction methodology to produce solutions, and the authors employed a tabu search heuristic to solve the problem. Their study differs from the TTRP in that a complete vehicle cannot be used in a sub-tour. The complete vehicles are only used to visit customers without accessibility restrictions, i.e., the route is executed without any sub-tour traveled by a complete vehicle.
Another example is found in [
28]. The author attended a partial accessibility-constrained VRP. The author provided an integer programming formulation to model the situation. The problem statement mainly differs from the TTRP in that two sub-tours cannot have the same route. Furthermore, all trucks should be used, the number of trailers used should be indicated a priori, and the central depot cannot be visited in the middle of a tour.
The [
11] study is another case of VRP with trailers. The problem was solved through four heuristics. The main difference between the [
11] study and the TTRP is that all the customers will have only unit demand, and the trailers can park at any customer site.
Ref. [
29] considered that the trucks and the trailers have different capacities, and as another restriction, one truck cannot travel with the trailer of another truck. This means that there exists a heterogeneous fleet of trucks and trailers. These aspects differ from the TTRP.
The tabu-search algorithm is used to tackle the TTRP in [
30]. With tabu search, the author allocated customers to routes at the beginning, followed by an insertion heuristic.
Ref. [
31] employed two heuristics to develop initial solutions, and later the solutions are improved through tabu search.
Ref. [
32] addressed the TTRP through sequential heuristics. First, assigned customers to valid routes, and then defined the sequence of each route.
Ref. [
33] tackled the TTRP by an ant colony system to build feasible solutions, and then these solutions are improved by a process improvement for each solution.
Ref. [
16] detailed a heuristic based on the SA technique for the TTRP, and [
34] extended the idea to address the time window constraints.
Ref. [
35] detaileda hybrid Greedy Randomized Adaptive Search Procedure (GRASP) with Variable Neighbourhood Search (VNS) heuristic for the TTRP, and ref. [
36] coupled this heuristic with a set-partitioning formulation to tackle the same problem.
Ref. [
37] addressed the Rich Vehicle Routing Problem (RVRP) that considers the TTRP with and without the option of load transfer between truck and trailer as well as the requirement of time windows for delivery. The study detailed a flexible hybrid approach, which is based on a local search and a large neighborhood.
Ref. [
38] solved a dynamic truck and trailer routing problem for last mile distribution in disaster response by a modified simulated annealing algorithm with variable neighborhood search for local search. The fitness in this research is the total travel time. For dealing with the stochastic and dynamicity of the problem, a dynamic simulator was added to the framework to incorporate the new requirements of the customers.
Ref. [
39] detailed a bat algorithm (BA) to tackle the TTRP. The procedure used five different neighborhood structures as part of a local search strategy. Moreover, to preserve diversity, a self-adaptive (SA) tuning strategy is used in the proposed algorithm.
Ref. [
40] tackled the TTRP by a Backtracking Search Algorithm (BSA). The algorithm used four types of route improvement to produce offspring, and a T-sweep heuristic to build the initial population.
New papers have been published with similar characteristics to the aforementioned articles, such as [
41,
42,
43]. In [
41] an optimization model, i.e., a mixed integer nonlinear problem is developed, and an ant colony optimization algorithm is designed to minimize the total cost of the drop and pull transportation system using only trucks and semitrailers within the time windows.
Ref. [
42] introduced and implemented a two-phase heuristic algorithm, i.e., a constructive heuristic algorithm, and an iterated tabu search metaheuristic, for solving the TTRP with product compartmentalization, which the authors called the multi-compartment TTRP. Although this feature added extra complexity, it can be a requirement in real logistical applications.
Ref. [
43] detailed an improved ant colony optimization to reduce the carbon dioxide emissions in inland container transportation.
Table 1 shows the pros and cons of the recent research.
Although diverse methods and strategies have been used to solve the TTRP, this paper contributes to the state of the art through the utilization of the radial probability functions of the hydrogen, for the TTRP, as a probability model to enhance the efficiency of the EDA.
Currently, using radial probability functions has not been considered sufficiently in the Literature. In addition, we want to tackle the drawbacks that any EDA suffers, through hybridization. The results show that this approach is competitive with other algorithms such as GA, PSO, DE, etc.
Based on the performance of the proposed scheme, we can make the conclusion that incorporating radial probability distributions helps to improve the estimation of distribution algorithms.
3. Problem Statement
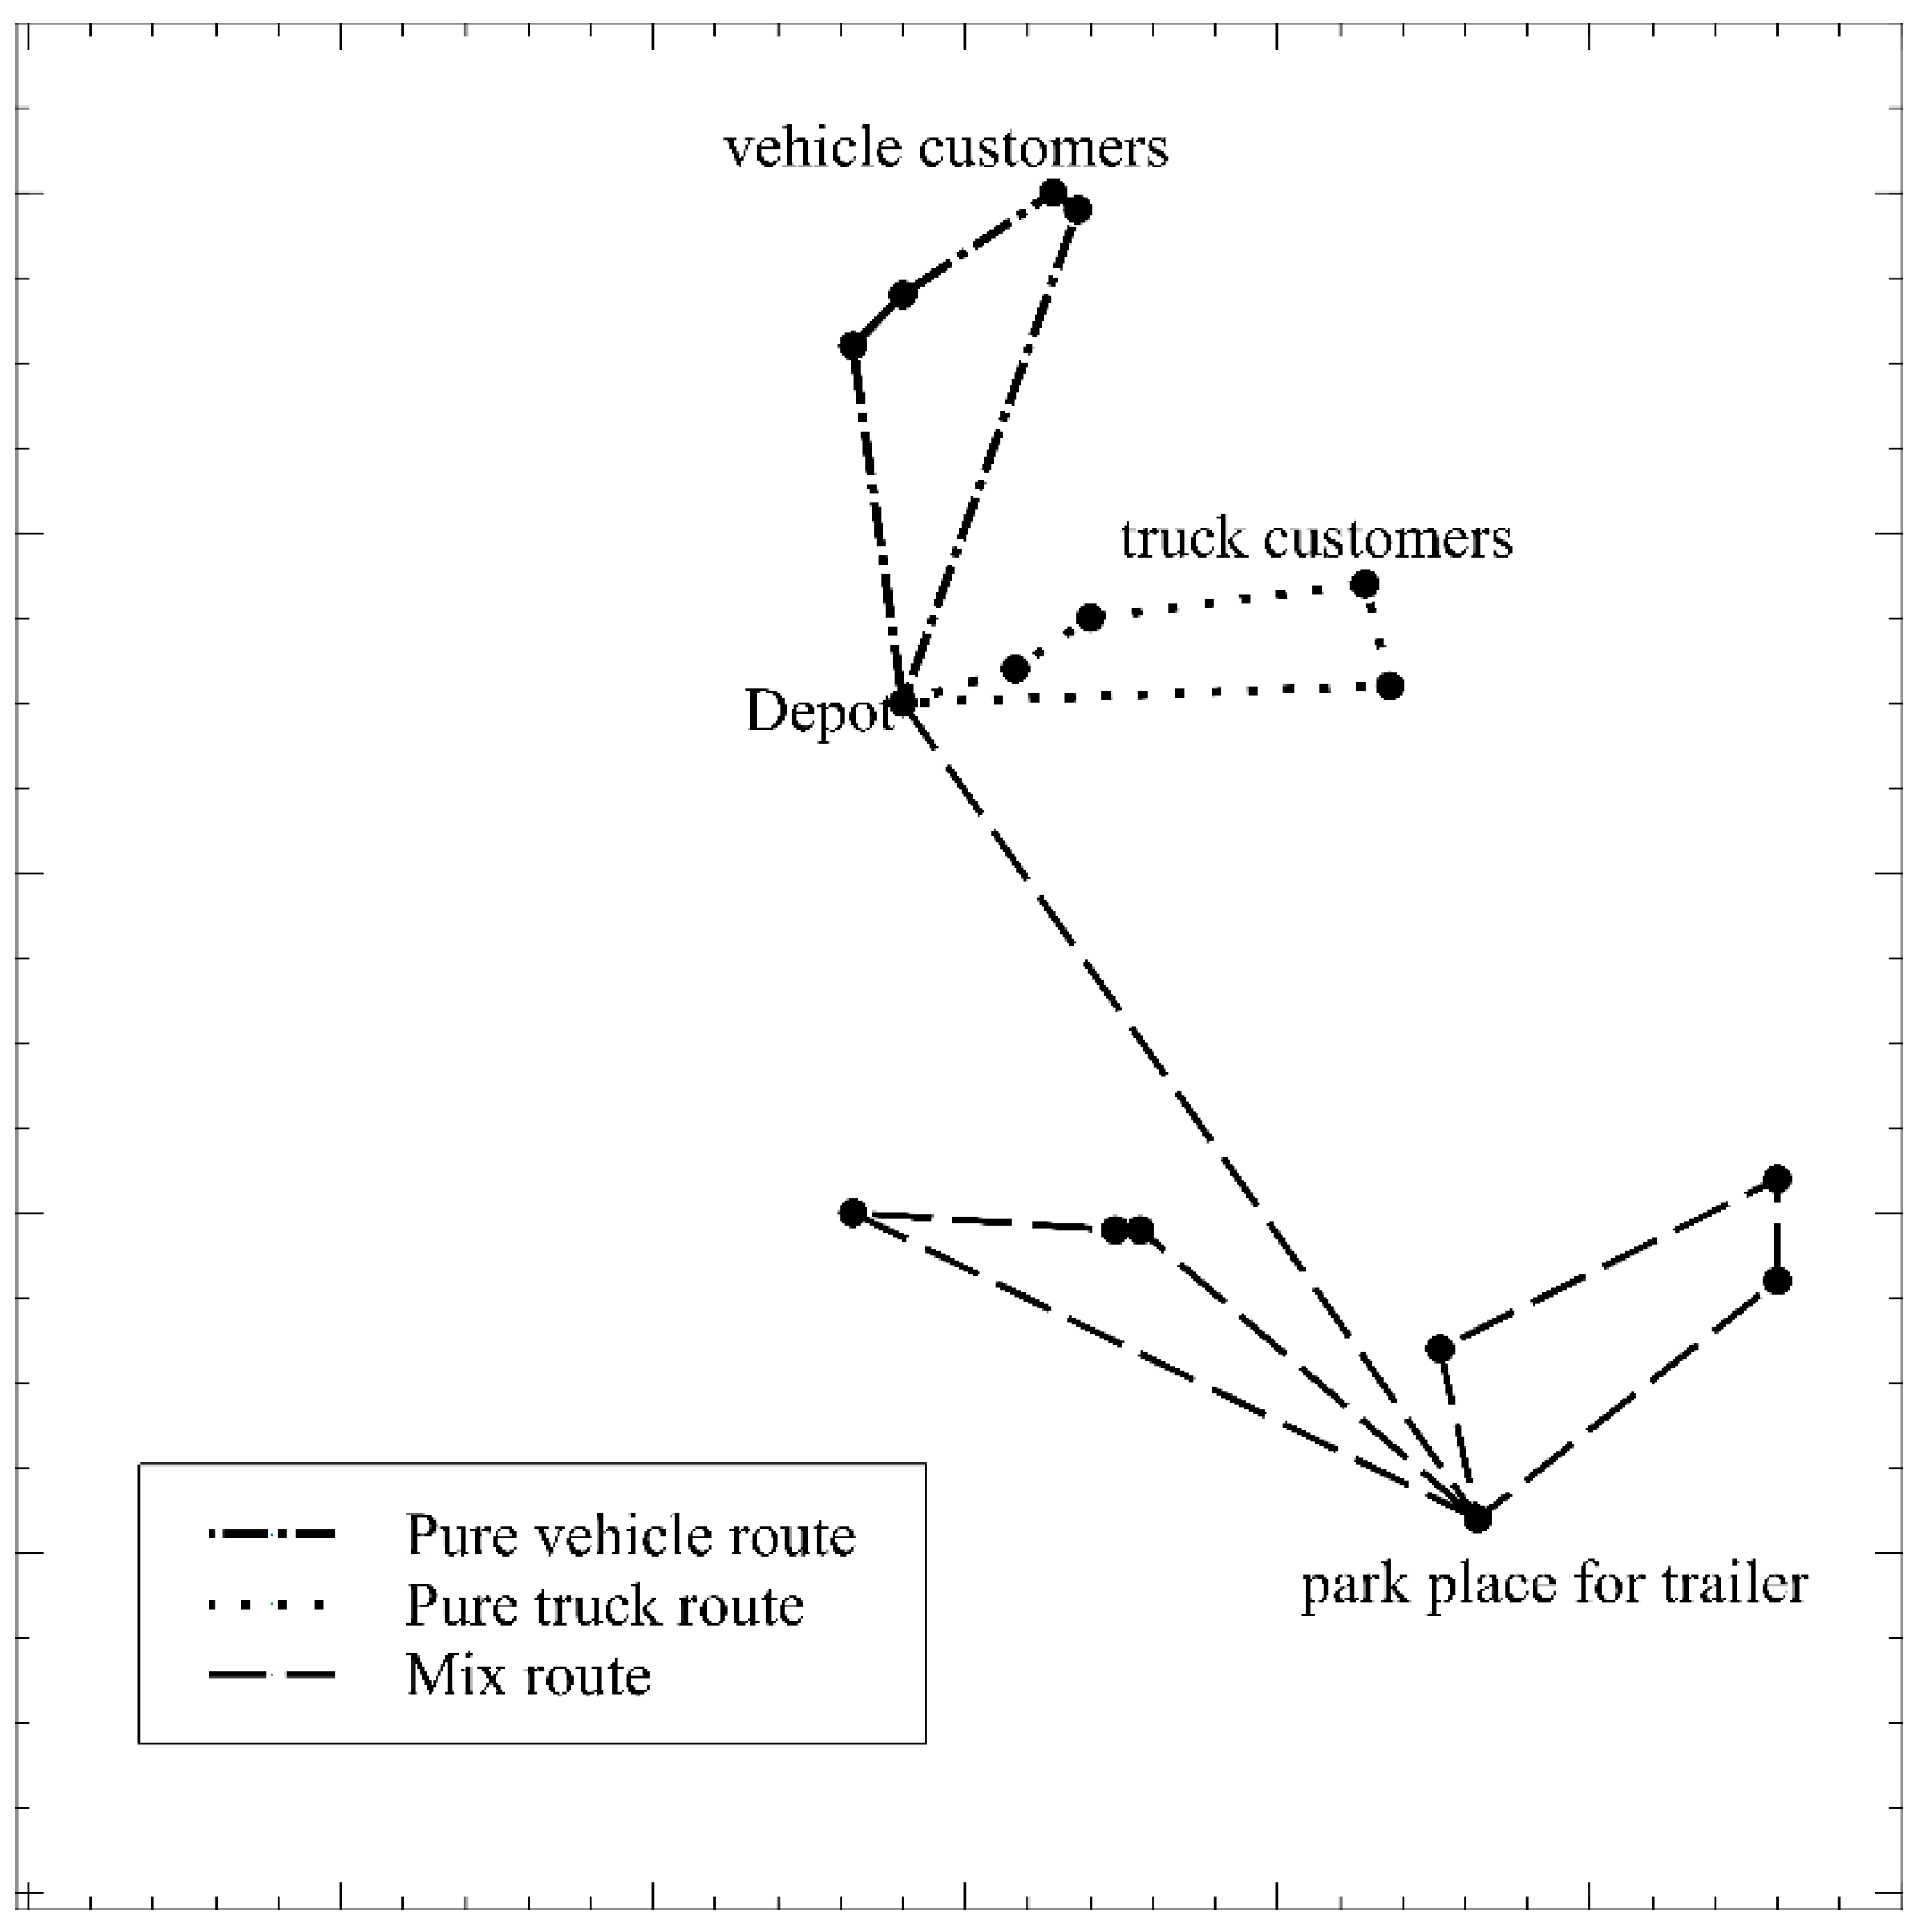
From a main depot, trucks and trailers attend to a set of customers. Some customers can only accept trucks due to maneuvering space or other physical constraints. The rest of the customers can receive their demand either by truck or by a complete vehicle, i.e., a truck pulling a trailer. To identify customers that only can accept trucks; we name them “truck customers”. To identify customers that can accept complete vehicles, we name them “vehicle customers”. In the TTRP, it is possible to produce three types of routes, i.e., routes that only consider truck customers (we name them “pure truck routes”), routes that only consider vehicle customers (we name them “pure vehicle routes”), and routes that consider both trucks customers, and vehicle customers (we name “mixed routes”). A mixed route considers executing a trip with a complete vehicle, and to serve truck customers through the tour. Then, the trailer should be parked in a vehicle-customer location, before serving the truck customers.
Figure 1 details an example of these three types of routes.
Although the trucks and complete vehicles have a finite capacity, items can be transferred between the truck and the trailer, during the trip, in the parking places of the trailer.
The main purpose is to identify a set of trips of the minimum total distance.
Although the vehicles can execute the trips, there are some assumptions to be considered as follows:
- -
Failures of any truck or trailer are not considered. All the vehicles are ready for any trip.
- -
The demand for any customer is known in advance.
- -
Park locations are always free when the trailer arrives at the park.
- -
The main depot is always open to depart or receive trucks.
- -
In this research, three decision-making processes are executed to obtain feasible solutions. The first decision-making process is to establish a sequence to visit all the customers. The second decision-making process is to define what type of route is elected for each customer. The third decision-making process is to identify which parking place is selected for each customer that belongs to a mix route.
4. RHEDA—TTRP Framework
An atomic orbital generation function is used to produce solutions. In quantum chemistry, it is established that a function, of this type, makes it possible to describe the behavior of an electron in a space occupied by an atom to which the electron belongs.
However, due to the random behavior of the electron, it is more useful to describe its behavior in terms of the probability to find the electron in a specific volume of the space occupied by the atom to which the electron belongs.
In the current atom model, the electron is described in terms of a wave function . The wave function is a math function that describes the behavior of the electron in a specific space. This space is called an atomic orbital.
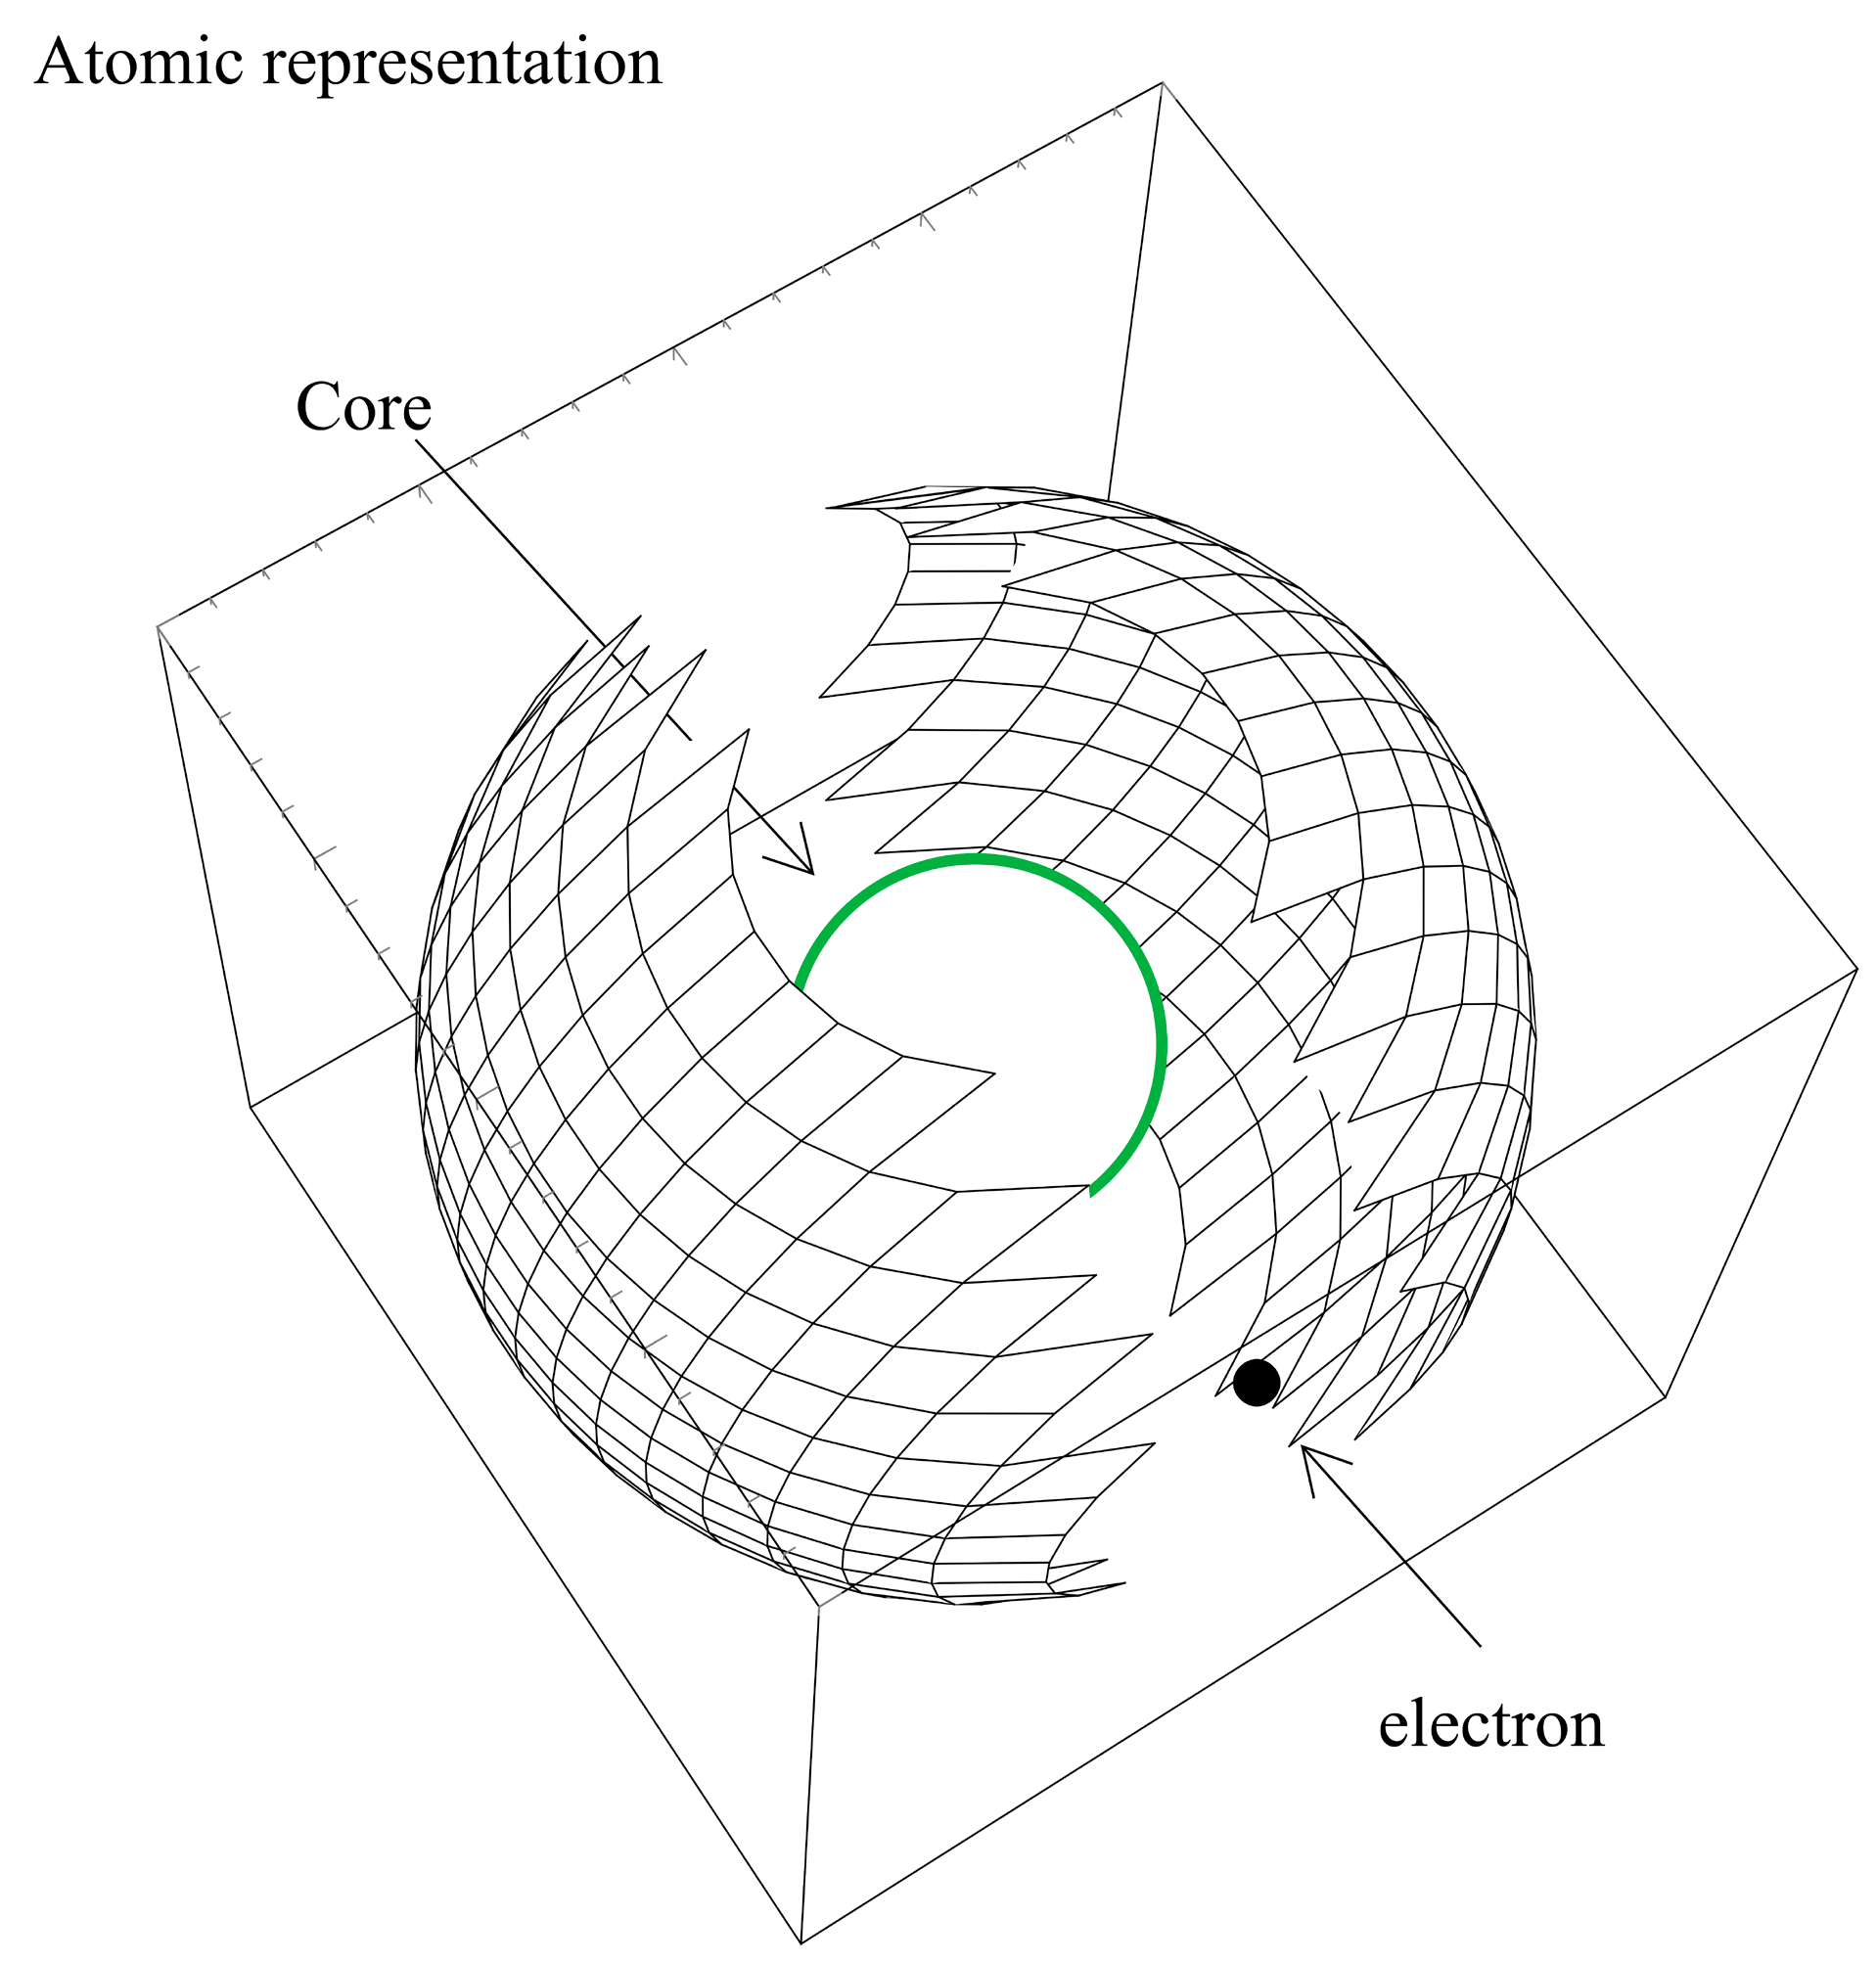
The function
is proportional to the probability density of the electron in a specific point of the atomic space. If the values of
around the core are considered, then it can define a contoured surface (see
Figure 2). This contoured surface contains the volume where there exists a probability to find the electron. It permits us to visualize the atomic orbital. In this research, the wave function of the hydrogen
is used. This function is elected because it is exactly defined in math terms. In this sense, there exist four orbitals for the hydrogen. Then, four equations describe the radial probability function.
4.1. Solution Representation
Three different vectors are considered to represent any solution for the TTRP. First, a tour of all the customers, i.e., a sequence of visiting all the customers is generated. Each position, on the representation, contains a continuous value. Therefore, the representation is simply a sequence of continued values, called a tour vector. The aforementioned continuous values indicate the distance, in picometers, between the electron and the core. In
Table 2, the representation of a tour vector is illustrated.
The aforementioned representation is very suitable to consider the radial probability distribution working as a probability model. Anyway, the tour vectors must be decoded to represent valid routings. The decoding process is detailed as follows:
A fixed integer number is assigned for each customer, based on the corresponding instance to be solved. An ascending sort on the continuous values of each tour vector is done. Then, we assign each continuous value to the corresponding fixed integer number that belongs to each customer.
Table 3 details the previous tour vector, depicted in
Table 2, and its decoding.
Second, a type-route vector is built. There exists at least two different options for each customer. If the customer only can accept trucks, the customer will be served by a mix route (value 1 in the type-route vector) or by a pure truck route (value 2 in the type-route vector). If the customer can accept complete vehicles, the customer will be served by a pure vehicle route (value 0 in the type-route vector) or by a mixed route (valor 1 in the type-route vector). In
Table 4, the representation of a type-route vector is detailed. Therefore, the trips are always valid because the partition of the route is made based on the capacity of the vehicle and the type of route.
Third, a park-location vector is defined. If the customer will be served by a mixed route, a park location should be identified and elected, out of all the feasible parks. However, if the customer will be served by a pure truck route or pure vehicle route, a park location is not required. In
Table 5, the representation of a park-location vector is depicted, and based on the information indicated in
Table 4. The initial population is randomly generated.
4.2. Fitness
The total distance travel is computed for each member of the population. The total distance of travel comes from the distance of travel of pure truck routes, adding the distance travel of pure vehicle routes, and adding the distance travel of mixed routes. The total distance travel is computed with the tour of each vehicle and the coordinates of the customers, and the travel distance of the mixed routes includes the distance to the park location.
4.3. Probability Model for the Park-Location Making Decision Process
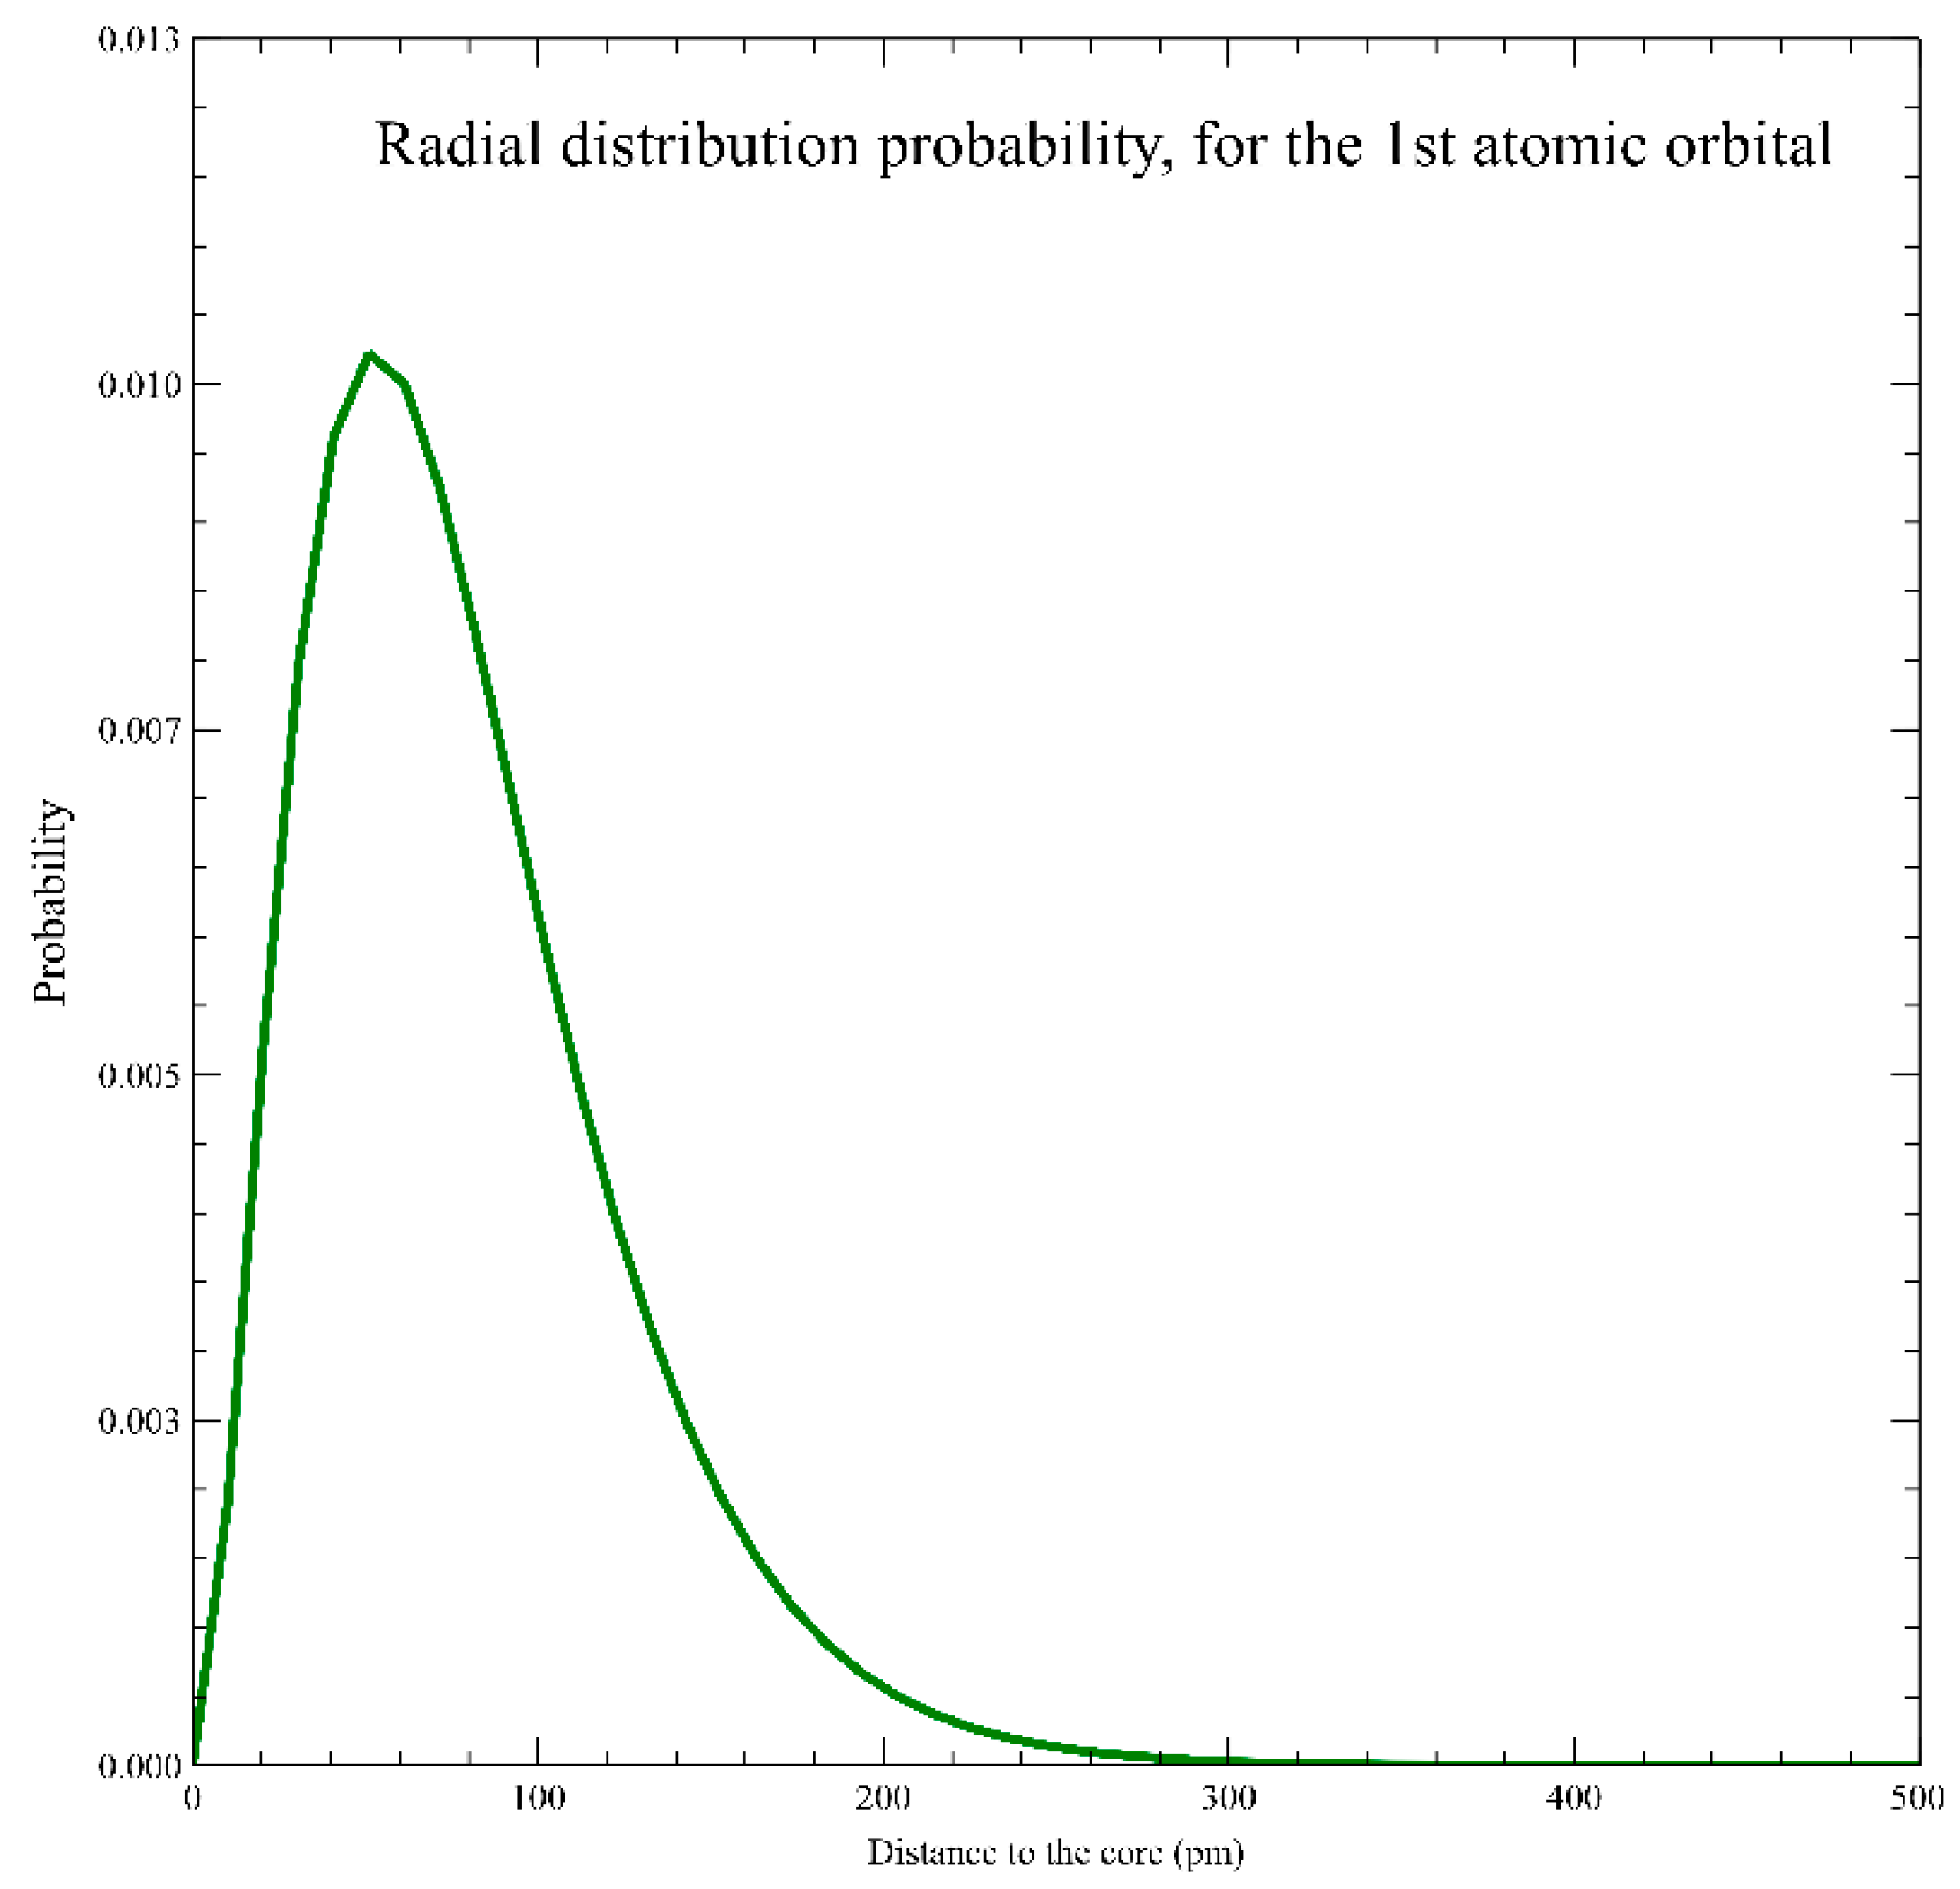
The math expressions of the radial distribution function P(r), for the hydrogen, in each atomic orbital are detailed as follows
1st atomic orbital
where
represents the atomic number of the element, i.e., the hydrogen
.
indicates the Bohr radius, and
is the distance (radius), in picometers
of electrons to the core.
The Bohr radius is defined as , is the Planck constant, is the mass of the electron, and its charge.
Figure 3 shows the radial distribution probability, for the 1st atomic orbital, using Equation (1). As we can see, the function rapidly decays with respect to its distance to the core.
The next functions correspond to the 2nd, 3rd, and 4th atomic orbitals for the hydrogen
With these radial distribution functions, a cumulative distribution should be built for each atomic orbital. Therefore, this probability approach is used to generate new park-location vectors, using any cumulative radial distribution.
4.4. Sampling
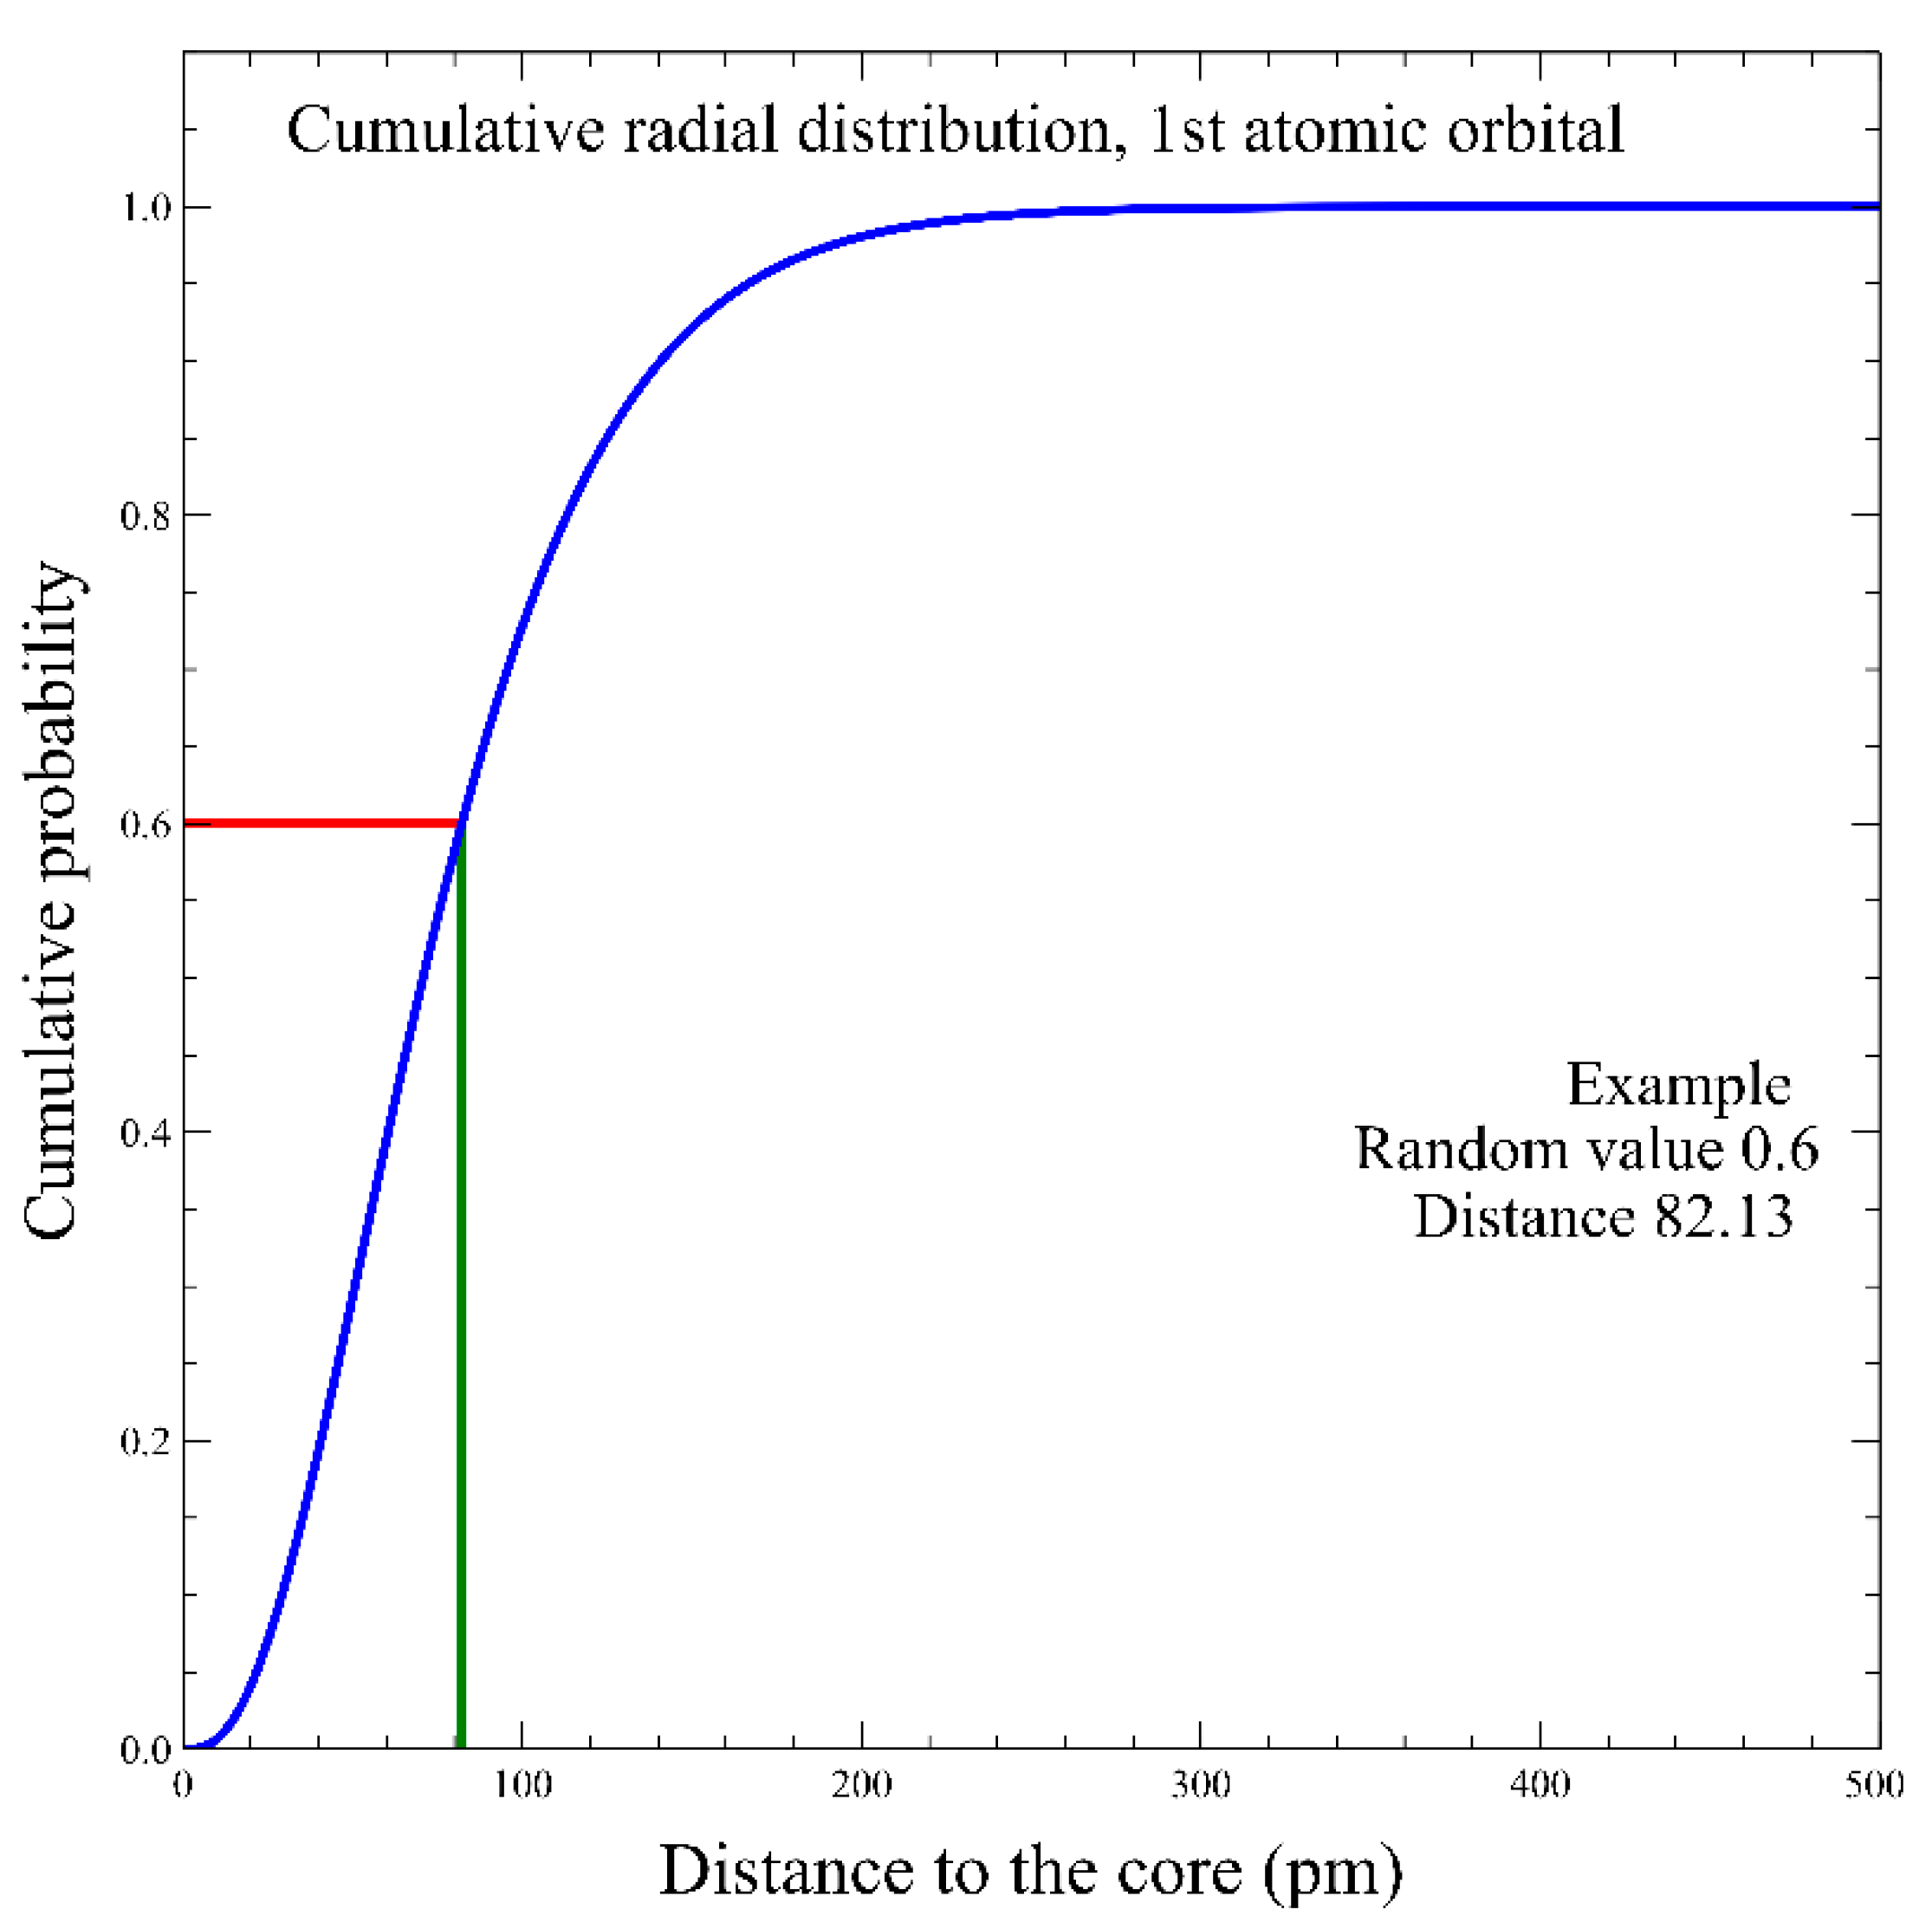
The process to sample offspring consists of three steps. Step one produces new tour vectors. This first step is executed through the partially mapped crossover (PMX) genetic operator. The second step builds new type-route vectors. The reciprocal exchange operator, also known as the swap operator, executes step two. The feasibility of the exchange is verified according to each type of customer involved in the exchange. If the feasibility is violated, the exchange is discarded. The process is repeated until the feasibility is guaranteed. Finally, step three generates new park-location vectors. This last step is performed through the aforementioned radial distribution. A random value should be generated if the customer will be served by a mixed route. Then, the corresponding random value, is interpolated in a cumulative probability distribution, previously selected, to identify which distance, between the electron and the core, should be established.
Figure 4 shows an example of this process.
Then, the previous distance, obtained from the cumulative distribution, is matched with the nearest distance between the current customer and the others to identify the park location.
4.5. Replacement
The offspring should be evaluated to obtain their fitness. Finally, the replacement process used in this study is by binary tournament between the parents and the offspring.
All the stages of the proposed algorithm have been defined. All of this, within a number of the generations.
The RHEDA–TTRP framework is provided below in Algorithm 1:
| Algorithm 1. RHEDA-TTRP framework |
| |
| |
| |
| |
| |
| |
| |
| |
| |
| |
| |
| |
| |
| |
| |
| |
| Output: Best |
5. Results and Comparison
The standard benchmarking dataset, for the TTRP, is used as input data for the mentioned comparison. These input data are based on [
30] instances. The aforementioned benchmarking instances can be found at
http://web.ntust.edu.tw/~vincent/ttrp/ ((accessed on 15 March 2021).
5.1. Comparison between Recent Algorithms—First Round
In order to validate the scientific relevance of this paper, recent algorithms are proposed as a benchmark for comparison with the RHEDA-TTRP scheme. The aforementioned recent algorithms are as follows:
- -
The algorithm detailed by [
30],
- -
The tabu search method presented by [
31],
- -
The simulated annealing heuristic designed by [
34],
Currently, the EDA approach does not outperform recent algorithms by itself. Therefore, RHEDA was not compared to the EDA.
Some metrics are considered in the comparison.
The relative percentage increase
is computed in order to compare the performance of each atomic orbital. The
is detailed as follows
where
is the distance travel obtained in the
th replication, and
is the best distance travel found and reported in the literature.
The mean absolute error (
MAE)
where
is the fitness obtained in the
th replication, and
is the best fitness.
The mean square error (
MSE)
Again, where
is the fitness obtained in the
th replication, and
is the best fitness. To account for the stochastic nature of the RHEDA-TTRP, we run 30 trials for each instance.
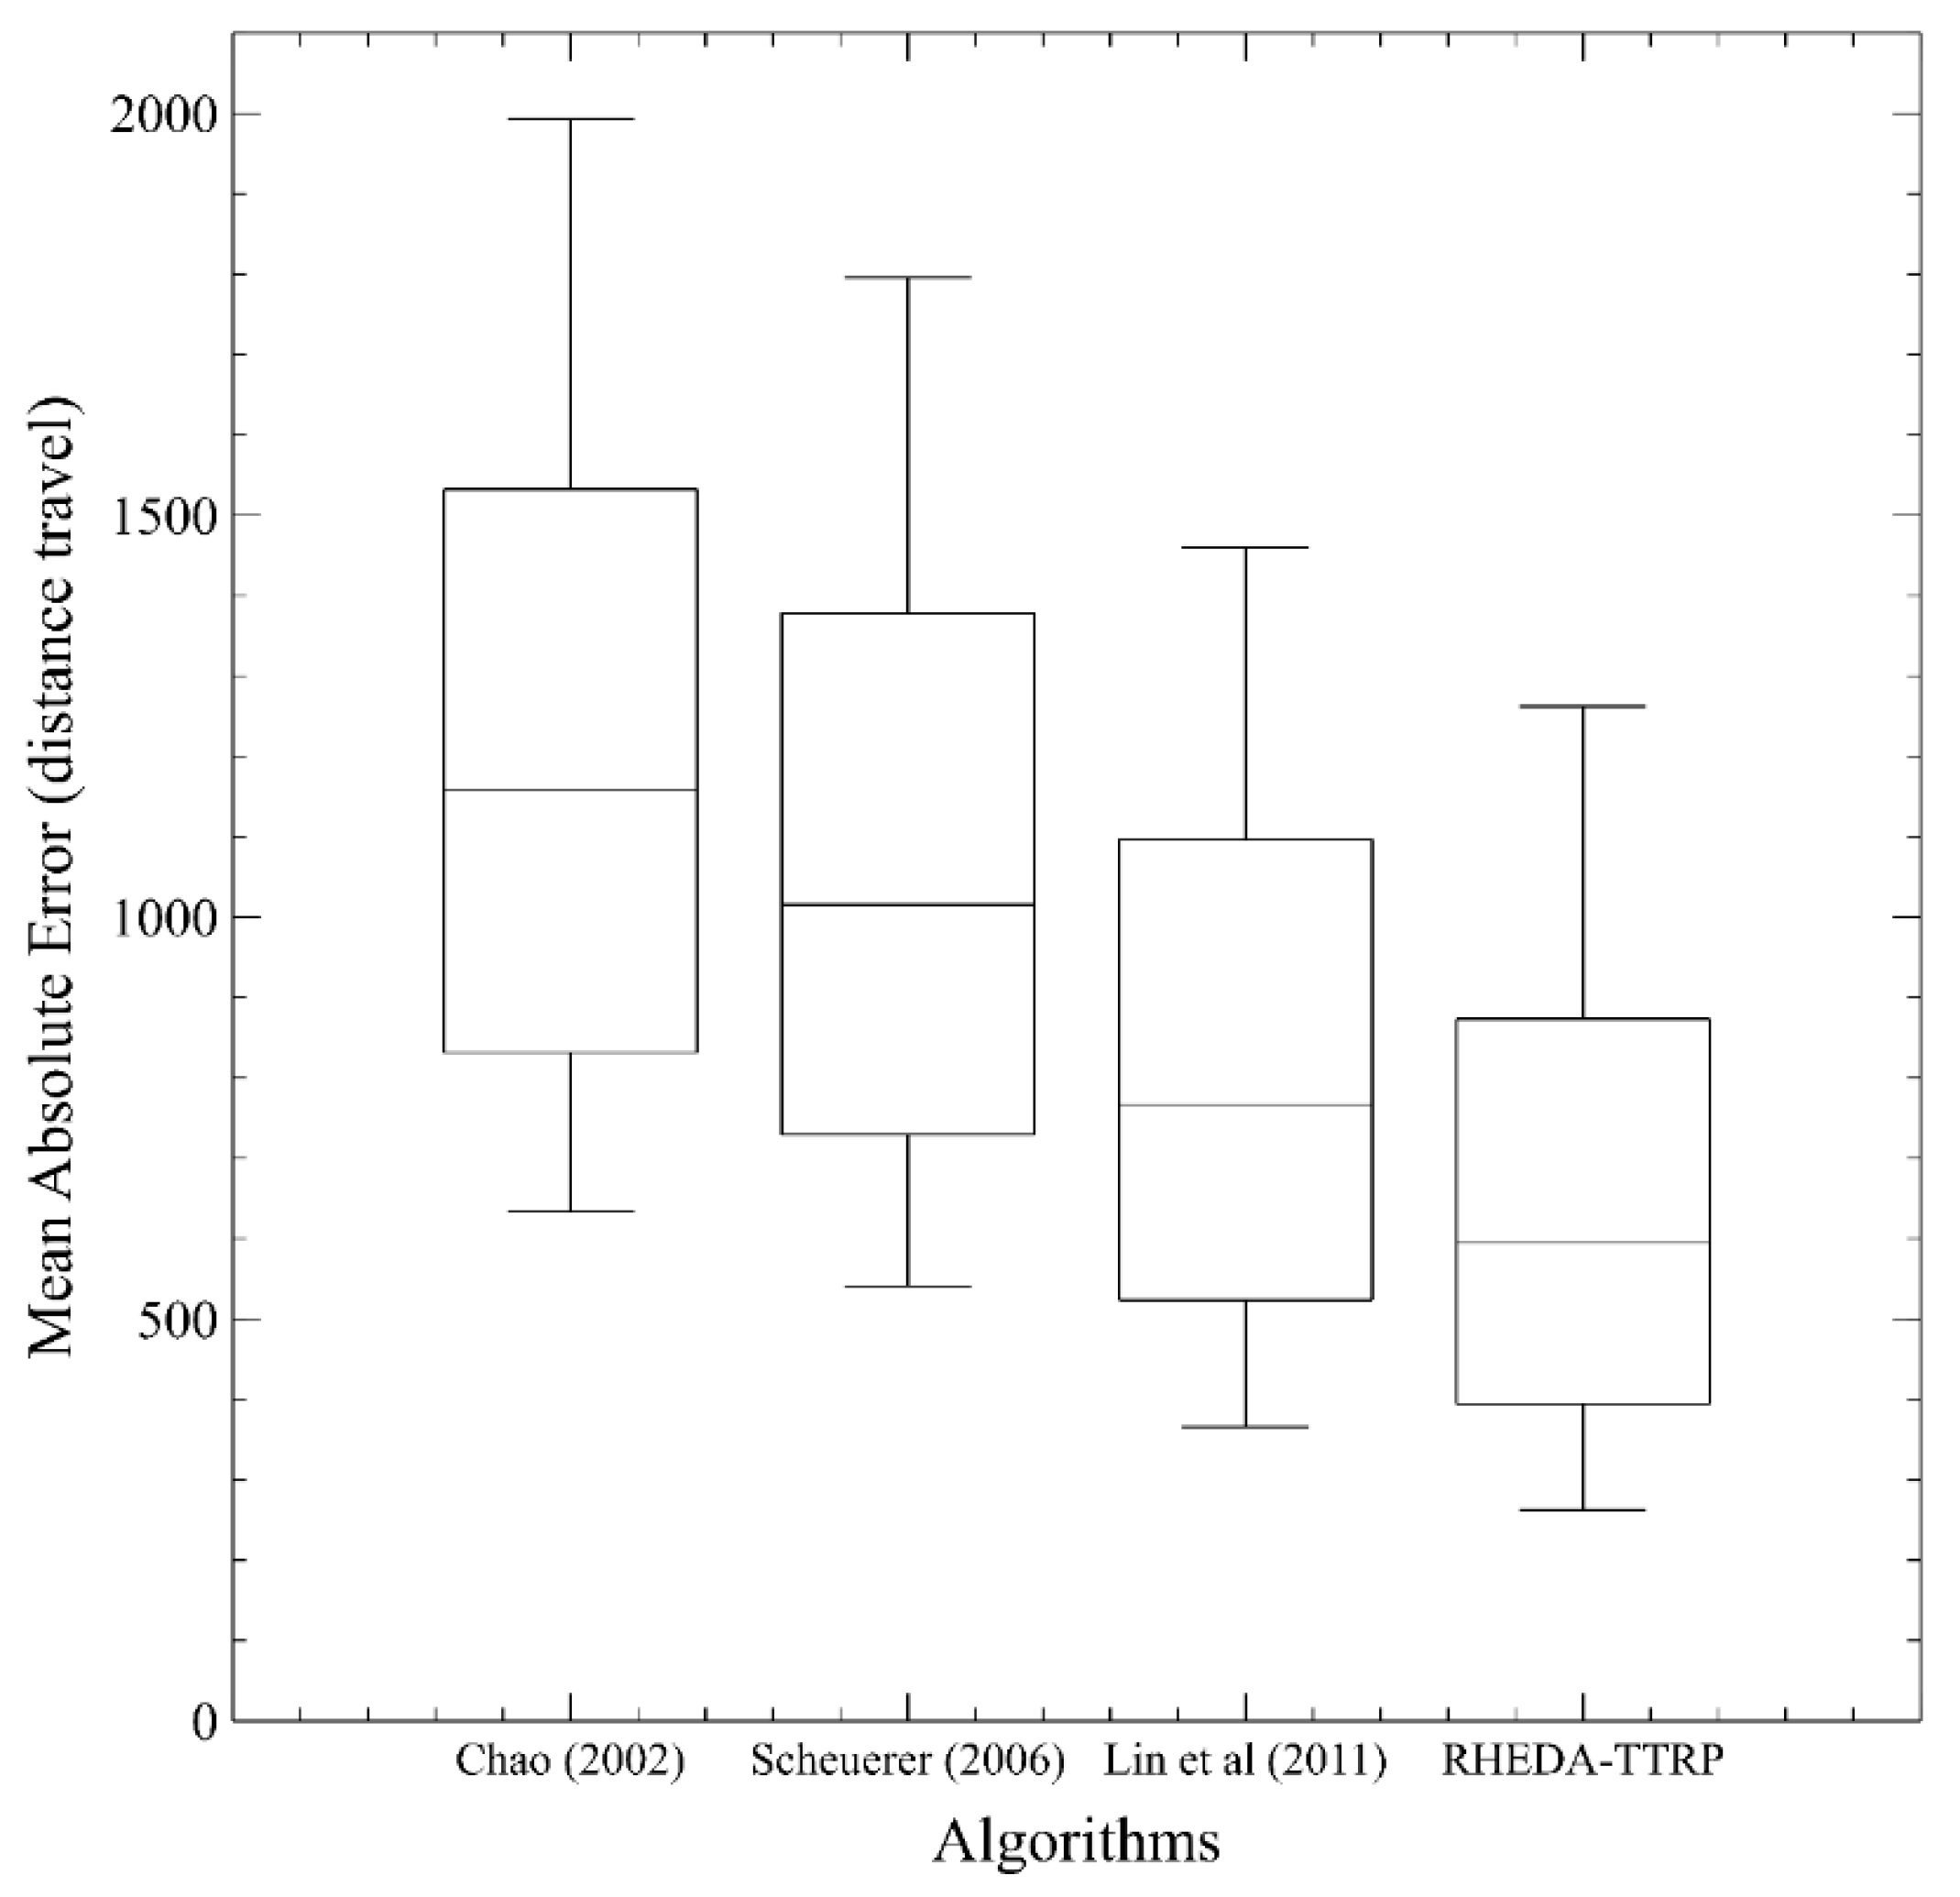
Figure 5 details the algorithm performance for the TTRP based on Equation (6). The RHEDA-TTRP manages to reduce the mean absolute error by 48% with respect to the average result of [
30], 40% with respect to the average result of [
31], and 20% with respect to the average result of [
34]. As we can see, the RHEDA-TTRP outperforms all the algorithms used in the comparison.
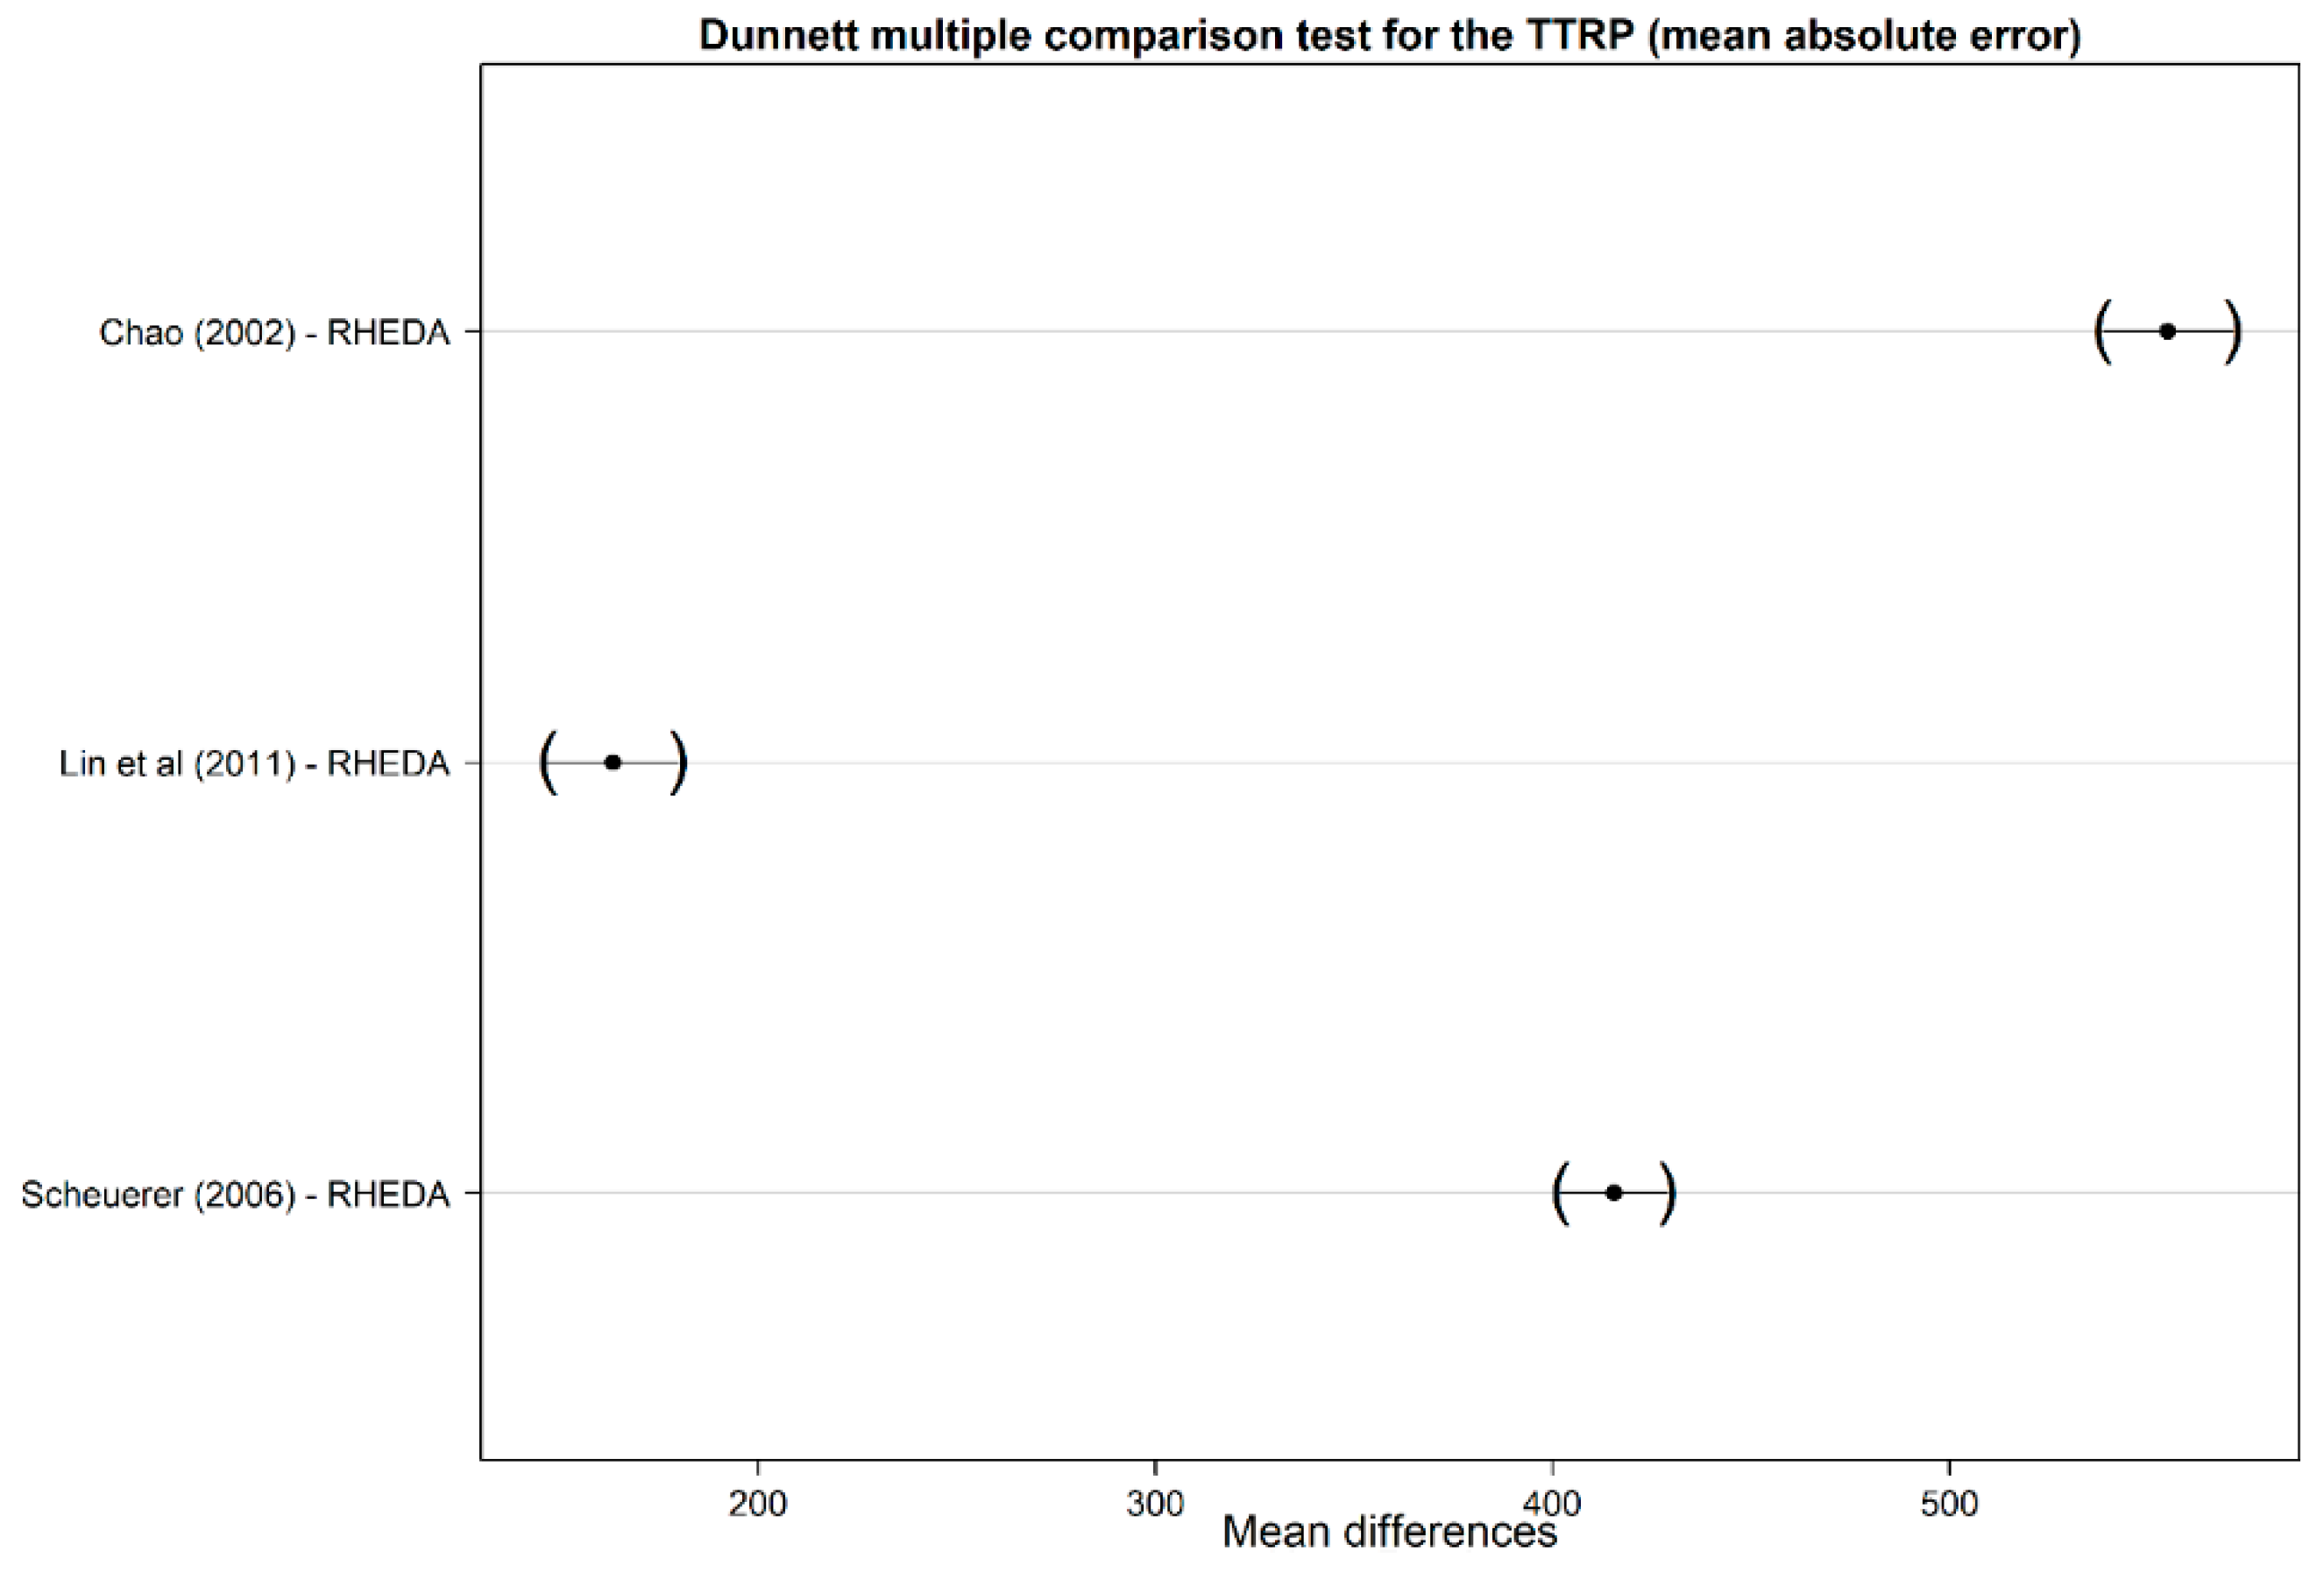
Figure 6 indicates a Dunnett test; there is a statistically significant difference between all the recent algorithms and the RHEDA-TTRP scheme. Based on Equation (6), the RHEDA-TTRP scheme outperforms all the recent algorithms for the TTRP.
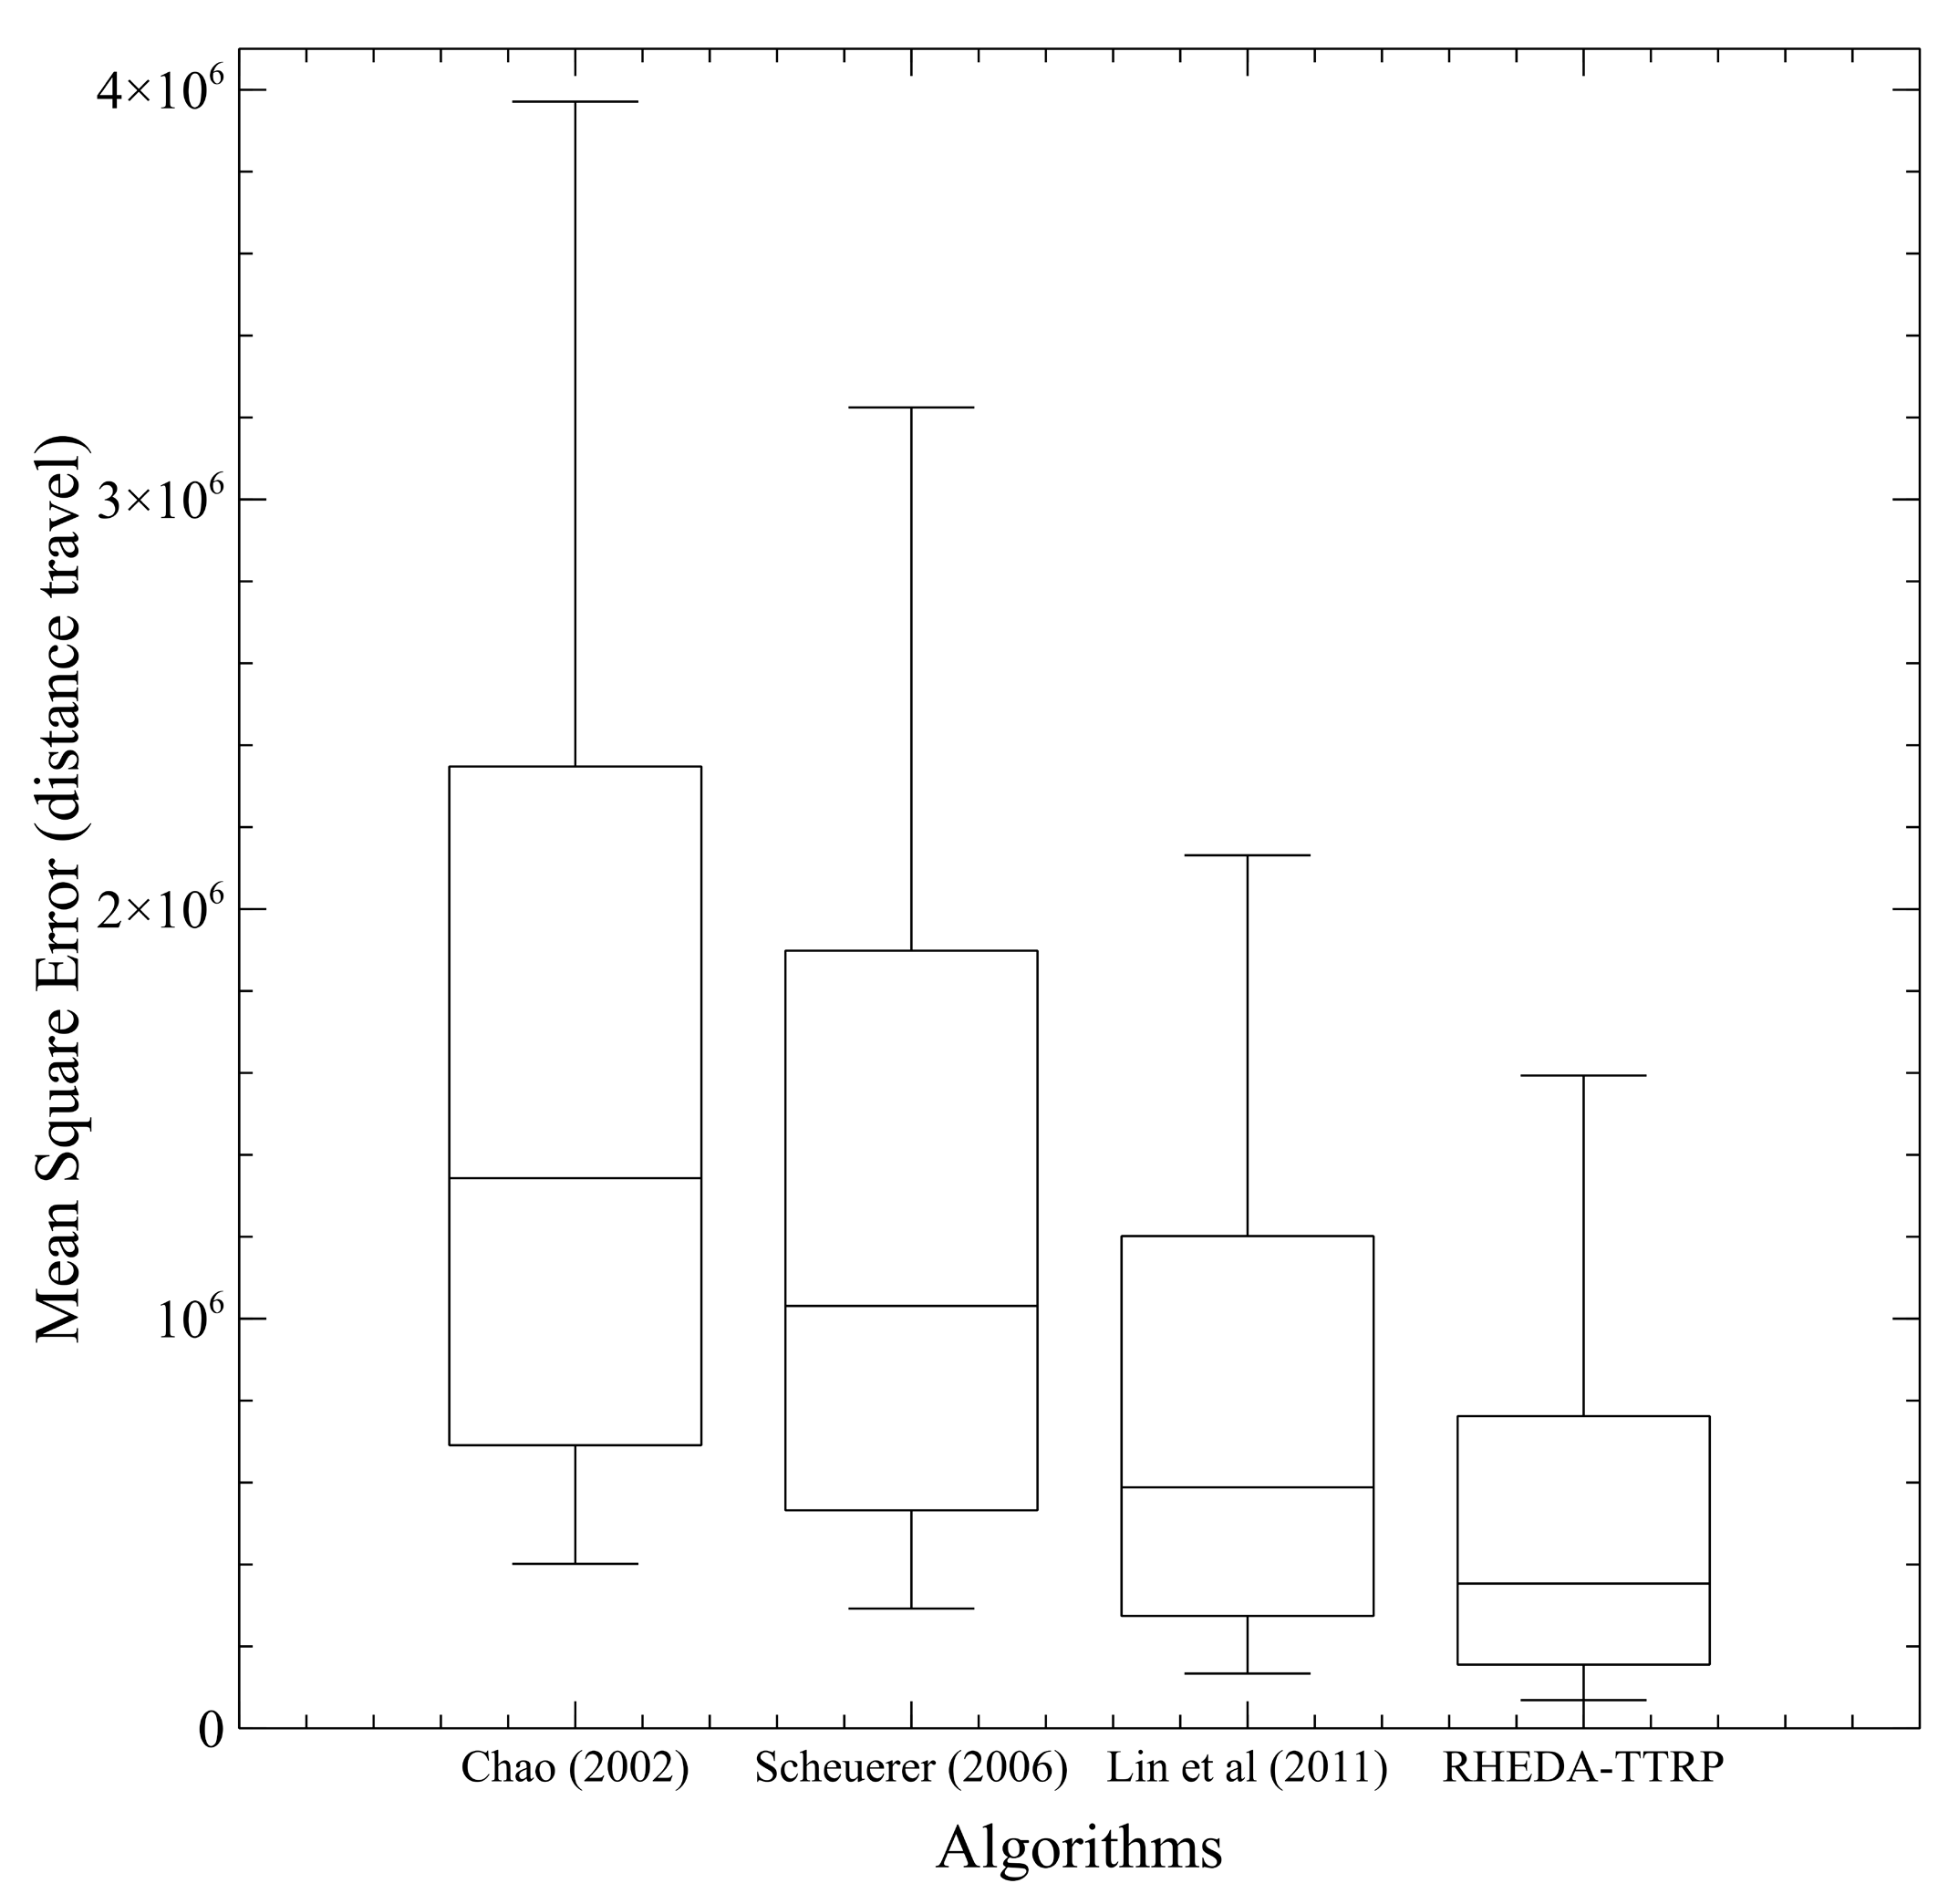
Figure 7 depicts the algorithm performance for the TTRP based on Equation (7). The RHEDA-TTRP manages to reduce the mean square error by 74% with respect to the average result of [
30], 65% with respect to the average result of [
31], and 30% with respect to the average result of [
34]. Again, the RHEDA-TTRP outperforms all the algorithms used in the comparison.
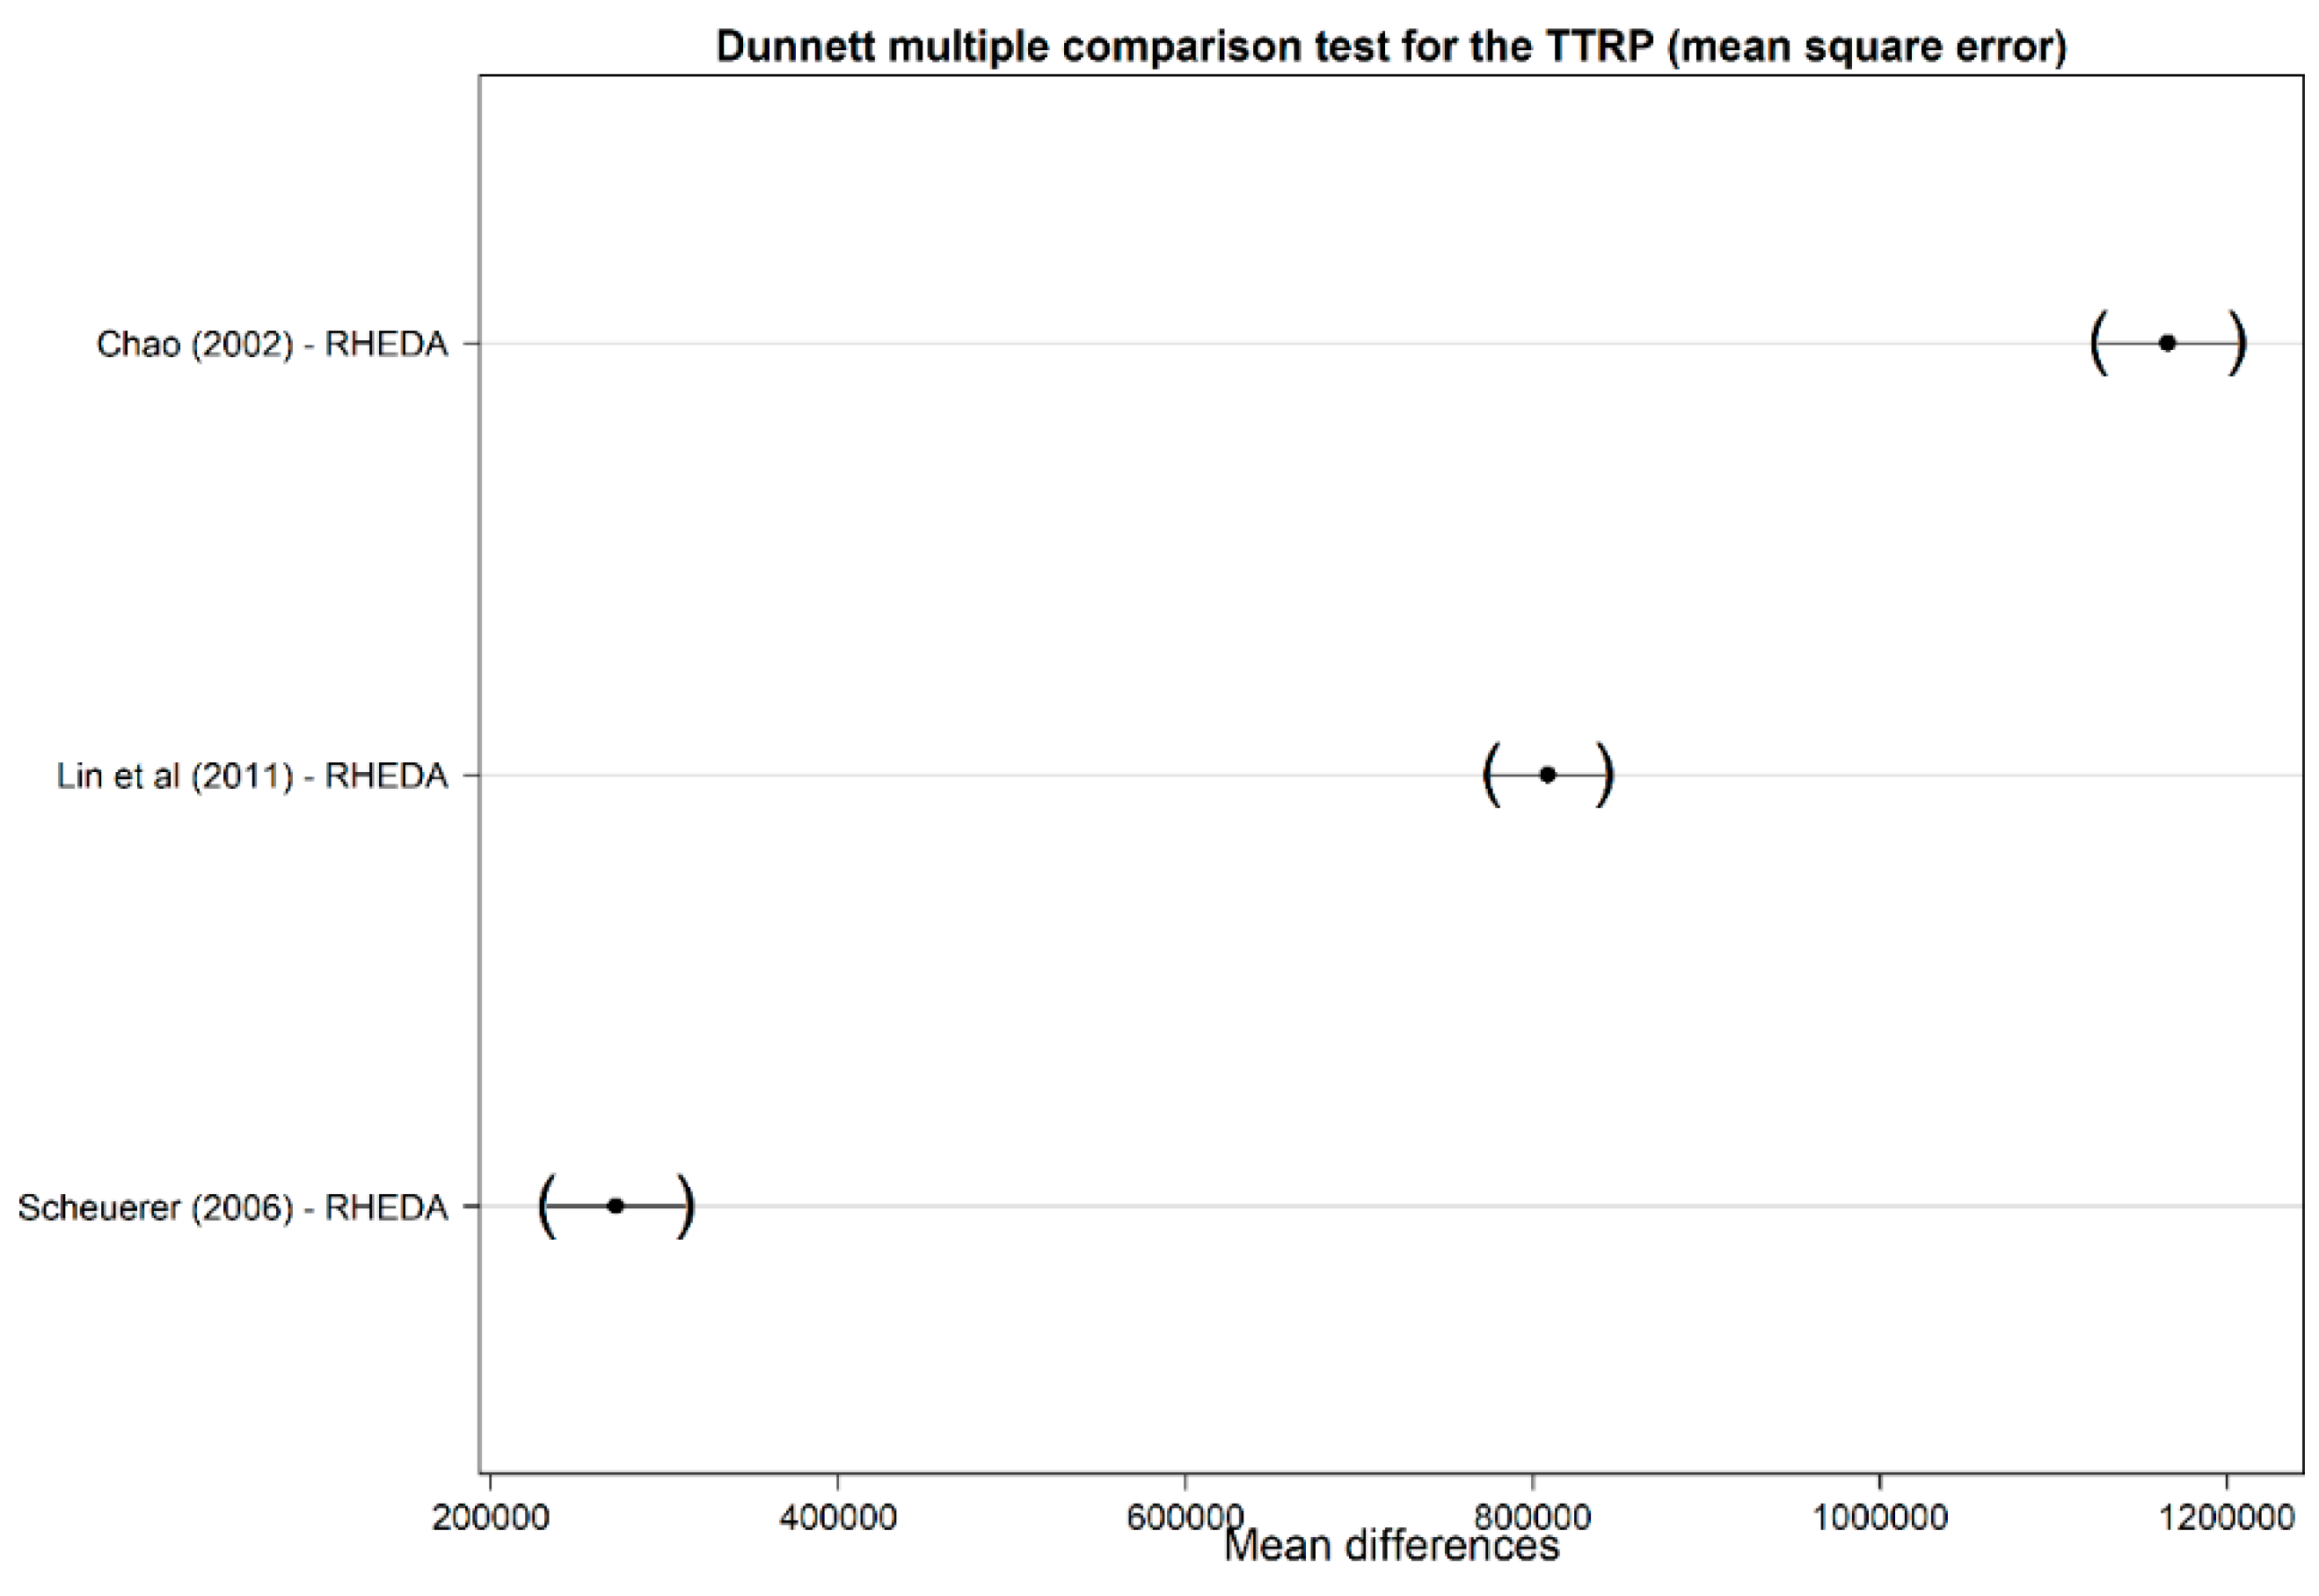
Figure 8 details another Dunnett test; there is a statistically significant difference between all the recent algorithms and the RHEDA-TTRP scheme. Based on Equation (7), the RHEDA-TTRP scheme outperforms all the recent algorithms for the TTRP.
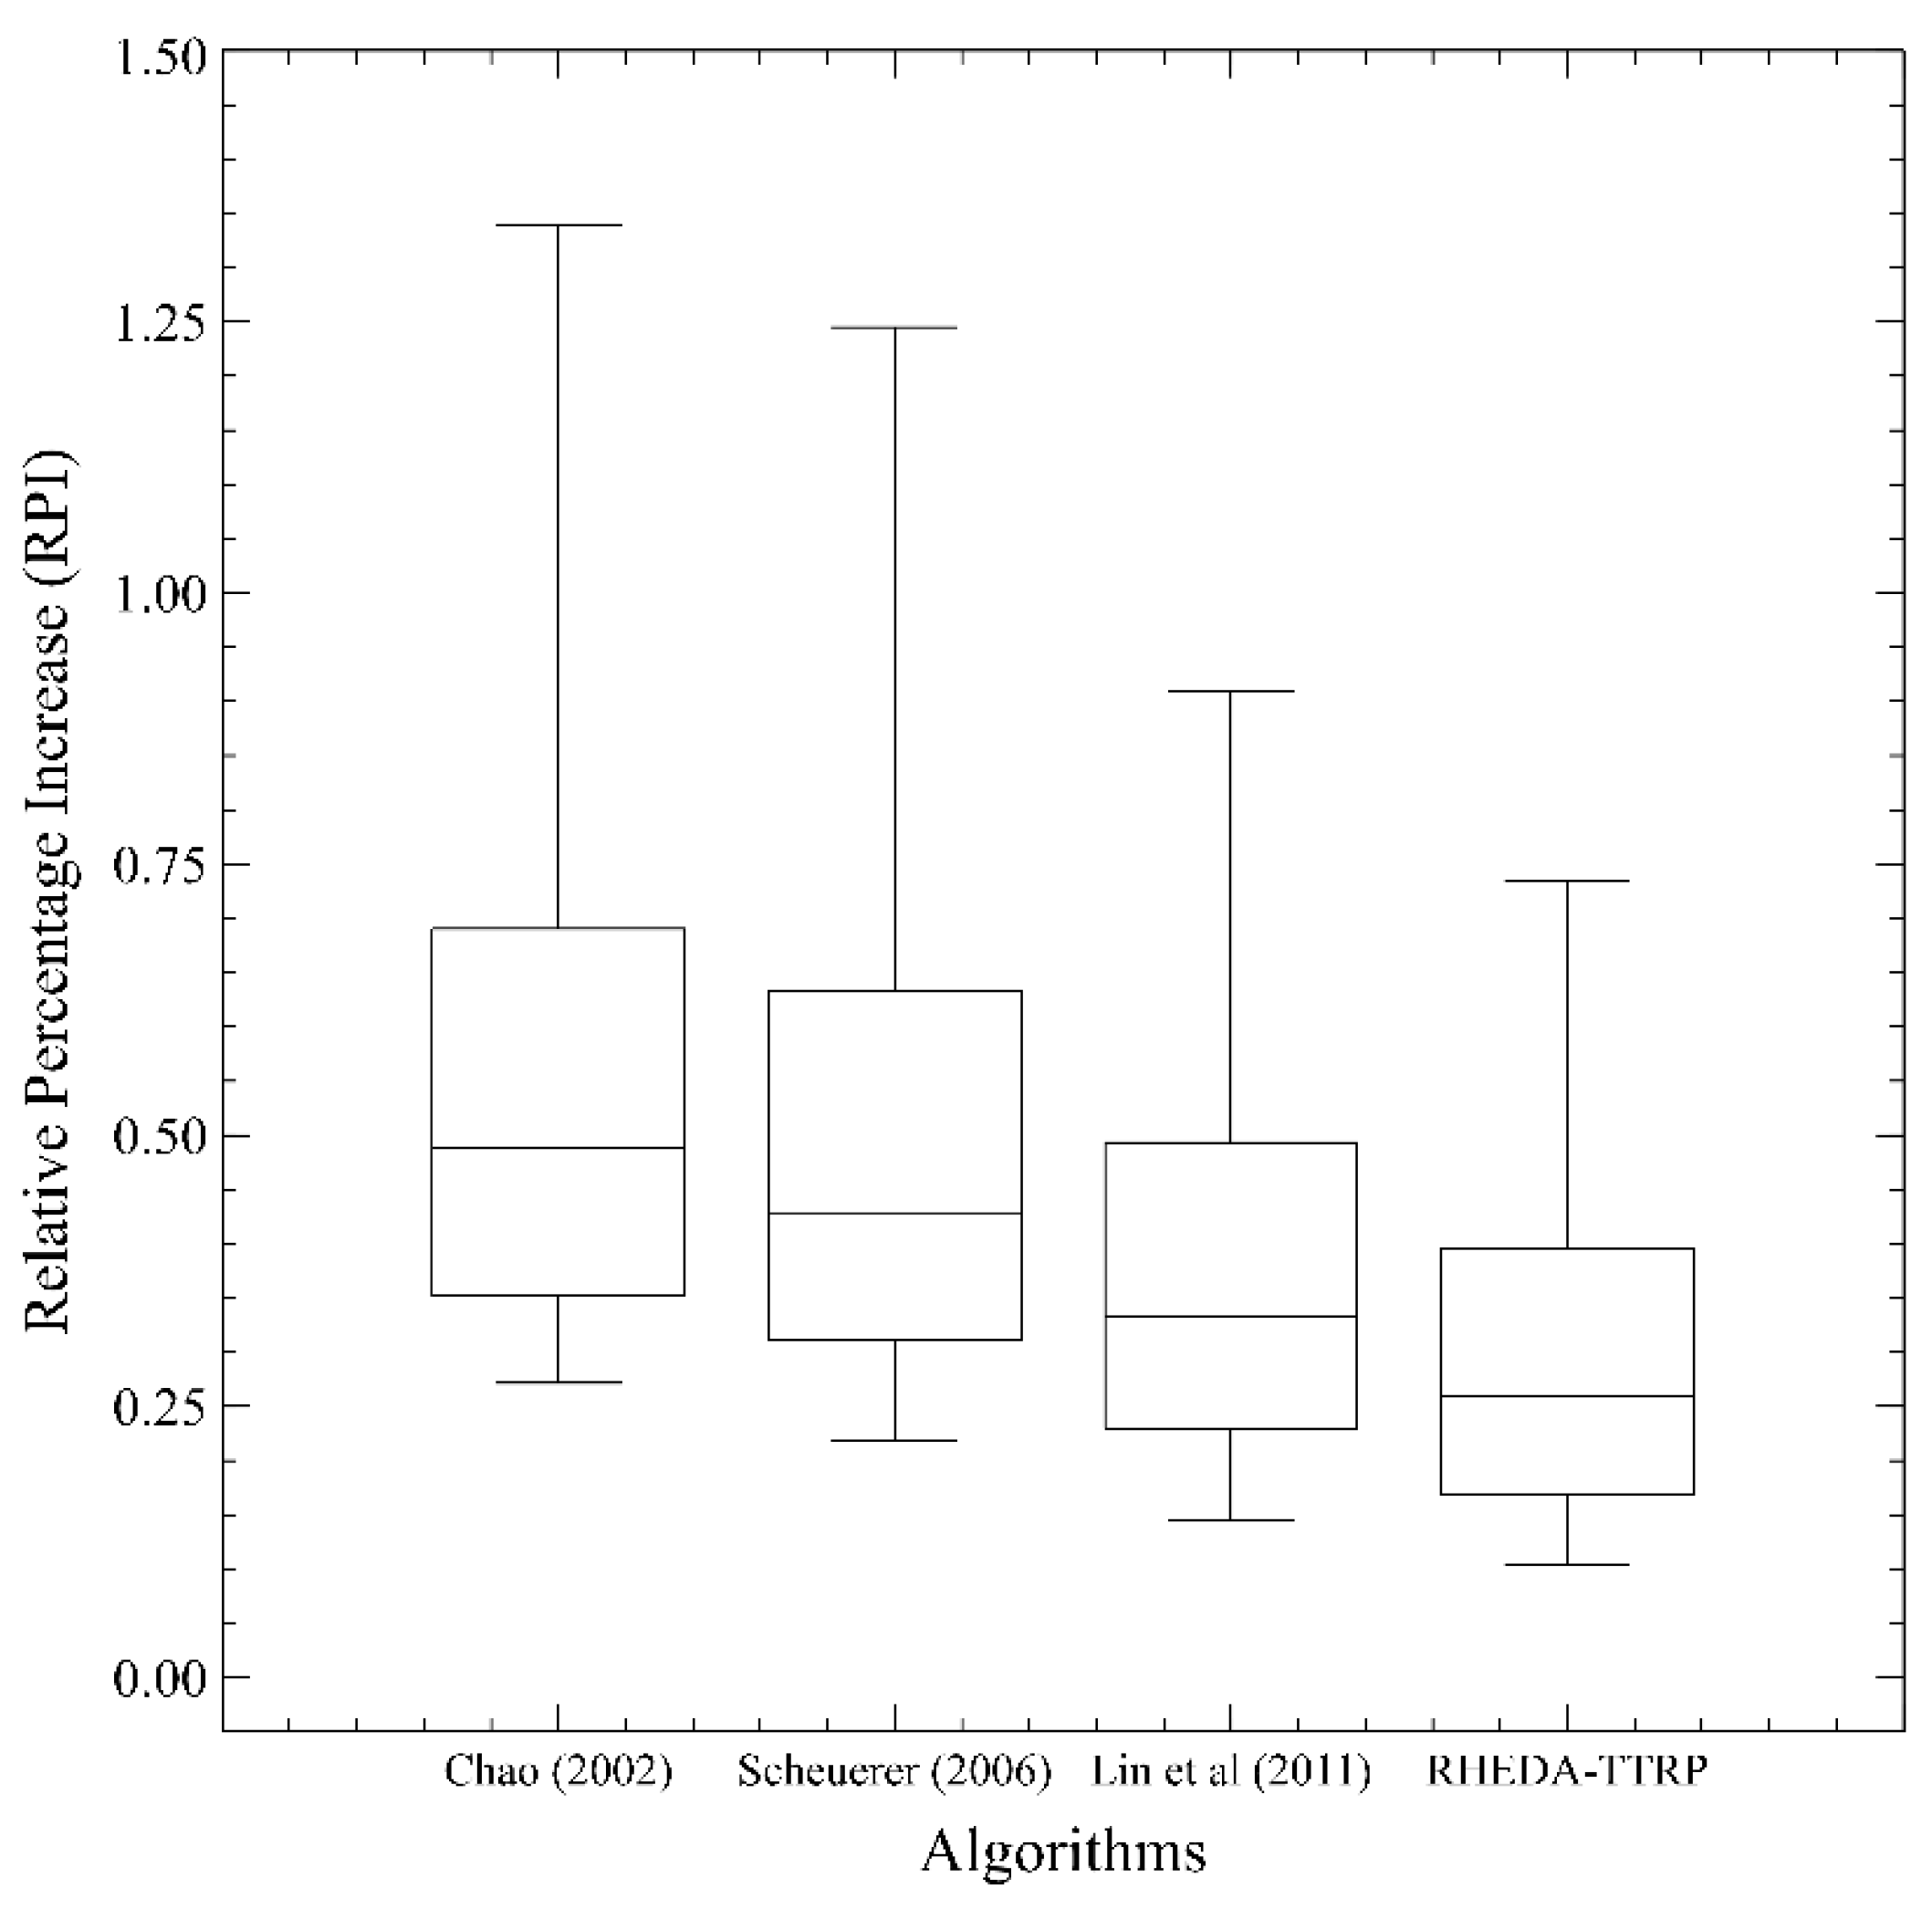
Figure 9 shows the algorithm performance based on Equation (5). The RHEDA-TTRP manages to reduce the relative percentage increase by 50% with respect to the average result of [
30], 41% with respect to the average result of [
31], and 33% with respect to the average result of [
34]. Again, the RHEDA-TTRP scheme outperforms all the previous results.
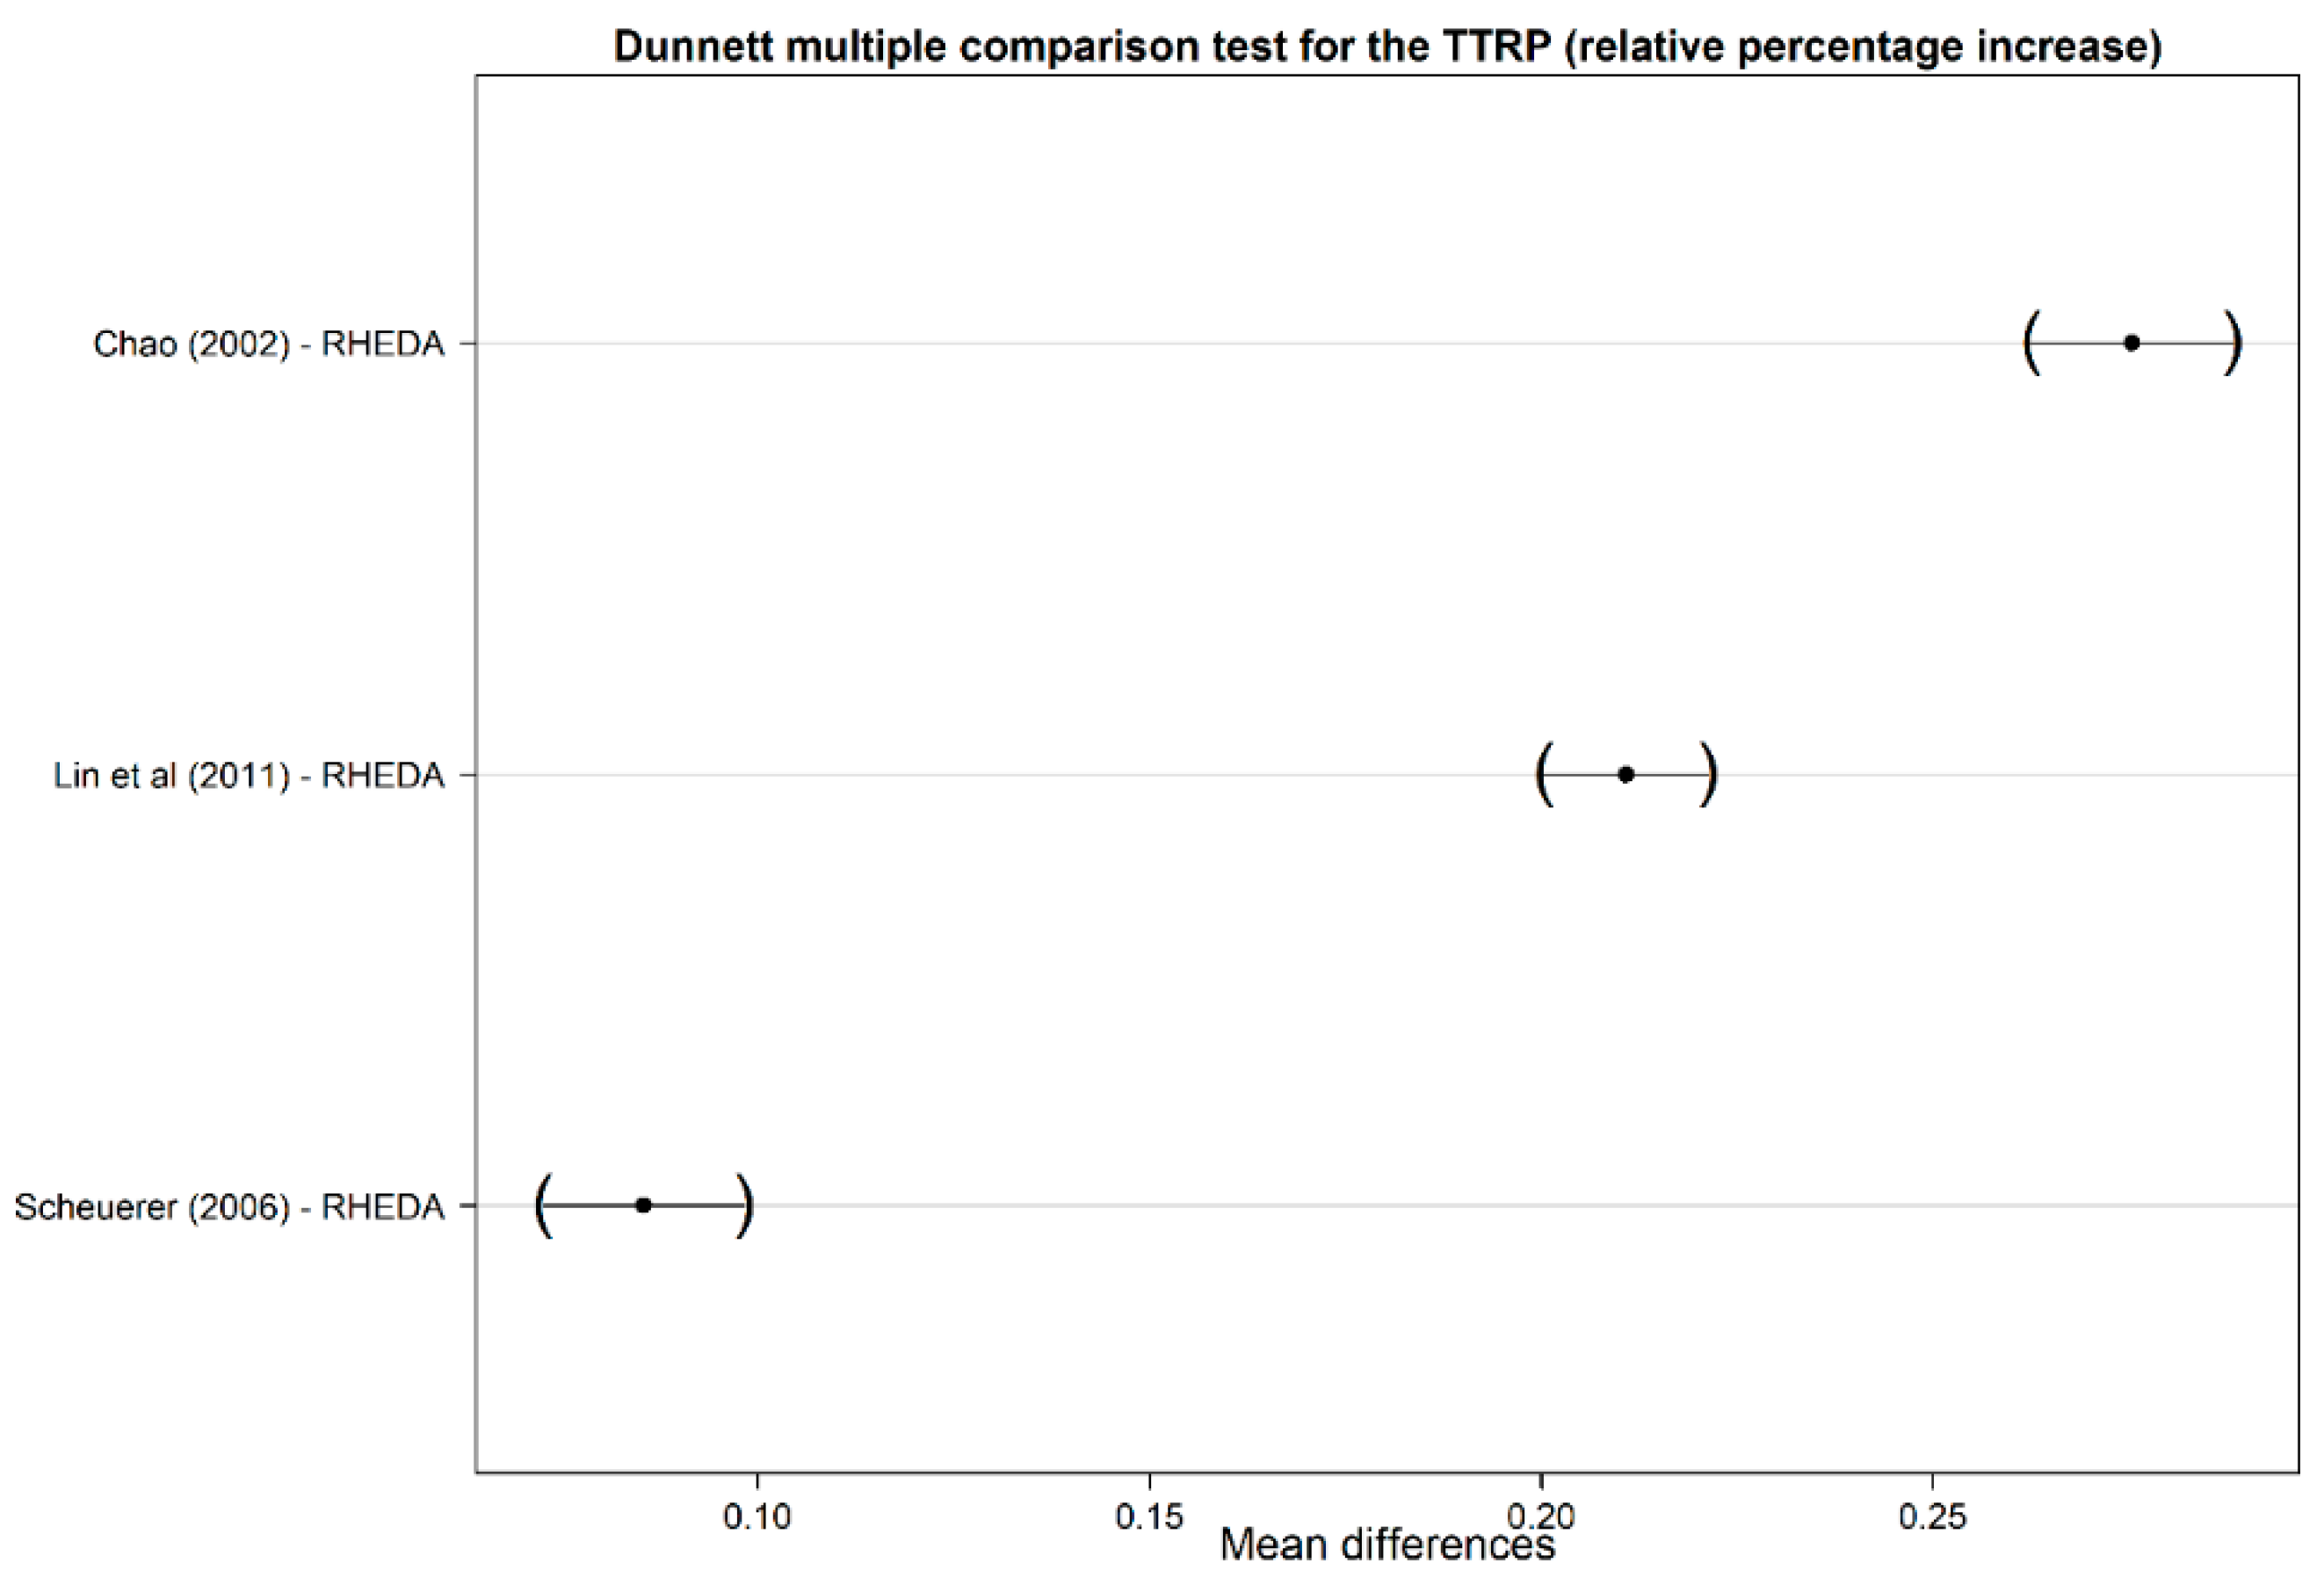
Figure 10 indicates a last Dunnett test; there is a statistically significant difference between all the recent algorithms and the RHEDA-TTRP scheme. Based on Equation (5), The RHEDA-TTRP scheme outperforms all the recent algorithms for the TTRP.
As we can see, by using three different metrics, the RHEDA-TTRP outperforms the recent algorithms for the TTRP. We can conclude that the radial distribution of the hydrogen is suitable and competitive against hybrid procedures to find the best routings for the TTRP. The RHEDA-TTRP does not need to be hybridized to find the best solutions for the TTRP.
5.2. Comparison between Recent Algorithms—Second Round
Other recent algorithms are proposed to continue the validation of the RHEDA-TTRP scheme. The aforementioned recent algorithms are as follows
- -
The algorithm detailed by [
37],
- -
The simulated annealing heuristic designed by [
38],
- -
The bat algorithm presented by [
39],
The same metric detailed in
Section 5.1, i.e., the RPI is used to compare the efficiency of the algorithms.
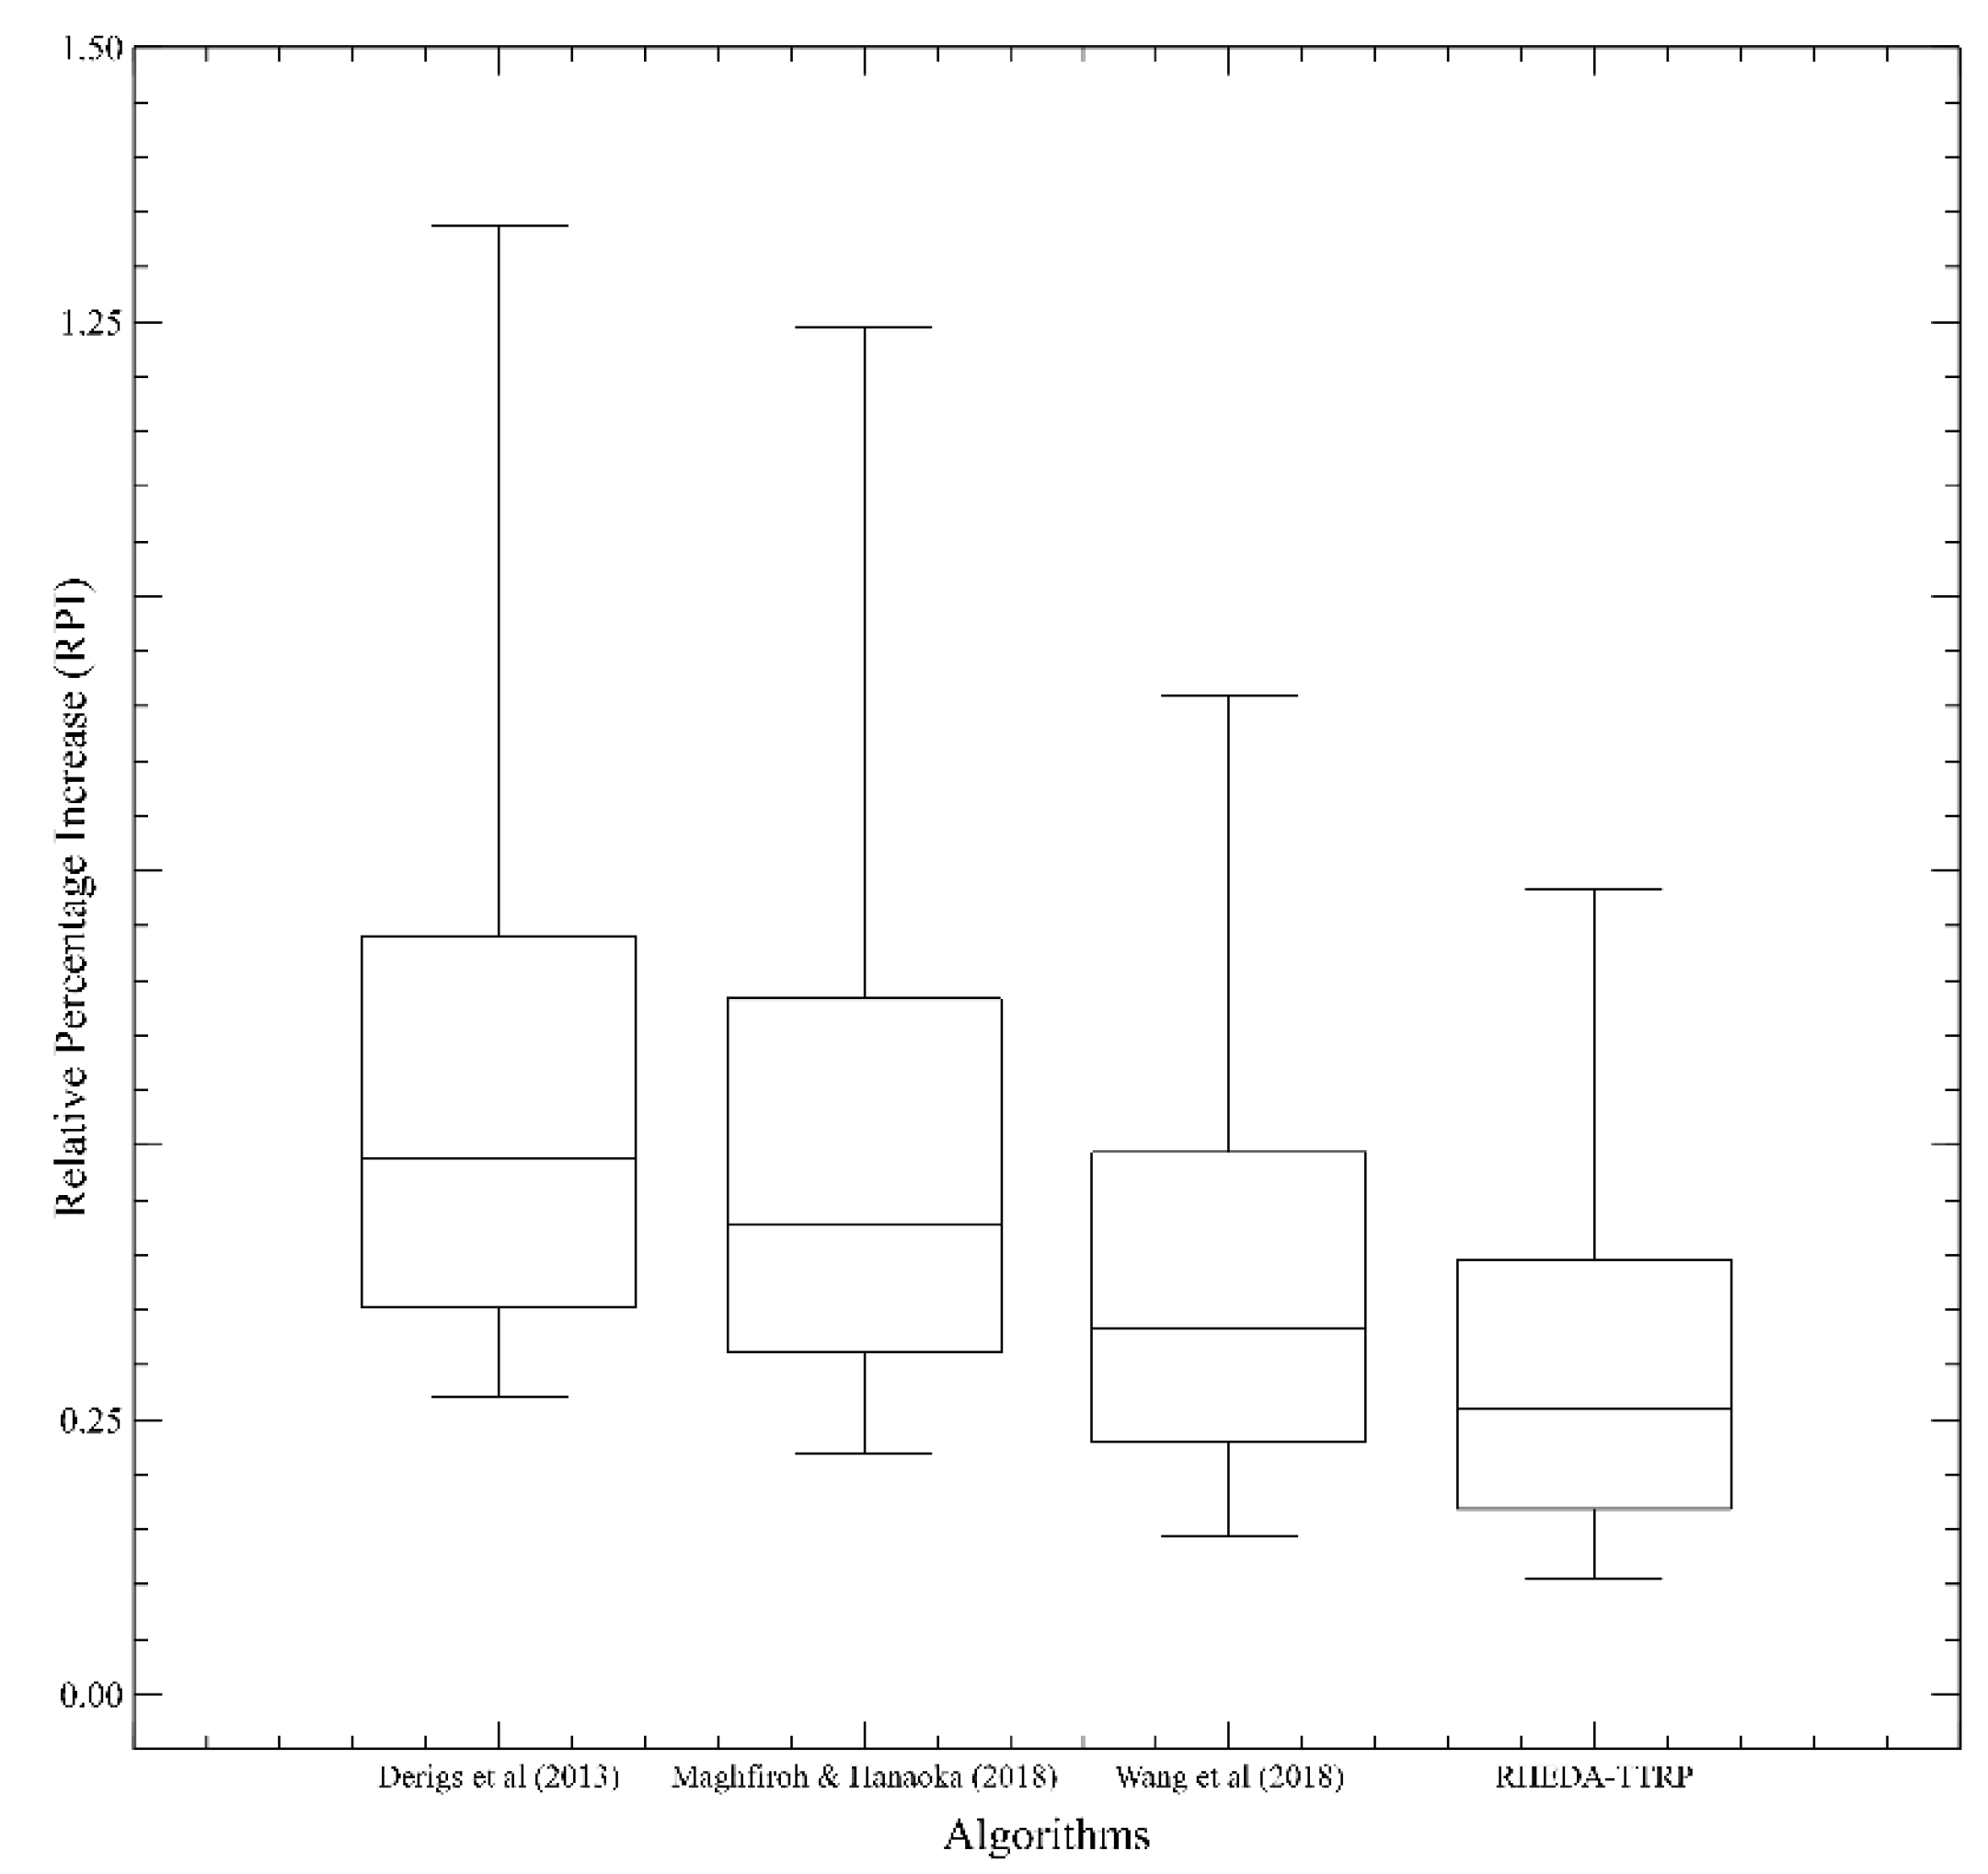
Figure 11 depicts the algorithm performance based on Equation (5). Again, the RHEDA-TTRP scheme outperforms all the previous results.
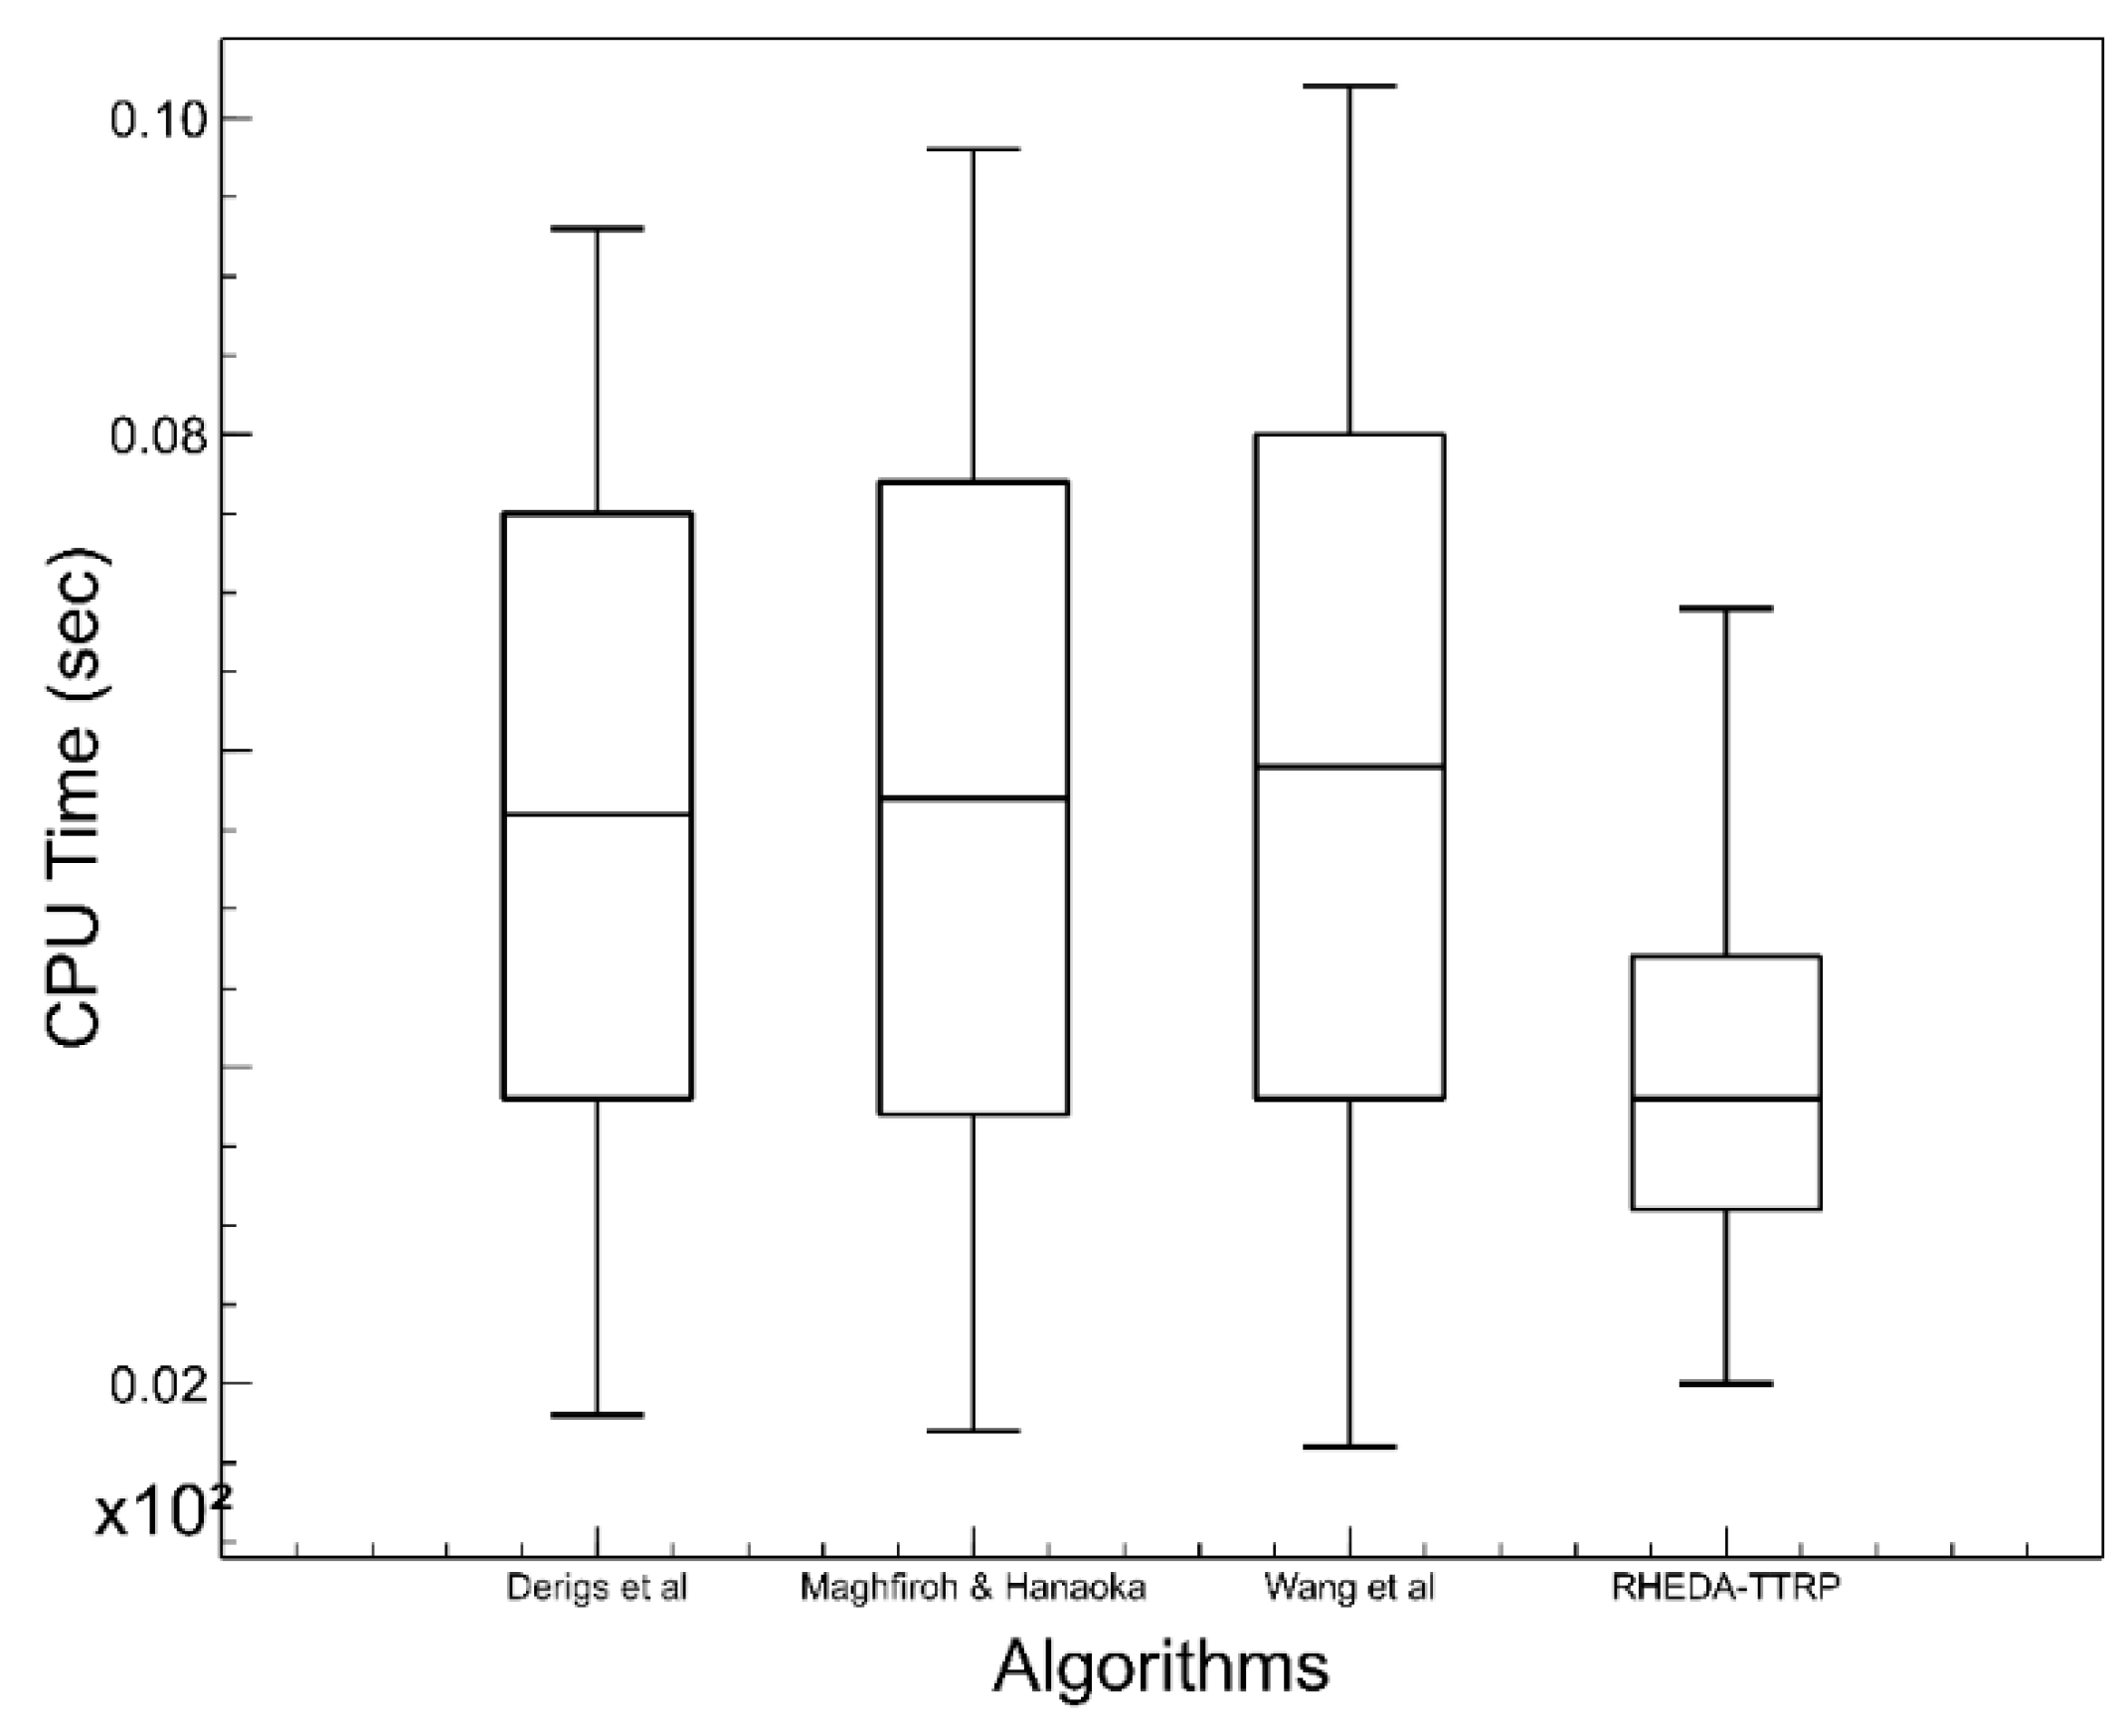
The computational time comparison is depicted in
Figure 12.
6. Conclusions
A discussion of the truck and trailer routing problem, which considers different routings, for each vehicle, as many logistics environments are detailed in this paper. The problem is pivotal for the efficient management and control of routing systems. To tackle the problem, the RHEDA-TTRP scheme is proposed. By means of diverse numerical experiments and comparisons, the RHEDA-TTRP offers a competitive performance. In addition, the RHEDA-TTRP approach produces promising solutions. Implementing these solutions can improve customer service by delivering orders on time and avoiding delays in other process stages.
Since the RHEDA-TTRP presents stability, it appears very suitable for implementation in software systems for practical purposes. The potential of the RHEDA-TTRP approach to solving the TTRP problem is detailed by the present results with several examples. The results encourage the development of an optimization technique based on a probability model to resolve real-world TTRP problems.
This research concludes that radial probability functions should be integrated with the EDA scheme to tackle optimization issues, such as TTRP.
We establish the premise that other radial probability distributions might work better than hydrogen radial function because this one is simpler than others.
Based on the performance of the proposed scheme, we can conclude that incorporating radial probability distributions helps to improve the estimation of distribution algorithms.
The RHEDA-TTRP is able to produce feasible solutions according to different constraints detailed in the problem statement section of this paper. It was not necessary to repair the solutions as other algorithms were used for permutation-based problems. On the other hand, the RHEDA-TTRP is not flexible enough to handle new and unexpected requirements for the dynamic TTRP. The proposed method is currently in the prototype phase for users. Therefore, it is expected that industrial practitioners will find the RHEDA-TTRP beneficial to their business when it is ready for them.
According to the results above, the RHEDA-TTRP keeps exploitative and exploratory capability in the evolutionary progress. This is due to the fact that all the vectors obtained from the radial function are valid to find the best one.
A list of items that future research needs are detailed below:
More radial probability distributions, from other elements, not only the hydrogen, for the TTRP and other combinatorial problems, should be considered in future research.
Dynamic logistics issues should be included, in light of these results, for building new evolutionary algorithms coupled with other radial probability functions.
Furthermore, the results of this research suggest testing the RHEDA-TTRP on other related dynamic issues (traffic, heterogeneous fleet) of the routing systems.
Since the RHEDA-TTRP presents stability, it appears very suitable for implementation in software systems for practical purposes.
Further research directions may deal with an extension of the RHEDA-TTRP for building effective modules for specific users in the transportation sector. Finally, the RHEDA-TTRP could be used in other types of routing systems.
We conclude that the TTRP by means of a radial probability model has not been sufficiently considered in the literature. Thus, it might be worthwhile providing a different approach, which integrates decisions on these dynamic issues in order to minimize the total travel distance.


