Abstract
Nonlinear frequency coupling is assessed with bispectral measures, such as bicoherence. In this study, BisQ, a new bicoherence-derived index, is proposed for assessing nonlinear processes in cardiac regulation. To find BisQ, 110 ten-minute ECG traces obtained from 55 participants were initially studied. Via bispectral analysis, a bicoherence matrix (BC) was obtained from each trace (0.06 to 1.8 Hz with a resolution of 0.01 Hz). Each frequency pair in BC was tested for correlation with the HRV recurrent quantification analysis (RQA) index Lmean, obtained from tachograms from the same ECG trace. BisQ is the result of adding BC values corresponding to the three frequency pairs exhibiting the highest correlation with Lmean. BisQ values were estimated for different groups of subjects: healthy persons, persons with arrhythmia, persons with epilepsy, and preterm neonates. ECG traces from persons with arrhythmia showed no significant differences in BisQ values respect to healthy persons, while persons with epilepsy and neonates showed higher BisQ values (p < 0.05; Mann-Whitney U-test). BisQ reflects nonlinear interactions at the level of sinus-and atrial-ventricular nodes, and most likely cardiorespiratory coupling as well. We expect that BisQ will allow for further exploration of cardiac nonlinear dynamics, complementing available HRV indices.
1. Introduction
The nonlinear nature of both electrocardiograms (ECG) and heart rate variability (HRV) is widely documented [1]. This study explains several attempts to introduce indices purportedly characterizing nonlinear heart dynamics [1,2,3,4,5,6].
Among nonlinear HRV indices, those derived from recurrent quantification analysis (RQA) have been particularly appealing. It has been suggested that RQA-derived HRV features are even capable of catching “the brain’s ability to subtly and appropriately respond, both cognitively and emotionally, to minor changes in environmental demands” [3].
Cardiovascular signals seem to emerge from an intricate combination of periodic, quasi-periodic, linear and nonlinear, Gaussian and non-Gaussian, stochastic and deterministic interactions [4,5,6]. Accordingly, the implementation of methods based on considering some of these interactions while ignoring the contribution of others can lead to deceptive interpretations. One example might be the observed high association between HRV indices apparently related to completely different dynamical underlying mechanisms. Thus, the standard deviation along the line-of-identity of the Poincaré plot (denoted by SD2), which was regarded as a novel nonlinear feature corresponding to long-term heart rate variability, has shown to be analytically related to classical time-domain linear measures standard deviation of RR intervals (SDNN) and standard deviation of successive RR interval differences (SDSD). As the authors of paper [7] pointed out: “In fact, the width of the Poincaré plot is a linear scaling of the most common statistic used to measure short-term HRV, the SDSD index. In other words, the width of the Poincaré plot should correlate extremely highly with other measures of short-term HRV, which it does. In this sense, any interpretation of SD2 as reflecting HRV nonlinear dynamics merely because it is obtained from a Poincaré plot is not sustained. The same is valid for SD1, that is highly correlated with the (linear) spectral measure HF (R = 0.93), as well as RMSDD (R = 0.99 [8]). Similarly, a very strong association was found between heart rate and a group of RQA-derived indices [9].
Given the capability of RQA-based nonlinear HRV measures to catch subtle changes in cardiovascular dynamics, it is plausible to expect that measures based on higher order spectral analysis might further boost cardiovascular exploration with nonlinear methods.
ECG signals exhibit nonlinear and non-Gaussian characteristics, such as the presence of phase coupling among frequency components, and higher order spectra might allow assessing of these processes. In particular, bispectrum and bicoherence are useful to extract the degree of quadratic phase coupling between involved frequency components and are robust to the presence of Gaussian noise [10].
Attempts to apply bispectral analysis to the ECG are not new [4,11]. Indeed, features derived from bispectral ECG analysis have been applied to detect cardiac arrhythmic events [12], the presence of late potentials [13,14], ischemic heart conduction impairments associated to atrial fibrillation [15], as well as for atrial arrhythmia classification [16].
Higher order spectra have also been extracted from cardiac tachograms. Chua et al. have analyzed cardiac arrhythmias using bispectrum invariant features and phase entropies obtained from cardiac tachograms [10]. HRV bispectrum has been proposed for the classification of maternal status during healthy pregnancy and postpartum [17], for diabetes detection [18] as well as for exploring cardiovascular changes related to heart transplant [19].
Buzsáki [20,21,22] has suggested that coupling of different rhythms has played a crucial role in the evolutionary optimization of brain function. This could also be extensible to other rhythmic processes in the human body, many of them coupled to brain processes [23]. Detecting frequency coupling and also the specific frequency pairs involved can be an interesting avenue for the study of nonlinear regulation of cardiovascular activity.
We expect that bispectral analysis can contribute to the identification of physiologically relevant nonlinear interactions, and, most likely, go beyond the traditional use of bispectral analysis for finding new features for automatic classification of heart conditions. As stated by Hagiwara and Faust, bispectrum-derived nonlinear features might allow one to “…interpret nonlinear features, extracted from ECG signals, in terms of the pathological changes they indicate. That interpretation is a step away from the pure pragmatism which is usually applied by biomedical engineers when they select a feature based on objective performance criteria. The interpretation of the nonlinear features leads to an idealistic increase in knowledge about the human heart and its physiology. That increase in knowledge translates into a better understanding of the current methods and it gives clarity about future directions for diagnosing diseases” [24].
In this study, we are trying to combine the advantage of RQA analysis from tachograms and the bispectral analysis of original ECG signals. If we limit ourselves to power spectrum and bispectrum, we can in principle obtain a good reconstruction of the original signal, thanks to the possibility to recover phase information about each periodic component. Thus, with the information about power spectrum and bispectrum of ECG we can have a good surrogate of the original ECG. From that reconstructed ECG, it would in principle be possible (at least theoretically) to obtain an RR series. If the same is done with the spectrum and the bispectrum of a tachogram, we would be able to recover the original RR series, but from such a series, it would be impossible to obtain the ECG trace the tachogram proceeds from. This example illustrates the advantages of bispectral analysis from ECG traces. Regarding physiological interpretation, the meaning of the three frequency bands typically present in the HRV spectrum is far from straightforward, whereas some frequencies in an ECG trace can have direct meaning, as the heart rate, atrio-ventricular node rate, and respiratory modulation.
Furthermore, tachograms and traditional HRV features (including RQA) are derived primarily from ECG signals, and this makes it reasonable to compare bispectra acquired from an ECG with HRV measures that, certainly, originate from the same ECG recording.
In this research, we explore whether individual frequency pairs of a bicoherence matrix are associated to some of the RQA-derived HRV features. This initial exploration suggested for us a roadmap to find an index, named bispectral quotient (BisQ), conformed from specific elements of a bicoherence matrix that are maximally correlated with a well-known nonlinear EEG measure derived from recurrent quantification analysis. Expecting a high association between both types of variables does not seem to be meaningless. If this were the case, it would be possible to suggest that the explored nonlinear HRV measure is reflecting nonlinear interaction between certain frequency pairs of the ECG. Otherwise, in the case of a low correlation, it may be concluded that bispectral analysis of the ECG allows for the exploration of aspects of the heart rhythm’s nonlinear dynamics that have not been reflected in existing HRV nonlinear analysis, paving the way for new promising clinical explorations.
The initial step of this study was to unravel the relationship between components of an ECG bicoherence matrix and relevant RQA nonlinear HRV features. From the outcome of this first stage, a new nonlinear index for assessing nonlinear cardiovascular dynamics was proposed (BisQ). Further, the relationship between BisQ and other HRV indices was explored, and later we attempted a statistical analysis with the proposed index as it changes with different heart/brain conditions.
2. Materials and Methods
This study was divided into three stages: Finding the correlation between individual bicoherence Matrix components and RQA-derived nonlinear components in a sample of ECG traces; Introduction of the bispectral quotient (BisQ) feature and its estimation; and the exploration of BisQ among different groups of ECG recordings.
2.1. Relation Between Bicoherence Matrix Components and RQA-Derived Features
The first stage of our investigation focused on the study of the statistical association between individual elements of the ECG bicoherence matrix and specific RQA-derived HRV features.
2.1.1. The Data
To find the relationship between individual components of a bicoherence matrix and RQA-derived HRV features, we explored 110 data ECG traces recorded from 55 participants (two ECG traces from each participant). ECG recording duration was at least 20 min and from each individual recording, two 10-min non-overlapping ECG traces were taken.
Participants were 55 persons (20–69 years of age and both genders) who did not refer any cardiovascular condition, carried a normal lifestyle, and agreed to join the study.
From each ECG trace, HRV features (from RR interval tachograms originating from the corresponding ECG trace) and bispectral/bicoherence matrices were obtained.
Care was taken for the sample to be as heterogeneous as possible, hoping that this could allow the conclusions of correlation analysis to be based on an ample range of HRV values.
Participation in the assessment process was voluntary; all subjects signed an informed consent form prior to the recording. The study was approved by the Ethics Committee of the Cuban Center for Neurosciences.
For ECG recording, a MEDICID 5 (Neuronic SA, Cuba) neurophysiological recording system was used to acquire ECG data at a sampling rate of 200 Hz. Surface electrodes were positioned diagonally across the heart according to a standard Lead II configuration. Each of the 110 ten-minute ECG traces were stored as ASCII file (.txt) and submitted to further analysis. Data were resampled to 250 Hz for meeting recommended standards as well for uniformity of all data sets included in this research [25,26]. For data resampling, the resample Matlab command was used.
2.1.2. HRV Analysis
ECG traces were converted to tachograms (RR series) via automatic QRS detection using the publicly available package Kubios 2.1, developed at the Physics Department of the University of Eastern Finland [2]. Under visual control, ectopic and missing r-peaks were corrected by using the correction algorithm included in the Kubios package.
For the estimation of time and frequency domain HRV indices, the specific MHRV documentation master file, created by George B. Moody (1998) was downloaded from the Physionet (site at http://www.physionet.org/physiotools/). Sixteen time-domain and frequency-domain HRV features were estimated, and Table 1 summarizes the HRV features included.

Table 1.
Time domain and frequency domain HRV features included in the study.
Recurrent Quantification Analysis (RQA)
For RQA analysis of tachograms, we used the Matlab source code developed by Ouyang, downloaded from the site https://www-mathworks.com/matlabcentral/fileexchange/46765-recurrence-quantification-analysis-rqa.
The following indices were estimated: recurrence rate (RcRt), determinism (DET), Shannon entropy (Entr) and, Lmean. Details about the procedure for recursive quantification analysis can be found in [2,3,4,5,6]. Briefly, in RQA, the following vectors were created:
where m is the embedding dimension and τ the embedding lag.
uj = (RRj, RRj+τ, . . . , RRj+(m − 1)τ), j = 1, 2, . . . , N − (m − 1)τ,
A recurrence plot (RP) is a symmetrical [N − (m − 1)τ] × [N − (m − 1)τ] matrix of zeros and ones. The element in the j-th row and k-th column of the RP matrix, i.e., RP(j, k), is 1 if the point uj on the trajectory is close enough to point uk, that is:
where d(uj, uk) is the Euclidean distance and r is a fixed distance threshold. The structure of the RP matrix usually shows short line segments of ones parallel to the main diagonal. The embedding dimension and lag were selected to be m = 10 and τ = 1, respectively. The threshold distance r was selected to be √SD, where SD is the standard deviation of the intervals’ time series.
The recurrence rate (RcRt) is defined as the ratio of ones and zeros in the RP matrix.
Accordingly, the average diagonal line length (Lmean), on the other hand, is obtained as
where NL is the number of length L lines. Lmean has been shown to be strongly associated to the largest Lyapunov exponent [27].
2.1.3. Bispectral Analysis
In the most general form, the cross-bispectrum is defined as:
where X, Y, and Z correspond to three signals.
In particular, the auto-bispectrum corresponds to the case when only one signal is considered,
(X = Y = Z).
Bicoherence
To get a measure of the inter-frequency phase locking independent of the strength of each signal, a normalized bispectrum is identified as bicoherence. The absolute value of the bicoherence is, or rather should be, bounded by zero and one which gives a quantitative measure of the coupling. An absolute value of one infers a perfect coupling and an absolute value of zero indicates that no coupling can be observed with this measure.
Here, we use a normalization constructed by 3-norms:
Then, bicoherence is defined as
This normalization was proposed in [28], and it differs from the classical normalization, which is based on 2-norms (i.e., power), rather than 3-norms. With the normalization used here, the absolute value of bicoherence is bounded by 1 and the normalization is still written as a product of 3 scales, one for each of the three signals. We prefer this normalization for conceptual reasons and note that in [28], it was found that this choice of normalization has negligible impact on the statistical properties of bicoherence. For bicoherence estimation, we used the Matlab function data2bs_univar developed by Guido Nolte’s Lab, which is freely available within the METH toolbox available at https://www.uke.de/english/departments-institutes/institutes/neurophysiology-and-pathophysiology/research/research-groups/index.html.
To calculate the bispectrum, the length of segments defines the frequency resolution. Thus, if the segment has a physical length of 100 s, the frequency resolution is ∆f = 0.01 Hz.
The average is made over all segments and epochs, which would be reasonable for continuous data where the entire data is considered as one epoch. Thus, in our calculations, the sampling rate is 250 Hz. The parameters are set to segment length is 25,000 data points (100 s), segment shift 12,500 for 50% overlapping, and epoch length is 25,000 (100 s). Because the segment length corresponds to 100 s, the frequency resolution is 0.01 Hz. Since we picked the maximum number of frequency bins to be 201, we obtain as a result analyzed frequencies spanning from 0 to 2 Hz, with a spectral resolution of 0.01 Hz. Further analysis included a frequency range bounded between 0.06 and 1.80 Hz.
2.1.4. Correlation Analysis
For each frequency pair at the bicoherence matrix BC(f1,f2) correlation with HRV Lmean was estimated over all the 110 10-min non-overlapping ECG traces. Frequency pairs were arranged according to the obtained absolute value of correlation between B(i,j) and Lmean- The choice of Lmean was decided after finding that this RQA feature exhibit the highest correlation with individual Bicoherence Matrix elements. Frequency pairs were analyzed in the range 0.06–1.8 Hz. The lower limit is related to the filtering properties of the ECG amplifiers, and the higher frequency limit was selected for typical values of heart rate to be included into the analysis.
2.2. Bispectral Quotien (BisQ) Estimation
BisQ is obtained as the sum of the Bicoherence values estimated at the three frequency pairs yielding the highest correlation with Lmean.
where indices a, b, and c denote the three frequency pairs exhibiting the highest correlation between bicoherence and Lmean.
BisQ = BC(f1a, f2a) + BC(f1b, f2b) + BC(f1c, f2c),
Figure 1 illustrates the flow chart followed to obtain BisQ.
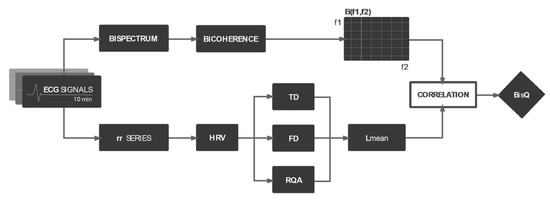
Figure 1.
Flow chart for the creation of the bispectral measure BisQ. TD, FD, and RQA stand for extraction of Time Domain, Frequency Domain, and Recurrent Quantification Analysis features, respectively; B(f1,f2) represents the bicoherence matrix.
2.3. Evaluation of BisQ among Different Groups of ECG Recordings
BisQ was evaluated in four groups of ECG recordings. Statistical comparisons were performed for finding possible differences between groups. Comparisons were performed using the Mann Whitney nonparametric test because data were expected to have a non-Gaussian distribution. All data were described using mean (± SD) values. A value of p < = 0.05 should be considered statistically significant. The data sets studied correspond to different moments and settings. This study was not designed to find normative values or to demonstrate specific changes related to certain conditions. It corresponds to the first evaluation with BISQ, and obtained results are aimed solely at encouraging further specific studies.
Data
We submitted to analysis four groups of ECG recordings. For all recordings, total duration was 30 min and sampling frequency was changed to 250 Hz (if needed) for uniformity and allowing comparisons, and individual values to be analyzed were obtained as the average of three BisQ estimations from non-overlapping 10-min ECG traces.
The following recordings were downloaded from the Physionet.org database at www.physionet.org.
- Healthy (20 persons): Included 20 clinically healthy participants from the Fantasia data base. Recordings were taken in resting condition. Age ranged from 21 to 81 years Details about the database can be found in [29].
- Arrhythmia (21 persons): Data were downloaded from the MIT-BIH Arrhythmia database at www.physionet.org. Age ranged from 24 to 89 years. This database is one of the most exhaustively studied in literature [10,12,13,14,15,16,17]. It corresponds to fully annotated half-hour two leads ECGs.
- Pre-Term Infants (7): Included seven preterm infants in the first year of life, also available on the Physionet site. This database contains simultaneous ECG and respiratory recordings from 10 preterm infants from the Neonatal Intensive Care Unit (NICU) of the University of Massachusetts Memorial Healthcare. The preterm infants were studied at conceptional ages between 29 and 35 weeks.
A fourth group included 30-min ECG recordings from nine persons suffering from focal pharmaco-resistant epilepsy. Participants’ age ranged from 16 to 39 years; a MEDICID 5 (Neuronic SA, Cuba) neurophysiological recording system was used to acquire ECG data at a sampling rate of 200 Hz and resampled to 250 Hz. Surface electrodes were positioned diagonally across the heart according to a standard Lead II configuration.
Participation in the assessment process was voluntary; all subjects signed an informed consent form prior to the recording. The study was approved by the Ethics Committee of the Cuban Center for Neurosciences (Resolution No. 7/2018). Table 2 summarizes the age/gender distribution of participants.
Table 2.
Age and gender distribution of the participants in the BisQ comparisons study. The number of female participants is indicated in brackets (e.g., four female participants in the 70 to 79 years of age group of healthy persons). No gender data were provided for pre-term neonates.
3. Results
3.1. HRV Recurrent Quantification Analysis (RQA)
In Figure 2, the recurrence plot obtained for a 10-min RR trace is represented. RQA indices corresponding to this RP are described. From each of the 110 traces described in Section 2.1.1, RQA HRV indices were obtained.
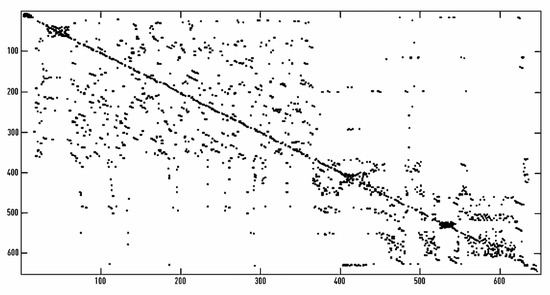
Figure 2.
Recurrence plot obtained from a 10-min tachogram. The following HRV RQA values were obtained from this RP: RcRt = 0.0153; DET = 0.5693; ENTR = 0.7314; Lmean = 2.56579.
3.2. Bicoherence Analysis
In Figure 3, a plot of a typical (Log) Bicoherence matrix is shown. As expected, the highest values are associated to frequencies close to the heart rate (1.16 Hz), which is regarded as the main frequency of the heart rhythm (70 beats per minute).
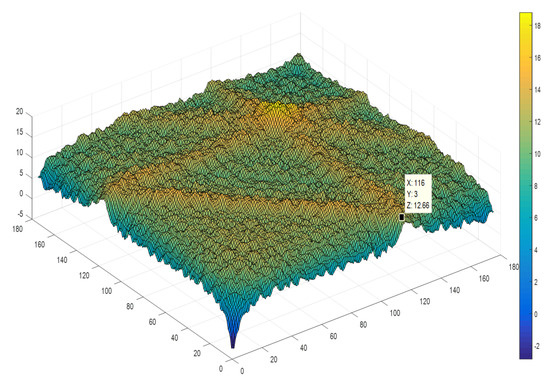
Figure 3.
(Log) bicoherence matrix obtained from a 10-min ECG trace. Frequencies are multiples of 0.01 Hz, thus a value of 116 corresponds to 1.16 Hz (69.6 beats per minute).
Frequencies varied from zero to 1.8 Hz with a frequency resolution of 0.01 Hz. Due to the high pass filter built up into the ECG amplifiers (IEC International Standard 60601-2-25 Subclause 201.12.4.107.1 frequency response), frequencies below 0.06 Hz might be showing distorted results and were not included into the analysis. Note, the higher bicoherence values at frequency pairs associated to the main ECG rhythm of 1.16 Hz (70 beats/min).
We also explored real and imaginary part of bicoherence, as well as a wider range of frequency values. At this stage, we concentrated our research on real valued bicoherence with frequencies up to 1.8 Hz.
3.3. Correlation Analysis
Each frequency pair of matrix BC was tested for association strength with each RQA HRV feature. The highest correlation was found with Lmean. From the viewpoint of nonlinear systems theory, the strong association between Lmean and the largest Lyapunov exponent [27] might provide a sound interpretation to this feature.
F12a (0.86Hz, 0.80 Hz); r = −0.3640,
F12b (1.19 Hz, 1.19 Hz); r = −0.3520,
F12c (1.05 Hz, 0.33 Hz); r = −0.3828.
F12b (1.19 Hz, 1.19 Hz); r = −0.3520,
F12c (1.05 Hz, 0.33 Hz); r = −0.3828.
All these three correlation values were highly significant (p < 0.00001).
3.4. Introducing BisQ
BisQ was proposed as the sum of the three following bicoherence values:
BisQ = BC(0.86, 0.80) + BC(1.19, 1.19) + BC(1.05, 0.33).
3.4.1. Correlation between BisQ and Lmean.
BisQ exhibited a highly significant correlation with Lmean is shown. The obtained correlation coefficient r = −0.5143 was obtained.
3.4.2. BisQ Correlation with Other HRV Variables
Other HRV variables also exhibited significant correlations with BisQ. Table 3 summarizes the significant correlation values obtained between BisQ and those HRV variables.
Table 3.
Significant correlations for BisQ with different HRV variables (p < 0.05).
From Table 3, it can be noted that BisQ exhibits significant correlation with the three RQA HRV features studied, Lmean being the strongest.
Principal Component Analysis (PCA)
Since HRV variables are highly correlated, we attempted to perform PCA on HRV variables and see whether uncorrelated principal components might show the stronger association with BisQ. These results are summarized in Table 4.
Table 4.
HRV PCA eigenvalues and corresponding correlations with BisQ.
Principal component analysis revealed that more than 99% of the variance corresponds to PC1.
Only four principal components exhibited significant correlations with BisQ, but none of them were higher than those for any of the RQA indices Table 5.
Table 5.
P-values resulting from the Mann-Whitney U test for group comparisons using BisQ. Legend: H–Healthy; A–Arrhythmia; E–Epilepsy; PT–Preterm infants. Highlighted are p < 0.05.
Multivariate Regression
We attempted to model BisQ as a linear combination of several HRV variables. When variables were incorporated and piecewise forward regression was explored, only the variable Lmean was picked as the sole predictor. We attempted to apply multivariate regression with principal components, as predicting variables did not yield a better correlation than that obtained with Lmean.
3.5. Comparing Real Data with BisQ
3.5.1. Correlation with Age
In the group of healthy persons (H), ages ranged from 21 to 81 years. In the arrhythmia group (A), subject ages ranged from 24 to 89 y, and among persons with epilepsy, ages ranged from 18 to 39 y. (see Table 2). Age diversity could hinder comparisons between groups if this factor appears as a latent variable. For this reason, we tried to clarify whether a correlation between person´s age and BisQ is present.
In none of the groups a significant correlation for BisQ with age was obtained. Nonetheless, when we found significant differences between healthy persons and persons with epilepsy, we again compared the group of persons with epilepsy with the subset of a young healthy patient, and still found differences, notwithstanding the lower number of individuals (see Table 2).
3.5.2. Comparing Groups
In Figure 4, a Box and Whisker Plot summarizes the values of BisQ in the four groups studied. As it can be observed from Figure 4, BisQ seems to be higher among persons with epilepsy as well as preterm infants, whereas persons with arrhythmia have similar mean and a higher dispersion as compared to healthy persons.
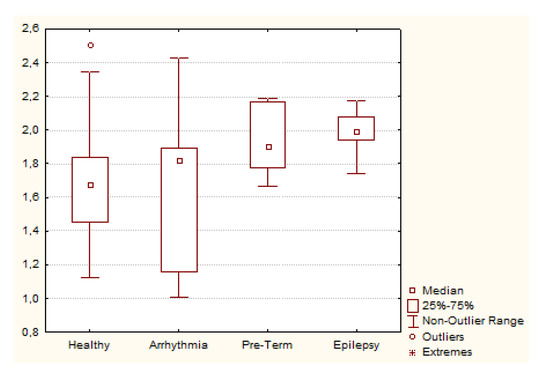
Figure 4.
Box and Whisker plot illustrating BisQ values among different groups of ECG recordings.
Comparisons between groups with the Mann-Whitney´s nonparametric test Table 5 revealed that the group of persons with epilepsy exhibited higher BisQ values than the group healthy persons as well as persons with arrhythmia. Pre-term infants group also had higher BisQ values than the healthy persons group.
Comparing young healthy individuals with epileptic patients. Since the group of persons with epilepsy are in the 16 to 39 years age group, and the age range for healthy persons group is 21 to 81 years, the observed difference in BisQ values could be a result of age mismatch. Thus, we compared the group of epileptic patients with the subgroup of healthy young patients. The following BisQ values were obtained:
1.70 ± 0.45 for healthy young patients.
2.00 ± 0.13 for epileptic patients.
The Mann Whitney test still showed significant difference between groups (p < 0.05)
4. Discussion
In this study, an index derived from bispectral analysis has been introduced. As obtained, the Bispectral Quotient BisQ accounts for around 27% of the total variance of Lmean, an RQA variable for nonlinear HRV analysis that has been regarded as being strongly associated to the maximum Lyapunov exponent [27]. In this regard, we interpret this result as evidence that this measure, derived from bispectral analysis is at least partially related to other nonlinear HRV measures that have been reported as parsimonious for detecting shrewd changes in cardiac activity as well as regulation from other physiological and environmental influences [3]. At the same time, the fact that at least 70% of BisQ variance is not related to any other HRV feature suggests that BisQ retains relevant information about heart rhythm nonlinear dynamics that could complement commonly used HRV features. Thus, we expect that, combined with traditional linear and nonlinear HRV measures, BisQ can become a useful tool for exploring heart rhythm and its modification with both environmental and physiological influences.
Exploration of BisQ with different groups showed that BisQ is apparently higher among persons with epilepsy as well as among preterm infants.
With regard to the physiological meaning of obtained results, unlike other indices, BisQ was obtained as result of an attempt to find an association between bicoherence and other previously established nonlinear HRV measures.
As can be seen from its definition (10), three frequency pairs are contributing to BisQ:
(0.86 Hz, 0.80 Hz), (1.19 Hz, 1.19 Hz), (1.05 Hz, 0.33 Hz).
We speculate that the pair (1.19 Hz, 1.19 Hz), is reflecting nonlinear processes associated to the main heartbeat frequency at 1.2 Hz (72 beats per minute). The pair (0.86 Hz, 0.80 Hz) lies within the intrinsic firing rate of the atrial-ventricular node (48–52 Hz).
Finally, the pair (1.05 Hz, 0.33 Hz) might be related to nonlinear interactions related to cardiorespiratory coupling. Respiratory signals usually display prominent spectral peaks at the first harmonic, at about 0.34 Hz. As it is well known, respiration is an important conditioner of heart rate, and nonlinearities in this important mechanism might be of special interest.
Thus, we assume the idea that the pair (1.05 Hz, 0.33 Hz) reflects nonlinear phenomena associated to cardiorespiratory coupling.
Worth of note, are the results obtained by Toledo et al. [19] with HRV bispectra after heart transplantation. They found few (about seven) significant phase coupled spots in the 0 to 1.5 Hz frequency range. Curiously, two of them were coincident with the frequency pairs and (1.19 Hz, 1.19 Hz), and (1.05 Hz, 0.33 Hz) included into BisQ. This could support the idea that the coupled frequencies that have been contributing to BisQ reflect mainly intrinsic heart regulatory mechanisms with a lesser influence from autonomic cardiovascular regulation.
Our results might point to an increase in BisQ in inter-ictal epilepsy. Increases in heart rate during an epileptic seizure is a well-known fact [30], but during inter-ictal periods, heart rate among epileptic patients is similar to that of healthy individuals. In our data base of epileptic patients, we found that inter-ictal heart rate ranges between 64 and 80 beats per minute (for a mean frequency of 1.20 Hz). This suggests that the observed changes are not associated to changes in heart rate in this group of patients.
At the same time, attempts to characterize the inter-ictal heart rhythm of persons with epilepsy is an ongoing task [27]. In this sense, BisQ, combined with other nonlinear HRV features could be a promising factor in epilepsy research and treatment.
On the other hand, our results deserve further clarification. As it has been reported, during epileptic seizures, neurovascular coupling is impaired [31,32]. However, these changes during inter-ictal periods do not appear in all types of epilepsies. Whether or not increased inter-ictal BisQ among focal drug-resistant patients with epilepsy might be a compensatory mechanism deserves a dedicated research.
In epilepsy, excessive synchronization has been reported as a hallmark for this condition. It is not excluded that brain synchronization might lead to over-synchrony in main brain rhythms. During, before, and after an epileptic seizure, cardiorespiratory coupling has been reported as reduced, but changes seem to depend on the type of epilepsy [23]. Since BisQ could combine both cardiac pacemaker mechanisms and cardiorespiratory coupling, a special study is required for assessing individual contributions corresponding to each frequency pair included into this index.
No differences in BisQ values were observed among persons with arrhythmia, a counter-intuitive result in view of impaired synchronization mechanisms among this group of persons [33,34]. However, the relatively low proportion of arrhythmic events in long-lasting ECG recordings could explain the absence of significant BisQ changes in this group of persons with arrhythmia.
Interpretation of results with preterm infants goes beyond the scope of this study. Heart rate and respiratory rate among newborns nearly double those of adults, and BisQ may not be interpreted in terms of corresponding frequencies as it was done with adult groups. It is not excluded that a tailored BisQ version for infants should be introduced when infants will be studied.
Biophysical mechanisms of cardiorespiratory coupling, though widely known, are scarcely clarified [35,36,37]. We hope that BisQ, an index that specifically includes frequencies putatively involved in this phenomenon, might contribute to cardiorespiratory coupling research.
Limitations of present research are mainly related to the low number of cases included into the study. The fact that in this exploratory study groups recorded in different conditions and even with different recording systems were compared, limits the clinical interpretation of our results: they can be interpreted as preliminary and guiding to further research. Thus, the validity of these results is merely exploratory to check for the plausibility of using BisQ with real data and to encourage properly designed study protocols. Factors as intra-individual variability and differentiation of epileptic patients from healthy individuals, as well relation to physical training will be addressed in future research from our group.
5. Conclusions
In this study, we proposed a bicoherence-derived index that exhibits a significant correlation with nonlinear heart rate variability indices. No differences were documented between normal adults of different age. Departures from normal values were obtained among a group of persons with epilepsy. Apparently, this index reflects nonlinear interactions at the level of sinus-and atrial-ventricular nodes, and most likely cardiorespiratory coupling. Hopefully, BisQ will allow further exploring cardiac nonlinear dynamics, complementing available HRV indices
Author Contributions
Conceptualization, J.L.H.-C., R.I.G.-F. and G.N.; Formal analysis, M.O.-O.; J.L.H.-C.; Methodology, R.I.G.-F. and G.N.; Software, M.O.-O.; Writing—original draft, J.L.H.-C.; Writing—review & editing, R.I.G.-F., M.O.-O. and G.N. All authors have read and agreed to the published version of the manuscript.
Funding
This research was partially funded by the German Research Foundation (DFG), SFB936/Z3 and TRR 169/C1/B4.
Acknowledgments
The authors thank Xosé Antón Vila Sobrino for encouragement and support during the preparation of this research, and two unknown referees for their deep insight into all formal and theoretical aspects of the manuscript.
Conflicts of Interest
The authors declare no conflict of interest.
References
- Julian, G.; Ermesto, P. Applications of Fractal and Non-linear Time Series Analysis to the Study of Short-term Cardiovascular Control. Curr. Vasc. Pharmacol. 2004, 2, 149–162. [Google Scholar]
- Niskanen, J.-P.; Tarvainen, M.P.; Ranta-Aho, P.O.; Karjalainen, P.A. Software for advanced HRV analysis. Comput. Meth. Programs Biomed. 2004, 76, 73–81. [Google Scholar] [CrossRef] [PubMed]
- Young, H.; Benton, D. We should be using nonlinear indices when relating heart-rate dynamics to cognition and mood. Sci. Rep. 2015, 5, 16619–16622. [Google Scholar] [CrossRef]
- Quiroz-Juárez, M.A.; Jiménez-Ramírez, O.; Vázquez-Medina, R.; Breña-Medina, V.; Aragón, J.L.; Barrio, R.A. Generation of ECG signals from a reaction-diffusion model spatially discretized. Sci. Rep. 2019, 9, 1–10. [Google Scholar] [CrossRef]
- Alliche, A.; Mokrani, K. Higher order statistics and EEG arrhythmia classification. In Proceedings of the 3rd IEEE International Symposium on Signal Processing and Information Technology (ISSPIT), Darmstadt, Germany, 17 December 2003; pp. 641–643. [Google Scholar]
- Webber, C.L.; Zbilut, J.P. Dynamical assessment of physiological systems and states using recurrence plot strategies. J. Appl. Physiol. 1994, 76, 965–973. [Google Scholar] [CrossRef] [PubMed]
- Brennan, M.; Palaniswami, M.; Kamen, P. Do existing measures of Poincaré plot geometry reflect nonlinear features of heart rate variability? IEEE Trans. Biomed. Eng. 2001, 48, 1342–1347. [Google Scholar] [CrossRef]
- Hoshi, R.A.; Pastre, C.M.; Marques Vanderlei, L.C.; Fernandes Godoy, M. Poincaré plot indexes of heart rate variability: Relationships with other nonlinear variables. Auton. Neurosci. 2013, 177, 271–274. [Google Scholar] [CrossRef]
- Calderón-Juárez, M.; González-Gómez, G.H.; Echeverría Pérez-Grovas, H.; Lerma, C. Association between Mean Heart Rate and Recurrence Quantification Analysis of Heart Rate Variability in End-Stage Renal Disease. Entropy 2020, 22, 114. [Google Scholar] [CrossRef]
- Chua, K.C.; Chandran, V.; Acharya, U.R.; Lim, C.M. Cardiac state diagnosis using higher order spectra of heart rate variability. J. Med. Eng. Tech. 2008, 32, 145–155. [Google Scholar] [CrossRef] [PubMed]
- Rastogil, M.; Nagchoudhuri, D.; Parikh, C.D. Quadratic Phase Coupling in ECG Signals. In Proceedings of the Asian Conference on Sensors and the International Conference on New Techniques in Pharmaceuticals and Biomedical Research, Kuala Lumpur, Malaysia, 5–7 September 2005. [Google Scholar]
- Lanata, A.; Valenza, G.; Mancuso, C.; Scilingo, E.P. Robust multiple cardiac arrhythmia detection through bispectrum analysis. Expert Syst. Appl. 2011, 38, 6798–6804. [Google Scholar] [CrossRef]
- Engin, M. ECG-Late Potential Extraction Using Averaged Singular—Values of Third-Order Cumulant (TOC) Based Bispectrum. Analog Integrated Circuits Signal Process. 2002, 33, 301–303. [Google Scholar] [CrossRef]
- Spaargaren, A.; English, M.J. Bispectral analysis of high resolution ECG. Electron. Lett. 1999, 35, 1216–1217. [Google Scholar] [CrossRef]
- Chamoun, N.G. Cardiac Biopotential Analysis System and Method. U.S. Patent No. 4,924,875, 15 May 1990. [Google Scholar]
- Martis, R.J.; Acharya, U.R.; Prasad, H.; Chua, C.K.; Lim, C.M.; Suri, J.S. Application of higher order statistics for atrial arrhythmia classification. Biomed. Signal Process. Control 2013, 8, 888–900. [Google Scholar] [CrossRef]
- Veerabhadrappa, S.T.; Vyas, A.L. Analysis and Classification of Three Trimesters During Normal Pregnancy Using Bispectrum. IETE J. Res. 2020, 1–10. [Google Scholar] [CrossRef]
- Swapna, G.; Soman, K.P.; Vinayakumar, R. Diabetes Detection Using ECG Signals: An Overview. In Deep Learning Techniques for Biomedical and Health Informatics; Springer: Cham, Switzerland, 2020; pp. 299–327. [Google Scholar]
- Toledo, E.; Pinhas, I.; Aravot, D.; Akselrod, S. Heart Transplantation—Spectral and Bispectral Analysis. In Proceedings of the 23rd Annual International Conference of the IEEE Engineering in Medicine and Biology Society, Istanbul, Turkey, 25–26 October 2001. [Google Scholar]
- Penttonen, M.; Buzsáki, G. Natural logarithmic relationship between brain oscillators. Thalamus Relat. Syst. 2003, 2, 145–152. [Google Scholar] [CrossRef]
- Buzsáki, G.; Draguhn, A. Neuronal oscillations in cortical networks. Science 2004, 304, 1926–1929. [Google Scholar] [CrossRef]
- Belluscio, M.A.; Mizuseki, K.; Schmidt, R.; Kempter, R.; Buzsáki, G. Cross-frequency phase–phase coupling between theta and gamma oscillations in the hippocampus. J. Neurosci. 2012, 32, 423–435. [Google Scholar] [CrossRef]
- Varon, C.; Jansen, K.; Lagae, L.; Faes, L.; Van Huffel, S. Transient behavior of cardiorespiratory interactions towards the onset of epileptic seizures. Comput. Cardiol. 2014, 41, 917–920. [Google Scholar]
- Hagiwara, Y.; Faust, O. Nonlinear Analysis of Coronary Artery Disease, Myocardial Infarction, and Normal ECG Signals. J. Mech. Med. Biol. 2017, 17, 1740006. [Google Scholar] [CrossRef]
- Task Force of the European Society of Cardiology the North American Society of Pacing Electrophysiology. Heart Rate Variability: Standards of Measurement, Physiological Interpretation, and Clinical Use. Circulation 1996, 93, 1043–1065. [Google Scholar] [CrossRef]
- Mahdiani, S.; Jeyhani, V.; Peltokangas, M.; Vehkaoja, A. Is 50 Hz high enough ECG sampling frequency for accurate HRV analysis? In Proceedings of the 37th Annual International Conference of the IEEE Engineering in Medicine and Biology Society (EMBC), Milan, Italy, 25–29 August 2015; pp. 5948–5951. [Google Scholar] [CrossRef]
- Zou, Y.; Donner, R.V.; Donges, J.F.; Marwan, N.; Kurths, J. Identifying shrimps in continuous dynamical systems using recurrence based methods. EGUGA 2010, 20, 8226. [Google Scholar]
- Shahbazi, F.; Ewald, A.; Nolte, G. Univariate normalization of bispectrum using Hölder’s inequality. J. Neurosci. Methods 2014, 15, 177–186. [Google Scholar] [CrossRef] [PubMed]
- Iyengar, N.; Peng, C.-K.; Morin, R.; Goldberger, A.L.; Lipsitz, L.A. Age-related alterations in the fractal scaling of cardiac interbeat interval dynamics. Am. J. Physiol. 1996, 271, R1078–R1084. [Google Scholar] [CrossRef] [PubMed]
- Trulla, L.L.; Giuliani, A.; Zbilut, J.P.; Webber, C.L. Recurrence quantification analysis of the logistic equation with transients. Phys. Lett. A 1996, 223, 255–260. [Google Scholar] [CrossRef]
- Schwartz, T.H. Neurovascular coupling and epilepsy: Hemodynamic markers for localizing and predicting seizure onset. Epilepsy Curr. 2007, 7, 91–94. [Google Scholar] [CrossRef] [PubMed]
- Billeci, L.; Marino, D.; Insana, L.; Vatti, G.; Varanini, M. Patient-specific seizure prediction based on heart rate variability and recurrence quantification analysis. PLoS ONE 2018, 13, e0204339. [Google Scholar] [CrossRef]
- Goldenholz, D.M.; Kuhn, A.; Austermuehle, A.; Bachler, M.; Mayer, C.; Wassertheurer, S.; Inati, S.K.; Theodore, W.H. Long-term monitoring of cardiorespiratory patterns in drug-resistant epilepsy. Epilepsia 2017, 58, 77–84. [Google Scholar] [CrossRef]
- Platiša, M.M.; Bojić, T.; Pavlović, S.U.; Radovanović, N.N.; Kalauzi, A. Uncoupling of cardiac and respiratory rhythm in atrial fibrillation. Biomed. Eng. Biomed. Tech. 2016, 61, 657–663. [Google Scholar] [CrossRef]
- Radovanovic, N.N.; Pavlovic, S.U.; Milašinovic, G.; Kircanski, B.; Platiša, M.M. Bidirectional Cardio-Respiratory Interactions in Heart Failure. Front. Physiol. 2018, 9, 165–169. [Google Scholar] [CrossRef]
- Ahn, S.; Sol fest, J.; Rubchinsky, L.L. Fine temporal structure of cardiorespiratory synchronization. Am. J. Physiol. Heart Circ. Physiol. 2014, 306, H755–H763. [Google Scholar] [CrossRef]
- Faes, L.; Marinazzo, D.; Montalto, A.; Nollo, G. Lag-specific transfer entropy as a tool to assess cardiovascular and cardiorespiratory information transfer. IEEE Trans. Biomed. Eng. 2014, 61, 2556–2568. [Google Scholar] [CrossRef] [PubMed]


© 2020 by the authors. Licensee MDPI, Basel, Switzerland. This article is an open access article distributed under the terms and conditions of the Creative Commons Attribution (CC BY) license (http://creativecommons.org/licenses/by/4.0/).