Article

Impact Evaluation of Electric Vehicle Parking on Solving Security-Constrained Unit Commitment Problem

by
Mahmood Hosseini Imani
1,
Mojtaba Jabbari Ghadi
2,
Shahaboddin Shamshirband
3,4,* and
Marius M. Balas
5
1
Department of Electrical Engineering, Faculty of Engineering, University of Guilan, Rasht 4199613776, Iran
2
Faculty of Engineering and Information Technology, University of Technology Sydney, PO Box 123, Broadway NSW 2007, Australia
3
Department for Management of Science and Technology Development, Ton Duc Thang University, Ho Chi Minh City, Vietnam
4
Faculty of Information Technology, Ton Duc Thang University, Ho Chi Minh City, Vietnam
5
Faculty of Engineering, Aurel Vlaicu University of Arad, Arad 310130, Romania
*
Author to whom correspondence should be addressed.
Math. Comput. Appl. 2018, 23(1), 13; https://doi.org/10.3390/mca23010013
Submission received: 23 January 2018 / Revised: 21 February 2018 / Accepted: 1 March 2018 / Published: 7 March 2018
(This article belongs to the Section Engineering)

Abstract

:
In this paper, the employment of a vehicle-to-grid (V2G) system in the security-constrained unit commitment (SCUC) problem is considered. SCUC has gained remarkable attention from researchers in the field of electric power systems, aiming to determine the generation schedule in which the system operator maximizes the system security and minimizes the generation costs, while satisfying the system and units’ constraints. Tremendous technological advances in recent years have attracted the attention of system operators to utilize novel sources of electricity, accompanied with thermal units. To this end, V2G technology recently drew remarkable consideration as a new energy resource. V2G reduces the dependence of electricity production procedures on small-scale and costly thermal units, and subsequently has a strong impact on the operation costs and ameliorates the management of load vacillations. This paper presents the use of V2G in scheduling and operating power systems. A successful technique for investigating the impacts of V2G on a real power system is running SCUC on power systems in which electric vehicle parking is installed on different buses. In order to assess its applicability, the proposed method has been applied in two case studies: the IEEE 6-bus system and the extended IEEE 30-bus system. This study presents two simulation scenarios: the SCUC problem was first evaluated separately, and then in the presence of some electrical vehicles connected to the grid. The results demonstrate the reduction of the total operation cost. In addition, by using the proposed method, the operator can specify the optimal number of vehicles needed in the parking each hour. The results can help the system operators and designers in designing, planning, and operating such power systems.

1. Introduction

The problem of the optimal commitment of the thermal generating units in power generating systems has a pivotal role. In the traditional unit commitment problem (UC) in previous integrated power systems, the generating operators had a tendency to create an ON/OFF table during the scheduling horizon in which generating costs were minimized. From the independent system operator (ISO) point of view, the UC problem should be accomplished while power system security is emphasized. Such a UC problem is called security-constrained unit commitment (SCUC). This problem aims to maximize the system security and to minimize the production costs while the load demand constraint is satisfied [1]. In general, one necessary purpose of the generation companies is to provide service with minimum production and total costs. For the SCUC problem, the maximization of the system security is subject to lines flow constraints, such that the minimization of line flow can be provided by the commitment of inexpensive units along with an optimal economic load dispatch [2,3]. A different UC modeling in a deterministic and stochastic manner in a 24 h horizon is presented in [4]. This formulation is focused on the determination and distribution of reserves. A weekly unit commitment schedule with a timely investigation for the thermal power generator and pumped storages is proposed in Ref. [5]. Due to the rapid development and growth of sustainable energy sources and distributed generation (DG) in the power market, the integration of renewable energy units has become an important planning obligation. Electric vehicles (EVs) need an energy base for their driving requirements. Moreover, the overall EVs energy network should be much larger than the energy released to the system. The relationship between the energy storage systems and the power grid has gained remarkable attention from many researchers and network operators [6,7]. On the other hand, the most recent innovative power supply strategies free of fossil fuel burning rely on vehicle-to-grid (V2G) systems. Moreover, there are strong tendencies for many countries to employ technologies in such a way as to adapt with the Kyoto protocol. V2G is a novel method of power production which has seen rapid growth in recent years. V2G has the ability to connect to weak points of the grid and to provide electrical energy for the power system [8,9]. Some studies have considered the physical constraints of a power grid, load demand, and wind power generation uncertainties [10,11].
In this paper, we considered: (1) a solution to the SCUC problem individually; and (2) two solutions to SCUC, considering one or a variable number of V2G units accessible in the parking lot. In fact, this research develops an approach to SCUC scheduling through V2G in order to minimize environmental pollution and to optimize the commitment of certain traditional thermal units. Because the simultaneous adoption of SCUC and V2G programs is a complex non-linear problem with numerous discrete and continuous variables, it is rational to employ the linear programming technique to overcome the associated complexities [12,13]. To run the optimization task, the GAMS software and the CPLEX method were used, because they are highly efficient in the case of mixed integer programing. Moreover, to assess the applicability of the proposed method, this technique was applied on two test systems (6 buses and 30 buses, respectively).
This paper continues as follows: Section 2 treats the power production using V2G. In Section 3, the SCUC problem in the presence of V2G is formulated. Case studies and simulation results are presented in Section 4.

2. V2G-Based Power Generation

V2G describes a system in which plug-in electric vehicles such as electric cars (EVs) and plug-in hybrid electric vehicles (PHEVs) communicate with the power grid to sell demand response services by either delivering electricity into the grid or by throttling their charging rate. With the advent of technological advances related to energy storage systems and power electronics facilities, factories such as Toyota, Chevrolet, and Tesla decided to mass-produce V2G, making it so that the new generations of these V2Gs enjoy the ability to connect to the power systems [14,15]. Considering the advanced countries’ long-term plans for further development and employment of V2G in the near future [16], it is appropriate to address the various aspects of the impact of this technology on the power grids.
Because of the increasing rate of electric power consumption and demand, most of the power industry is open to extending novel methods and technologies [17,18]. Economic and environmental issues are important factors that have attracted the interest of researchers to pursue this field of research [19]. However, success in the efficient utilization of V2G technology is highly dependent on how to schedule these V2G units in limited parking lots. The SCUC-V2G optimization problem must satisfy demands for spinning the power reserve at any time, with regard to the security constraint and the operation cost minimization. One of the most important issues in this paper is the varying number of vehicles at different hours. Considering that at most times not all of the V2G units in parking are accessible, the grid operator should calculate the proper number of required vehicles at each hour of the scheduling horizon to minimize operating costs.
In this paper, a parking lot with specified capacity has been considered, which is connected directly to the power grid. We considered a parking lot with a group of vehicles because one or few vehicles connected to the grid do not have a remarkable effect on the system. The position of this parking lot is considered on a grid bus, and it is assumed that a variable percent of all vehicles are present in this parking lot, and that in 24 h all of them enter the parking lot. When EVs connect to the grid, each of them acts as a distributed generating unit. With regard to hourly demand and the number of present vehicles in the parking, the operator specifies the optimum number of vehicles required to take part in unit commitment to simultaneously satisfy the power demand and minimize the operation cost.

3. The Formulation of the SCUC Problem in the Presence of V2G

3.1. Objective Function and Linearization

SCUC is a mixed integer problem (MIP). Because of the remarkable complexity of this problem and because of the possibility of solving this problem in GAMS optimization software, the objective function and all the nonlinear constraints of the problem must be implemented linearly and with compatibility with the MIP solver in GAMS software [20].
In this article, the cost of SCUC and V2G are simultaneously considered as objective functions which is represented by Equation (1). As a key equation, this equation minimizes the operation cost of the network with regard to Equations (12)–(25):
min C F = min i = 1 N G t = 1 N T [ F c , i . ( P i , t , I i , t ) + S U i , t + S D i , t ] + t = 1 ( P v . N V 2 G . p r i c e ) .
In Equation (1), the first term of the objective function illustrates the costs of operation related to the thermal units, while the second term shows the cost related to the V2G units.
F c i ( P i , t ) indicates the thermal units’ fuel cost.
F c i ( P i , t ) = a i + b i . P i , t + c i . P i , t 2
In case of using such a fuel cost function, the resulting objective function is a non-linear function combined with real values. The nonlinear formulation is linearized by piecewise linear approximation as follows:
F c i ( P i , t ) = F i ( P i , t min ) . U i , t + S i , t 1 . P i . t 1 + ... + S i , t n . P i , t n ,
M C i = F c , i ( P i min ) ,
0 P i , t k P i k , max    k ,   i ,   t ,
P i , t = P i , t min I i , t + k = 1 k k P i , t k i ,   t .
Shut-down costs and start-up costs during the scheduling horizon can be defined as below:
S D i , t = I i , ( t 1 ) ( 1 I i , t ) C i S D ,
S U i , t = I i , t ( 1 I i , ( t 1 ) ) C i S U .
Start-up and shut-down costs are non-linear in thermal units; to get rid of this situation, the proposed model has been used in different references. The method starts by defining two new variables γi,t and δi,t. γi,t is associated with the turn-on situation and δi,t with the turn-off situation. If a unit changes from OFF to ON, γi,t will be equal to 1. If a unit changes from ON to OFF, δi,t will be equal to 1. For example, the relation between Ii,t and these variables is presented in Table 1.
As it will be stated, the problem’s constraints will be linearized using the proposed binary variables. However, with the addition of these variables, the following equations must be added:
γ i , t + δ i , t 1 ,
γ i , t δ i , t = I i , t I i , ( t 1 ) .
In Equation (9) a unit is turned ON or OFF at any moment and both events do not occur together. In Equation (10), considering each of the ON states and OFF states equal to 0, one illustrates the relation between units.
According to the linearization performed to the objective function, at the end the objective function looks like:
t = 1 N T i = 1 N G [ M C i I i , t + k = 1 N k ρ i , t k P i , t k + γ i , t c i S U + δ i , t c i S D ] .

3.2. Units and System Constraints

• Spinning Reserve
To maintain the stability of the network at each hour of the SCUC problem, a certain value of spinning reserve is required. Reserve can be considered as a percentage of the total load in the system or of the greatest generating unit or as arbitrary for every hour.
i = 1 U i , t . P i , t max + P v max . N V 2 G , t D t + R t
• Generating Capacity
P i , t min P i , t P i , t max
• Power Flow in Transmission Lines
These constraints consist of limits on the flows over particular lines and are based on DC power flows:
P l max P l , t P l max ,
P l , t = θ b θ b 0 x l .
• Ramp Rate
P i , t P i , ( t 1 ) ( 1 γ i , t ) R U i + γ i , t p i min i , t
P i , ( t 1 ) P i , t ( 1 δ i , t ) R D i + δ i , t p i i n i
• Minimum Up and Down Time Constraints
After starting, each unit must stay in the system for at least time T i o n . This constraint is called the Minimum Up time. The unit cannot leave the system sooner than T i o n . If a unit switches to OFF, this unit must remain OFF for at least T i o f f , which indicates the Minimum Down time. These constraints are formulated as follows:
τ = 1 t = 1 I i , τ + min ( T i o n t + 1 , T i i n i ) I i i n i T i o n δ i , t i ,   t { 1 , 2 , ... , T i o n } ,
τ = t T i o n t = 1 I i , τ T i o n δ i , t i ,   t { T i o n + 1 , ... , N T } ,
τ = 1 t = 1 ( 1 I i , τ ) + min ( T i o f f t + 1 , T i i n i ) ( 1 I i i n i ) T i o f f γ i , t ,
τ = t T i o f f t = 1 ( 1 I i , τ ) T i o f f γ i , t    i ,   t { T i o f f + 1 , ... , N T } .
In the above equations, T i i n i indicates the Up and Down time and I i i n i indicates the ith unit state in the first moment.
• Network Power Balance
The energy balance states that the difference between power production and demand at a specific node should be equal to the input power minus the output power of transmission lines connected to that node.
i B b i P i , t + v B b v P v . N V 2 G , t + P w , t D b D = i l f , , b P l l , t i l t , , b P l l , t
• Balance of the V2Gs
According agreements, the maximum number of EVs connected to the grid should be limited within a specified range by preplanning or by compulsion. Therefore, the number of vehicles must be specified. In each 24-h period, all the EVs of the grid enter the parking lot and contribute to the unit commitment.
t = 1 N V 2 G , t = N V 2 G max
• State of Charge (SOC)
Each of the V2Gs must be in an agreed SOC when connecting to the grid.
• Number of Vehicles in Parking
Besides the limitation of the total number of connectable EVs, a limited number of EVs are available in each period.
N V 2 G , t N V 2 G , t max
In this paper, the maximum number of EVs present in the parking each hour is considered as β% of the total number of vehicles.
N V 2 G , t max = β % N V 2 G max

4. Case Study

In order to assess the effectiveness and applicability of the suggested model, the IEEE-6 and the modified IEEE-30 bus systems are considered as test systems. We are interested in investigating the effects of the presence of V2G units on the power production of given power systems.
Two simulation scenarios are considered:
  • Scenario 1. A solution to the SCUC problem without considering V2G;
  • Scenario 2. A solution to the SCUC problem in the presence of V2G.

4.1. Case 1: The IEEE 6-Bus System

Figure 1 shows the single line diagram of the IEEE 6-bus test system [20,21]. The system consists of three synchronous generators and seven transmission lines. The parking for V2G units is located in bus 4.
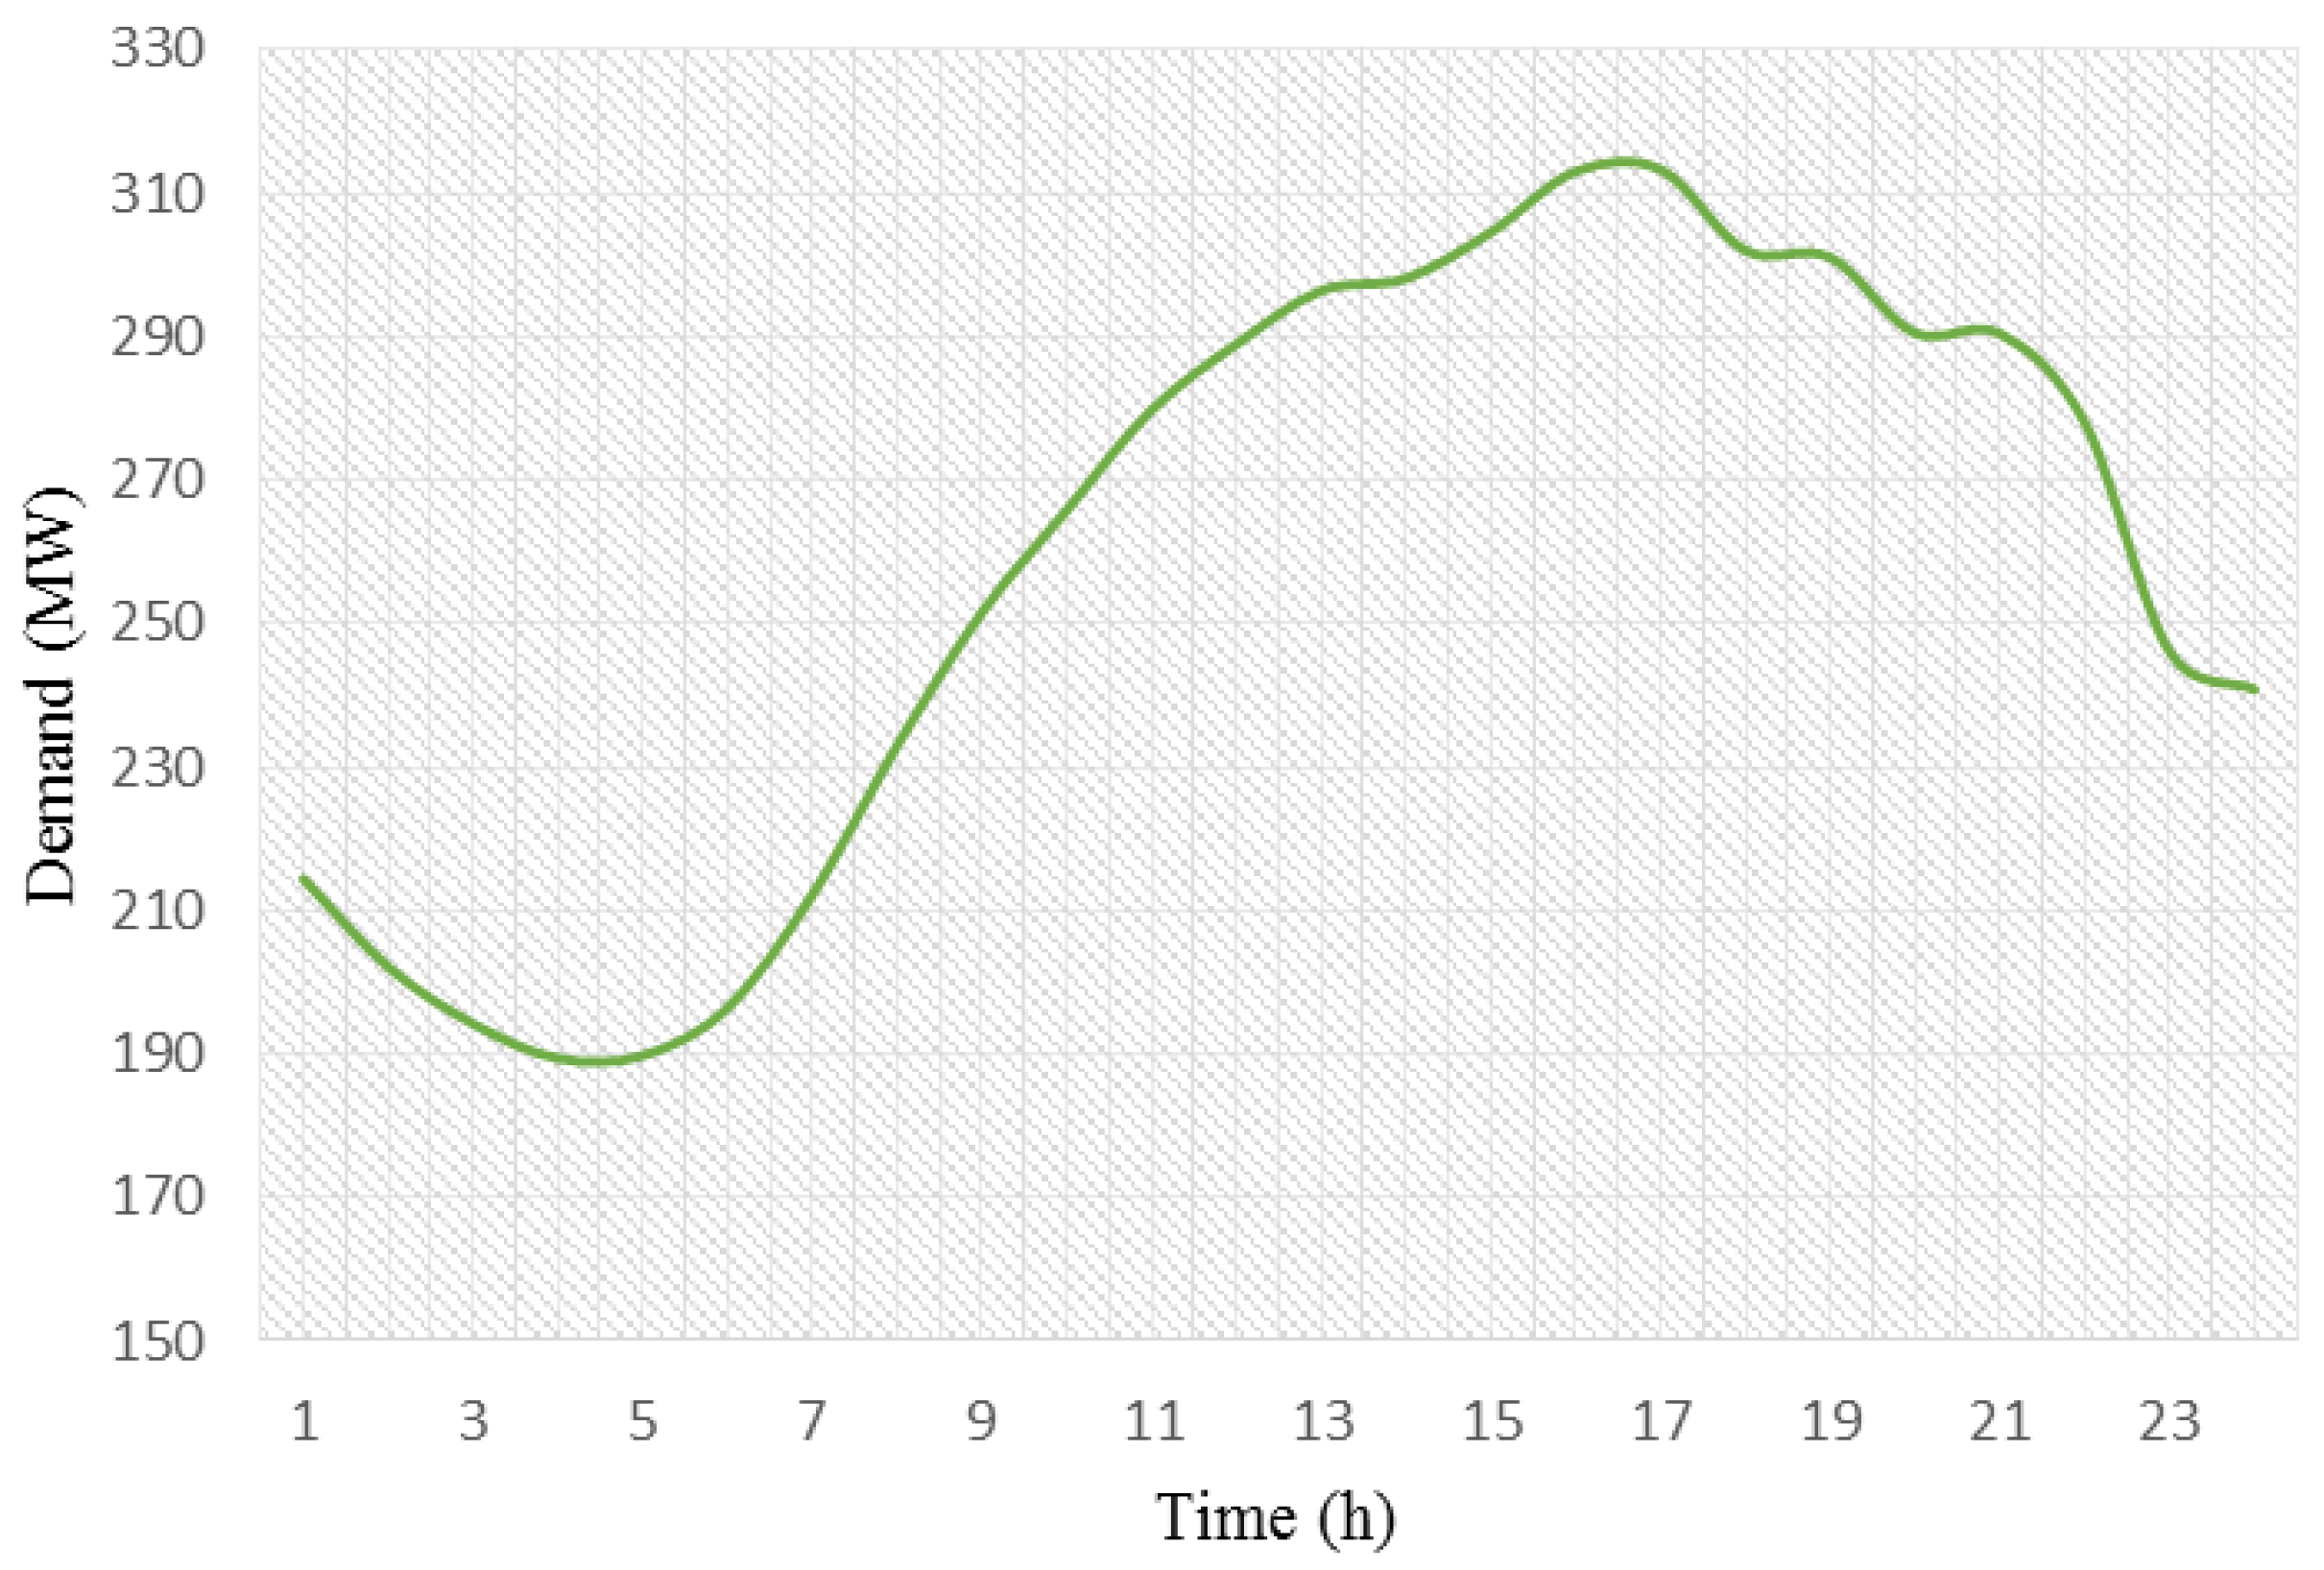
The load curve of this system is illustrated in Figure 2, in which 20%, 50%, and 30% of the present load are placed on bus 3, bus 4, and bus 5, respectively.
The required spinning reserve is set at 10% of the hourly load demand.
• Scenario 1. SCUC problem without considering V2G
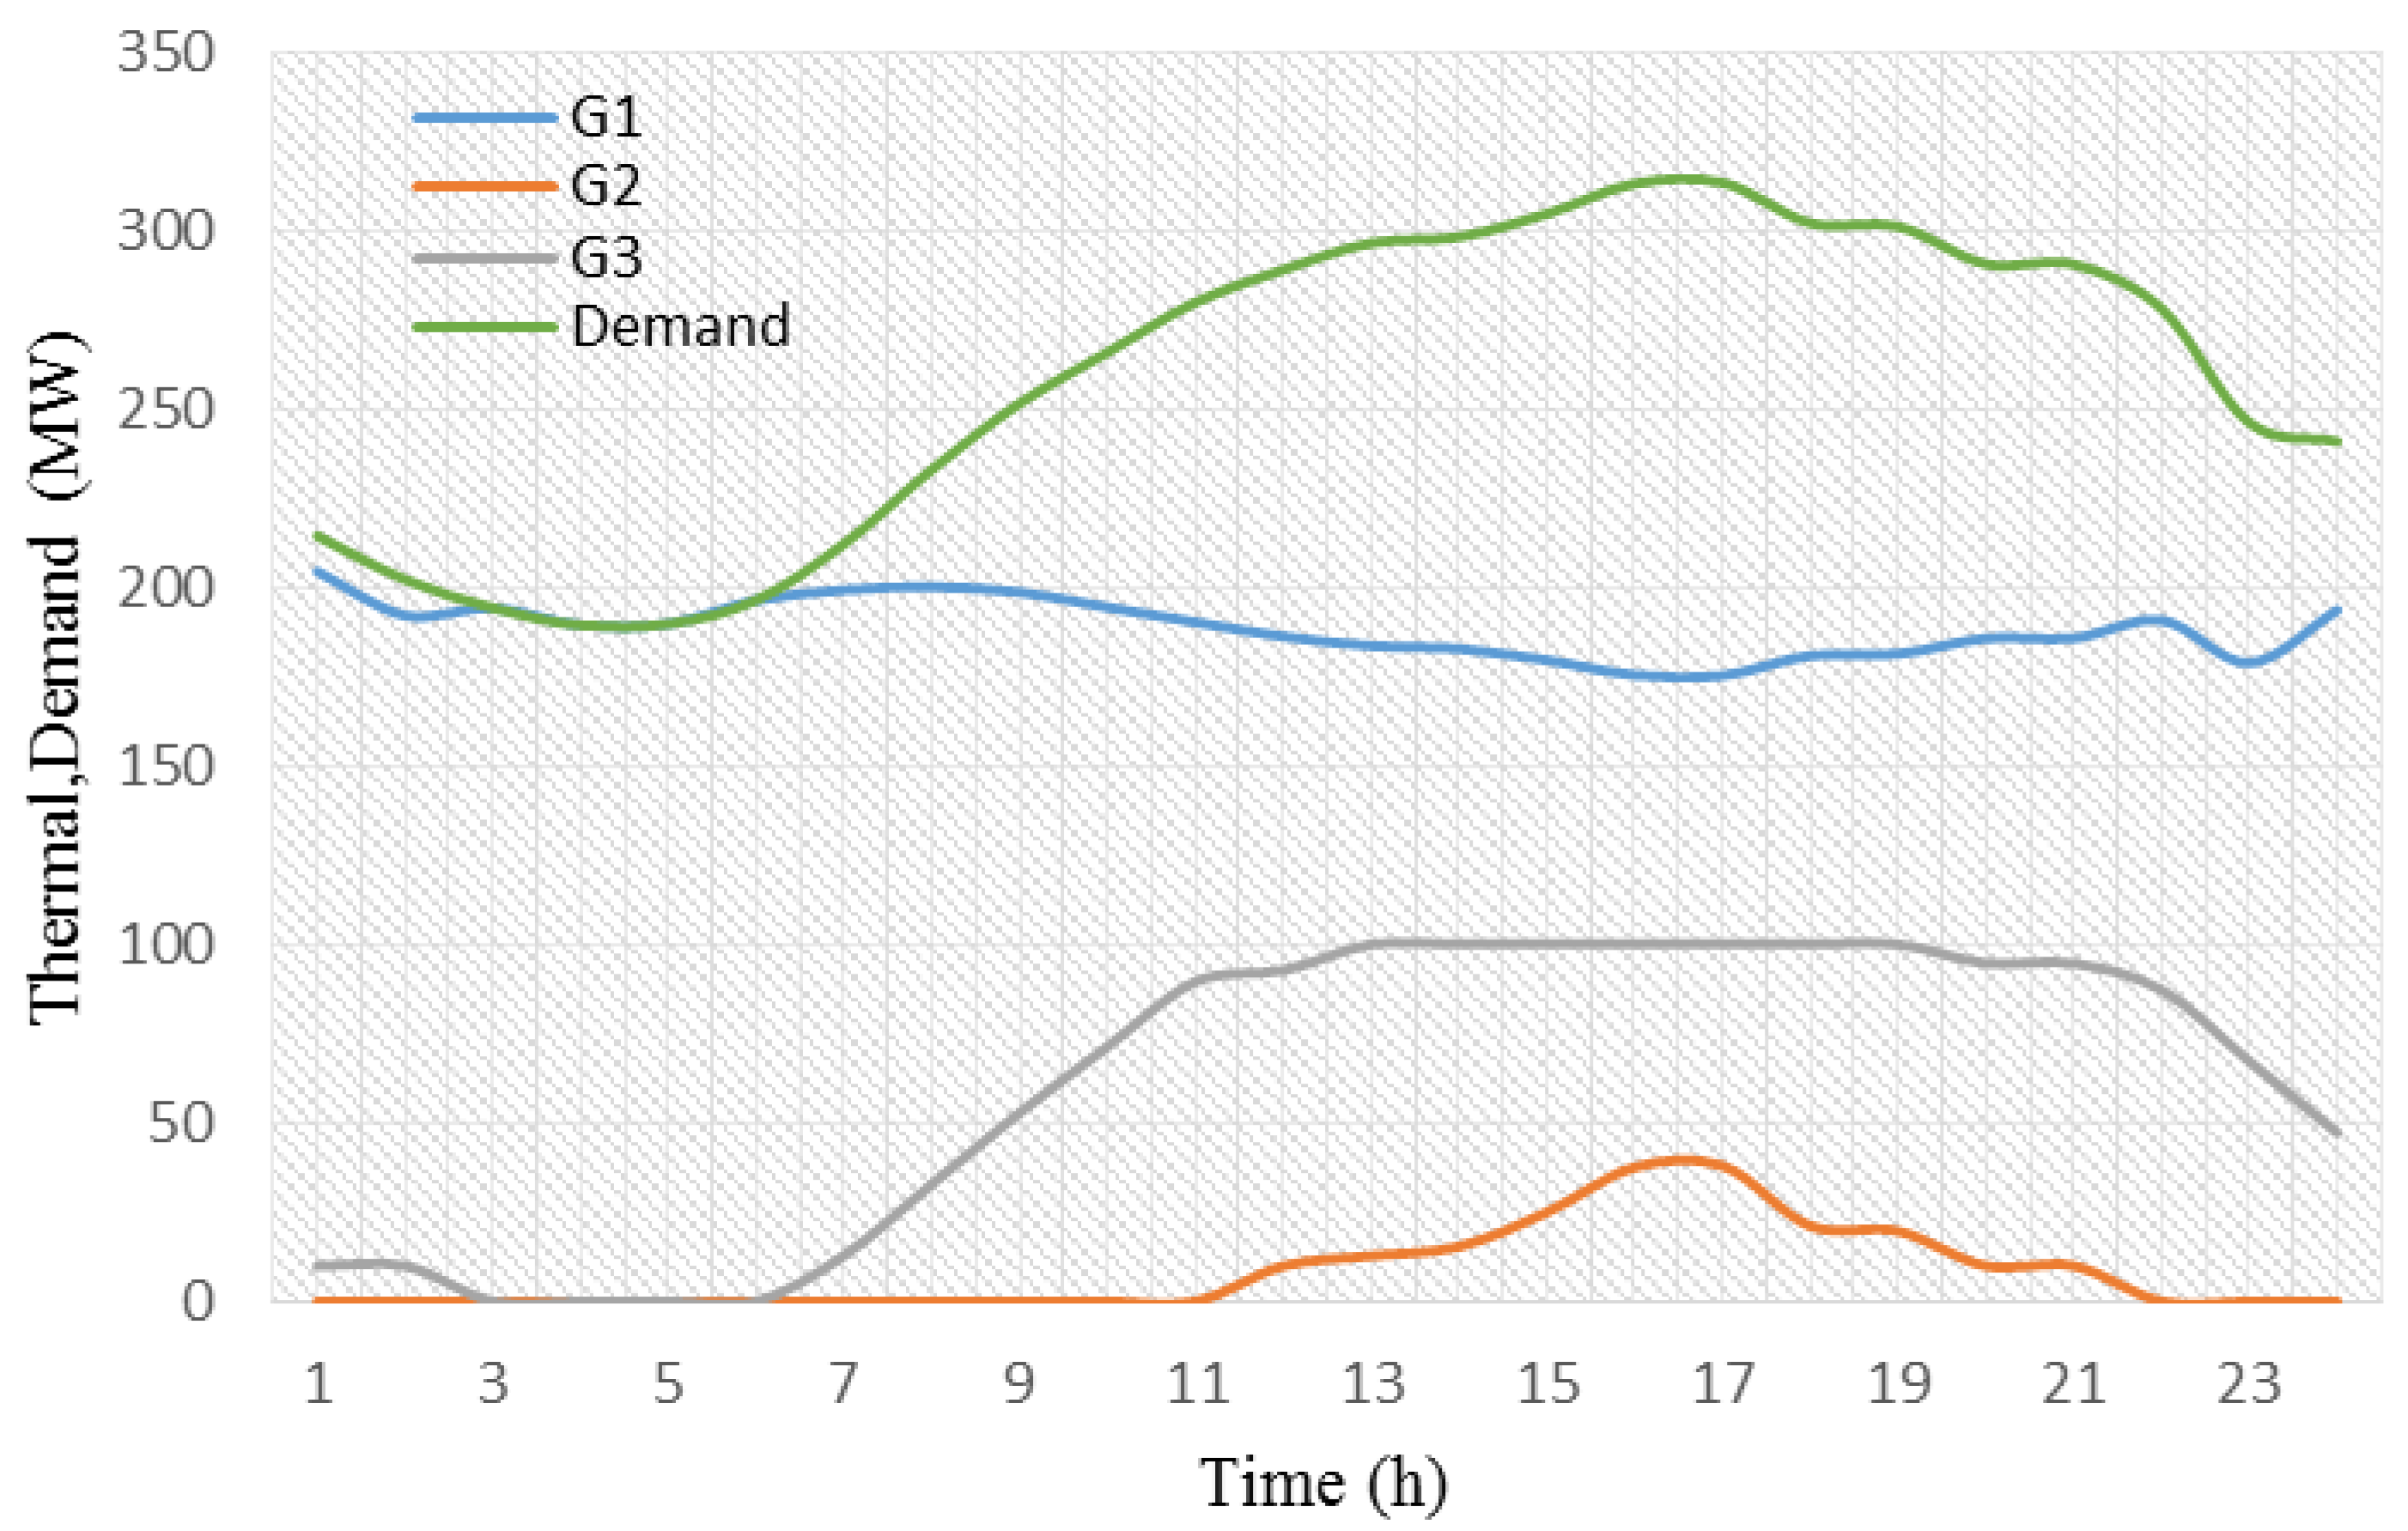
In this case, the SCUC problem without considering V2G is optimised. According to the previous relations, the total cost of operation of the 6-bus system is $128,508. The power dispatch for thermal units and the hourly prediction of load demand are illustrated in Figure 3. Generation unit 1 (G1) commits during all hours because of its low power production cost. Based on the objective function, the final target of the system operator is reducing the operation cost; then, by using low-cost generator, the operation cost will decrease. Unit 2 is activated only at peak load hours (12–21) because of its high production costs.
The locational marginal pricing (LMP) curves for different buses in the 6-bus system is depicted in Figure 4. Accounting for the load curve and the congestion of the transmission lines, LMP is a way for wholesale electric energy prices to reflect the value of electric energy at different buses. As it can be seen in this figure, due to the lack of congestion in the network lines between 1 to 8 h, the LMP values are the same for all buses. The LMP values differ between 9 to 22 h because of the congestion in line 3, so the maximum LMP occurs on bus 4. The LMP values will be the same again for all buses during 23 and 24 h, when lines are not congested.
• Scenario 2. SCUC problem in the presence of V2G
In this scenario, we consider a generating system consisting of three thermal units and a parking of electrical vehicles able to connect to the electrical grid. The parking is located in bus 4 while there are 10,000 V2G units in grid and only 33% of these units are available in the best situation. Maximum and minimum battery capacities of vehicles are 25 kWh and 10 kWh, respectively. The average generating capability of each vehicle is Pv = 15 kWh. It is considered that vehicles utilize solar cell technology and there is no cost for the recharge process of the units. A solar vehicle uses its excess charging capacity to provide power to the electric grid when the battery is fully charged. The frequency of charge and discharge for each vehicle is assigned to be one time per day. The charge value when a vehicle exits from the parking and the charge efficiency are considered to be 50% and 85%, respectively. The proposed price of the energy produced by V2Gs for the micro grid is 21 $/MWh. Equation (26) represents the total generating power of the vehicles:
P V 2 G , t = P v . N V 2 G , t .
The total generating cost for this scenario is $121,657, $6851 lower than that related to the first scenario.
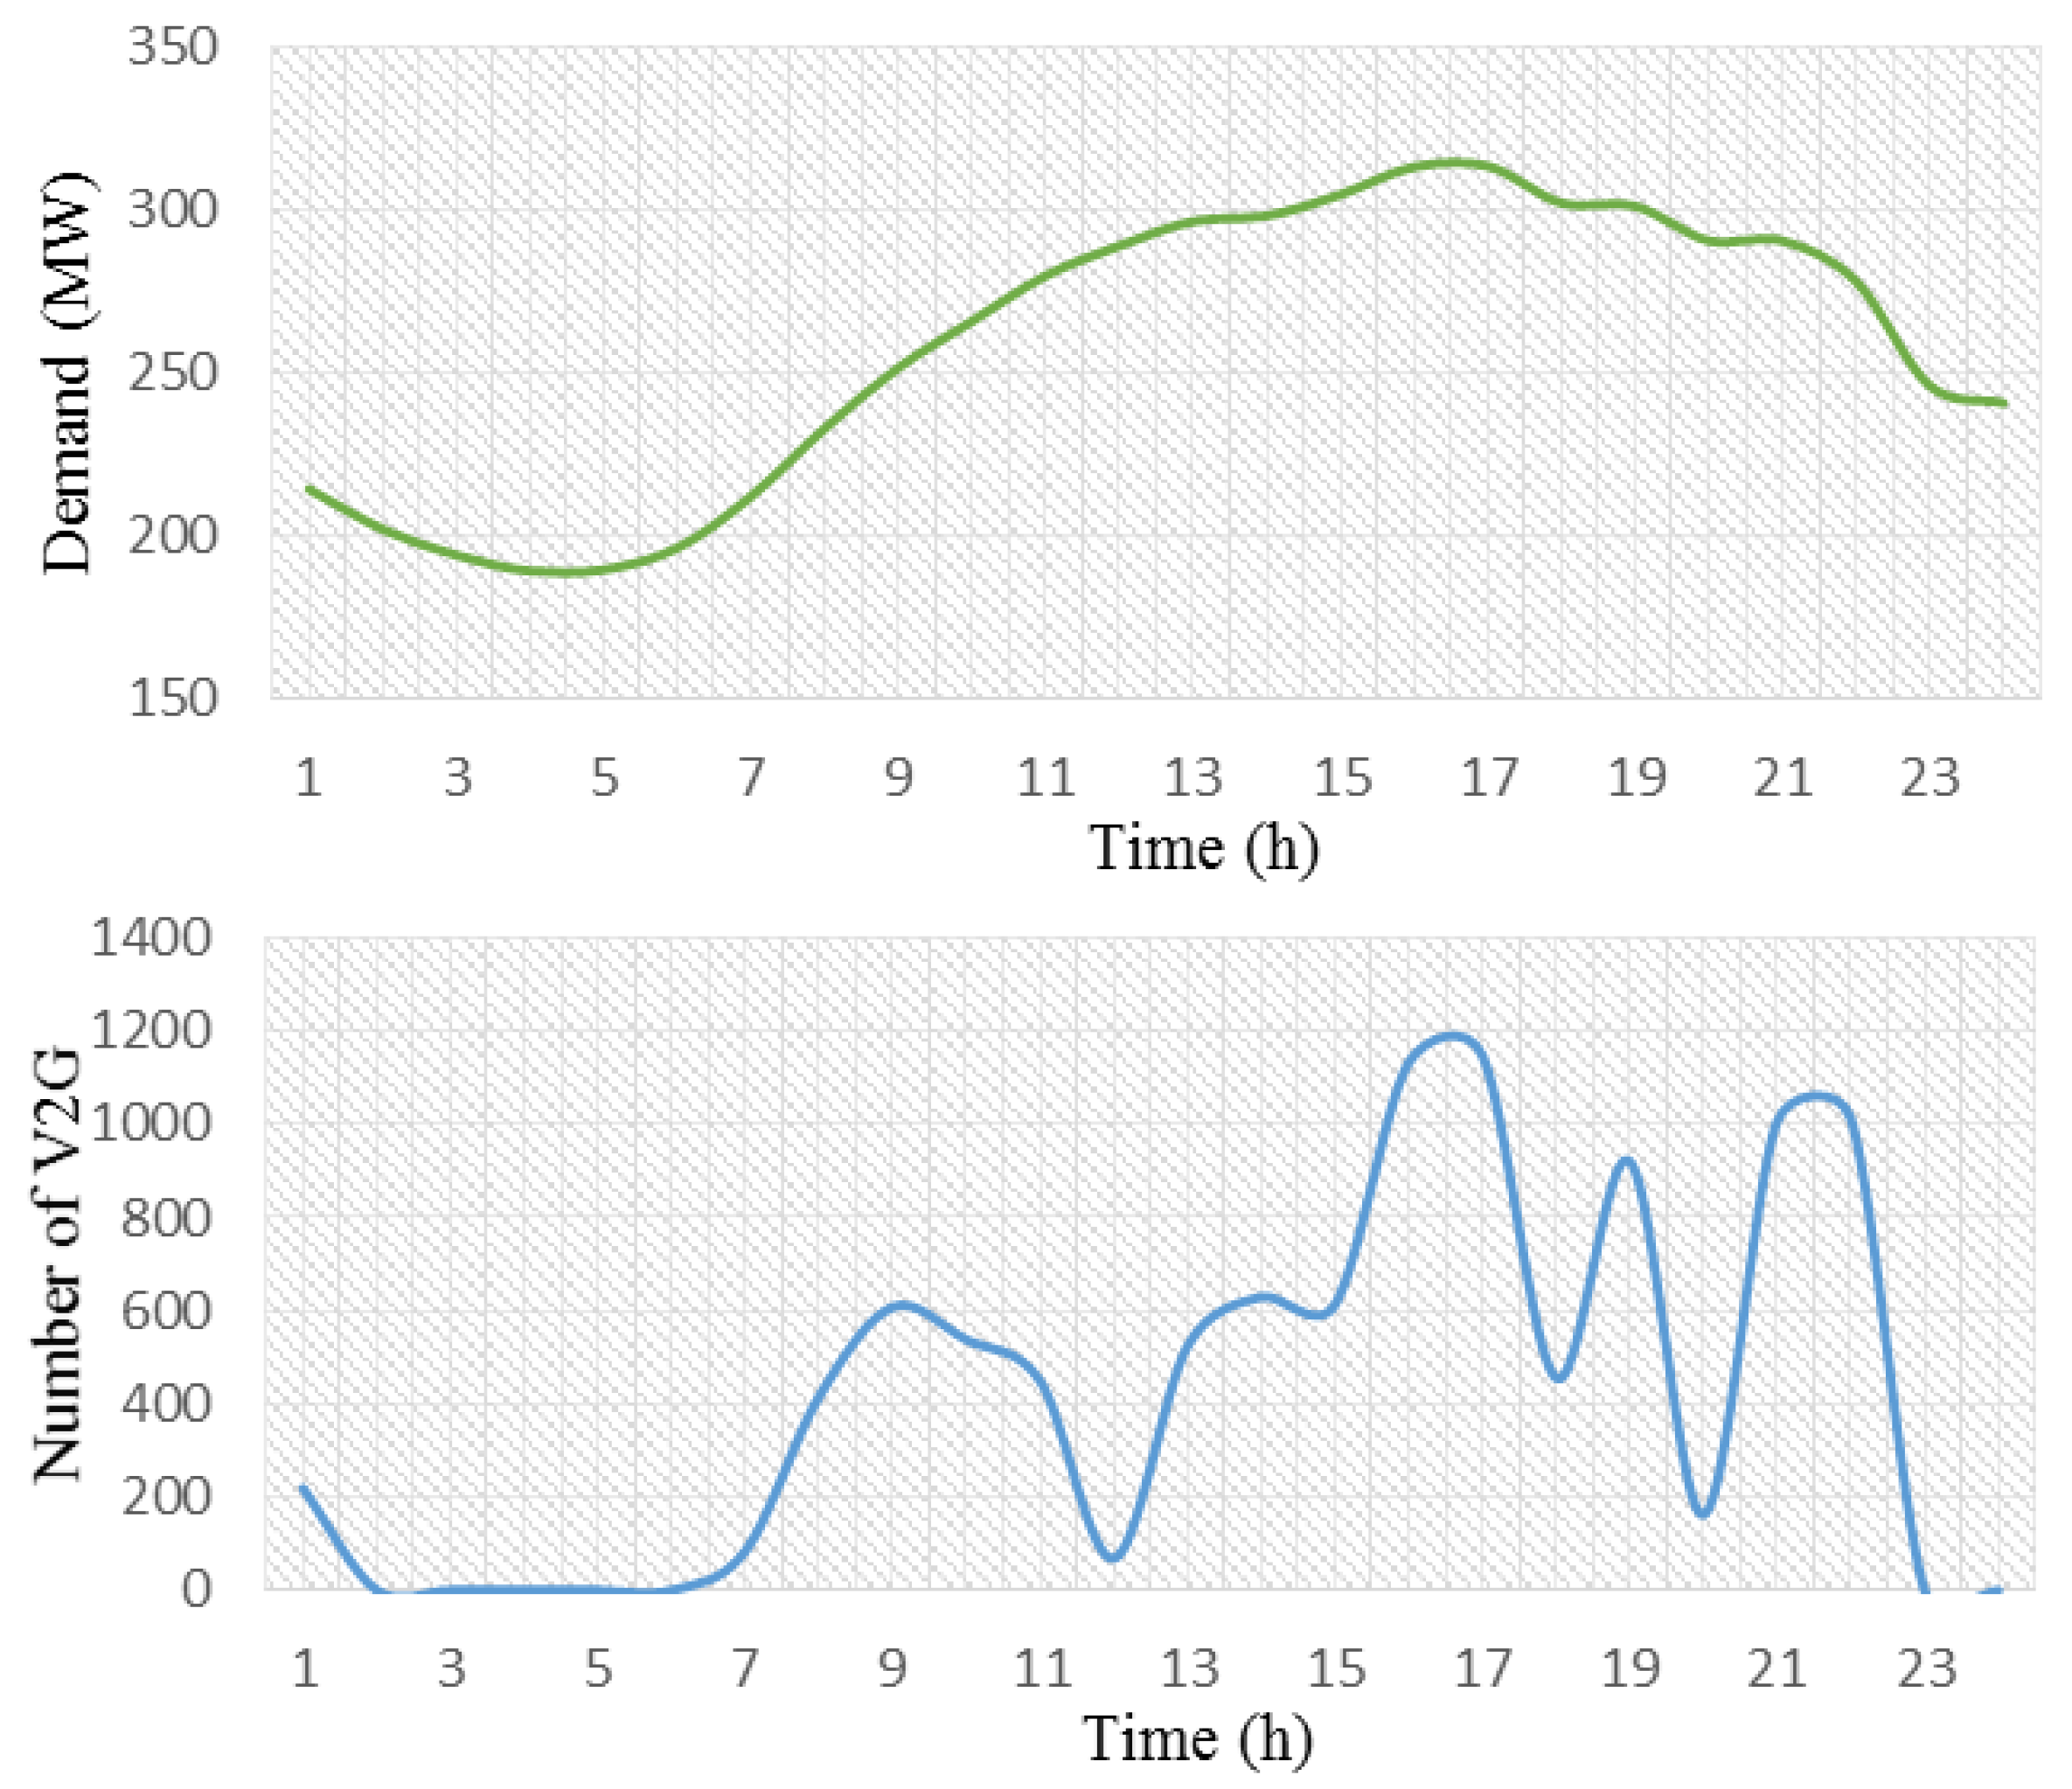
Similar to Scenario 1, due to the high generating cost of G2 and to the congestion in transmission lines, the commitment state of this unit is at its minimum level. As can be seen in Figure 5, the number of V2G units is proportional to the load demand in on-peak and off-peak hours of the day. When the demand is increased in peak load, the commitment of EVs are increased to satisfy the peak load.
The total operation cost includes the fuel cost of thermal units, the operation cost of electrical vehicles, and the start-up costs of thermal units. The fuel cost only includes the operation costs of the thermal units without considering start-up and shut-down cost.
According to the proposed curves in Figure 6, the fuel cost of thermal units and the total operation cost are coordinated with the hourly load demand.
As expected, in Figure 6 the thermal units’ fuel cost and the total operation cost are increased when the load demand increases, specifically during peak load hours.
The reduction of transmission lines’ congestion is one of the most highlighted effects of V2G. Considering the power flow in line 4 and comparing its value in the presence of V2G, a power flow reduction can be observed, specifically during peak load hours. The absence of unit 2 in the commitment schedule is one of the reasons for this condition. In addition, when the EVs in the parking lot that are located at bus 4 release the power and satisfy the bus 4 load, the congestion of line 4 consequently decreases dramatically. This difference is illustrated in Figure 7.
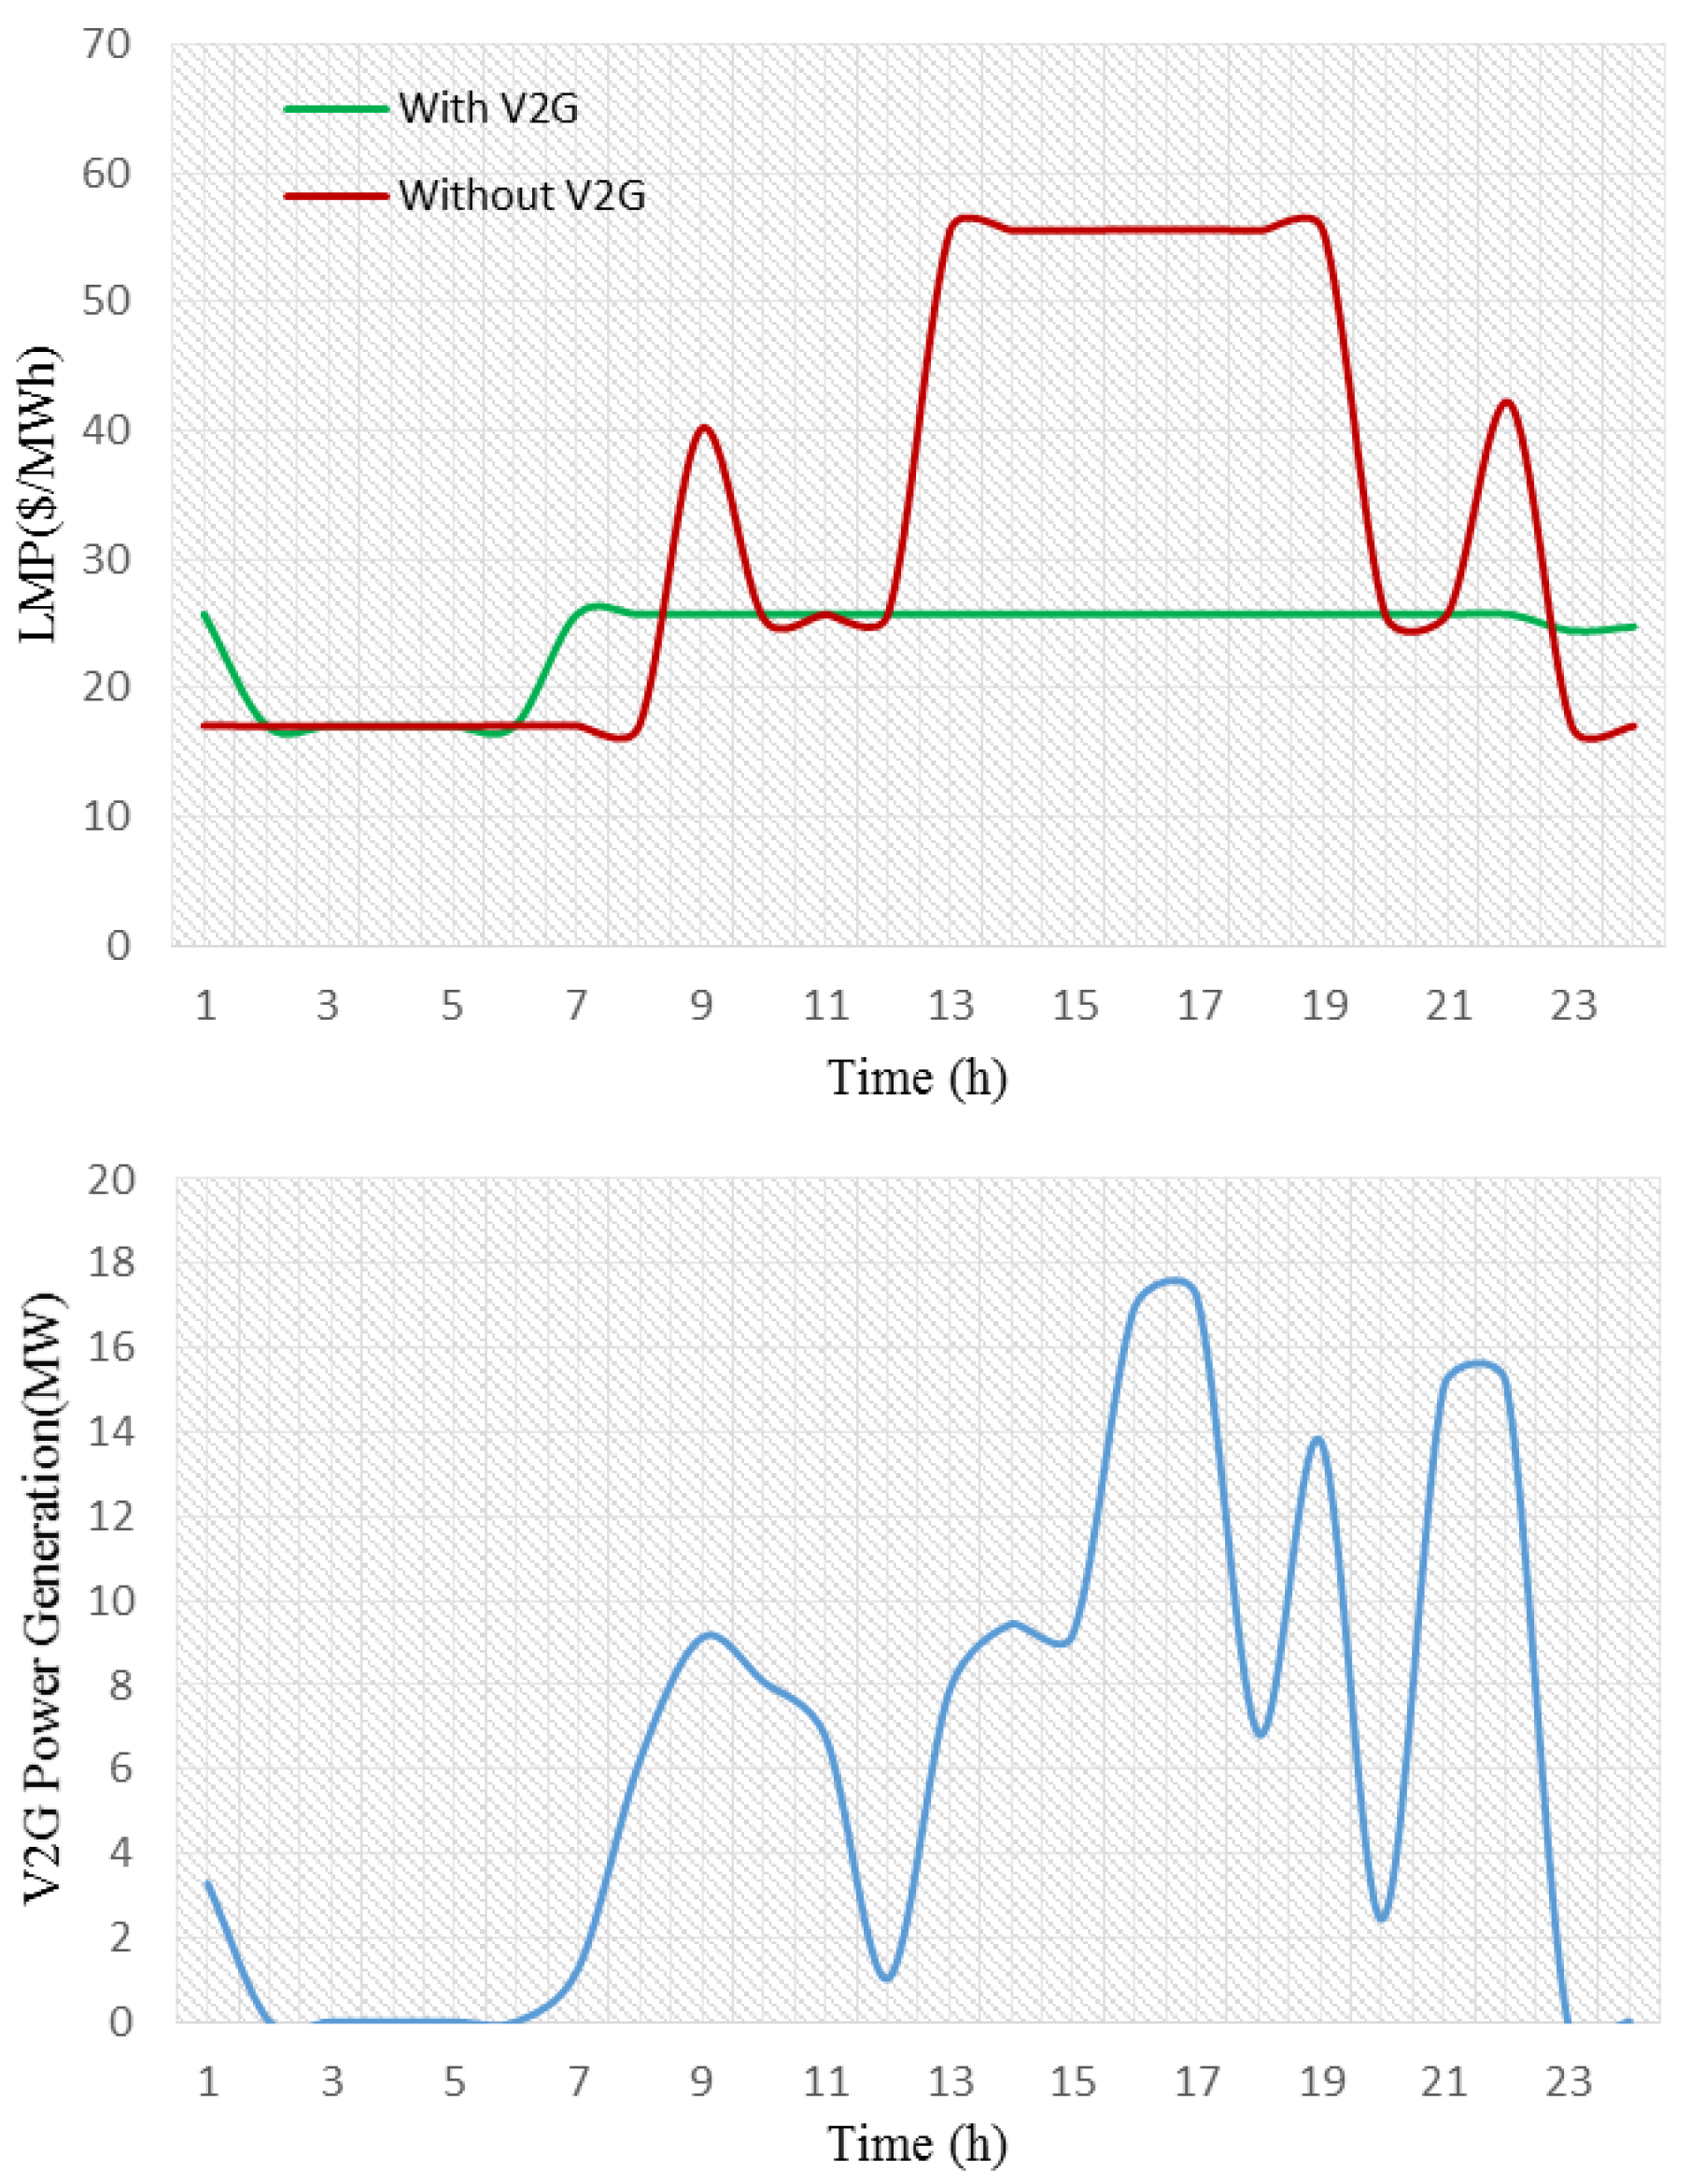
The presence of vehicles at the place of the charging station during peak hours as well as a maximum participation of vehicles in unit commitment scheduling can provide an LMP decrease for all buses. For example, Figure 8 shows an LMP curve of bus 4 for both cases (with and without V2G). Moreover, power produced by V2G during different hours has been depicted as a power curve in this figure. Considering the peak load demand of the grid between 13 to 19 h, the LMP value decreased in the presence of V2G.
The total production of the thermal units with and without V2G for a 24-h scheduling can be observed in Table 2.
Due to the congestion of the transmission lines (especially in line 3), it was not possible to utilize the maximum capacity of the cost-effective unit 1 without involving V2G. After installing EVs at bus 4 (as it can be deduced from the total generating power during the 24-h scheduling), the commitment of unit 1 increased compared to the situation in which V2G was not accessed. In this situation, unit 2 was not committed because of its high generation cost.
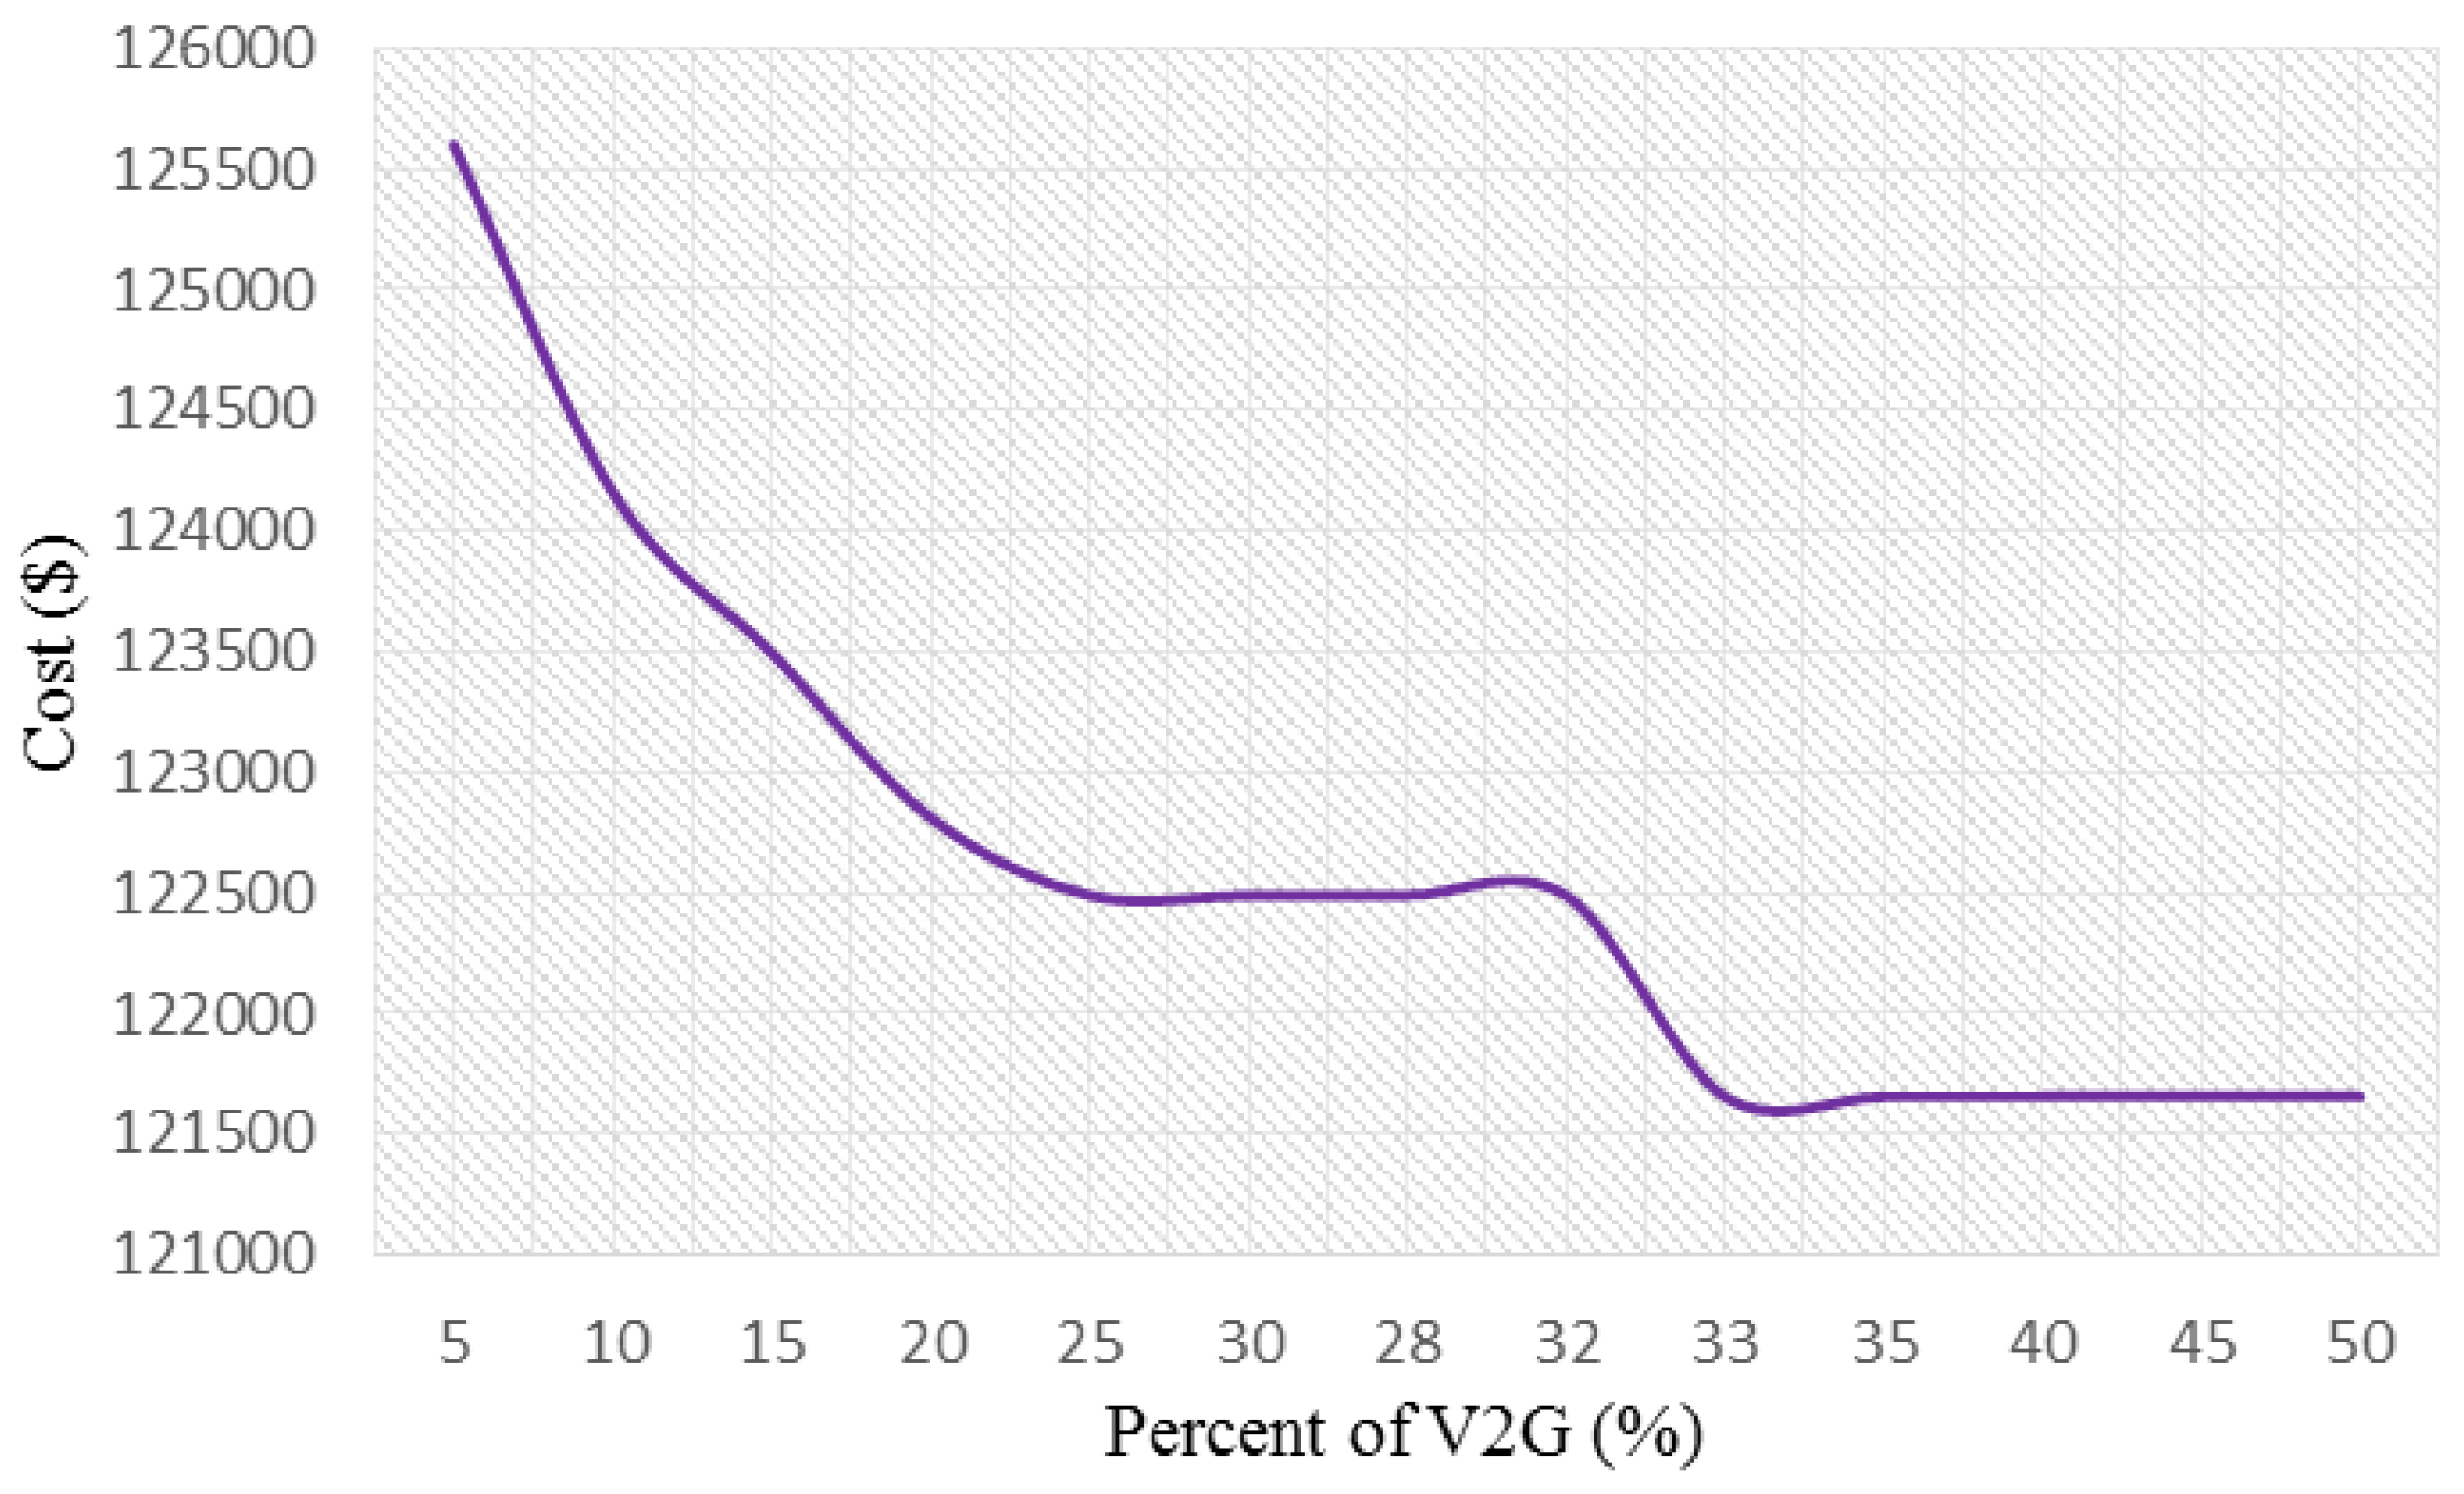
The grid’s operation cost is shown in Figure 9 for different EV penetration levels. Referring to Figure 9, along with the increasing involvement of EVs in the power grid, the operation cost decreases significantly until 33%, remaining constant beyond this value. This shows that further increase in number of EVs (more than 33%) does not necessarily result in any further decrease in the operation cost. It is also concluded that unreasonably increasing the involvement of EVs into the power grid does not improve the total cost.
The accurate placement of the parking station is one of the most important tasks. The operation cost of grids in the SCUC problem is shown in Figure 10 for different locations of the parking station. Referring to Figure 10, bus 4 is the best option for the installation of the EV charging station because the majority of the load (50%) is located on bus 4. When the EVs satisfy these loads, the unit G2 (an expensive unit) does not commit in the generation schedule, and the operation cost is reduced.

4.2. Case 2: The Extended IEEE 30-Bus System

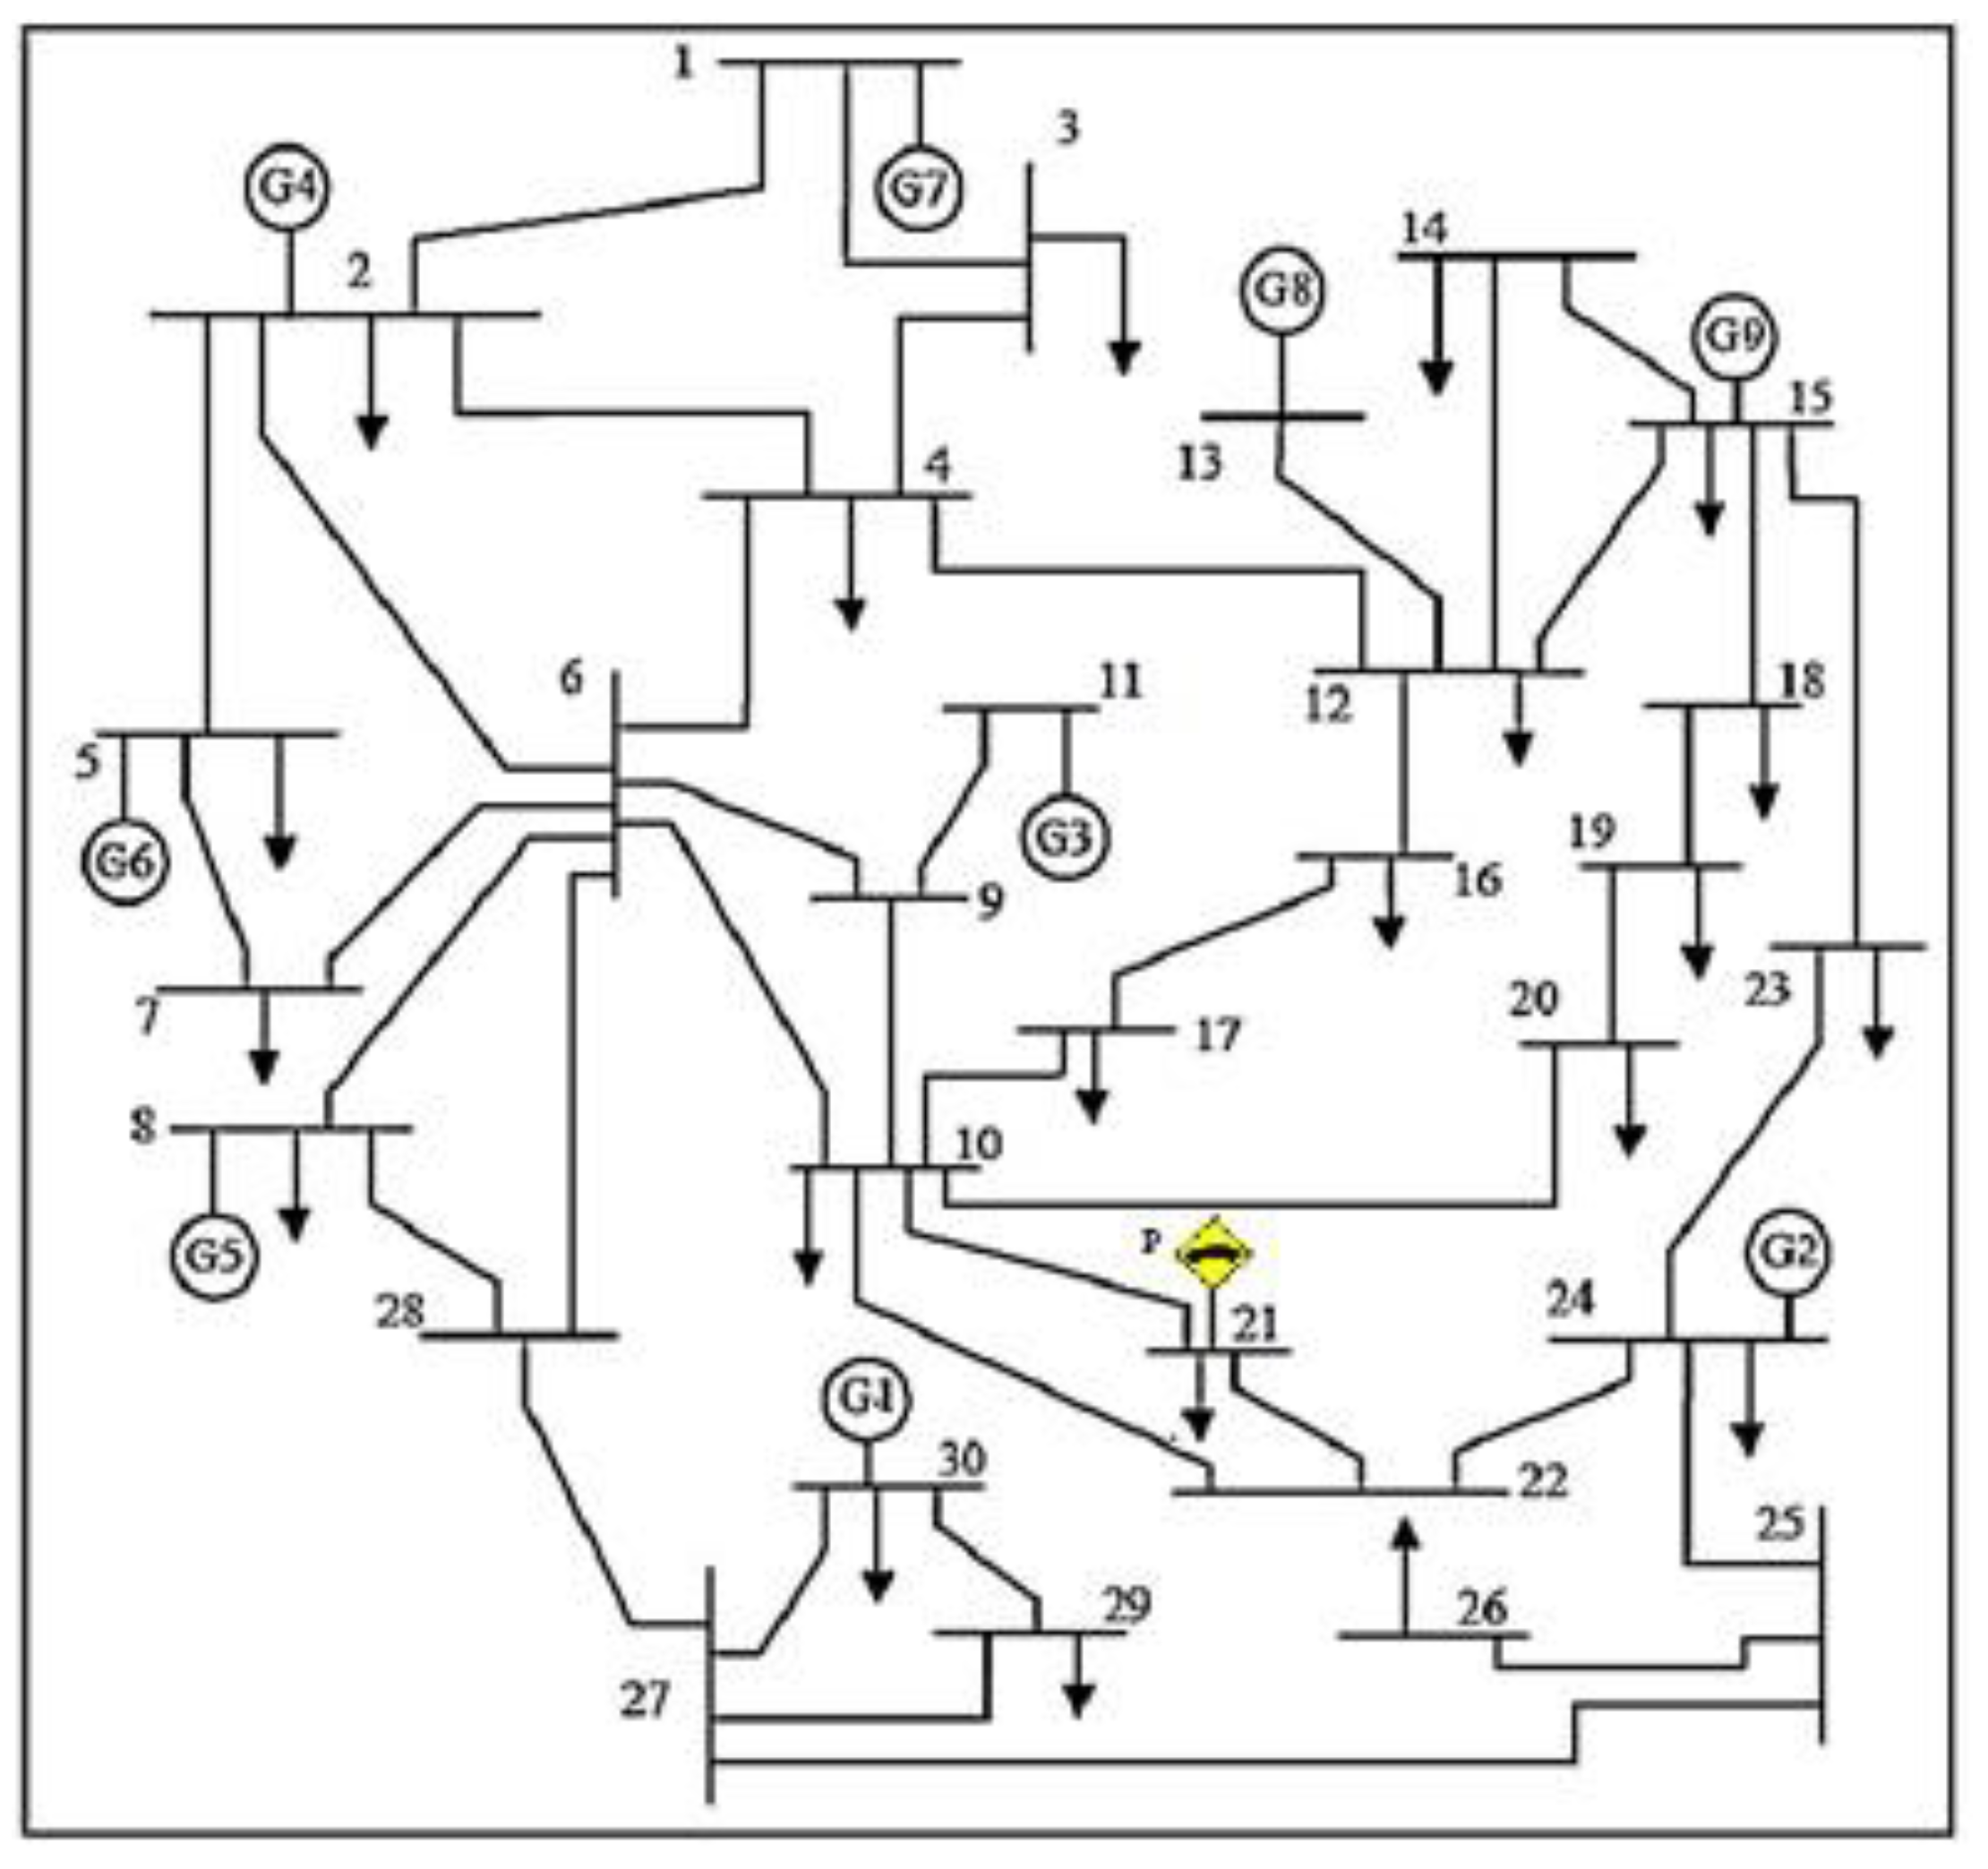
This system consists of 9 thermal units and 41 transmission lines. The V2G charging station is located at bus 21. The spinning reserve is considered as 10% of the hourly load demand.
In this case study, the applicability of the proposed method in the case of a larger-scale system with and without the presence of V2G is investigated. A single line diagram of the extended IEEE 30-bus system [1] considering the location of the V2G parking is shown in Figure 11.
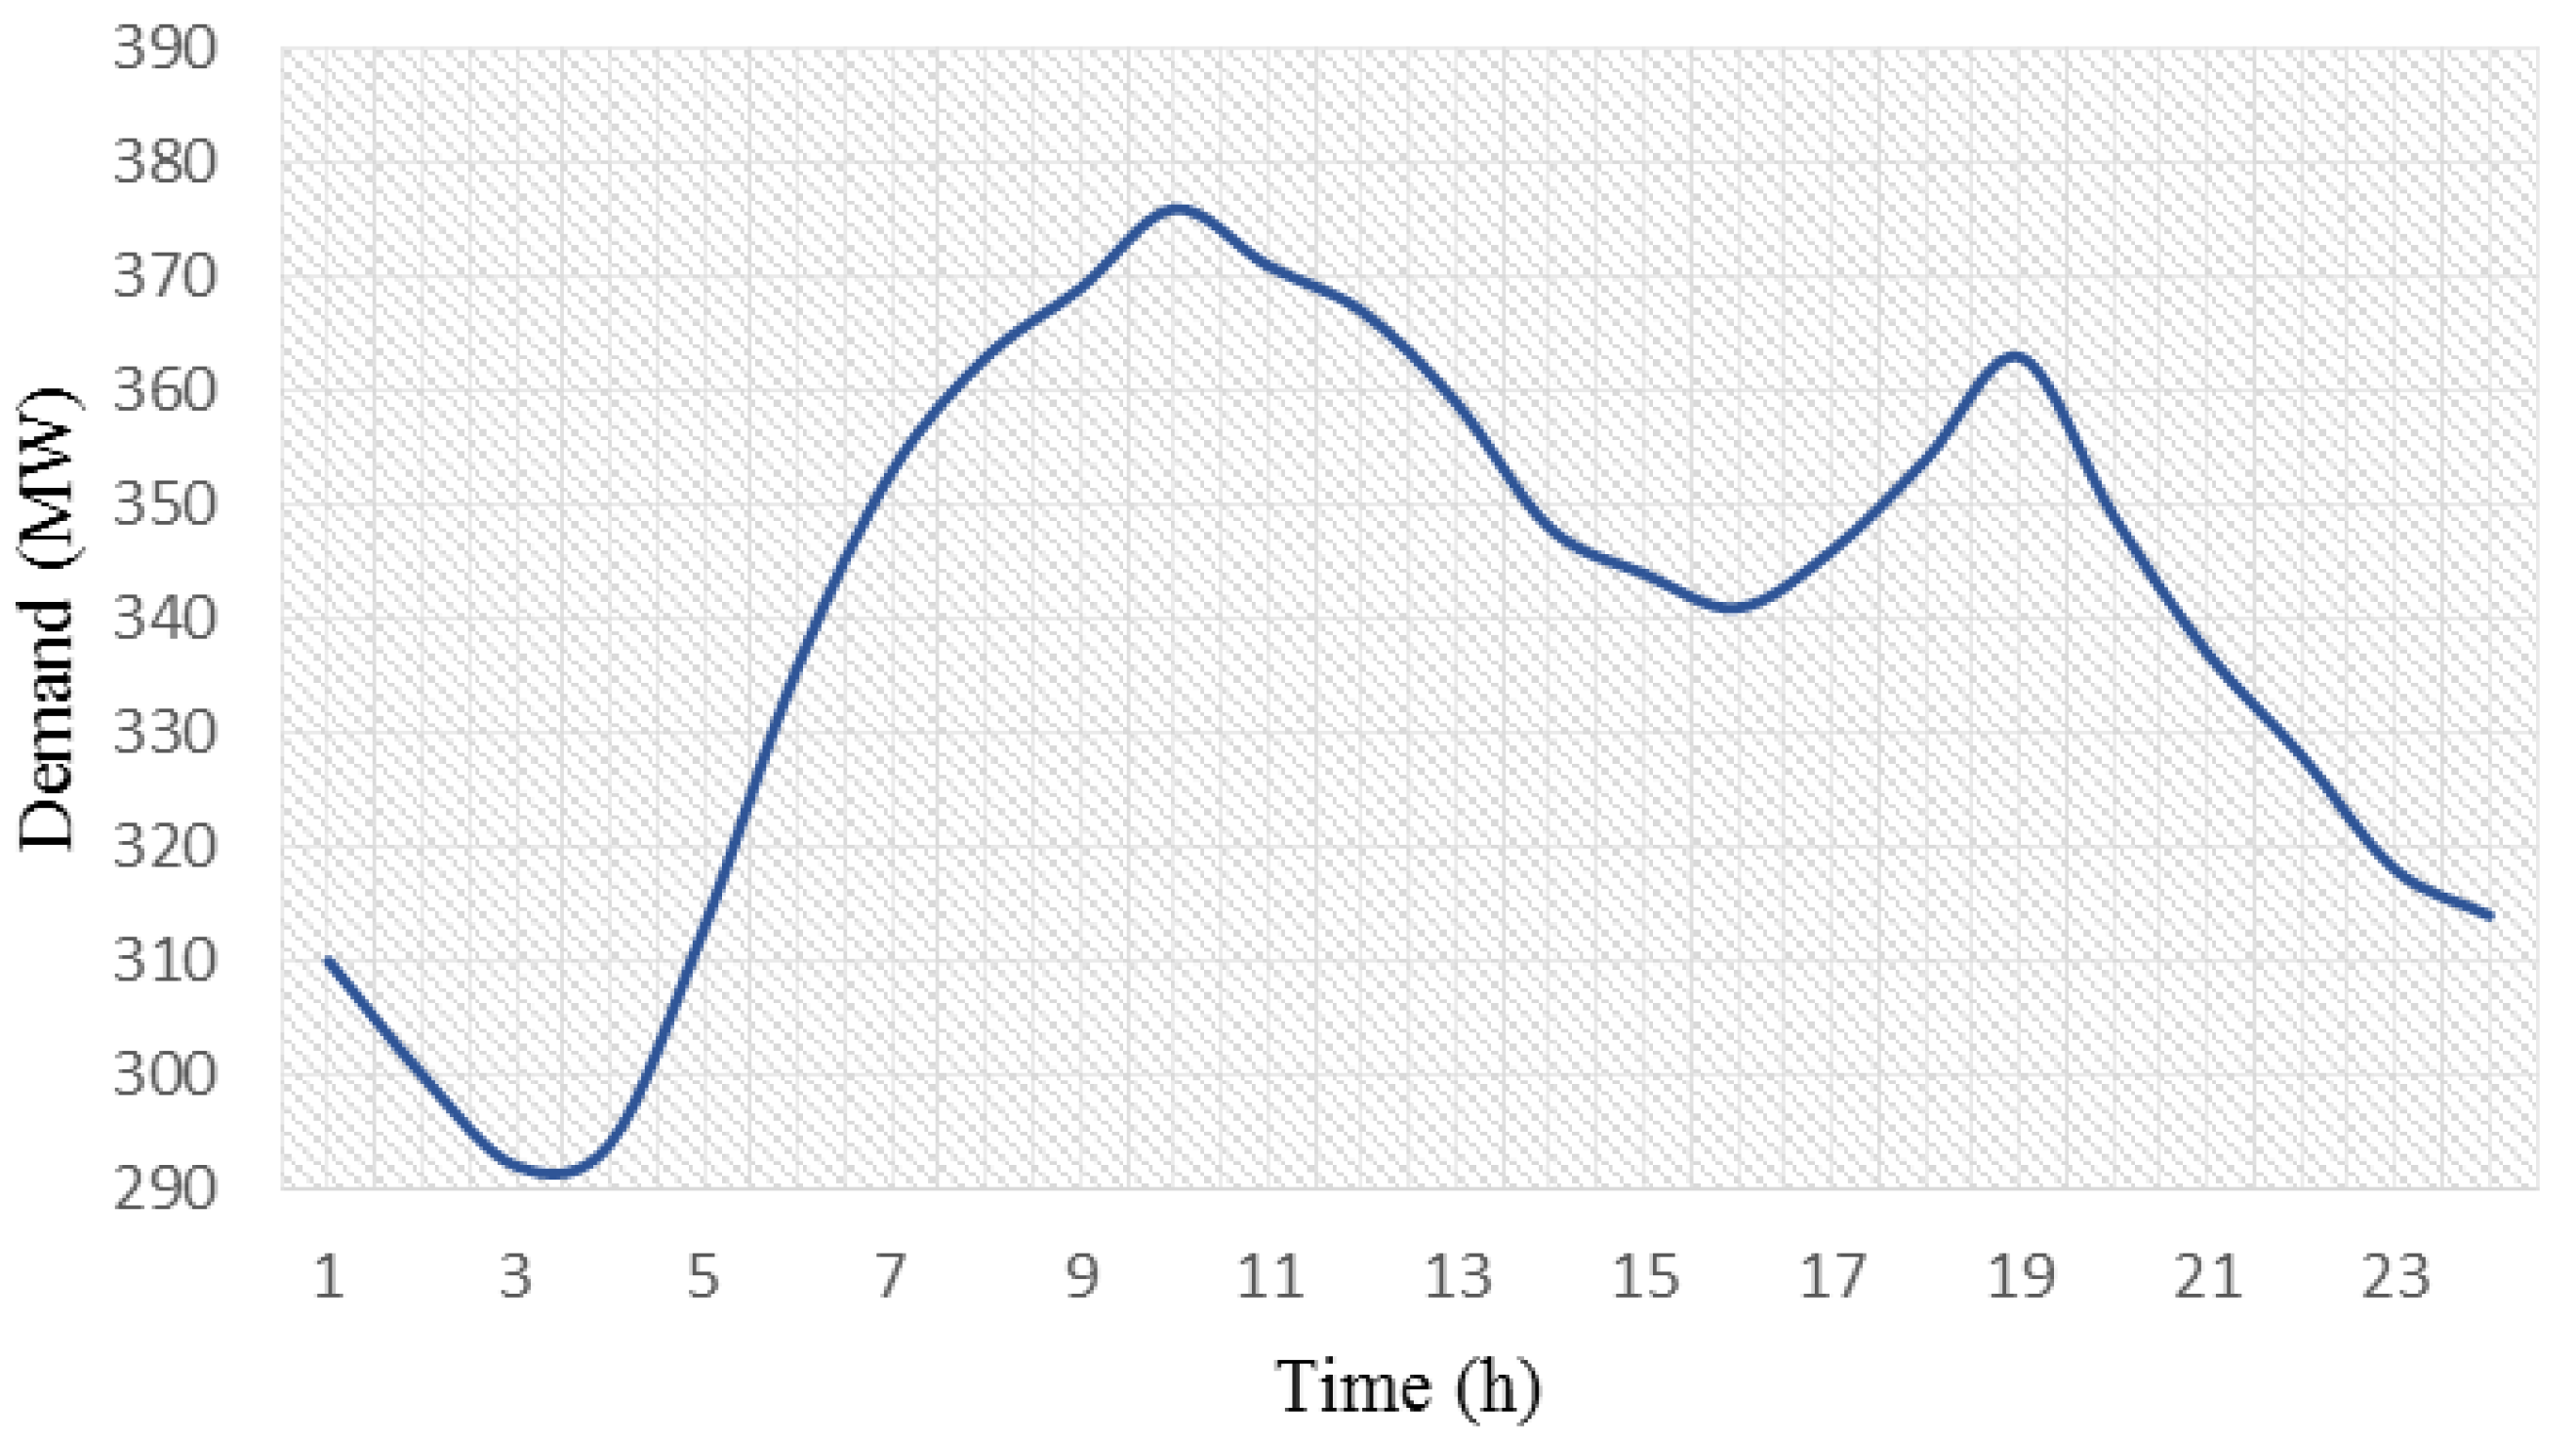
Data for the thermal units are detailed in [1]. The load demand forecast for 24 h ahead is shown in Figure 12.
• Scenario 1. SCUC problem without considering V2G
Based on the equations mentioned in section 0, the total cost of operation of the 30 bus system is $162,423.
The average LPM of each bus for a 24 h scheduling is depicted by Figure 13.
The presence of three loads on buses 18, 19 and 20 is a reason for LMP increment on bus 18 which plays the role of main supplying bus.
• Scenario 2. The SCUC problem in presence of V2G
In this scenario, a V2G charging station is installed at bus 21. The electrical vehicle specifications are the same as in the first case study. The operation cost for this scenario is $157,239; this value is reduced by $5185 due to the involvement of electrical vehicles in the system.
The load demand curve and the number of necessary electrical vehicles for an optimal operation of the system are shown in Figure 14. As one can see, the optimal number of employed vehicles follows the load pattern changes in order to satisfy the problem constraints as well as to meet the operation requirements.
Referring to the mathematical model proposed in this paper, the optimal presence percent of electrical vehicles in a charging station is calculated. In this case, the optimal value is 13%, which results in the minimum operating cost. As can be seen in Figure 15, increasing the attending share of electric vehicles at the charging station beyond 13% does not provide any further reduction of the system operating costs.
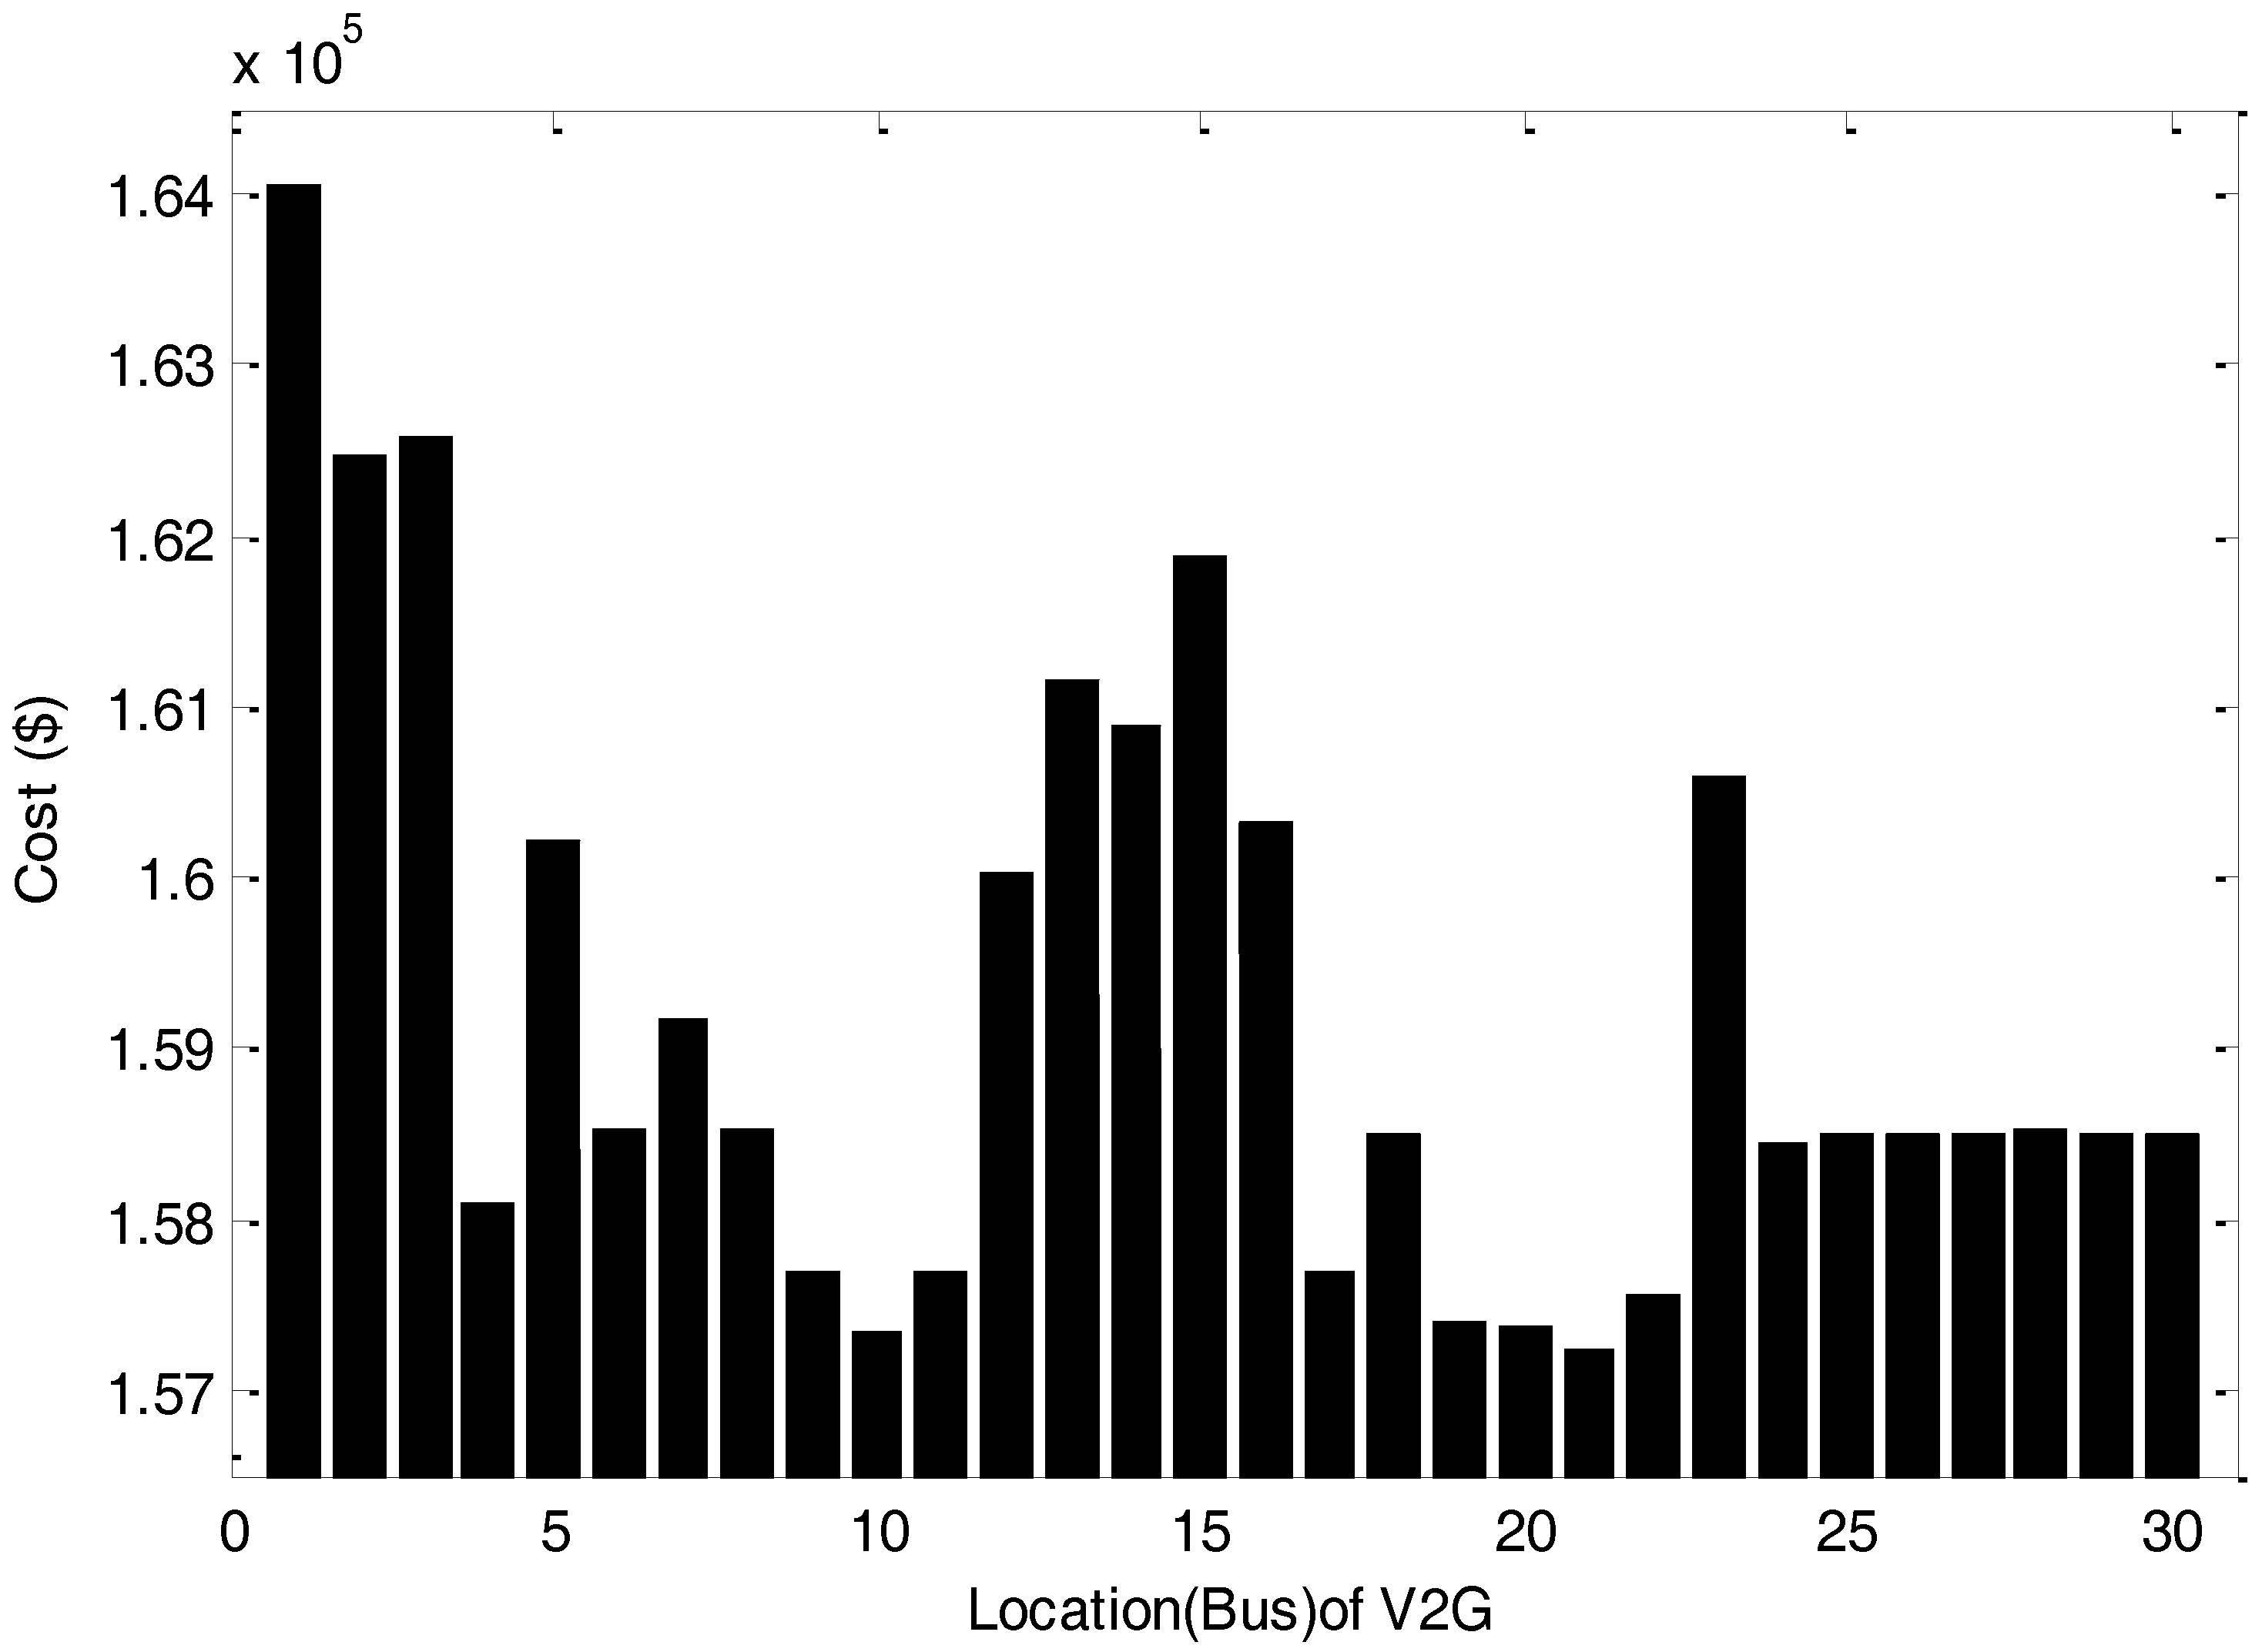
The operating cost of electrical vehicles in SCUC problem for different bus locations is shown in Figure 16. It can be shown that bus 21 should be selected as the best location for the charging station.

5. Conclusions

The paper investigates the impact of vehicle-to-grid systems (V2Gs) under security-constrained unit commitment (SCUC) on a real power system in which electric vehicle parking stations are installed to different buses. In order to concentrate on the proposed method, we first considered a solution to the SCUC problem without considering V2G, and then a solution to the SCUC problem in the presence of V2G. The reduction of the hourly operation cost is demonstrated. Another aim of this paper was the specification of the optimal number of vehicles needed in the parking each hour. This feature can help system operators and designers in designing, planning, and operating such power systems. In this regard, the determination of the optimal penetration percent of electric vehicles during each hour of scheduling is another obtained result. Once this penetration percent reaches a value exceeding a specified level, the operation cost will not decrease any further because of the price of the power produced by electric vehicles as well as of the power line flow limits.

Acknowledgments

All sources of funding of the study should be disclosed. Please clearly indicate grants that you have received in support of your research work. Clearly state if you received funds for covering the costs to publish in open access.

Author Contributions

Mahmood Hosseini Imani, Mojtaba Jabbari Ghadi, Shahaboddin Shamshirband and Marius M. Balas contributed to the design and analysis of the experiments; Mahmood Hosseini Imani performed the experiments. Mojtaba Jabbari Ghadi, Shahaboddin Shamshirband, and Marius M. Balas revised the paper in terms of writing.

Conflicts of Interest

The authors declare no conflict of interest.

Nomenclature

bIndex of bus
cfCost function
lIndex of transmission lines
tScheduling hour
iNumber of thermal units
Pi,tPower generation of unit i at time t
Pi,tmaxMaximum generation capacity of unit i at time t
Pi,tminMinimum generation capacity of unit i at time t
Ii,tStatus of unit i at hour t (1 on/ 0 off)
DtLoad demand at time t
SUCiStart-up cost of unit i
SDCiShut-down cost of unit i
RtSystem reserve
RURiRamp up rate of unit i
RDRiRamp down rate of unit i
kDenotes a segment of curves
Si,tSlop of segment k in linearized
Pi,kDenote power output of unit i at segment k
vDenotes “vehicle”
PvCapacity of each vehicle
N V 2 G , t max Maximum number of vehicles at parking at time t
NV 2G tNumber of vehicles connected to the grid at time t
N V 2 G max Total vehicles in the system
SOCState of charge
XlInductance of line l
Pl,tReal power flow on line l at time t
PlmaxMaximum capacity of line l
Lf,bSet of lines starting from bus b
Lt,bSet of lines
DbSet of loads which are connected to bus b
θBus angle
BbSet of units which are connected to bus b

References

  1. Shahidehpour, M.; Yamin, H.; Li, Z. Market Operations in Electric Power Systems; John Wiley & Sons: New York, NY, USA, 2002. [Google Scholar]
  2. Wood, A.J.; Wollenberg, B.F. Power Generation, Operation, and Control; John Wiley & Sons: New York, NY, USA, 2012. [Google Scholar]
  3. Daneshi, H.; Daneshi, A.; Tabari, N.M.; Jahromi, A.N. Security-constrained unit commitment in a system with wind generation and compressed air energy storage. In Proceedings of the 2009 6th International Conference on the European Energy Market, Leuven, Belgium, 27–29 May 2009; pp. 1–6. [Google Scholar]
  4. Marneris, I.G.; Biskas, P.N.; Bakirtzis, A.G. Stochastic and deterministic unit commitment considering uncertainty and variability reserves for high renewable integration. Energies 2017, 10, 140. [Google Scholar] [CrossRef]
  5. Takashi, M.; Aziz, M.; Oda, T.; Uetsuji, A.; Watanabe, Y.; Kashiwagi, T. Annual Assessment of Large-Scale Introduction of Renewable Energy: Modeling of Unit Commitment Schedule for Thermal Power Generators and Pumped Storages. Energies 2017, 10, 738. [Google Scholar] [CrossRef]
  6. Zhang, C.; Xu, Y.; Dong, Z.Y.; Wong, K.P. Robust Coordination of Distributed Generation and Price-Based Demand Response in Microgrids. IEEE Trans. Smart Grid. 2017, 1. [Google Scholar] [CrossRef]
  7. Pourmousavi, S.A.; Nehrir, M.H.; Sharma, R.K. Multi-timescale power management for islanded microgrids including storage and demand response. IEEE Trans. Smart Grid 2015, 6, 1185–1195. [Google Scholar] [CrossRef]
  8. Muhammad, A.; Oda, T.; Mitani, T.; Watanabe, Y.; Kashiwagi, T. Utilization of electric vehicles and their used batteries for peak-load shifting. Energies 2015, 8, 3720–3738. [Google Scholar]
  9. Williams, B.D.; Kurani, K.S. Commercializing light-duty plug-in/plug-out hydrogen-fuel-cell vehicles: “Mobile Electricity” technologies and opportunities. J. Power Sources 2007, 166, 549–566. [Google Scholar] [CrossRef]
  10. Lu, L.; Wen, F.; Ledwich, G.; Huang, J. Unit commitment in power systems with plug-in hybrid electric vehicles. Int. Trans. Electr. Energy Syst. 2013, 23, 1205–1220. [Google Scholar] [CrossRef]
  11. Lund, H.; Kempton, W. Integration of renewable energy into the transport and electricity sectors through V2G. Energy Policy 2008, 36, 3578–3587. [Google Scholar] [CrossRef]
  12. Guan, X.; Zhai, Q.; Papalexopoulos, A. Optimization based methods for unit commitment: Lagrangian relaxation versus general mixed integer programming. In Proceedings of the 2003 IEEE Power Engineering Society General Meeting (IEEE Cat. No. 03CH37491), Toronto, ON, Canada, 13–17 July 2003; Volume 2, pp. 13–17. [Google Scholar]
  13. Gams. Cutting Edge Modeling. Available online: http://www.gams.com (accessed on 5 March 2018).
  14. Ranganathan, P.; Nygard, K. Smart grid data analytics for decision support. In Proceedings of the 2011 IEEE Electrical Power and Energy Conference, Winnipeg, MB, Canada, 3–5 October 2011; pp. 315–321. [Google Scholar]
  15. Ghadi, M.J.; Baghramian, A.; Imani, M.H. An ICA based approach for solving profit based unit commitment problem market. Appl. Soft Comput. 2016, 38, 487–500. [Google Scholar] [CrossRef]
  16. Darin, M.; Delarue, E.; D’haeseleer, W. Integrating electric vehicles as flexible load in unit commitment modeling. Energy 2014, 65, 285–294. [Google Scholar]
  17. Imani, S.M.H.; Niknejad, P.; Barzegaran, M.R. The impact of customers’ participation level and various incentive values on implementing emergency demand response program in microgrid operation. Int. J. Electr. Power Energy Syst. 2018, 96, 114–125. [Google Scholar] [CrossRef]
  18. Ghadi, M.J.; Karin, A.I.; Baghramian, A.; Imani, M.H. Optimal power scheduling of thermal units considering emission constraint for GENCOs’ profit maximization. Int. J. Electr. Power Energy Syst. 2016, 82, 124–135. [Google Scholar] [CrossRef]
  19. Han, X.; Zhou, M.; Li, G.; Lee, K.Y. Stochastic Unit Commitment of Wind-Integrated Power System Considering Air-Conditioning Loads for Demand Response. Appl. Sci. 2017, 7, 1154. [Google Scholar] [CrossRef]
  20. Imani, S.M.H.; Asghari, S.; Ameli, M.T. Considering the load uncertainty for solving security constrained unit commitment problem in presence of plug-in electric vehicle. In Proceedings of the 2014 22nd Iranian Conference on Electrical Engineering (ICEE), Tehran, Iran, 20–22 May 2014; pp. 725–732. [Google Scholar]
  21. Wu, L.; Shahidehpour, M.; Li, T. Stochastic security-constrained unit commitment. IEEE Trans. Power Syst. 2007, 22, 800–811. [Google Scholar] [CrossRef]
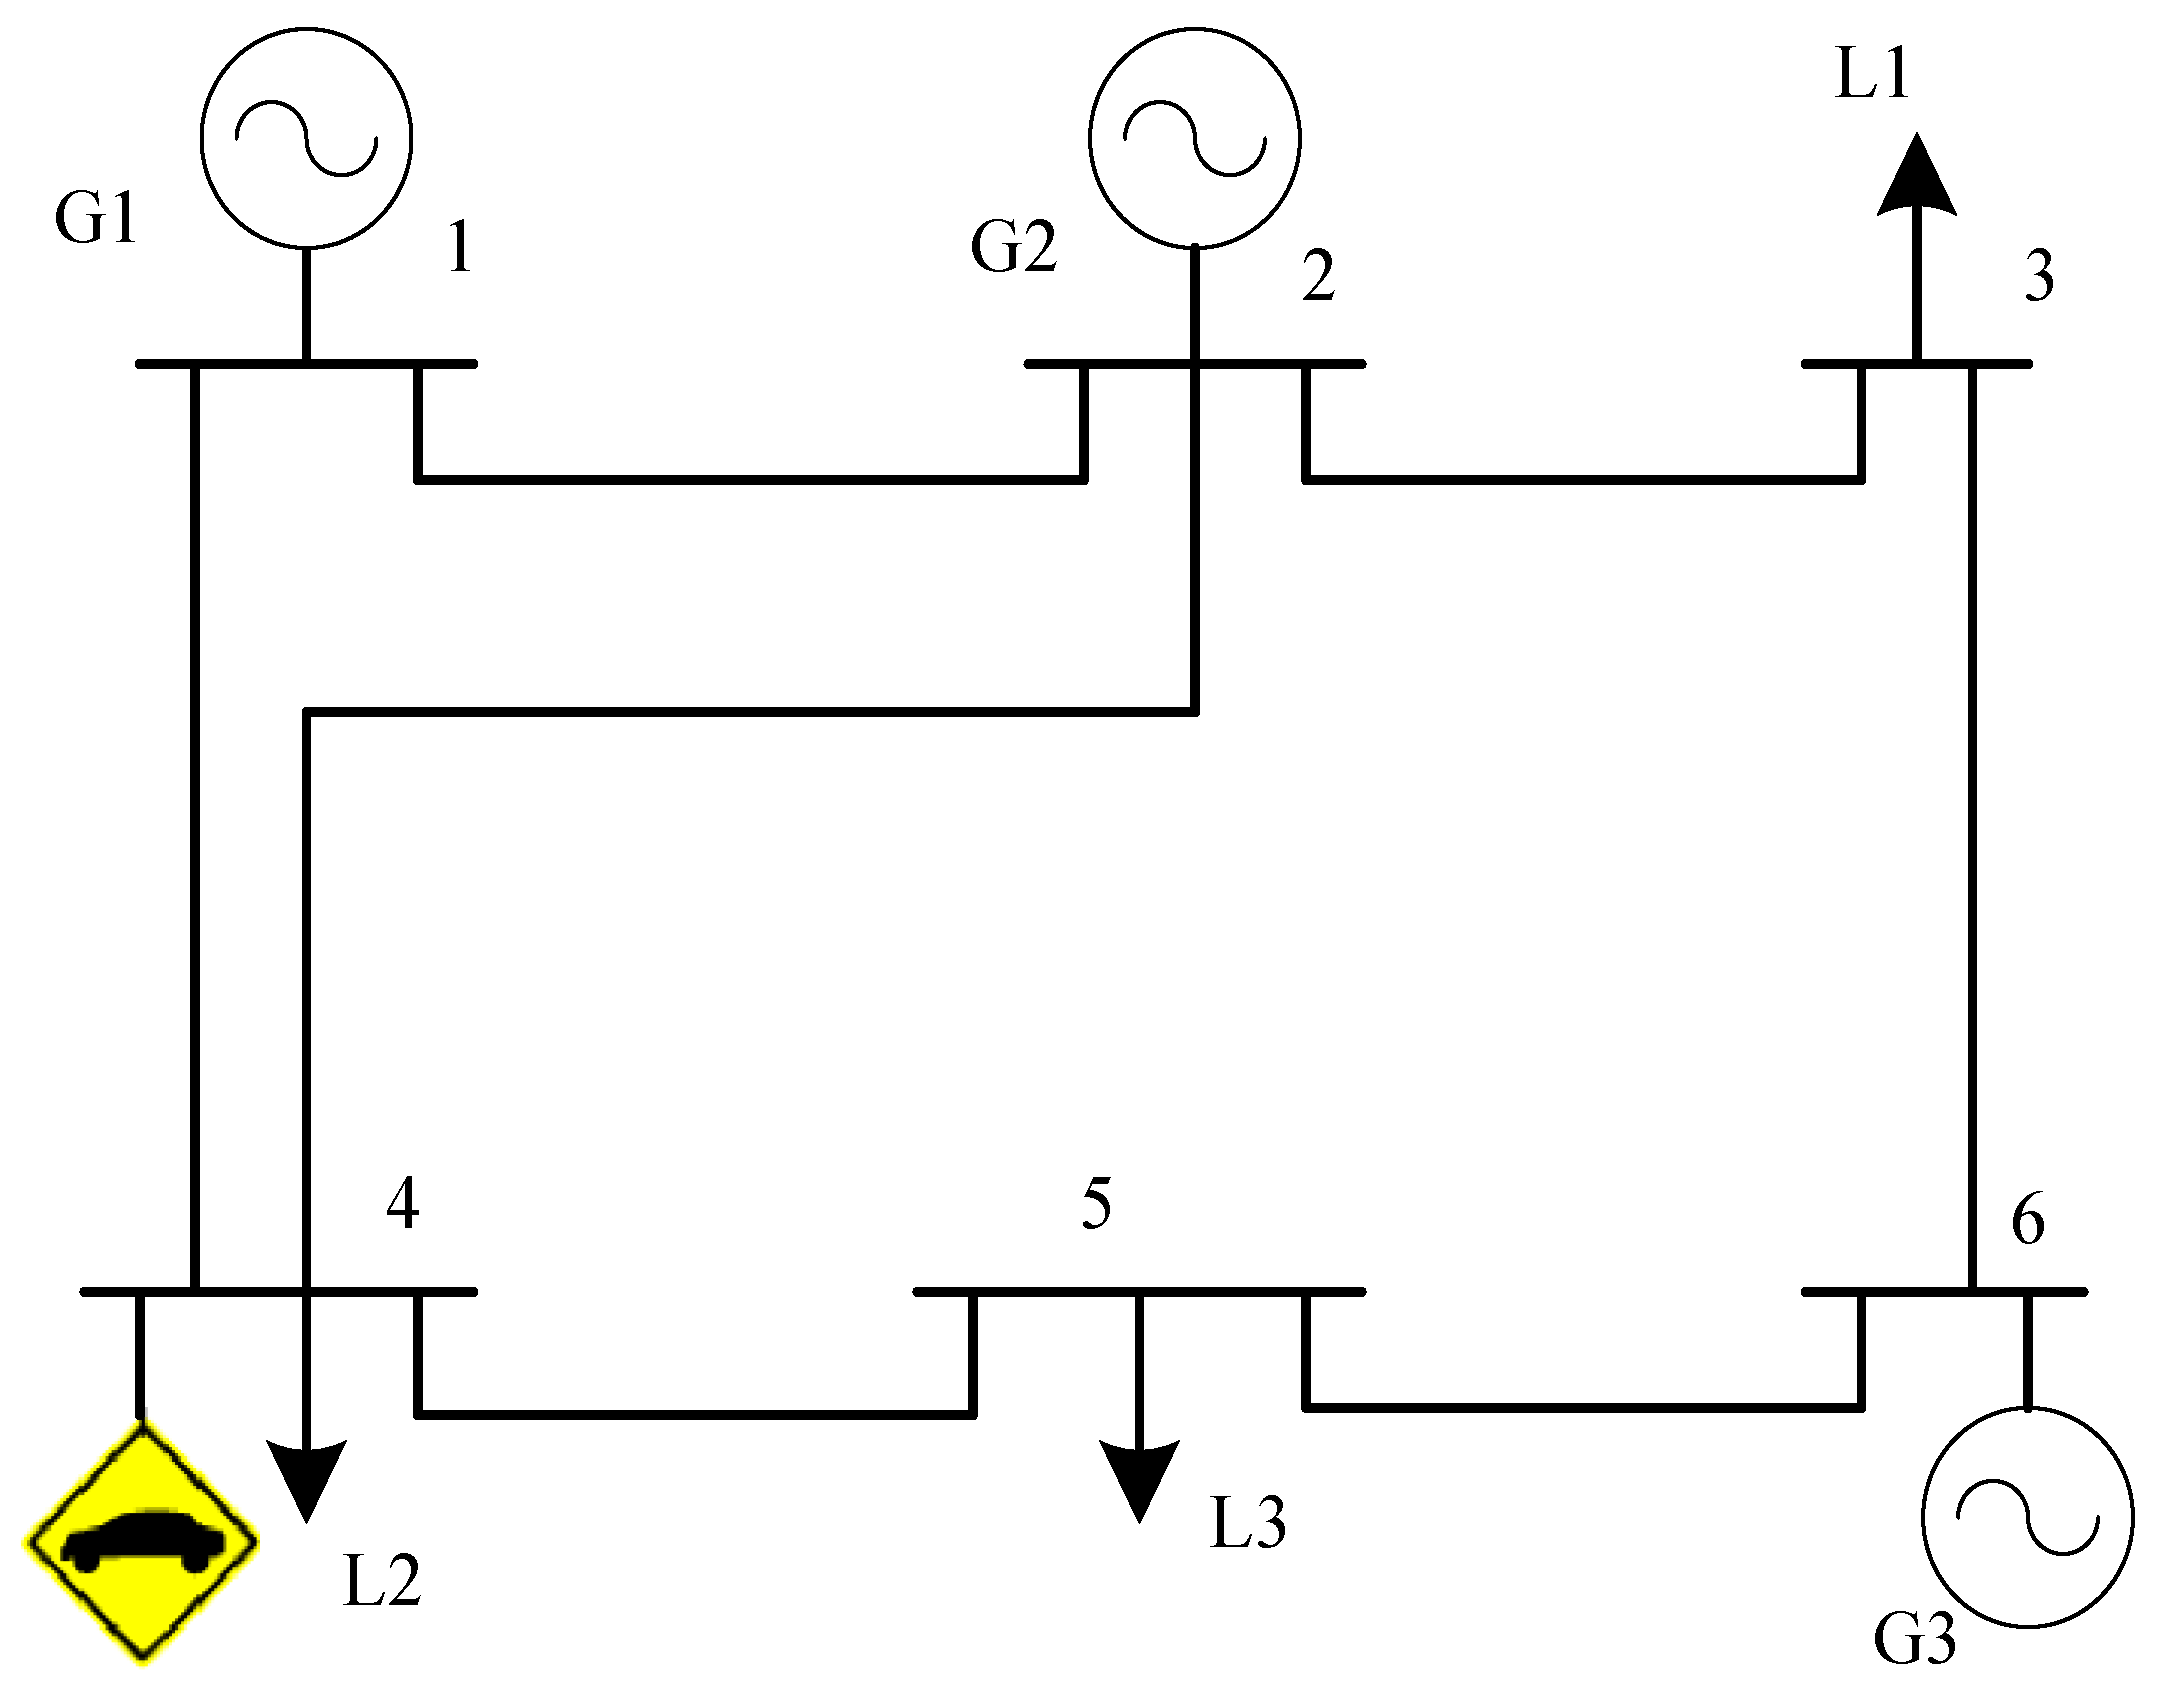
Figure 1. IEEE 6-bus test system.
Mca 23 00013 g001
Figure 2. Predicted hourly load of the 6-bus system.
Mca 23 00013 g002
Figure 3. The production of thermal units and the predicted load curves in 24 h.
Mca 23 00013 g003
Figure 4. The locational marginal pricing (LMP) curves for different buses in the 6-bus system.
Mca 23 00013 g004
Figure 5. Load demand and number of V2G units in a day ahead scheduling.
Mca 23 00013 g005
Figure 6. The curves of total operation cost, fuel cost of thermal units and the load demand in 24 h.
Mca 23 00013 g006
Figure 7. The power flow in line 4 for both cases: with and without V2G.
Mca 23 00013 g007
Figure 8. LMP curve of bus 4 for both cases—with and without V2G.
Mca 23 00013 g008
Figure 9. The operation cost of the grid for different degrees of EV penetration.
Mca 23 00013 g009
Figure 10. The operation cost of grids for different locations of the parking station.
Mca 23 00013 g010
Figure 11. The 30-bus system.
Mca 23 00013 g011
Figure 12. The load demand curve for the 30-bus system—24 h ahead.
Mca 23 00013 g012
Figure 13. The average LMP for different buses—24 h ahead.
Mca 23 00013 g013
Figure 14. The number of connected electrical vehicles and the hourly load demand.
Mca 23 00013 g014
Figure 15. The optimal presence percentage of electrical vehicles in the charging station.
Mca 23 00013 g015
Figure 16. The total operating cost versus different locations of the charging station.
Mca 23 00013 g016
Table 1. The relation between units’ states, ON states and OFF states.
Time (h)01324
Ii,t01010
γi,t-1000
δi,t-0100
Time (h)56879
Ii,t00110
γi,t00010
δi,t00001
Table 2. The total production of thermal units with and without the presence of vehicle-to-grid (V2G) for a 24-h scheduling.
G1 (MW)G2 (MW)G3 (MW)V2G (MW)
Without V2G4529.25199.631663.68-
With V2G466201380.55150
V2G Effect132.77199.6383.13-