
Solving a Fabrication Lot-Size and Shipping Frequency Problem with an Outsourcing Policy and Random Scrap

Abstract
:1. Introduction
2. Literature Review
3. Methods
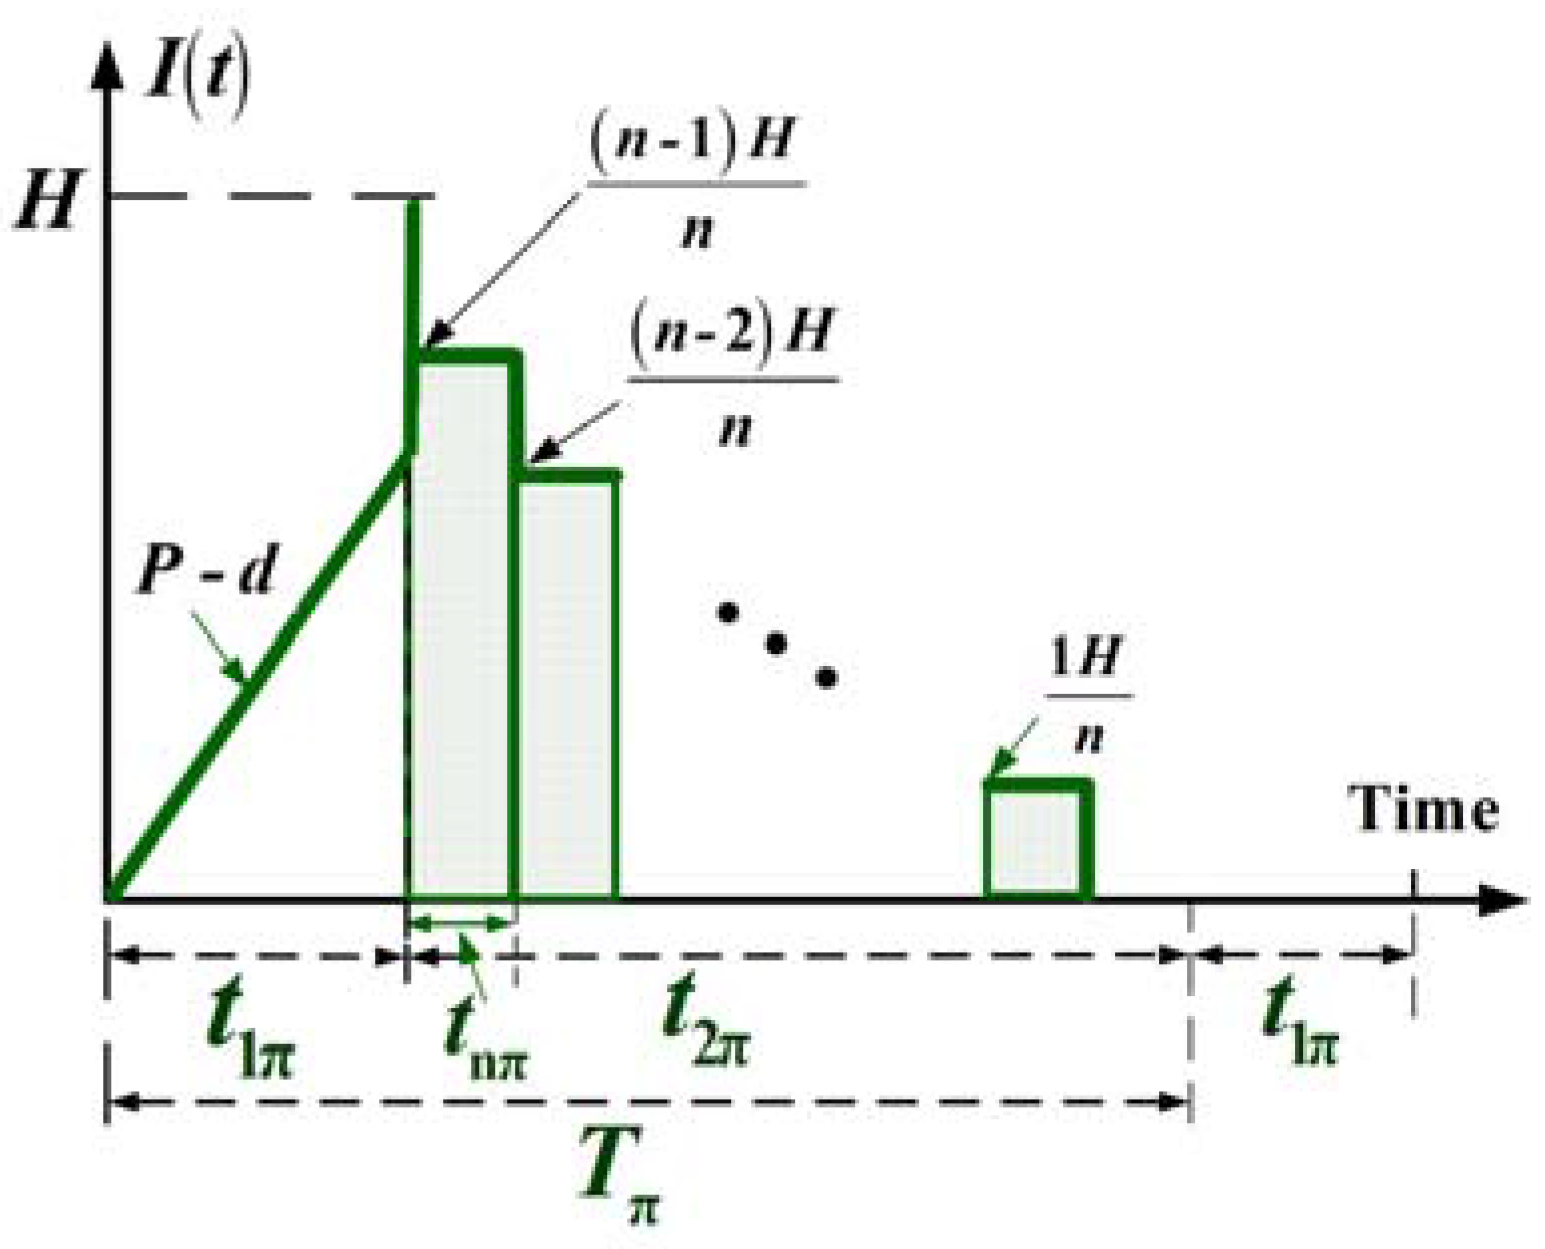
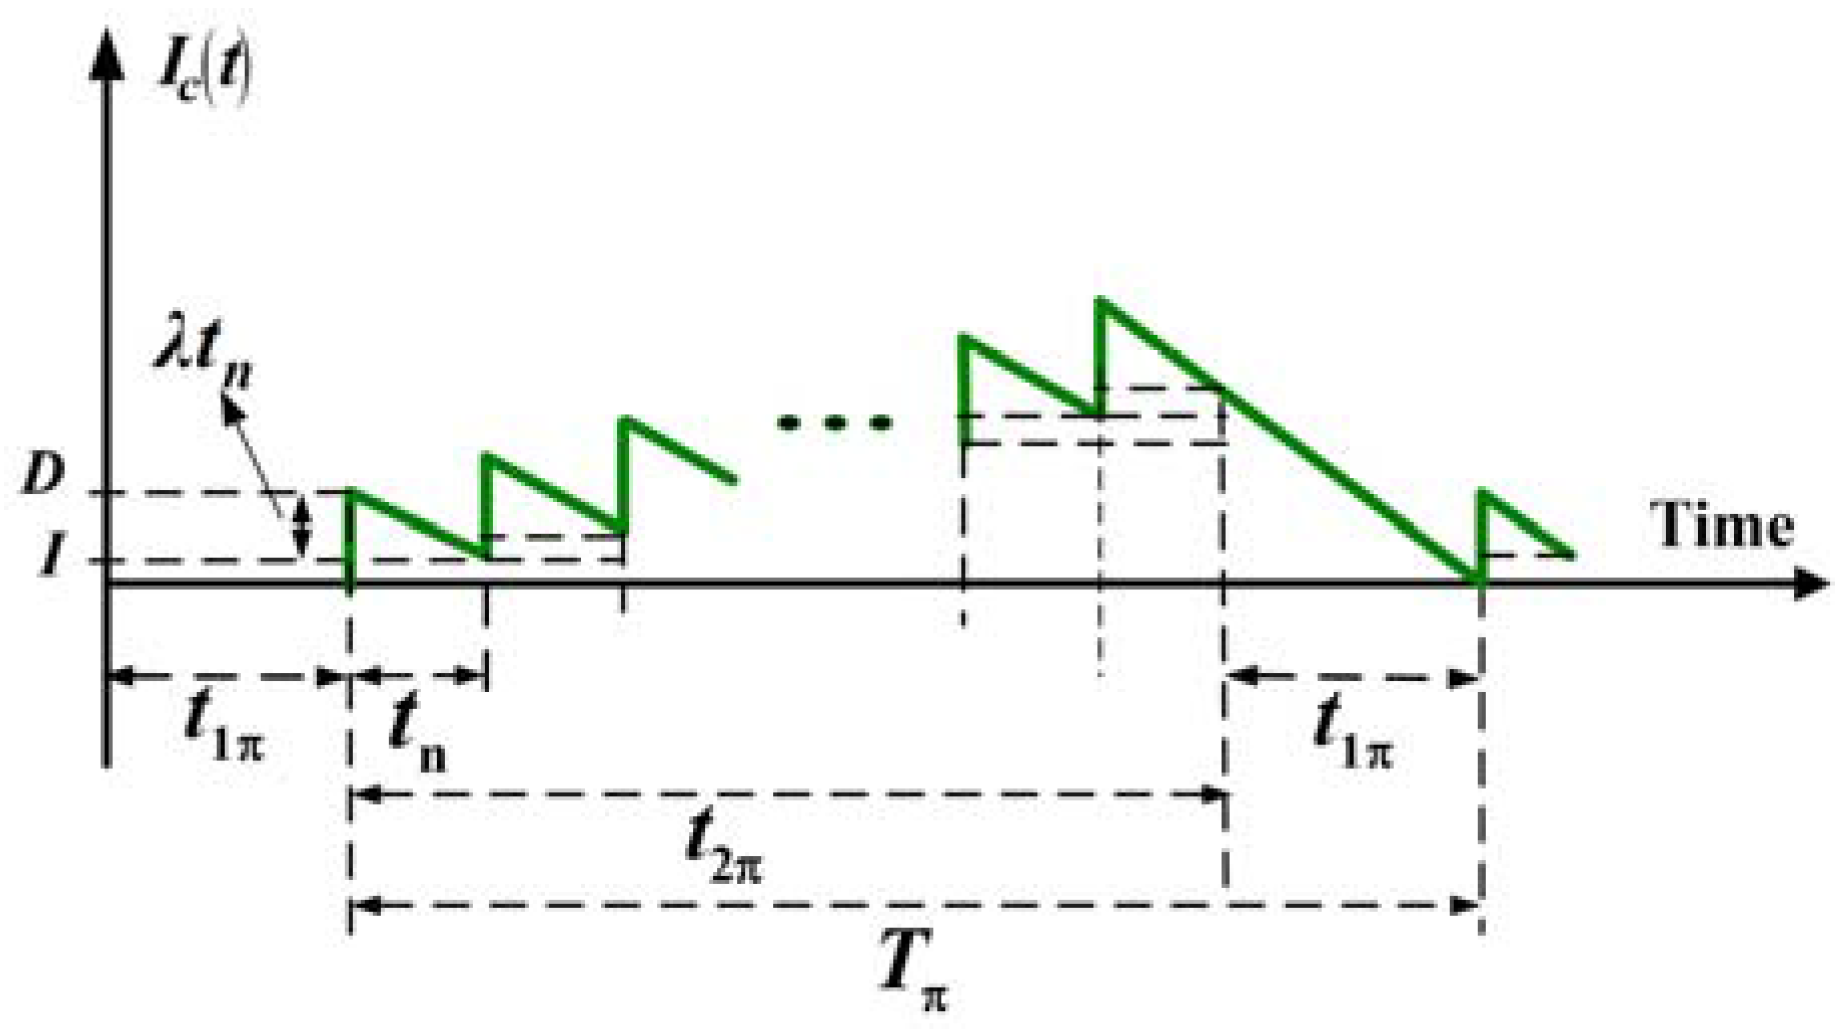
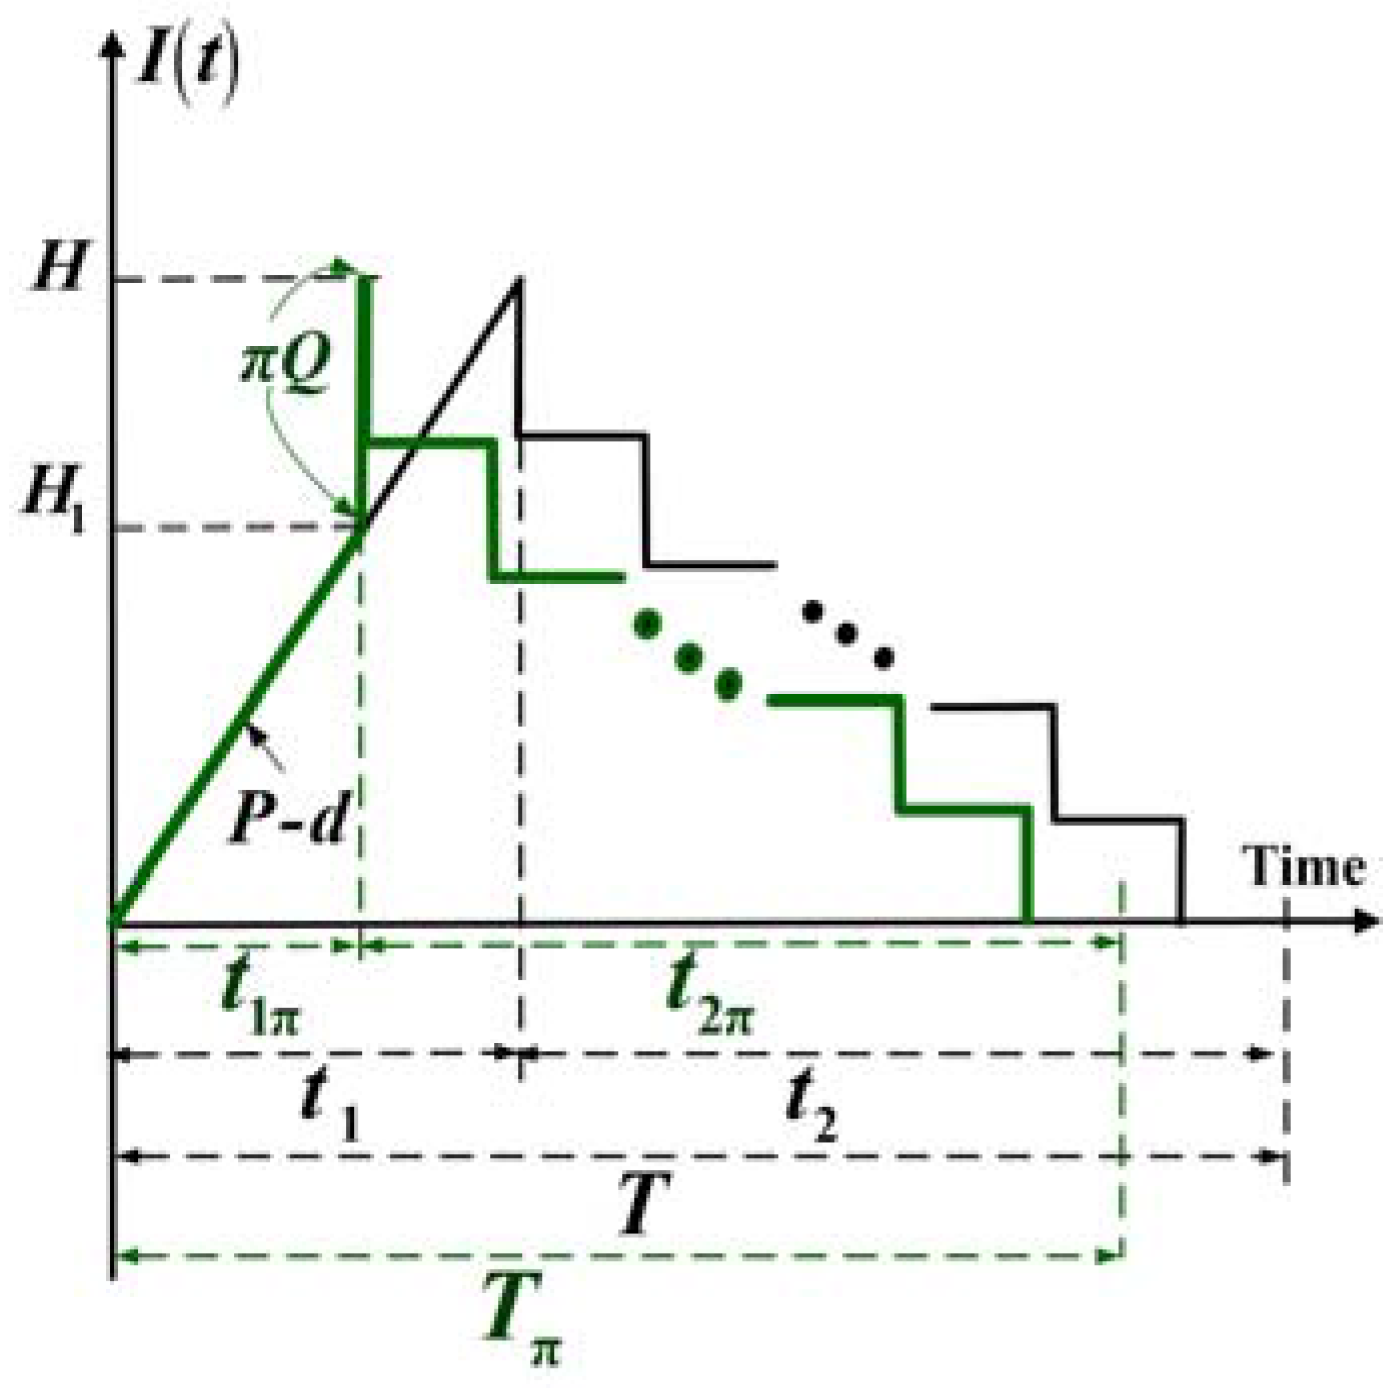
Problem Statement and Mathematical Modeling
- Tπ = the replenishment cycle time of the proposed system,
- T = the replenishment cycle time for a production system without outsourcing,
- πQ = outsourcing quantity per replenishment cycle,
- K = in-house production setup cost per cycle,
- C = unit fabrication cost, which includes unit cost of inspection,
- h = holding cost per item per unit time,
- CS = unit disposal cost,
- Kπ = fixed order (setup) cost of outsourcing items per cycle,
- Cπ = unit purchasing cost of outsourcing items,
- β1 = the relating parameter between Kπ and K, that is Kπ = (1 + β1)K where 0 ≤ β1 ≤ 1,
- β2 = the relating parameter between Cπ and C, that is Cπ = (1 + β2)C where β2 ≥ 0,
- H1 = on-hand inventory in units at the time in-house production ends,
- H = maximum level of on-hand inventory in units after receiving outsourcing items,
- t1π = production uptime for the proposed system,
- t2π = time required for transporting all items,
- t1 = uptime of the conventional EPQ model,
- t2 = delivery time of the conventional EPQ model,
- I(t) = on-hand inventory of perfect quality items at time t,
- Id(t) = on-hand inventory of scrap items at time t,
- K1 = fixed transportation cost per shipment,
- CT = unit transportation cost,
- n = number of fixed quantity installments of the finished batch to be delivered per cycle,
- tn = the fixed interval of time between each installment delivered during downtime t2π,
- h2 = unit stock holding cost per unit time at the customer’s side,
- Ic(t) = on-hand inventory of stocks at the customer’s side at time t,
- TC(Q,n) = total production-inventory-delivery cost per cycle for the proposed system,
- E[TCU(Q,n)] = the long-run average costs per unit time for the proposed system.
4. Results
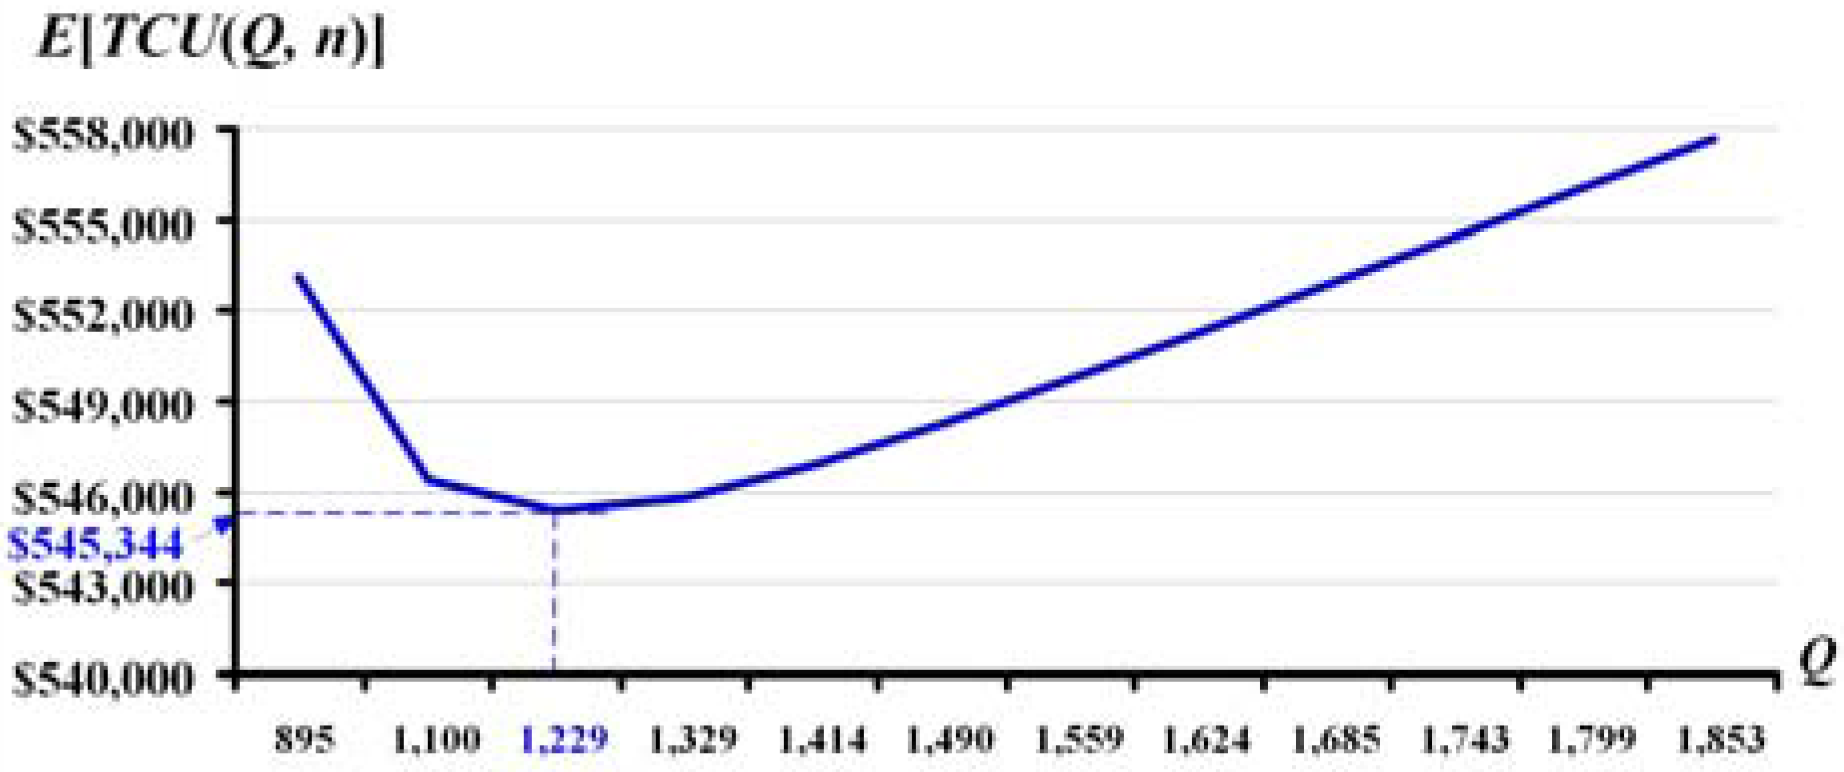
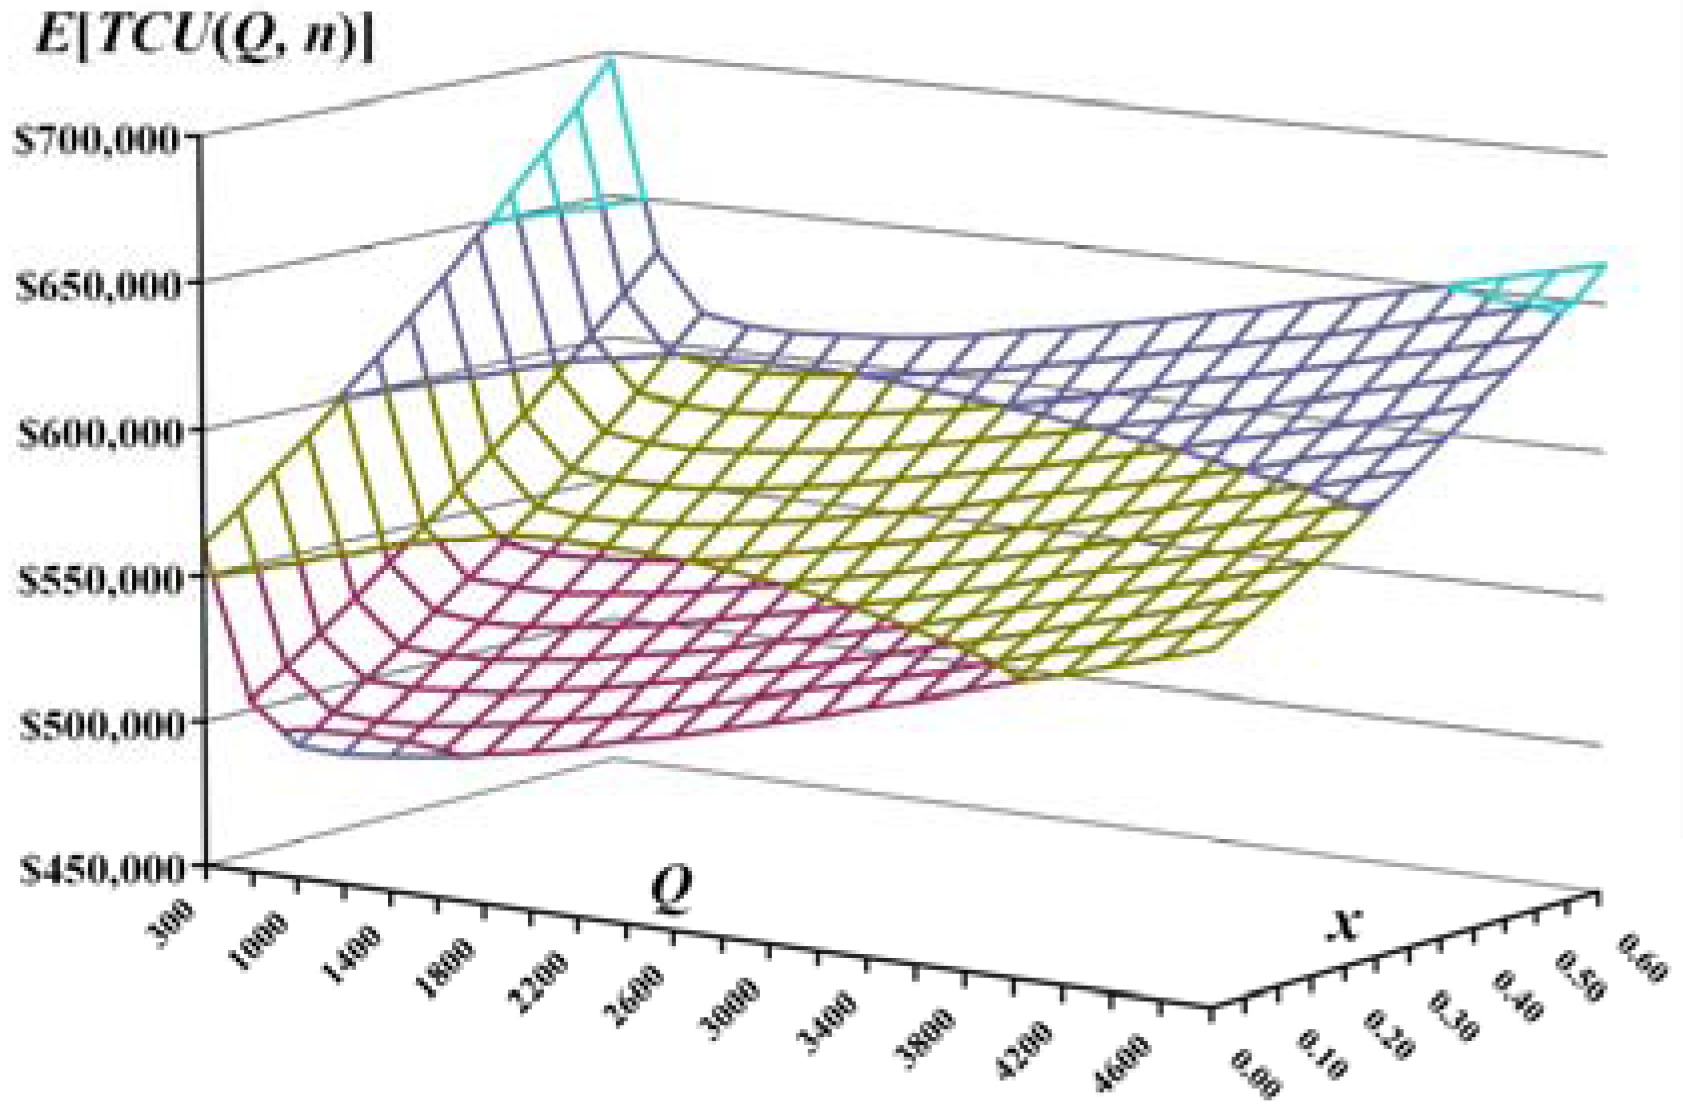
4.1. The Convexity of E[TCU(Q, n)]
4.2. Deriving the Optimal Operating Policy
- (1)
- Let n = 1 initially, and apply Equations (14) and (21) to compute the values of Q, δn, δn+1, and (δn+1 − δn).
- (2)
- Let n = n + 1, and calculate the values of Q, δn, δn−1, δn+1, (δn−1 − δn), and (δn+1 − δn).
- (3)
- If both (δn−1 − δn) ≥ 0 and (δn+1 − δn) ≥ 0, then go to step (4); otherwise, go to step (2).
- (4)
- Stop. The optimal number of shipments n* and optimal lot size Q* are obtained.
5. Implications
5.1. Numerical Example
- h = $30 per item per year,
- CS = $20, disposal cost per scrap item,
- K1 = $800, fixed transportation cost per shipment,
- CT = $0.5, transportation cost per item.
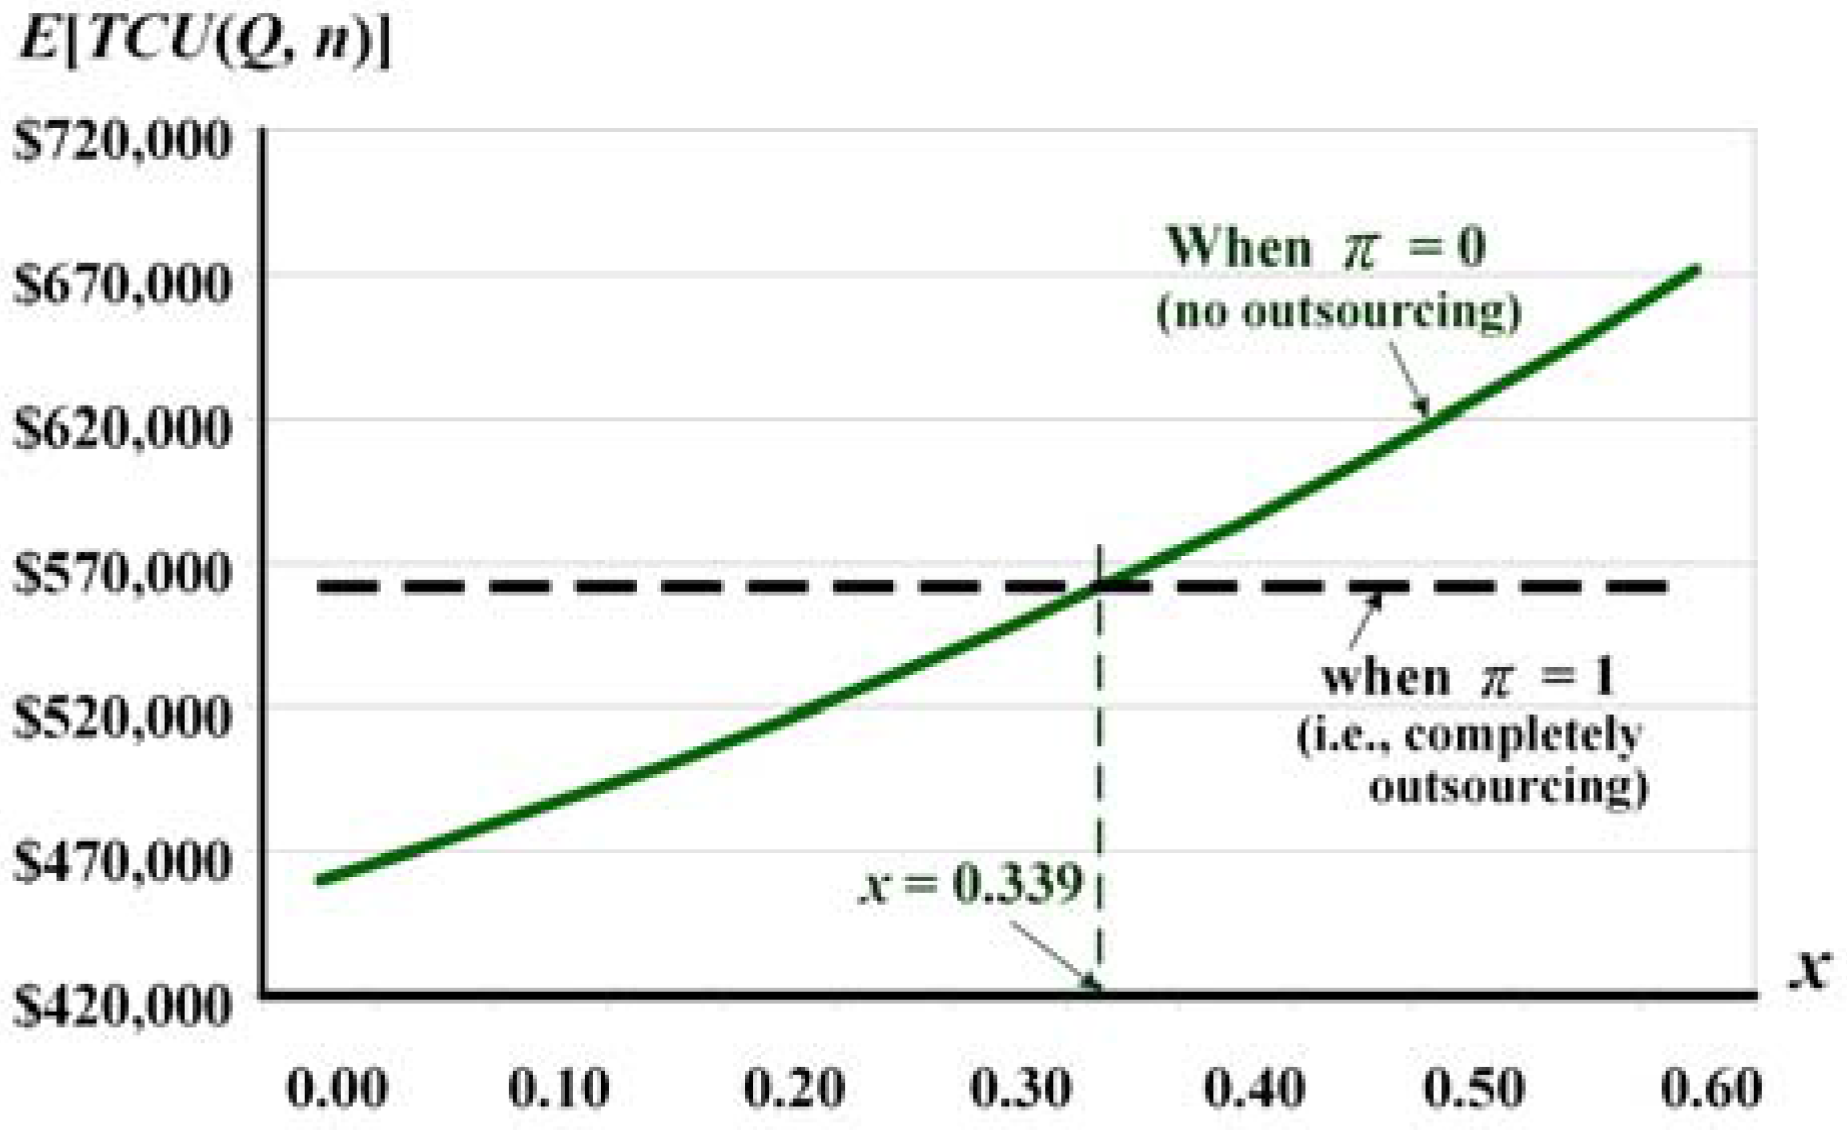
5.2. Sensitivity Analysis with Respect to the Scrap Rate x
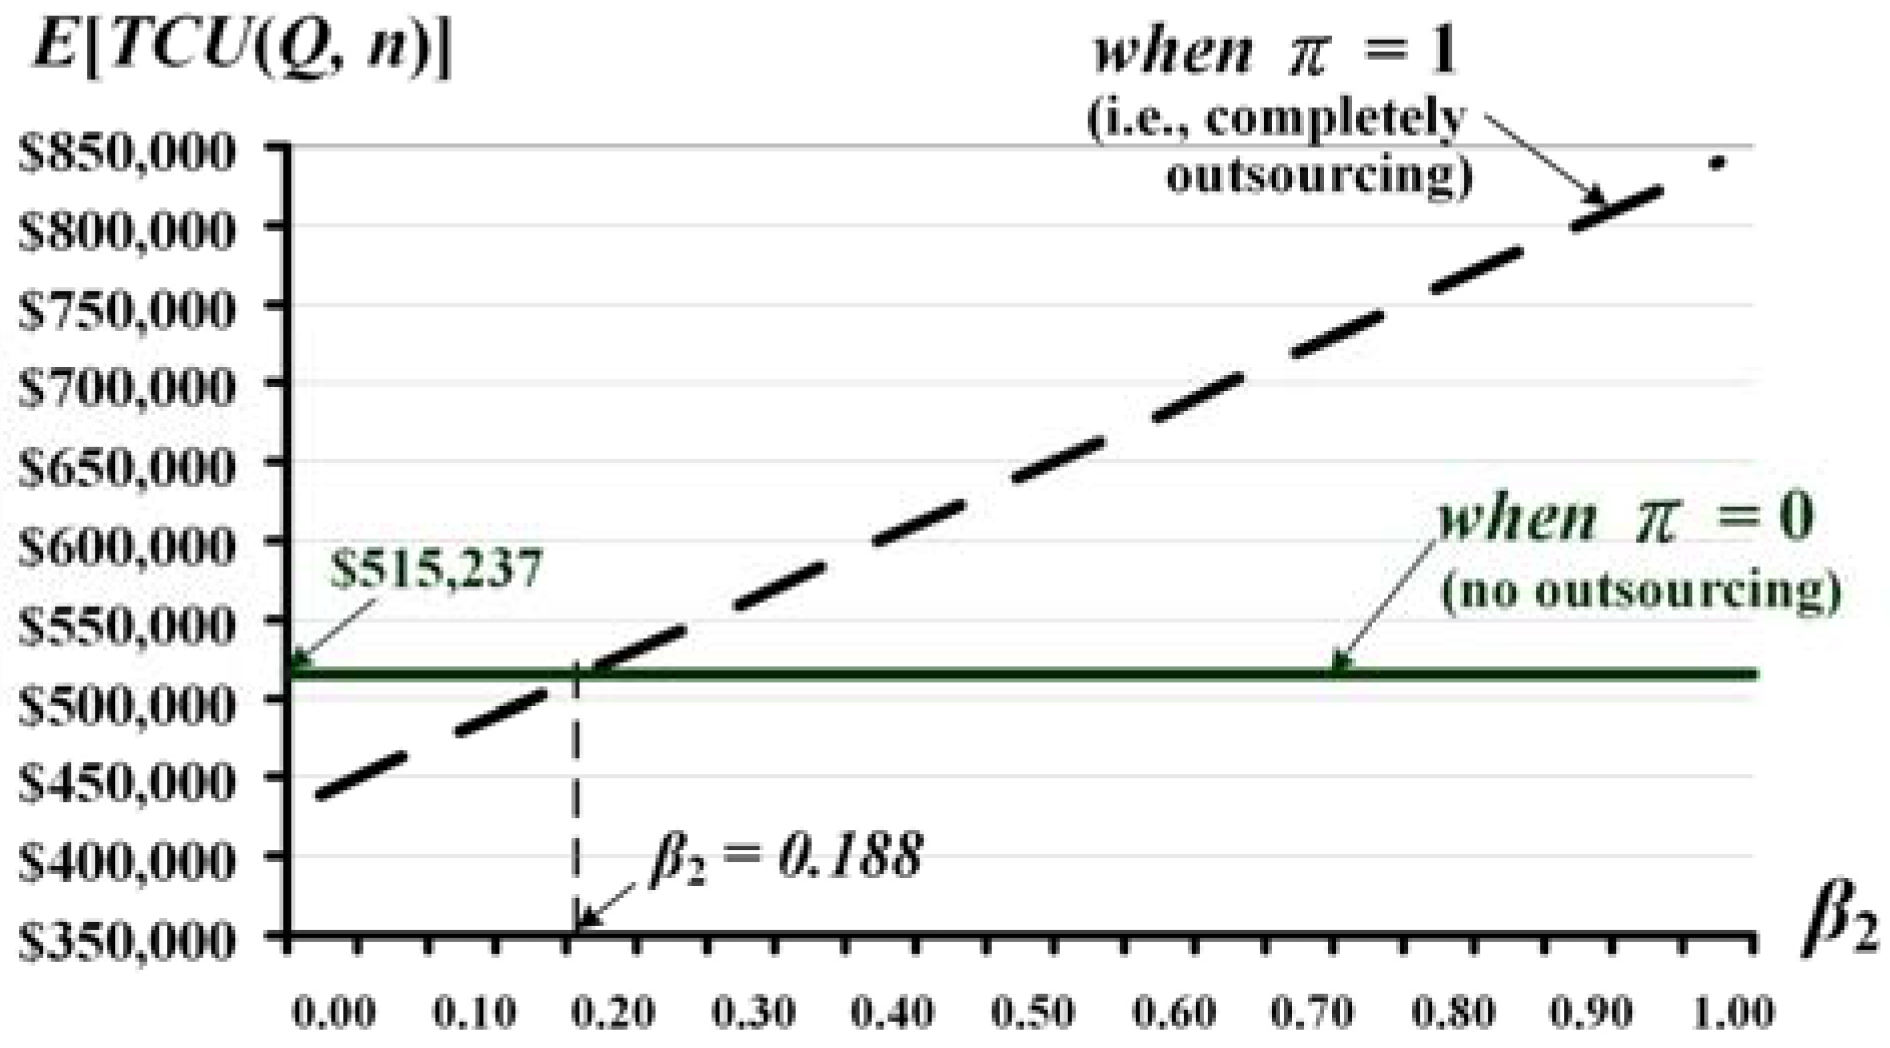
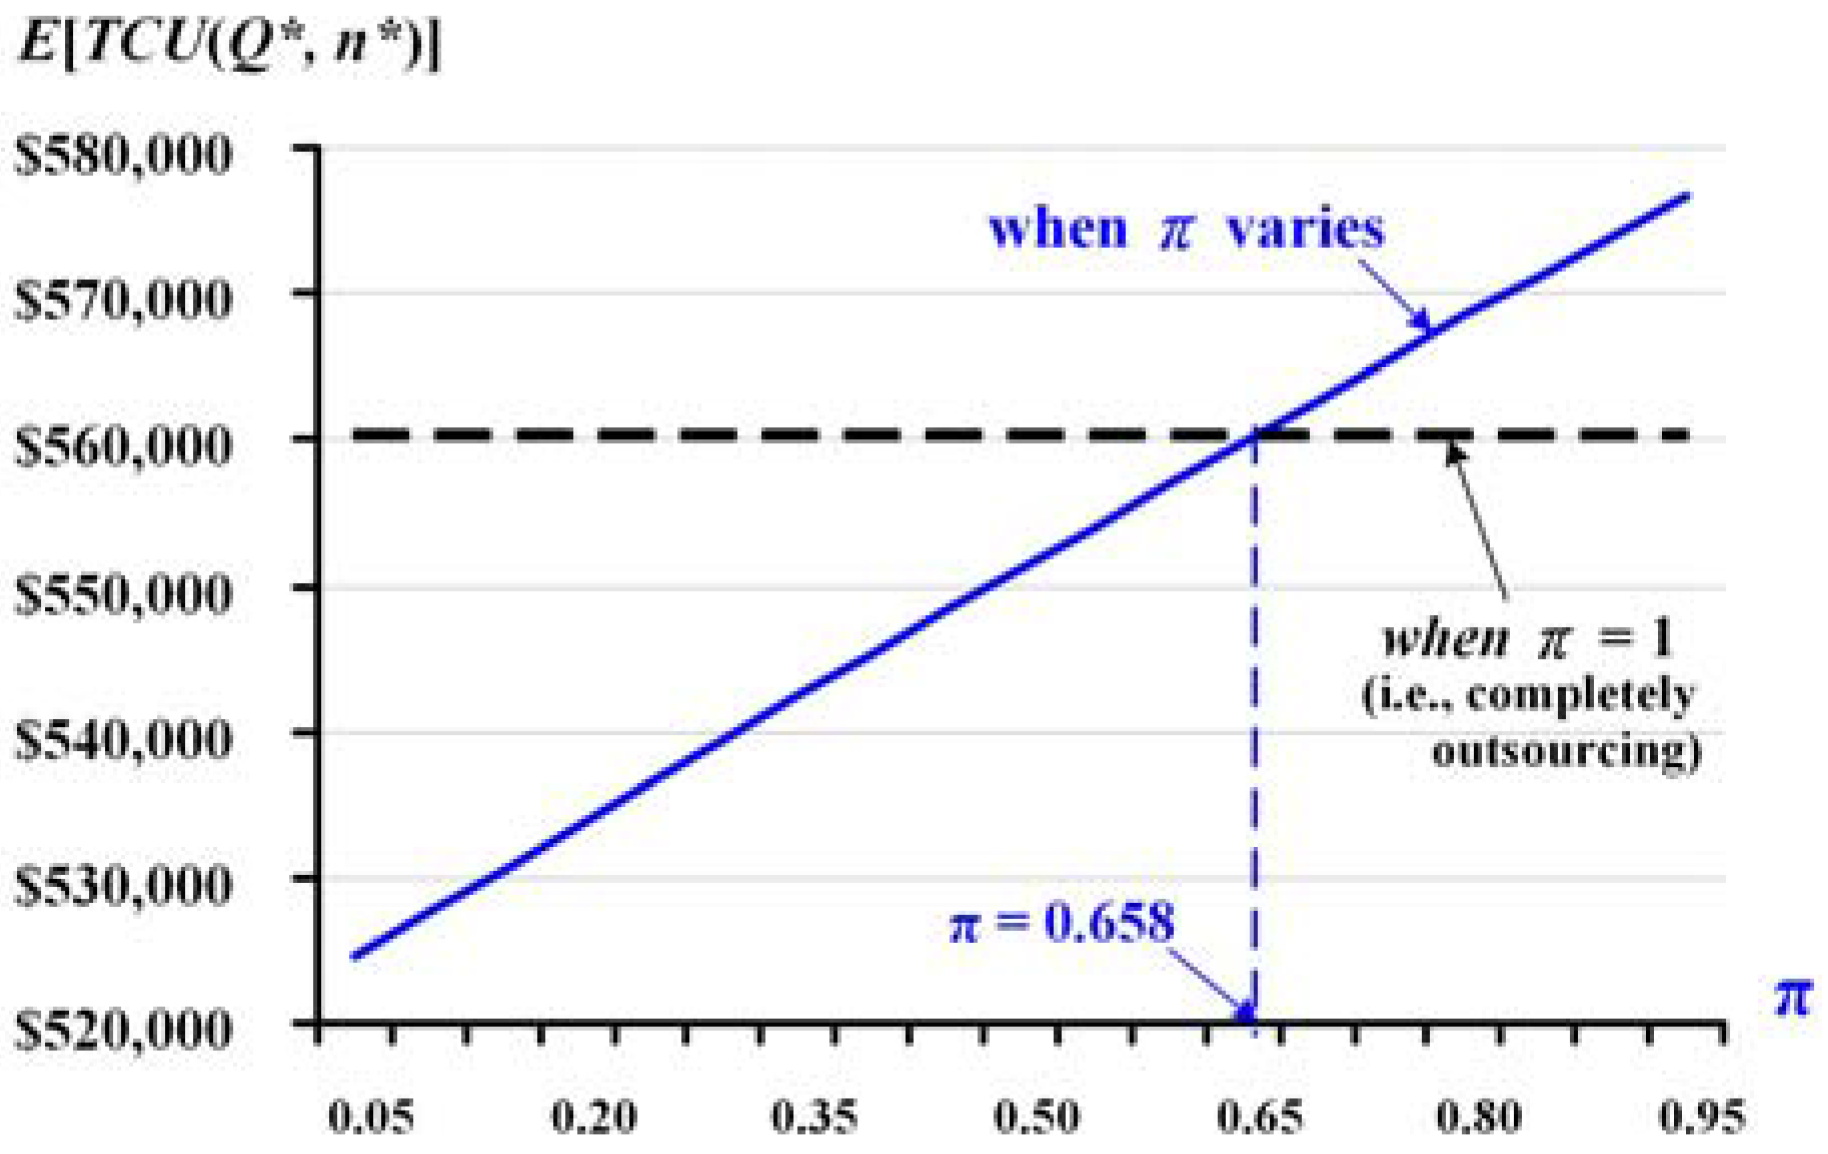
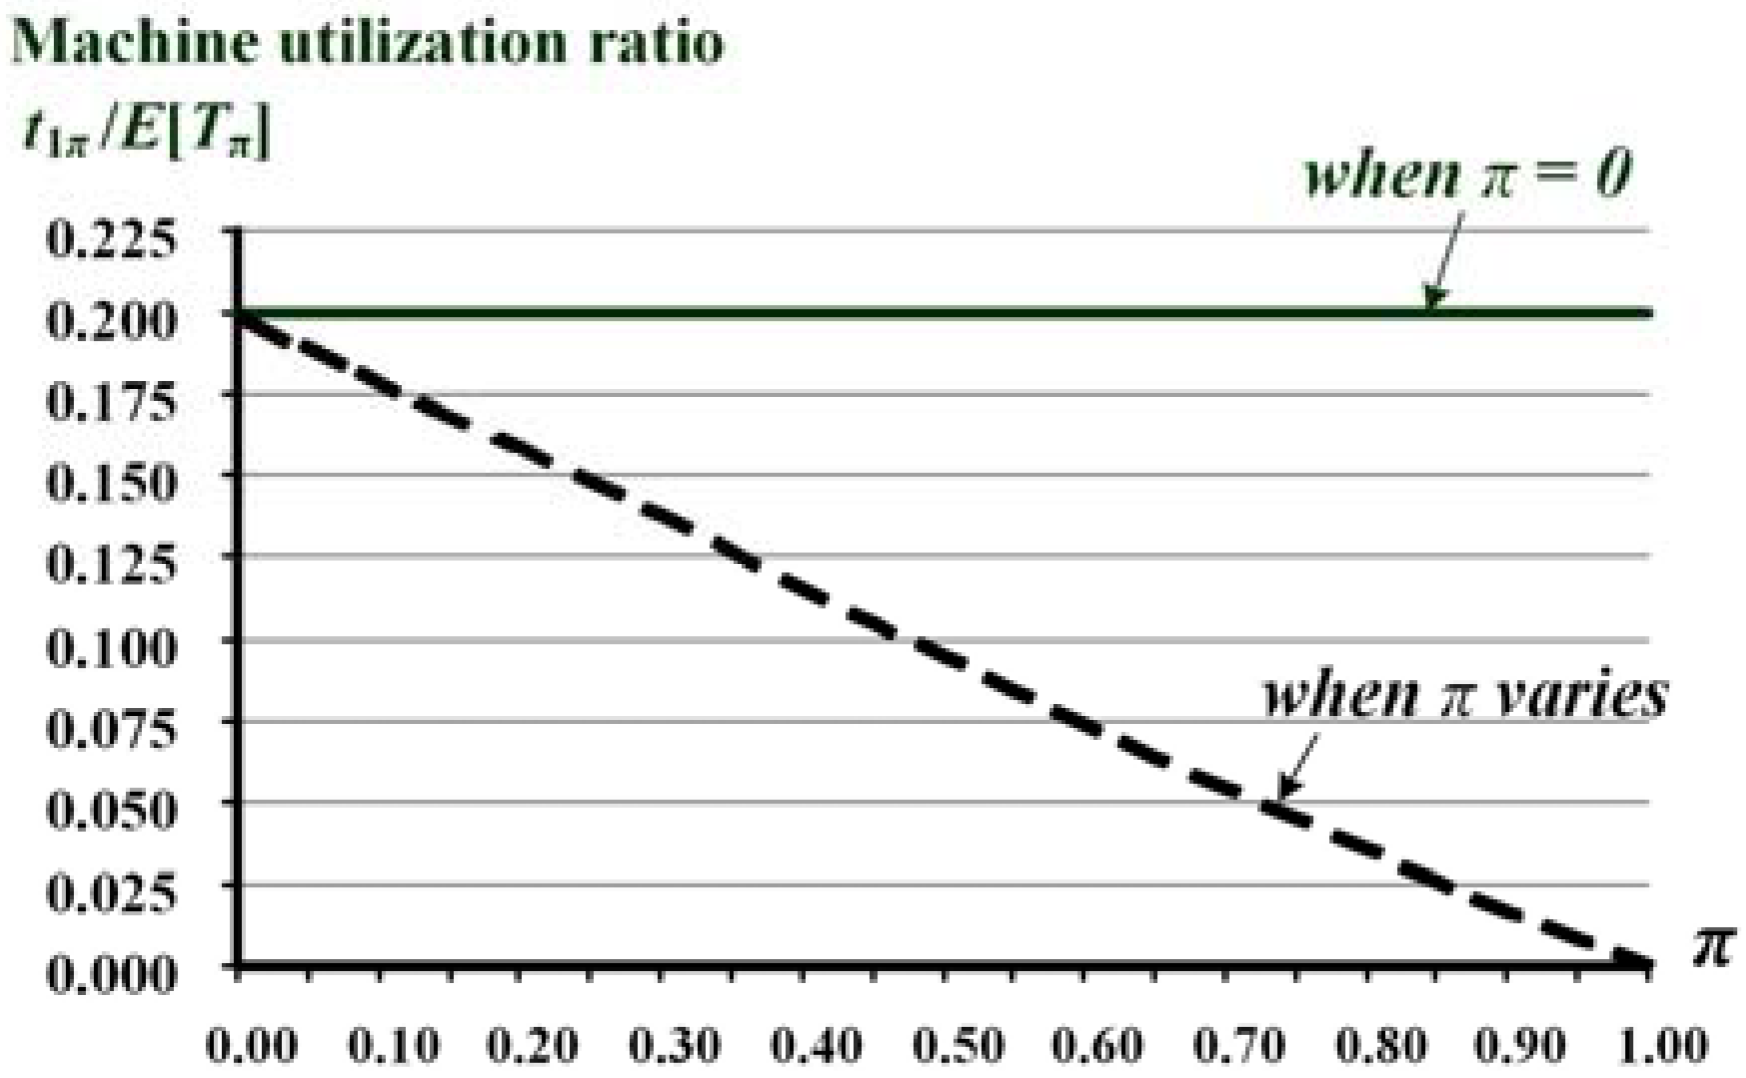
5.3. Sensitivity Analysis with Respect to Outsourcing Proportion π
6. Conclusions
Acknowledgments
Author Contributions
Conflicts of Interest
Appendix A

| Q | n | δi | δn−1 − δn | δn+1 − δn | (δn−1 + δn+1) − 2(δn) |
|---|---|---|---|---|---|
| 600 | 1 | δn−1 = $558,725 | $476 > 0 | $3,624 > 0 | $4,100 > 0 |
| 2 * | δn = $558,248 | ||||
| 3 | δn+1 = $561,872 | ||||
| 1000 | 2 | δn−1 = $546,669 | $12 > 0 | $1,696 > 0 | $1,708 > 0 |
| 3 * | δn = $546,657 | ||||
| 4 | δn+1 = $548,353 | ||||
| 1400 | 2 | δn−1 = $548,221 | $2,352 > 0 | $40 > 0 | $2,392 > 0 |
| 3 * | δn = $545,869 | ||||
| 4 | δn+1 = $545,909 | ||||
| 1800 | 3 | δn−1 = $549,890 | $1,184 > 0 | $46 > 0 | $1,230 > 0 |
| 4 | δn = $548,707 | ||||
| 5 | δn+1 = $548,753 | ||||
| 2200 | 4 | δn−1 = $553,887 | $708 > 0 | $44 > 0 | $752 > 0 |
| 5 * | δn = $553,179 | ||||
| 6 | δn+1 = $553,223 | ||||
| 2600 | 5 | δn−1 = $558,994 | $467 > 0 | $40 > 0 | $508 > 0 |
| 6 * | δn = $558,527 | ||||
| 7 | δn+1 = $558,567 | ||||
| 3000 | 6 | δn−1 = $564,727 | $330 > 0 | $37 > 0 | $366 > 0 |
| 7 * | δn = $564,398 | ||||
| 8 | δn+1 = $564,434 | ||||
| 3400 | 7 | δn−1 = $570,850 | $243 > 0 | $33 > 0 | $277 > 0 |
| 8 * | δn = $570,606 | ||||
| 9 | δn+1 = $570,639 | ||||
| 3800 | 8 | δn−1 = $577,231 | $186 > 0 | $30 > 0 | $216 > 0 |
| 9 * | δn = $577,045 | ||||
| 10 | δn+1 = $577,075 | ||||
| 4200 | 9 | δn−1 = $583,795 | $146 > 0 | $28 > 0 | $174 > 0 |
| 10 * | δn = $583,649 | ||||
| 11 | δn+1 = $583,676 | ||||
| 4600 | 10 | δn−1 = $590,491 | $117 > 0 | $26 > 0 | $143 > 0 |
| 11 * | δn = $590,374 | ||||
| 12 | δn+1 = $590,399 | ||||
| 5000 | 11 | δn−1 = $597,286 | $96 > 0 | $24 > 0 | $119 > 0 |
| 12 * | δn = $597,191 | ||||
| 13 | δn+1 = $597,214 | ||||
| 5400 | 12 | δn−1 = $604,159 | $79 > 0 | $22 > 0 | $101 > 0 |
| 13 * | δn = $604,079 | ||||
| 14 | δn+1 = $604,102 |
References
- Taft, E.W. The most economical production lot. Iron Age 1918, 101, 1410–1412. [Google Scholar]
- Coman, A.; Ronen, B. Production outsourcing: A linear programming model for the theory-of-constraints. Int. J. Prod. Res. 2000, 38, 1631–1639. [Google Scholar] [CrossRef]
- Cachon, G.P.; Harker, P.T. Competition and outsourcing with scale economies. Manag. Sci. 2002, 48, 1314–1333. [Google Scholar] [CrossRef]
- Fu, K.; Hsu, V.N.; Lee, C.-Y. Inventory and production decisions for an assemble-to-order system with uncertain demand and limited assembly capacity. Oper. Res. 2006, 54, 1137–1150. [Google Scholar] [CrossRef]
- Narayanan, S.; Jayaraman, V.; Luo, Y.; Swaminathan, J.M. The antecedents of process integration in business process outsourcing and its effect on firm performance. J. Oper. Manag. 2011, 29, 3–16. [Google Scholar] [CrossRef]
- Leavy, B. Outsourcing strategy and a learning dilemma. Prod. Invent. Manag. 1996, 37, 50–54. [Google Scholar]
- Amaral, J.; Billington, C.A.; Tsay, A.A. Safeguarding the promise of production outsourcing. Interfaces 2006, 36, 220–233. [Google Scholar] [CrossRef]
- De Fontenay, C.C.; Gans, J.S. A bargaining perspective on strategic outsourcing and supply competition. Strateg. Manag. J. 2008, 29, 819–839. [Google Scholar] [CrossRef]
- Gray, J.V.; Roth, A.V.; Tomlin, B. The influence of cost and quality priorities on the propensity to outsource production. Decis. Sci. 2009, 40, 697–726. [Google Scholar] [CrossRef]
- Lee, K.; Choi, B.-C. Two-stage production scheduling with an outsourcing option. Eur. J. Oper. Res. 2011, 213, 489–497. [Google Scholar] [CrossRef]
- Ciliberto, F.; Panzar, J.C. Outsourcing and vertical integration in a competitive industry. South. Econ. J. 2011, 77, 885–900. [Google Scholar] [CrossRef]
- Balachandran, K.R.; Wang, H.-W.; Li, S.-H.; Wang, T. In-house capability and supply chain decisions. Omega 2013, 41, 473–484. [Google Scholar] [CrossRef]
- Porteus, E.L. Optimal lot sizing, process quality improvement and setup cost reduction. Oper. Res. 1986, 34, 137–144. [Google Scholar] [CrossRef]
- Makis, V. Optimal lot sizing and inspection policy for an EMQ model with imperfect inspections. Nav. Res. Logist. 1998, 45, 165–186. [Google Scholar] [CrossRef]
- Sana, S.S. A production–inventory model in an imperfect production process. Eur. J. Oper. Res. 2010, 200, 451–464. [Google Scholar] [CrossRef]
- Mak, K.L. Inventory control of defective products when the demand is partially captive. Int. J. Prod. Res. 1985, 23, 533–542. [Google Scholar] [CrossRef]
- Berg, M.; Posner, M.J.M.; Zhao, H. Production-inventory systems with unreliable machines. Oper. Res. 1994, 42, 111–118. [Google Scholar] [CrossRef]
- Chiu, S.W.; Lin, H.-D.; Cheng, C.-B.; Chung, C.-L. Optimal production-shipment decisions for the finite production rate model with scrap. Int. J. Eng. Model. 2009, 22, 25–34. [Google Scholar]
- Ma, W.-N.; Gong, D.-C.; Lin, G.C. An optimal common production cycle time for imperfect production processes with scrap. Math. Comput. Model. 2010, 52, 724–737. [Google Scholar] [CrossRef]
- Lin, G.C.; Gong, D.-C.; Chang, C.-C. On an economic production quantity model with two unreliable key components subject to random failures. J. Sci. Ind. Res. India 2014, 73, 149–152. [Google Scholar]
- Koley, E.; Verma, K.; Ghosh, S. An improved fault detection classification and location scheme based on wavelet transform and artificial neural network for six phase transmission line using single end data only. SpringerPlus 2015, 4, 551. [Google Scholar] [CrossRef] [PubMed]
- Ocampo, L.A. A hierarchical framework for index computation in sustainable manufacturing. Adv. Prod. Eng. Manag. 2015, 10, 40–50. [Google Scholar] [CrossRef]
- Chiu, S.W.; Sung, P.-C.; Tseng, C.-T.; Chiu, Y.-S.P. Multi-product FPR model with rework and multi-shipment policy resolved by algebraic approach. J. Sci. Ind. Res. India 2015, 74, 555–559. [Google Scholar]
- Koren, R.; Palčič, I. The impact of technical and organisational innovation concepts on product characteristics. Adv. Prod. Eng. Manag. 2015, 10, 27–39. [Google Scholar] [CrossRef]
- Kiron, K.R.; Kannan, K. Prioritizing the factors affecting innovation capability of steel manufacturing SMEs using fuzzy logic. J. Sci. Ind. Res. India 2015, 74, 665–669. [Google Scholar]
- Chiu, Y.-S.P.; Sung, P.-C.; Chiu, S.W.; Chou, C.-L. Mathematical modeling of a multi-product EMQ model with an enhanced end items issuing policy and failures in rework. SpringerPlus 2015, 4, 679. [Google Scholar] [CrossRef] [PubMed]
- Vadali, S.; Chandra, S. Buyer-supplier transport access measures for industry clusters. J. Appl. Res. Technol. 2014, 12, 839–849. [Google Scholar] [CrossRef]
- Safaei, M. An integrated multi-objective model for allocating the limited sources in a multiple multi-stage lean supply chain. Econ. Model. 2014, 37, 224–237. [Google Scholar] [CrossRef]
- Schwarz, L.B. A simple continuous review deterministic one-warehouse N-retailer inventory problem. Manag. Sci. 1973, 19, 555–566. [Google Scholar] [CrossRef]
- Sarker, B.R.; Parija, G.R. An optimal batch size for a production system operating under a fixed-quantity, periodic delivery policy. J. Oper. Res. Soc. 1994, 45, 891–900. [Google Scholar] [CrossRef]
- Ertogral, K.; Darwish, M.; Ben-Daya, M. Production and shipment lot sizing in a vendor–buyer supply chain with transportation cost. Eur. J. Oper. Res. 2007, 176, 1592–1606. [Google Scholar] [CrossRef]
- Chen, K.-K.; Chiu, S.W. Replenishment lot size and number of shipments for EPQ model derived without derivatives. Math. Comput. Appl. 2011, 16, 753–760. [Google Scholar] [CrossRef]
- Grunder, O.; Wang, D.; El Moudni, A. Production scheduling problem with delivery considerations in a mono-product supply chain environment to minimize the total joint cost. Eur. J. Ind. Eng. 2013, 7, 615–634. [Google Scholar] [CrossRef]
- Chiu, S.W.; Huang, C.-C.; Chiang, K.-W.; Wu, M.-F. On intra-supply chain system with an improved distribution plan, multiple sales locations and quality assurance. SpringerPlus 2015, 4, 687. [Google Scholar] [CrossRef] [PubMed]
- Herui, C.; Xu, P.; Yuqi, Z. Co-Evolution Analysis on Coal-Power Industries Cluster Ecosystem Based on the Lotka-Volterra Model: A Case Study of China. Math. Comput. Appl. 2015, 20, 121–136. [Google Scholar] [CrossRef]
- Chiu, S.W.; Kuo, J.-S.; Chiu, V.; Chiu, Y.-S.P. Cost minimization for a multi-product fabrication-distribution problem with commonality, postponement, and quality assurance. Math. Comput. Appl. 2016, 21, 38. [Google Scholar] [CrossRef]
- Chiu, Y.-S.P.; Chiang, K.-W.; Chiu, S.W.; Song, M.-S. Simultaneous determination of production and shipment decisions for a multi-product inventory system with a rework process. Adv. Prod. Eng. Manag. 2016, 11, 141–151. [Google Scholar] [CrossRef]
- Sarkar, B. Supply chain coordination with variable backorder, inspections, and discount policy for fixed lifetime products. Math. Probl. Eng. 2016, 2016, 6318737. [Google Scholar] [CrossRef]
- Sarkar, B. A production-inventory model with probabilistic deterioration in two-echelon supply chain management. Appl. Math. Model. 2013, 37, 3138–3151. [Google Scholar] [CrossRef]
- Sarkar, B. An inventory model with reliability in an imperfect production process. Appl. Math. Comput. 2012, 218, 4881–4891. [Google Scholar] [CrossRef]


| n | Q | δn | δn−1 | δn+1 | δn−1 − δn | δn+1 − δn |
|---|---|---|---|---|---|---|
| 1 | 895 | $553,091 | – | $546,386 | – | −$6,705 ≤ 0 |
| 2 | 1100 | $546,386 | $553,091 | $545,344 | $6,705 ≥ 0 | −$1,042 ≤ 0 |
| 3 | 1229 | $545,344 | $546,386 | $545,824 | $1,042 ≥ 0 | $481 ≤ 0 |
| 4 | 1323 | $545,824 | $545,344 | $546,902 | −$481 ≥ 0 | $1,078 ≥ 0 |
| π | Q* | n* | Total Outsourcing Cost | Total In-House Production Cost | E[TCU(Q*, n*)] | |||
|---|---|---|---|---|---|---|---|---|
| Amount | % to Total System Costs | Amount | % to Total System Costs | Amount | Increase % | |||
| 0.00 | 979 | 2.0 | $0 | 0.0% | $515,237 | 100.0% | $515,237 | – |
| 0.05 | 1201 | 3.0 | $34,250 | 6.5% | $490,278 | 93.5% | $524,527 | 1.8% |
| 0.10 | 1206 | 3.0 | $62,611 | 11.9% | $464,933 | 88.1% | $527,544 | 2.4% |
| 0.15 | 1210 | 3.0 | $90,663 | 17.1% | $439,882 | 82.9% | $530,545 | 3.0% |
| 0.20 | 1215 | 3.0 | $118,412 | 22.2% | $415,120 | 77.8% | $533,532 | 3.6% |
| 0.25 | 1219 | 3.0 | $145,862 | 27.2% | $390,642 | 72.8% | $536,505 | 4.1% |
| 0.30 | 1222 | 3.0 | $173,019 | 32.1% | $366,445 | 67.9% | $539,464 | 4.7% |
| 0.35 | 1226 | 3.0 | $199,887 | 36.9% | $342,523 | 63.1% | $542,410 | 5.3% |
| 0.40 | 1229 | 3.0 | $226,471 | 41.5% | $318,873 | 58.5% | $545,344 | 5.8% |
| 0.45 | 1231 | 3.0 | $252,775 | 46.1% | $295,490 | 53.9% | $548,265 | 6.4% |
| 0.50 | 1234 | 3.0 | $278,804 | 50.6% | $272,369 | 49.4% | $551,173 | 7.0% |
| 0.55 | 1236 | 3.0 | $304,561 | 55.0% | $249,509 | 45.0% | $554,070 | 7.5% |
| 0.60 | 1237 | 3.0 | $330,052 | 59.3% | $226,903 | 40.7% | $556,955 | 8.1% |
| 0.65 | 1238 | 3.0 | $355,281 | 63.5% | $204,548 | 36.5% | $559,829 | 8.7% |
| 0.70 | 1239 | 3.0 | $380,251 | 67.6% | $182,441 | 32.4% | $562,691 | 9.2% |
| 0.75 | 1239 | 3.0 | $404,966 | 71.6% | $160,577 | 28.4% | $565,543 | 9.8% |
| 0.80 | 1239 | 3.0 | $429,430 | 75.6% | $138,953 | 24.4% | $568,384 | 10.3% |
| 0.85 | 1352 | 4.0 | $453,238 | 79.4% | $117,913 | 20.6% | $571,150 | 10.9% |
| 0.90 | 1352 | 4.0 | $477,210 | 83.1% | $96,708 | 16.9% | $573,918 | 11.4% |
| 0.95 | 1352 | 4.0 | $500,943 | 86.9% | $75,734 | 13.1% | $576,677 | 11.9% |
| 1.00 | 646 | 2.0 | $529,294 | 94.4% | $31,120 | 5.6% | $560,414 | 8.8% |
© 2016 by the authors; licensee MDPI, Basel, Switzerland. This article is an open access article distributed under the terms and conditions of the Creative Commons Attribution (CC-BY) license (http://creativecommons.org/licenses/by/4.0/).
Share and Cite
Chiu, Y.-S.P.; Liang, G.-M.; Chiu, S.W. Solving a Fabrication Lot-Size and Shipping Frequency Problem with an Outsourcing Policy and Random Scrap. Math. Comput. Appl. 2016, 21, 45. https://doi.org/10.3390/mca21040045
Chiu Y-SP, Liang G-M, Chiu SW. Solving a Fabrication Lot-Size and Shipping Frequency Problem with an Outsourcing Policy and Random Scrap. Mathematical and Computational Applications. 2016; 21(4):45. https://doi.org/10.3390/mca21040045
Chicago/Turabian StyleChiu, Yuan-Shyi Peter, Gang-Ming Liang, and Singa Wang Chiu. 2016. "Solving a Fabrication Lot-Size and Shipping Frequency Problem with an Outsourcing Policy and Random Scrap" Mathematical and Computational Applications 21, no. 4: 45. https://doi.org/10.3390/mca21040045
APA StyleChiu, Y.-S. P., Liang, G.-M., & Chiu, S. W. (2016). Solving a Fabrication Lot-Size and Shipping Frequency Problem with an Outsourcing Policy and Random Scrap. Mathematical and Computational Applications, 21(4), 45. https://doi.org/10.3390/mca21040045