Article

Development, Validation and Application of a Novel UHPLC-UV Method for the Simultaneous Determination of Valsartan and Nifedipine in the New Formulation of Self-Nanoemulsifying Drug Delivery Systems

1
Department of Pharmaceutics, College of Pharmacy, King Khalid University, Abha 62529, Saudi Arabia
2
Department of Bio- and Pharmaceutical Analysis, Fresenius University of Applied Sciences, Limburger Str. 2, 65510 Idstein, Germany
3
Department of Pharmaceutics, College of Pharmacy, King Saud University, Riyadh 11451, Saudi Arabia
*
Authors to whom correspondence should be addressed.
Separations 2022, 9(11), 325; https://doi.org/10.3390/separations9110325
Submission received: 1 September 2022 / Revised: 6 October 2022 / Accepted: 14 October 2022 / Published: 24 October 2022

Abstract

:
Our objective is to develop a robust method to quantify valsartan (VAL) and nifedipine (NIF) in developed a self-nanoemulsifying drug delivery formulation. An in-house ultra-high-performance liquid chromatography (UHPLC UV) method has been developed and validated for the simultaneous determination of VAL and NIF. The UV detection was performed isocratically, with a mobile phase comprised of acetonitrile, methanol and ammonium formate in the ratios of (15:45:40% v/v) and a flow rate of 0.35 mL/min at 236 nm. The correlation coefficients (R2) of this linear regression were 0.9984 for NIF and 0.9997 for VAL, respectively. The limit of detection (LOD) for NIF as 3.78 ppm, whereas the limit of detection (LOD) for VAL was 1.56 ppm. The limit of quantification (LOQ) of NIF and VAL were 11.47 ppm and 4.73 ppm, respectively. This method was effectively utilized to determine the amount of drug entrapped and drug loading efficiency percentage of the NIF and VAL self-nanoemulsifying formulations.

1. Introduction

Hypertension is a major global public health problem due to its prevalence and the risk of developing cardiovascular diseases [1,2,3,4,5]. According to the 2017 ACC (American College of Cardiology)/AHA (American Heart Association) guideline, the absolute burden of hypertension consistently increased from 87.0 million in 1999–2000 to 108.2 million in 2015–2016. Among hypertensive US adults, about 36.2% will require no less than one drug to control their high blood pressure, according to the 2017 ACC/AHA guideline [6,7]. It is believed that combining two antihypertensive drugs could achieve a more effective complementary mechanism of action in comparison to doubling the dose of a single drug, where efficacy and tolerability can be achieved by combining agents that either interfere with distinctly different pressor mechanisms or effectively block counterregulatory responses and whenever side effects associated with a particular agent are neutralized by the pharmacologic effects of an added drug, respectively [8,9]. Valsartan (VAL) and Nifedipine (NIF) in Figure 1A,B are two different pharmaceutical compounds that belong to a class of anti-hypertensive agents, which acts on different receptors to reduce the blood pressure [10].
Val induces its action by antagonizing the renin-aldosterone system (RAAS), which is where it competes with angiotensin-II to bind to the type-1 angiotensin II receptor (AT2) subtype, which in turn prevents high blood pressure [10]. In comparison, NIF is a dihydropyridine calcium channel blocker that acts by inhibiting the transmembrane influx of extracellular calcium ions into the myocardial and vascular smooth muscle cells, resulting in dilation of the main coronary arteries [11,12].
VAL and NIF are used as a combinational therapy because of their synergistic effect when single drug treatment is ineffective [13,14]. Drug monitoring is essential to assess the therapeutic effect of this combination. A study conducted by Liu’s group showed that the effect of NIF, combined with VAL, in 180 patients suffering from hypertension exhibited a positive therapeutic effect of the combinational therapy. Of the patients who received both NIF and VAL, 95.56% were responsive to treatment, as compared to the control group (treated with VAL), where the response rate was 82.22% [15].
Our research aimed to design a new nano formulation for a combination therapy based on NIF (calcium channel blockers) and VAL (angiotensin II receptor blocker) as a novel formulation that has a broad effect as an antihypertensive oral medication. Drug delivery systems are the subject important studies that were performed very recently [16]. Self-nano emulsifying drug delivery systems (SNEDDS) have been developed as a liquid dosage form within the scope of the current studies using lipid oils and surfactant at a particular ratio. Two model drugs were loaded for the best therapeutic effect to reduce cardiac dysfunction and oxidative stress in isoproterenol-induced cardiotoxicity. The combination therapy was the first dosage form, which is not available on the market, but needed to be analyzed for quantification purposes in the current study.
Due to its ease of use, reproducibility, separation efficiency and ultra-high performance liquid chromatography (UHPLC), it is among the top choices for the quantification of various compounds. However, this technique requires optimization in order to separate the compounds with high sensitivity, as well as low retention times. For instance, Sood J et. al. [17], in a recent study, developed and validated a HPLC method for the simultaneous determination of VAL and NIF with high sensitivity. However, their method was tedious and consumed a high amount of solvent. Nano-pharmaceuticals have new and promising therapeutic platforms. Nano-formulations offer a better release profile and have an enhanced permeation and retention effect [18].
To the best of our knowledge, quantitative analysis of VAL and NIF in self-nanoemulsifying lipid-based formulations has not been reported yet.
Therefore, the aim of this study was to develop a sensitive UHPLC method to quantitate the amount of VAL and NIF active components in self-nanoemulsifying lipid-based formulations as a novel formulation. The method is new, simple, sensitive, accurate and reproducible, however, for a single drug, pre-clinical analysis one of the compounds can be used as an internal standard (IS) for precise quantitation of the other compound. The proposed method was first successfully applied to the analysis of self-emulsifying lipid-based formulations containing both VAL and NIF, with no interference from dosage form excipients. In addition, antihypertensive treatment reduces the risk of cardiovascular complications in patients with high mortality and hypertension. Valsartan is highly selective antihypertensive that is rapidly absorbed after oral administration, but its oral bioavailability is only 25%. It is absorbed from the upper part of the gastrointestinal tract but is less soluble in this acidic environment. We aimed to develop a lipid-based formulation to produce a self-emulsifying drug delivery system (SEDDS) for valsartan. The method was validated in accordance with the standard International Council on Harmonization (ICH) guidelines [19].

2. Experimental

2.1. Materials and Equipment

VAL (>95% pure) and NIF (98% pure) were purchased from Alfa Aesar, (Ward Hill, Haverhill, MA 01835, USA). Excipients to develop the self-nanoemulsifying drug delivery systems (SNEDDS) dosage form, such as OS (Olive squalene oil), TOP-OV (Trioleyl Phosphate), Maisene 35-1 (long chain monoglycerides) and Cremophore EL (non-ionic surfactant-castor oil) were obtained from M/s NIKKOL chemicals, Japan, M/s Gattefosse, Saint-Priest Cedex, France and M/s BASF, Ludwigshafen, Germany, respectively. HPLC grade acetonitrile, methanol and ammonium formate were purchased from BDH laboratory supplies (BDH Chemicals Ltd., Poole, UK). The high purity Milli-Q water was obtained through a Milli-Q Integral Water Purification System (Millipore, Bedford, MA, USA). All other reagents were of analytical grade and were used without further purification.

2.2. Preparation of Self-Nanoemulsifying Lipid-Based Formulations

Two liquid anhydrous SNEDDS formulations were prepared by selecting various concentrations of oil and surfactant, as presented in Table 1. Initially, the SNEDDS were prepared by the simple admixture of oil with surfactant/cosurfactant using a vortex mixer to ensure homogeneity at an ambient temperature [20]. The model drugs (NIF and VAL) were then added to the SNEDDS formulations according to the equilibrium solubility (Table 1).

2.3. Characterization of Self-Nanoemulsifying Lipid-Based Formulation

Self-emulsification test: One gram of liquid SNEDDS from each formulation was taken and mixed with 1000 mL of milli-Q water (1: 1000 dilution) at room temperature with constant stirring using a spatula [21]. The SNEDDS were observed for the formation of stable nanoemulsions. The nanoemulsions formed were visually observed for phase clarity and self-emulsification time.
Droplet size analysis and zeta potential: The liquid SNEDDS were diluted with milli-Q water (1 in 1000 dilution) at room temperature (25 °C) under gentle agitation. The droplet size distribution and zeta potential were determined using the dynamic light scattering principle (Malvern Zetasizer, Nano ZS-90, Worcestershire, UK). The values of the mean droplet size distribution and the magnitude of the zeta potential were recorded in Table 2.

2.4. SNEDDS Drug Loading

The SNEDDS drug loading was determined using the equilibrium solubility experiment of the two model drug formulations NIF and VAL using the simple shake flask method [21]. The samples were prepared by adding an excess amount (approximately 50 mg/g) of both drugs to the SNEDDS, which was then shaken and thoroughly agitated using a vortex mixer to ensure adequate mixing. The samples were kept at 37 °C in the incubator for 7 days. Three replicates were taken for each formulation. The samples for the solubility experiments were analyzed using the developed UHPLC method by dissolving each of the formulations with an appropriate solvent.

2.5. Instrumentation

Development and optimization of chromatographic separation was completed with respect to the composition of mobile and stationary phases, column temperature, flow-rate, sample volume and detection wavelength. The work within the scope used a highly sensitive Ultra-High Performance Liquid Chromatography (UHPLC) system that was composed of a Dionex®® UHPLC binary solvent manager equipped with a Dionex®® automatic sample manager and a Photodiode Array (PDA) eλ detector by Thermo scientific, Bedford, MA, USA.

2.6. Preparation of Mobile Phase, Standard Solutions and Quality Control Sample

The mobile phase was an isocratic mixture of HPLC grade acetonitrile, methanol and ammonium formate aqueous solution in a ratio of (15:45:40% v/v). The flow rate was 0.35 mL/min, which was connected through an Acquity®® UPLC BEH C18 column (2.1 × 50 mm, 1.7 μm) with a temperature of 45 °C. The total run time was extended to 2.5 min, whereas the NIF and VAL was eluted for 0.87 and 1.95 min, respectively. A freshly prepared mobile phase was filtered through an online 0.20 μm filter and was degassed continuously by an online degasser within the UHPLC system. The detector wavelength was set at 236 nm and the injection volume was 2 μL.
A stock solution of VAL and NIF was prepared in methanol at a concentration of 1 mg/mL each. After this, standard solutions were prepared by a serial dilution from the stock solution, resulting in standards with concentrations ranging from 1 to 50 µg/mL (Table 3). The calibration curves were plotted for both VAL and NIF as the peak surface area of each compound versus the corresponding concentration in the standard and regression equations were computed. Three quality control (QC) samples with the selected concentrations of 1, 5 and 25 μg/mL were prepared to cover the desired range from the calibration standards.

3. Method Validation

The developed reverse phase UHPLC UV analytical procedure for the estimation of VAL and NIF simultaneously was validated according to the ICH Q2 (R1) guideline, which included system suitability, specificity, linearity, sensitivity, precision, accuracy and robustness.

3.1. Linearity and Calibration

For the construction of calibration curves, freshly prepared standards of varying concentrations of VAL and NIF (1.0–50.0 μg/mL) were employed. A combination of acetonitrile, methanol and ammonium formate aqueous solution were used as a mobile phase with a flow rate of 0.35 mL/min for the equilibration of the column. The UV detection during the measurement was set at 236 nm to detect the absorption maxima (λmax). The standards were injected in a nonduplicate manner (n = 9) and the resultant response in the form of peak areas was recorded for every standard. The calibration curve was constructed by plotting the known concentration of VAL and NIF against the concentration, as calculated from the peak surface area.

3.2. Specificity

The specificity of the developed analytical method was determined by assessing the interference from the blank. Three replicate injections of the diluent as blanks were evaluated at the retention times of VAL and NIF.

3.3. Accuracy and Precision

The six prepared NIF and VAL standards samples in the methanol solution with the drug samples were injected in the UHPLC system nine times for a duration of three days (Inter-day) and three times (n = 6) on the same day (Intra-day). Recovery (%) and relative standard deviation (RSD) (%) for each concentration were calculated to determine accuracy and precision, respectively. For an acceptable limit of accuracy and precision, the RSD value should be within ±15% and less than 15%, respectively. The recovery of the NIF and VAL from SNEDDS samples were carried out at three concentration levels, namely lower QC (LQC = 2.5 µg/mL), medium QC (MQC = 5 µg/mL) and high QC (HQC = 10 µg/mL) by the analysis of replicate (n = 6) samples. The peak areas obtained from QC samples were compared to those of analytical standards to calculate NIF and VAL recovery. Furthermore, accuracy and precision were measured using Equation (1), which is as follows:
A c c u r a c y = [ M e a s u r e   c o n c e n t a r t i o n N o m i n a l   c o n c e n t a r t i o n N o m i n a l   c o n c e n t r a t i o n ] × 100

3.4. Limit of Detection (LOD) and Lower Limit of Quantification (LLOQ)

The LOD and LOQ were determined from the calibration curve by first calculating the standard error of the linear line intercept, and then multiplying it by the number of replications at the line intercept. After that, the resultant values were multiplied by 3.3 for LOD and by 10 for LOQ [22].
LOD = Standard Deviation × 3.3/Slope
LOQ = Standard Deviation × 10/Slope

3.5. Statistical Analysis

The data were expressed as mean ± standard error of mean (SEM). The significance was determined by applying one-way ANOVA. p values < 0.05 were considered significant.

4. Results and Discussion

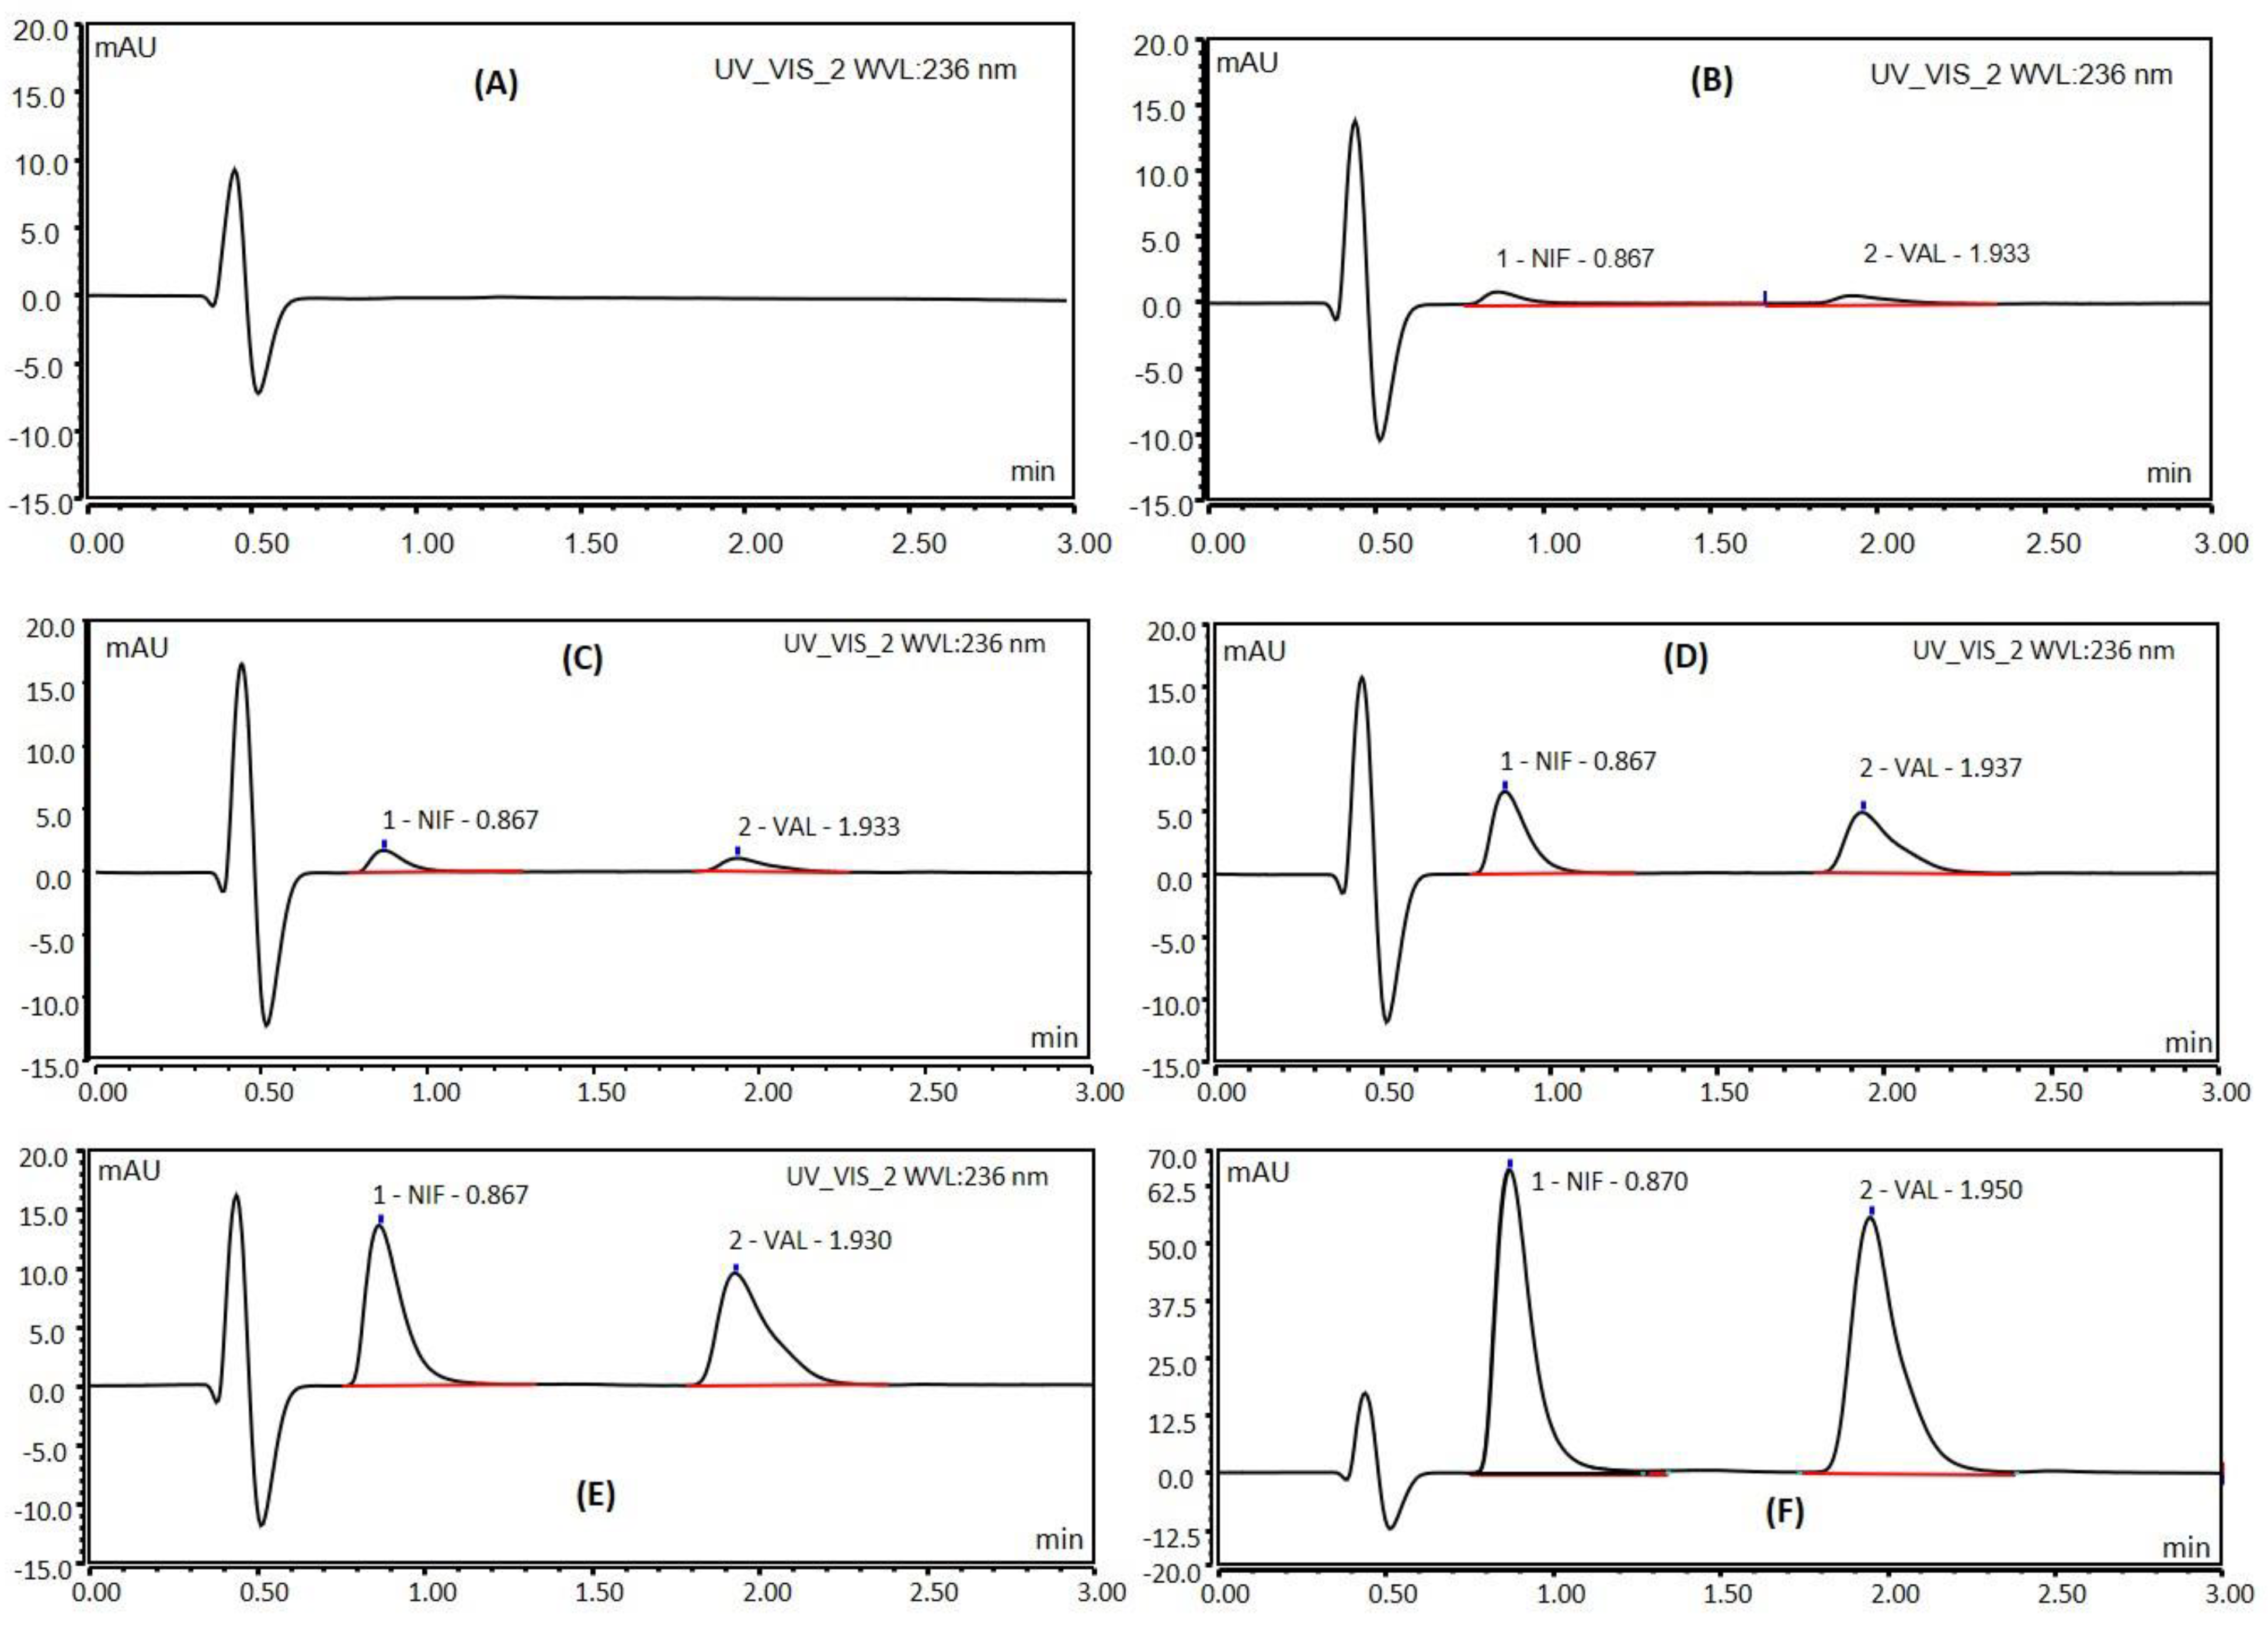
The obtained spectra from the newly developed UHPLC method showed good extraction and separation for VAL and NIF. Most importantly, the extraction and separation of VAL and NIF were performed in a rapid and shorter time (within approximately 2 min). The chromatographic retention times were consistent at 0.87 and 1.95 min for NIF and VAL, respectively. Figure 2A–D show the recorded detection of NIF and VAL at various concentrations (1 µg/mL, 10 µg/mL, 25 µg/mL, 50 µg/mL). As expected, the intensity of the absorbance increased with increasing concentrations of NIF and VAL. The method developed is sensitive enough to detect values as low as 1 ppm (1 µg/mL) and offers a rapid determination of NIF and VAL.

4.1. System Suitability Studies

The current suitability was considered to assess the performance and the highest precision of the systems. The variations (% RSD) in the peak area from the samples (nine replicates) were very minor, which demonstrates that the system is precise (Table 4). The results of other chromatographic parameters, such as peak tailing and theoretical plate numbers (shows column efficiency), were also shown in Table 4. The overall analyses of the results reveled the acceptability/highest performance of the system due to having tailing peaks of 1.08 and 1.34 for NIF and VAL, respectively. In addition, the theoretical plates were more than 2000 in all chromatographic runs.

4.2. Linearity and Calibration Curves

To estimate the unknown concentrations of NIF and VAL, linear interpolation process was performed. The following equations were established using the linear regression method using the regression formula:
y = y1 + ((xx1)/(x2 − x1)) × (y2 − y1)
The best fit for this relationship can be expressed as follows:
NIF:
y = 0.9945 x + 0.1723
VAL:
y = 1.0213 x + 0.774
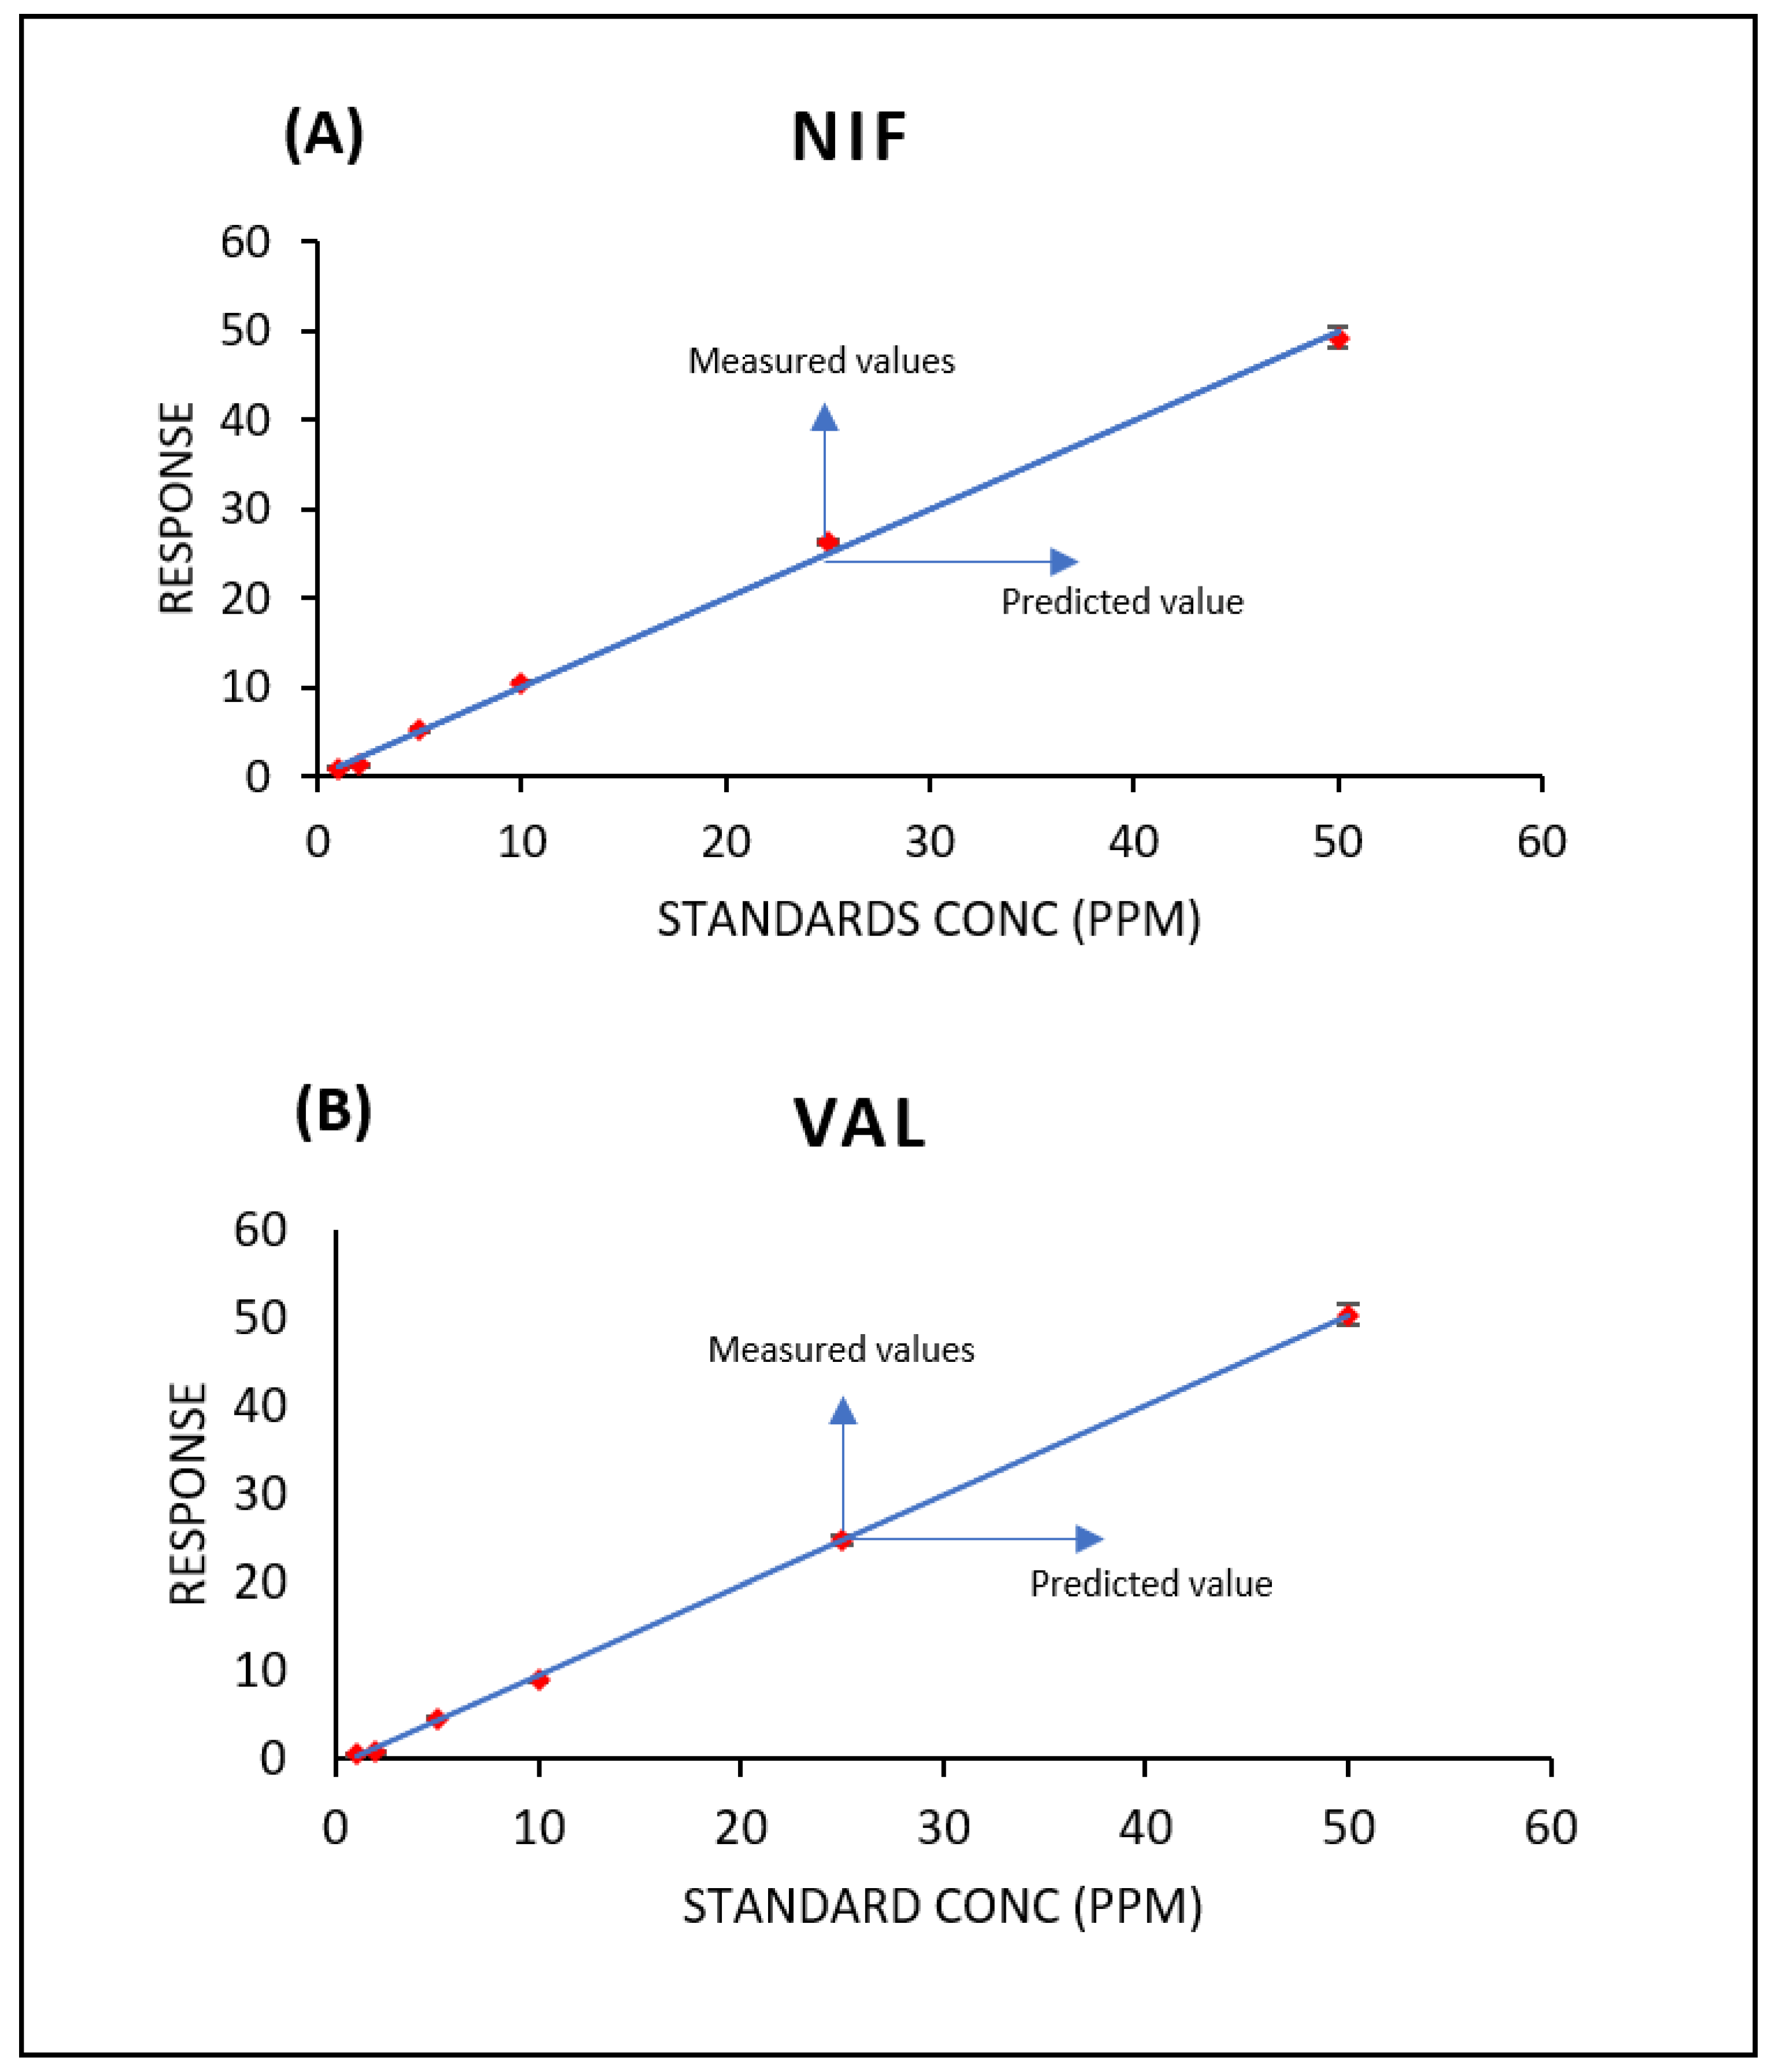
where y = the amount of an unknown concentration of the drug, and x = generated concentration of the drug peak area ratio. The correlation coefficient (R2) of this line is 0.9984 for NIF and 0.9997 for VAL (Figure 3A,B).
For most of the drug assay methods, the response is a non-linear function of the analyte concentration, and the standard deviations (SD) of the calculated concentrations are not a constant variable of the mean response; therefore, a weighted, non-linear least squares method is generally recommended for fitting dose-response data.

4.3. Accuracy

Accuracy levels were investigated by calculating the peak areas from nine replicates of each of the standards that were used for data analysis and validation. Calibration curves of NIF and VAL were plotted accordingly (Figure 3 above) and the percent deviations are presented in Table 5.
Accuracy (or trueness) is the most important aspect and should be addressed in any analytical method validation. Accuracy shows the extent of agreement between the experimental value (calculated from replicate measurements) and the reference values. It is a measurement of the systematic errors that affect the method. To estimate the accuracy of a method, the analyte is measured against a reference material or by spiking a known amount of analyte in the blank matrix (QC samples) and calculating the percentage of recovery from the matrix. The guideline for validation of analytical methods recommends checking the accuracy within run and between runs by analyzing samples on at least three QC levels (low, medium and high) as a representative of the whole analytical range. The accuracy data are reported as the percentage of the nominal concentrations and the mean concentration of 15% for all QC levels.

4.4. LOD and LOQ

The LOD of NIF was 3.78 µg/mL, whereas the LOD for VAL was 1.56 µg/mL. The LOQ of NIF and VAL were 11.47 µg/mL and 4.73 µg/mL, respectively.
The LOD is generally defined as the lowest amount of an analyte in a sample that can be detected by a particular analytical method. LOD is usually evaluated using the calculation of the signal/noise relationship, considering the assumption that data normality, homoscedasticity and independency of residuals are met. The signal-to-noise ratio is determined by comparing the analytical signals at known low concentrations compared with those of blank sample up to a concentration that produces a signal equivalent to three times the standard deviation of the blank sample. Determination of the LOD is not necessary during the validation because the assay may have high variability at that level.

4.5. Applicability of the Method

The applicability of the developed UHPLC method has been confirmed, and the optimized conditions were successfully applied for the quantification of the NIF and VAL compounds in the studies of equilibrium solubility/drug loading and dissolution profiles of self-nanoemulsifying lipid-based formulations (SNEDDS) at three different strengths. As no combination therapy with NIF and VAL is available on the market, our method is the first to model the drugs in a single dosage form. Since NIF and VAL have been of interest for their health benefits, the present analytical method could have potential applications identifying and quantifying these compounds, either in a single and or combined dosage form. The drug loading in the case of NIF and VAL of the three different strengths are given below (Table 6). The results from the percentage recovery (label claimed) of the analysis were above almost 99%, thus suggesting the applicability of the method for future marketed/commercial products. The UHPLC chromatograms of NIF and VAL did not show any interference as no detectable matrix peak was eluted at the retention time of either drug at 0.87 min and 1.95 min.

5. Conclusions

The developed RP-UHPLC method is a fast and reliable, with a reproducible assay with higher specificity for VAL and NIF analysis in pure and pharmaceutical formulations, respectively. This method is sensitive enough to detect values as low as 1 µg/mL, which could exclusively offer rapid determination of NIF and VAL (peaks at 0.87 min and 1.95 min within 2 min run time). No significant interferences were caused by the formulation excipients, diluents and/or degradation products. The validation method allows for the quantification of NIF and VAL in pure liquid and solid pharmaceutical formulations between 1 and 50 µg/mL. Compared to previously reported methods, the present assay assessed a rapid determination. The method has shown acceptable precision, accuracy and adequate sensitivity, and could be used for robust pharmaceutical analysis of the dosage form. The established method satisfies the system suitability criteria, peak integrity and resolution of the drug peak, respectively. The overall results indicate that the current method is attractive due to its good selectivity for the simultaneous quantitative determination of NIF and VAL in SNEDDS formulations. The objective of the current study was to develop a simultaneous method and we will add to this in future formulation developments (dosage forms) and in-vivo studies, where we would apply the current analytical method.

Author Contributions

Conceptualization, M.A.R., M.B. and G.S.; methodology, M.B. and G.S.; validation M.A.R., and M.B.; formal analysis, data curation, M.B. and G.S.; writing—original draft preparation, M.B. and G.S.; writing—review and editing, M.A.R. and M.K.; supervision, M.K.; project administration, M.A.R. and M.K.; funding acquisition, M.A.R. and M.K. All authors have read and agreed to the published version of the manuscript.

Funding

This research study was funded by the Deanship of Scientific Research at King Khalid University through group (large) research program under grant number RGP 2/70/43.

Institutional Review Board Statement

Not applicable.

Informed Consent Statement

Not applicable.

Data Availability Statement

Not applicable.

Acknowledgments

The authors extend their appreciation to the Deanship of Scientific Research at King Khalid University for funding this work through group (large) research program under grant number RGP 2/70/43.

Conflicts of Interest

The authors have declared that there is no conflict of interest.

References

  1. Danaei, G.; Ding, E.; Mozaffarian, D.; Taylor, B.; Rehm, J.; Murray, C.J.L.; Ezzati, M. The Preventable Causes of Death in the United States: Comparative Risk Assessment of Dietary, Lifestyle, and Metabolic Risk Factors. PLoS Med. 2009, 6, e1000058. [Google Scholar] [CrossRef] [PubMed]
  2. GBD 2015 Risk Factors Collaborators. Global, regional, and national comparative risk assessment of 79 behavioural, environmental and occupational, and metabolic risks or clusters of risks, 1990-2015: A systematic analysis for the Global Burden of Disease Study. Lancet 2016, 388, 1659–1724. [Google Scholar] [CrossRef] [Green Version]
  3. Mills, K.T.; Bundy, J.D.; Kelly, T.N.; Reed, J.; Kearney, P.M.; Reynolds, K.; Chen, J.; He, J. Abstract 16828: Global Disparities of Hypertension Prevalence and Control: A Systematic Analysis of Population-based Studies From 90 Countries. Circulation 2015, 132, A16828. [Google Scholar] [CrossRef]
  4. Murray, C.J.; Abraham, J.; Ali, M.K.; Alvarado, M.; Atkinson, C.; Baddour, L.M.; Bartels, D.H.; Benjamin, E.J.; Bhalla, K.; Birbeck, G.; et al. The state of US health, 1990-2010: Burden of diseases, injuries, and risk factors. Jama 2013, 310, 591–608. [Google Scholar] [CrossRef] [PubMed] [Green Version]
  5. Forouzanfar, M.H.; Liu, P.; Roth, G.A.; Ng, M.; Biryukov, S.; Marczak, L.; Alexander, L.; Estep, K.; Abate, K.H.; Akinyemiju, T.F.; et al. Global Burden of Hypertension and Systolic Blood Pressure of at Least 110 to 115 mm Hg, 1990-2015. JAMA 2017, 317, 165–182. [Google Scholar] [CrossRef] [PubMed] [Green Version]
  6. Dorans, K.S.; Mills, K.T.; Liu, Y.; He, J. Trends in Prevalence and Control of Hypertension According to the 2017 American College of Cardiol-ogy/American Heart Association (ACC/AHA) Guideline. J. Am. Heart Assoc. 2018, 7, e008888. [Google Scholar] [CrossRef] [PubMed] [Green Version]
  7. Go, A.S.; Mozaffarian, D.; Roger, V.L.; Benjamin, E.J.; Berry, J.D.; Borden, W.B.; Bravata, D.M.; Dai, S.; Ford, E.S.; Fox, C.S.; et al. Executive summary: Heart disease and stroke statistics-2013 update: A report from the American Heart Asso-ciation. Circulation 2013, 127, 143–152. [Google Scholar] [CrossRef] [PubMed]
  8. James, P.A.; Oparil, S.; Carter, B.L.; Cushman, W.C.; Dennison-Himmelfarb, C.; Handler, J.; Lackland, D.T.; LeFevre, M.L.; MacKenzie, T.D.; Ogedegbe, O.; et al. 2014 evidence-based guideline for the management of high blood pressure in adults: Report from the panel members appointed to the Eighth Joint National Committee (JNC 8). Jama 2014, 311, 507–520. [Google Scholar] [CrossRef] [PubMed] [Green Version]
  9. Wald, D.S.; Law, M.; Morris, J.K.; Bestwick, J.P.; Wald, N.J. Combination Therapy Versus Monotherapy in Reducing Blood Pressure: Meta-analysis on 11,000 Participants from 42 Trials. Am. J. Med. 2009, 122, 290–300. [Google Scholar] [CrossRef] [PubMed]
  10. Gradman, A.H.; Basile, J.N.; Carter, B.L.; Bakris, G.L.; American Society of Hypertension Writing Group. Combination therapy in hypertension. J. Am. Soc. Hypertens 2010, 4, 42–50. [Google Scholar] [CrossRef] [PubMed]
  11. National Center for Biotechnology Information. PubChem Compound Summary for CID 60846; National Center for Biotechnology Information: Bethesda, MD, USA, 2021.
  12. National Center for Biotechnology Information. PubChem Database. Nifedipine, C; National Center for Biotechnology Information: Bethesda, MD, USA, 2021.
  13. Nerenberg, K.A.; Zarnke, K.B.; Leung, A.A.; Dasgupta, K.; Butalia, S.; McBrien, K.; Harris, K.C.; Nakhla, M.; Cloutier, L.; Gelfer, M.; et al. Hypertension Canada’s 2018 Guidelines for Diagnosis, Risk Assessment, Prevention, and Treatment of Hypertension in Adults and Children. Can. J. Cardiol. 2018, 34, 506–525. [Google Scholar] [CrossRef] [PubMed] [Green Version]
  14. Williams, B.; Mancia, G.; Spiering, W.; Agabiti Rosei, E.; Azizi, M.; Burnier, M.; Clement, D.L.; Coca, A.; de Simone, G.; Dominiczak, A.; et al. 2018 ESC/ESH Guidelines for the management of arterial hypertension. Eur. Heart J. 2018, 39, 3021–3104. [Google Scholar] [CrossRef] [PubMed] [Green Version]
  15. Liu, W.; Liu, Y.; Fu, J. Clinical effect and safety of nifedipine controlled-release tablets combined with valsartan in the treatment of primary hypertension. Pak. J. Pharm. Sci. 2019, 32, 2419–2422. [Google Scholar] [PubMed]
  16. Almasi, M.; Matiasova, A.; Sulecova, M.; Benova, E.; Sevc, J.; Vahovska, L.; Lisnichuk, M.; Girman, V.; Zelenakova, A.; Hudak, A.; et al. In vivo study of light-driven naproxen release from gated mesoporous silica drug delivery system. Sci. Rep. 2021, 11, 20191. [Google Scholar] [CrossRef] [PubMed]
  17. Sood, J.; Sapra, B.; Tiwary, A.K. Microemulsion Transdermal Formulation for Simultaneous Delivery of Valsartan and Nifedipine: Formulation by Design. AAPS Pharm. Sci. Tech. 2016, 18, 1901–1916. [Google Scholar] [CrossRef] [PubMed]
  18. Patra, J.K.; Das, G.; Fraceto, L.F.; Campos, E.V.R.; del Pilar Rodriguez-Torres, M.; Acosta-Torres, L.S.; Diaz-Torres, L.A.; Grillo, R.; Swamy, M.K.; Sharma, S.; et al. Nano based drug delivery systems: Recent developments and future prospects. J. Nanobiotechnol. 2018, 16, 71. [Google Scholar] [CrossRef] [PubMed] [Green Version]
  19. ICH Steering Committee. ICH Harmonized Tripartite Guidlines, Q1C, Stability Testing for New Dosage Forms; ICH Steering Committee: Geneva, Switzerland, 1996. [Google Scholar]
  20. Kazi, M.; Nasr, F.A.; Noman, O.; Alharbi, A.; Alqahtani, M.S.; Alanazi, F.K. Development, Characterization Optimization, and Assessment of Curcumin-Loaded Bioactive Self-Nanoemulsifying Formulations and Their Inhibitory Effects on Human Breast Cancer MCF-7 Cells. Pharmaceutics 2020, 12, 1107. [Google Scholar] [CrossRef] [PubMed]
  21. Kazi, M.; Alhajri, A.; AlShehri, S.M.; Elzayat, E.M.; Al Meanazel, O.T.; Shakeel, F.; Noman, O.; Altamimi, M.A.; Alanazi, F.K. Enhancing Oral Bioavailability of Apigenin Using a Bioactive Self-Nanoemulsifying Drug Delivery System (Bio-SNEDDS): In Vitro, In Vivo and Stability Evaluations. Pharmaceutics 2020, 12, 749. [Google Scholar] [CrossRef] [PubMed]
  22. Kazi, M.; Alqahtani, A.A.; Alsaadi, B.S.; Alkholief, M.; Alanazi, F.K. UHPLC Method Development for Determining Sitagliptin and Dapagliflozin in Lipid-Based Self-Nanoemulsifying Systems as Combined Dose in Commercial Products and its Application to Pharmacokinetic Study of Dapagliflozin in Rats. Pharm. Chem. J. 2019, 53, 79–87. [Google Scholar] [CrossRef]
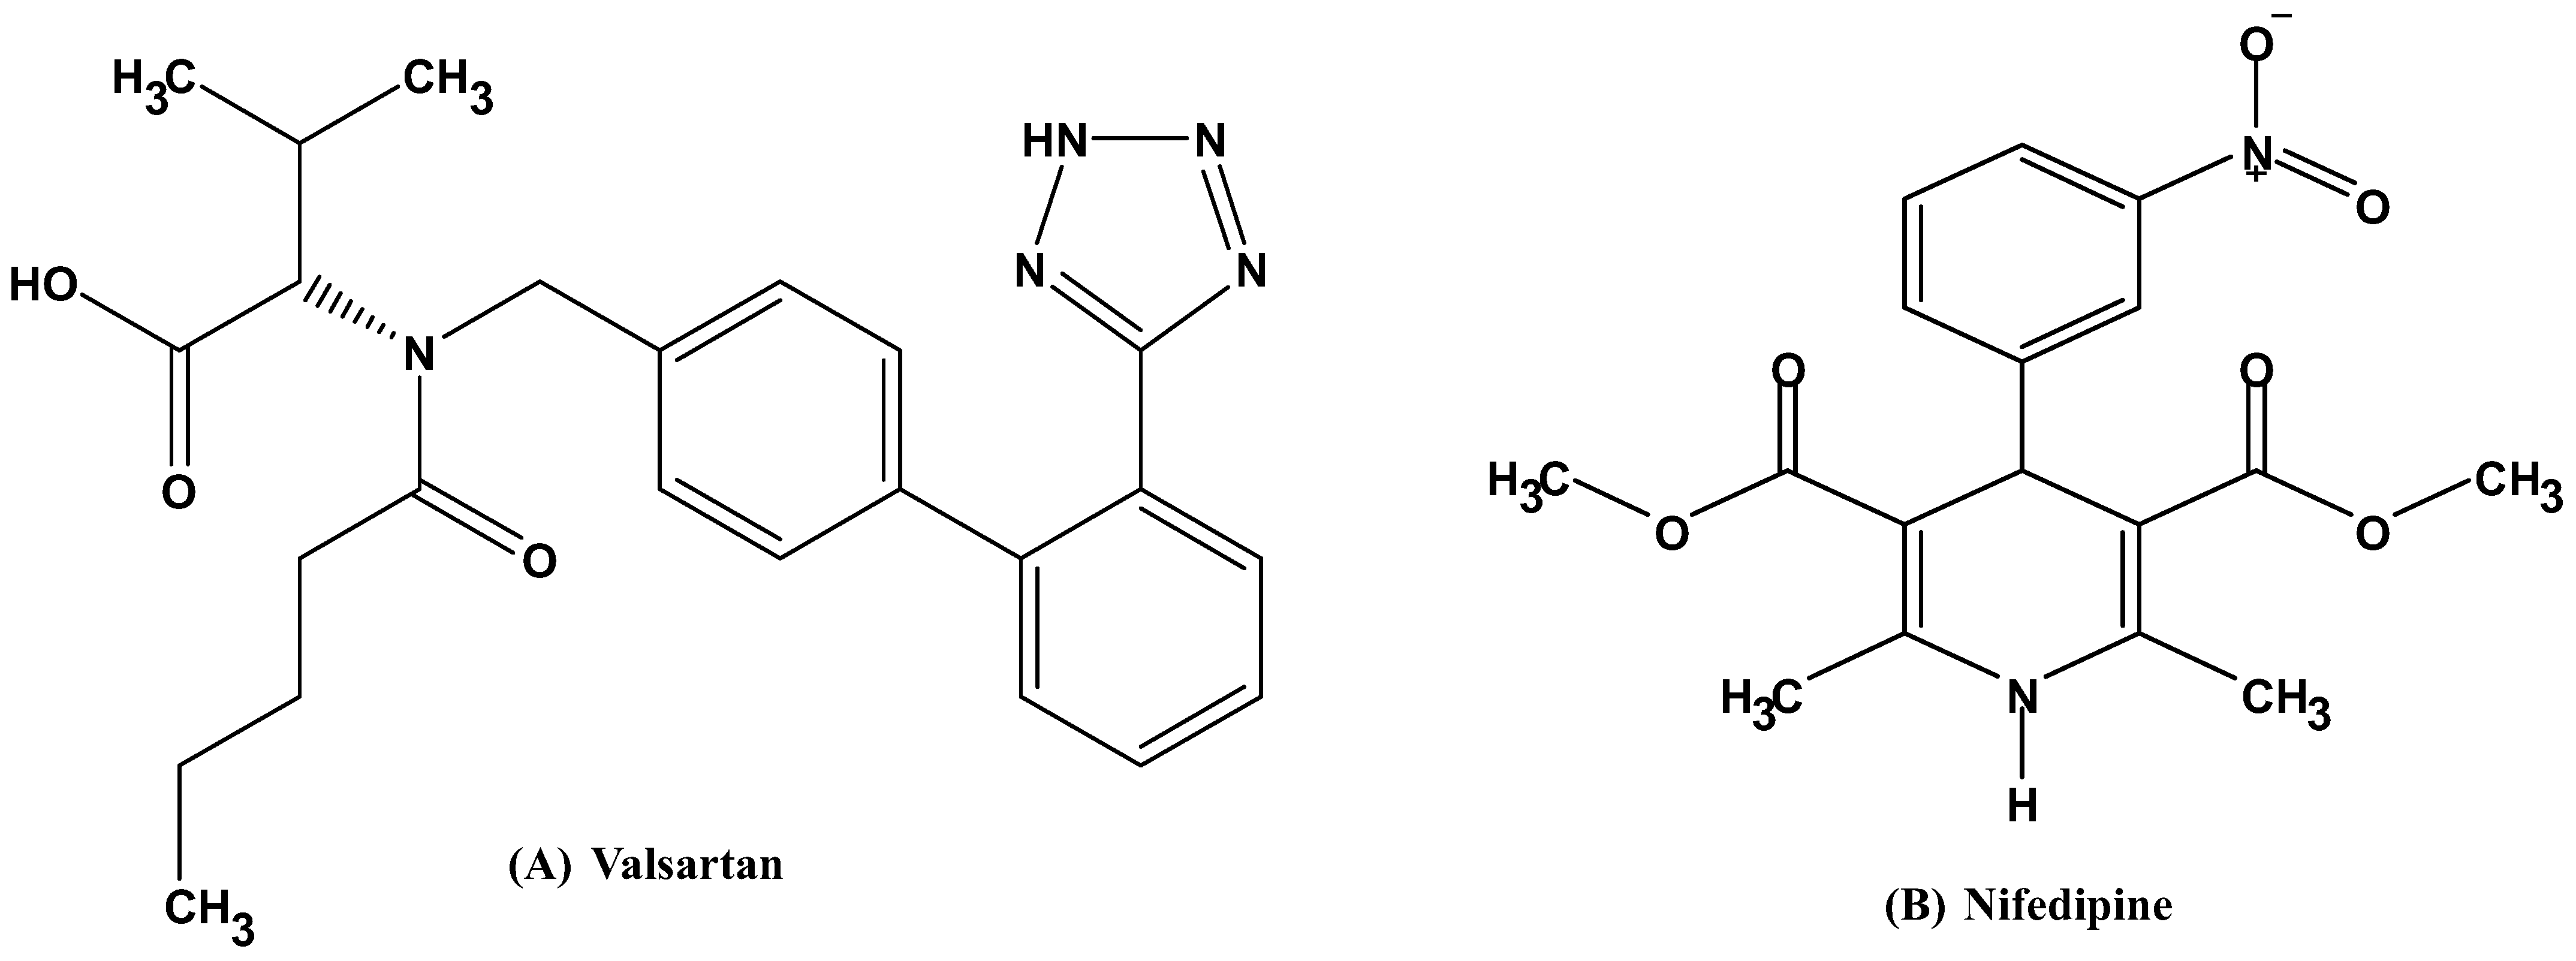
Figure 1. Chemical structure of: (A) Valsartan ((2S)-3-methyl-2-[pentanoyl-[[4-[2-(2H-tetrazol-5yl) phenyl]phenyl]methyl]amino] butanoic acid, MW = 435.5). (B) Nifedipine (dimethyl 2,6-dimethyl-4-(2-nitrophenyl)-1,4-dihydropyridine-3,5-dicarboxylate, MW = 346.3).
Separations 09 00325 g001
Figure 2. UHPLC spectra of Nifedipine (NIF) and Valsartan (VAL) at various concentrations. (A) a blank (drug free) chromatogram. (B) NIF and VAL retention time at 1 ppm. (C) NIF and VAL retention time at 5 ppm. (D) NIF and VAL retention time at 10 ppm. (E) NIF and VAL retention time at 25 ppm. (F) NIF and VAL retention time at 50 ppm. The intensity of absorbance was expressed in milli-absorbance unit (mAU) and time in minutes. The peak asymmetry of the sample run is presented in Table 4.
Separations 09 00325 g002
Figure 3. Linear regression model of (A) NIF and (B) VAL in which the differences between observed and predicted values have been shown.
Separations 09 00325 g003
Table 1. Solubility of the optimized SNEDDS formulations of NIF and VAL in olive squalene oil (OS), Nikkol (Trioleyl Phosphate) (TOP-OV) and Cremophore EL (CrEL).
F. No.Components (% W/W)Solubility (mg/g)
OSMaisene 35TOP-OVCrELNIFVAL
F1351550 30.89 ± 0.5512.6 ± 1.12
F21535 5029.13 ± 0.8210.76 ± 0.97
Table 2. Particle size and zeta potential measurement of the two SNEDDS formulations.
Formulation No.Formulation CompositionParticle Size (d.nm)PDIZeta Potential
F1** OS: Maisene-35/TOP-OV [35/15/50]483.260.492−48.8
F2** OS: Maisene-35/CrEL [15/35/50]198.43330.725−14.6
** OS: Olive squalene oil, TOP-OV: Nikkol (Trioleyl Phosphate), CrEL: Cremophore EL.
Table 3. Standards preparation scheme from the stock solution. Standard solutions were prepared from a serial dilution from the stock solution, resulting in standards with concentrations ranging from 1 to 50 µg/mL.
Std1Std2Std3Std4Std5Std6
Methanol volume (µL)950500600500600500
AdditionStockStd1Std2Std3Std4Std5
Volume of addition (µL) 50500400500400500
Final conc. (µg/mL)502510521
Table 4. Systems suitability parameters of NIF and VAL.
System Suitability ParameterNIF aVAL bStatus
Retention Time (Min)0.8671.933Passed
% RSD0.0450.067Passed
Peak Tailing1.081.34Passed
Theoretical Plate number25632345Passed
a,b Average values from nine (9) replicates.
Table 5. The percent deviation of nine replications of each standard.
Conc (ppm)NIF aVAL b
Std1114.757.85
Std2210.251.83
Std356.683.07
Std4102.361.74
Std5251.953.60
Std6504.404.56
a & b Average percent(%) SD results (n = 9).
Table 6. Analysis of NIF and VAL in developed in-house SNEDDS formulations.
Amount of Drug in SNEDDSNIF aVAL b
% Recovery % Recovery
2.5 mg/g99.09 ± 0.3598.99 ± 0.66
5 mg/g99.67 ± 0.1599.10 ± 0.45
10 mg/g99.91 ± 0.0999.76 ± 0.11
a & b The values between parenthesis correspond to Standard deviation (SD).
Publisher’s Note: MDPI stays neutral with regard to jurisdictional claims in published maps and institutional affiliations.