Article

Living with Breakthrough: Two-Dimensional Liquid-Chromatography Separations of a Water-Soluble Synthetically Grafted Bio-Polymer

1
Van’t Hoff Institute for Molecular Sciences, Faculty of Science, University of Amsterdam, Science Park 904, 1098 XH Amsterdam, The Netherlands
2
TA-COAST, Science Park 904, 1098 XH Amsterdam, The Netherlands
3
Nouryon Chemicals, Zutphenseweg 10, 7418 AJ Deventer, The Netherlands
4
Division of BioAnalytical Chemistry, Vrije Universiteit Amsterdam, de Boelelaan 1085, 1081 HV Amsterdam, The Netherlands
5
Centre for Analytical Science Amsterdam, Science Park 904, 1098 XH Amsterdam, The Netherlands
6
DSM Materials Science Center, Urmonderbaan 22, 6167 MD Geleen, The Netherlands
*
Author to whom correspondence should be addressed.
Separations 2020, 7(3), 41; https://doi.org/10.3390/separations7030041
Submission received: 5 May 2020 / Revised: 1 July 2020 / Accepted: 8 July 2020 / Published: 15 July 2020

Abstract

:
In this study, we evaluate the use of various two-dimensional liquid chromatographic methods to characterize water-soluble, synthetically grafted bio-polymers, consisting of long poly(acrylic acid) chains and short maltodextrin grafts. The confirmation of the presence of grafting and the estimation of its extent is challenging. It is complicated by the limited solubility of polymers, their structural dispersity and chemical heterogeneity. Moreover, the starting materials (and other reagents, reaction products and additives) may be present in the product. Reversed-phase liquid chromatography (RPLC), hydrophilic-interaction liquid chromatography (HILIC) and size-exclusion chromatography (SEC) were used to characterize the product, as well as the starting materials. Additionally, fractions were collected for off-line characterization by infrared spectroscopy and mass spectrometry. The one-dimensional separation methods were found to be inconclusive regarding the grafting question. Breakthrough (the early elution of polymer fractions due to strong injection solvents) is shown to be a perpetual problem. This issue is not solved by comprehensive two-dimensional liquid chromatography (LC × LC), but information demonstrating the success of the grafting reaction could be obtained. SEC × RPLC and HILIC × RPLC separations are presented and discussed.

1. Introduction

Academic research into two-dimensional liquid chromatography (2D-LC) has come a long way since the fundamental ideas and theories were developed over 30 years ago. A diversification in 2D-LC research has arisen in response to instrumental developments and application needs [1,2]. Instrument requirements unique to comprehensive two-dimensional liquid chromatography (LC × LC) have gradually been met and modern research deals in large part with user-friendly method development, data interpretation, applications and operation modes to suit the analysis in question [3,4,5]. With the growing range of applications of LC × LC and dedicated, easy-to-use, commercially available instrumentation, the user base is diversifying. Some users seek high peak capacities for complex samples containing large numbers of components, whereas others seek selectivity and orthogonality for particularly challenging separations of specific molecules. This latter objective traces its roots to the initial conception of multidimensional separations [1]. Several modern papers discuss studies on orthogonality, efficiency and phase-system compatibility [2,3,6].
In this study, we evaluated several online two-dimensional liquid-chromatographic methods to verify the presence of acrylic-hybrid oligosaccharides with emphasis on retention and breakthrough [7]. Produced from the grafting of poly(acrylic acid) (PAA) chains with maltodextrin (MD), the polymer studied is a graft copolymer of synthetic and biological origin, which has been developed to increase the biodegradability and sustainability of scale-prevention agents for cleaning and water treatment applications. Usually, synthetic polyanions, such as polyacrylic or maleic acid, are used in these applications because of their excellent chelating properties. However, several disadvantages, such as a shortage of monomers and poor biodegradability, make their use less attractive. Polymers from renewable natural sources have better availability and better biodegradability, but they often lack the properties required for final application. The grafting presumably occurs during the radical polymerization of acrylic monomers and the expected copolymers are shown in Figure 1. As the final product of this reaction could consist of only a small portion of grafted PAA-MD polymer and a significant fraction of unreacted PAA and MD, the separation method should resolve both PAA and MD and distinguish these from the hybrid PAA-MD. The different nature of the polymers and their structural dispersity and chemical heterogeneity create a major challenge to establish a method using which all the species can be separated and identified. Good characterization of these hybrids is also necessary to establish a good correlation between structure and properties.
For the analysis of carbohydrate monomers and oligomers, several techniques are available [8,9]. Previously, gradient-elution liquid chromatography has shown promise as the first dimension in a two-dimensional separation of branched polymers, when the degree of branching and molar mass are sample dimensions of interest for challenging carbohydrates and polyelectrolytes [10,11,12]. However, comprehensive two-dimensional approaches had only been applied to charged, low-molecular-weight heparins and to mono- and oligo-saccharides, until recently, when acrylate-modified hyaluronic acid hybrids were separated by Viktor et al. [13]. An interesting combination from a selectivity standpoint is hydrophilic-interaction liquid chromatography (HILIC) and reversed-phase liquid chromatography (RPLC), i.e., HILIC × RPLC. This combination is challenging in terms of phase-system compatibility, because the first-dimension effluent is a strong second-dimension eluent, potentially giving rise to peak deformation or breakthrough. However, it has been shown to yield greater orthogonality than more-straightforward combinations that employ adsorption on porous graphitic carbon (PGC) or aqueous size-exclusion chromatography (aq-SEC) in the first dimension (i.e., PGC × RPLC or aq-SEC × RPLC, respectively) [3]. The one-dimensional SEC of polysaccharides has previously been combined with nuclear magnetic resonance spectroscopy and mass spectrometry (MS) detection [14,15,16]. HPLC and its multidimensional variants have not often been applied to graft copolymers (including hybrids of synthetic and biopolymers) and, therefore, the potential of these techniques in the analysis of macromolecules is explored in this work.

2. Materials and Methods

2.1. Chemicals

Acetonitrile (ACN) was purchased from Biosolve (Valkenswaard, The Netherlands). Pure water (18.2 MΩ·cm) was produced by a Sartorius Arium 611UV Ultrapure Water System (Goettingen, Germany). Formic acid and ammonium acetate (reagent grade, ≥95%) were obtained from Sigma-Aldrich (Darmstadt, Germany). Hybrid-polymer industrial samples and their building blocks (PAA, MD) were supplied by AkzoNobel, Deventer, The Netherlands (now Nouryon Chemicals, Deventer, The Netherlands).

2.2. Instrumental

2.2.1. One-Dimensional Separations

Aqueous Size-Exclusion Chromatography

One-dimensional separations were conducted on a Shimadzu high-pressure liquid chromatography (HPLC) system (DGU-20A5, LC-10AD, CBM-20A) equipped with a manual injector with a 20-µL loop installed and recorded using an RID10A refractive index detector (RI), from Shimadzu, ’s Hertogenbosch, the Netherlands. The aq-SEC column was a TSK-GEL GMPWxl column (300 × 7.8 mm i.d., 13-µm particles) with a TSK-GEL GMPWxl guard column (40 × 6 mm i.d., 12-µm particles). The data were recorded using LabView 5.1 (National Instruments, Austin, TX, USA). The mobile phase was 0.05 M ammonium acetate, buffered to pH 6 with acetic acid.

Hydrophilic-Interaction and Reversed-Phase Chromatography

HILIC and RPLC separations were performed using an Agilent LC 1100 system (Agilent Technologies, Waldbronn, Germany) equipped with a quaternary pump, autosampler, column compartment (all 1100 series from Agilent) and an evaporative light-scattering detector (ELSD) from Polymer Laboratories (PL-ELS 2100, Church Stretton, UK; now also Agilent). The detector settings were: an evaporator temperature of 50 °C, a nebulizer temperature of 25 °C, and carrier flow 1.10 standard liters per minute (SLM) (N2), the light source intensity was 100%, a photomultiplier (PMT) gain of 1, and the smoothing width was 1. The data were recorded using Chromeleon 6.8 software (Thermo Fischer, Germering, Germany). HILIC chromatograms were obtained using a Kinetex HILIC bare-silica column (150 × 4.6 mm i.d., 2.6-µm particle size, 100 Å pore size) from Phenomenex (Torrance, CA, USA). Two RPLC columns were used in this work. One was a Platinum Extended Polar Selectivity (EPS) C18 (250 × 4.6 mm i.d., 5-µm particles) column from Grace Alltech (Lokeren, Belgium) and the other was a Titan C18 (30 × 2.1 mm i.d., 1.9 μm particles; Supelco, Bellefonte, PA, USA). Specific usage of the two columns is indicated in the results section.

Porous Graphitic Carbon Chromatography (PGC)

One-dimensional chromatograms were recorded on a Waters Acquity ultra-performance liquid chromatography (UPLC) system consisting of a binary solvent manager and sample manager equipped with a 20-µL loop (Waters, Milford, MA, USA) using a ThermoFisher Hypercarb column (100 × 2.1 i.d., 3-µm particles). Gradient chromatography was employed using mobile phase A: 100% H2O (0.1% FA); mobile phase B: 100% ACN (0.1% FA); flow rate: 0.3 mL/min; gradient 5–35% B, (2 to 10 min, kept for 1 min and back to initial conditions in 0.5 min); detection was performed using a Waters Acquity UPLC ELSD (gain: 500, gas pressure (N2): 207 kPa, nebulization mode: cooling (~12 °C), drift-tube temperature: 55 °C, data acquisition rate: 10Hz). The data were exported and processed using MATLAB 2013a (Mathworks, Woodshole, MA, USA).

2.2.2. Two-Dimensional Separations

Aqueous Size-Exclusion Chromatography × Reversed Phase Chromatography and Porous Graphitic Carbon Chromatography × Reversed Phase Chromatography

Two Acquity UPLC binary solvent managers (Waters) were used to supply mobile phases to the first and second-dimension columns, while the modulation interface consisted of an electrically-actuated 10-port 2-position Cheminert ultra-high-pressure switching valve (Valco VICI, Schenkon, Switzerland) equipped with two 50-µL loops, modulation time 30 s. Detection was performed using a Waters Acquity UPLC ELSD (settings as for one-dimensional PGC—see Section 2.2.1). The data were exported and processed using routines written in MATLAB 2013a. The aq-SEC column and eluent were the same as for one-dimensional aq-SEC (see Section 2.2.1 and Section 3.1.1). After 13 min, the flow rate was lowered from 0.5 to 0.1 mL/min to allow more fractions to be taken during the 1D elution window. The temperature was set at 23 °C. For the 2D separation, a TitanTM C18 column (30 × 2.1 mm i.d., 1.9 µm particles; Supelco) was used, operated at a flow rate of 1 mL/min with a set temperature of 50 °C.

Hydrophilic-Interaction × Reversed-Phase Chromatography

HILIC × RPLC separations were performed using two Agilent LC 1100 systems, each equipped with a quaternary pump, autosampler and column compartment. A PL-ELS 2100 ELSD was installed after the 2D column. The first dimension column (1D) was a Kinetex HILIC bare-silica column (150 × 4.6 mm i.d., 2.6-µm particles, 100 Å pore size) run at 40 μL/min and in the second dimension a Platinum EPS C18 column (250 × 4.6 mm i.d., 5-µm particles) was operated at 3 mL/min. Two 120-μL loops were mounted on a 2-position 10-port switching valve (Valco VICI), modulation time 3 min. Detection was performed using a Polymer Laboratories ELSD (settings as for one-dimensional RPLC—see Section 2.2.1). Chromatograms were plotted using MATLAB 2013a.

2.3. Identification

2.3.1. Mass Spectrometry Identification

Mass spectrometry (MS) was performed using a Xevo Q-ToF instrument (Waters Micromass, Manchester, UK), after fraction collection from the EPS RPLC column described above. The following MS experimental parameters were used in both positive-ion and negative-ion modes: capillary voltage 3.0 kV, sample cone 40 V, extractor cone 4 V, collision energy 4 V, quadrupole-analyser pressure 240 Pa, time-of-flight analyser pressure 7.74 × 10⁻⁵ Pa, with 1.32 Pa argon in the collision cell. The external calibration of the spectra was achieved using a solution of sodium formate. The data were acquired and processed with MassLynx software (Waters Micromass).

2.3.2. Infrared-Spectroscopy Identification

Spectra were recorded on a Perkin Elmer Frontier Fourier-transform infrared spectrometer (FT-IR, or IR) equipped with a micro attenuated total reflectance (ATR) accessory (Norwalk, CT, USA) using a scan range from 500 to 4000 cm−1.

2.4. Procedures

2.4.1. Sample Preparation

Preparation for Chromatography

Water-soluble PAA-MD hybrids were synthesised using a proprietary method, resulting in a mixture of grafted species and excess reactants. The samples were freeze-dried after synthesis and then dissolved in initial mobile phase, unless specified otherwise. In all cases, the sample solutions were filtered through a 0.45-µm nylon filter prior to analysis.

Preparation for Off-Line Analysis

Samples were collected after RPLC separation on the EPS column, at the indicated time intervals (Supplementary Material, Figure S1) and evaporated to dryness for 8 h (or overnight) in an evaporator at 40 °C. The dried residue was used as is for IR spectroscopy (Supplementary Material, Figure S2). The dried crystals were partially dissolved in Milli-Q water and used for MS identification (Supplementary Material, Figures S3–S5).

3. Results and Discussion

The samples used in this study were obtained via a proprietary industrial one-pot-synthesis process, where the desired product was a maltodextrin (MD) polyacrylic acid (PAA) hybrid polymer, referred to as hybrid-polymer sample or HY throughout the manuscript. Reagents that had not undergone hybridization, i.e., samples of PAA (without MD added) and MD (without PAA added) were also studied. The individual PAA and MD samples were treated the same as when their mixture was reacted to create the hybrid polymer. Additionally, these samples contained small amounts of additives not elaborated on in this work.
In the following sections, one-dimensional LC separations using three different modes are discussed and the identification of peaks is provided when possible. Separation on the PGC column was attempted as well but proved to be unsuitable for this mixture of compounds (see supplementary material Section S3.1). Finally, LC × LC separations are presented, as well as the information obtained from the 2D chromatograms. Additional information, such as spectra from off-line IR and MS analysis for identification, can be found in the Supplementary Material.

3.1. One-Dimensional Separations

3.1.1. Aqueous Size-Exclusion Chromatography (aq-SEC)

The use of aqueous SEC to separate and characterise (grafted) polysaccharide polymers was reported in literature on similar systems [14,17]. Therefore, this method was employed as a starting point in the characterization of the degree of grafting of PAA on MD. A separation between PAA and the hybrid polymer in the high-molecular-weight range of the sample was of special interest. The molecular weight distribution (MWD) of the graft was expected to be in the range from 200 to 200.000 Da, from the unreacted monomers to a large hybrid polymer.
The MD sample had a relatively low molecular weight and it was found to elute between 10 and 11 min (see Figure 2). The PAA sample had a higher molecular weight, with most of the distribution eluting between 8 and 9 min. The hybrid polymer showed a shoulder at the high-molecular-weight side when compared to the PAA sample (down to about 7.5 min), which may be indicative of a combined (PAA and MD) hybrid polymer. Because of the polydispersity of the PAA and MD, the grafting reaction did not cause the SEC signal to shift significantly. Moreover, unreacted MD appeared to be present in the HY sample. Therefore, it was not possible to determine to what extent the hybrid polymer was present from aq-SEC alone. Comparing MD and HY traces seemed to suggest that the low-MW MD reacts preferentially to form the hybrid, since the HY sample appeared to contain less of the low-MW fraction. For PAA and HY samples, a peak was found to elute after 12 min. This was thought to be an additive used in the polymerization process, which adsorbs slightly on the column. Even though aq-SEC did not separate the hybrid polymer from PAA, MD was separated. The extent of the separation and the compatibility with RPLC conditions made it an interesting candidate for a first-dimension separation in an LC × LC setup.

3.1.2. Reversed-Phase Liquid Chromatography (RPLC)

Extended Polar Selectivity C18 Reversed-Phase Liquid Chromatography (EPS RPLC)

An important step towards the isolation of the hybrid polymer may be taken by retaining PAA and PAA moieties in HY molecules based on the hydrophobicity of protonated PAA. In this way, PAA-containing macromolecules may be separated from less-retained sample components, such as MD and additives. Protonated PAA was shown to be retained in RPLC at low pH by Loiseau et al. and Yang et al. [12,18]. Therefore, the pH of the RPLC mobile phase and of the injection solvent was kept at 2.3 by the addition of 0.1% formic acid.
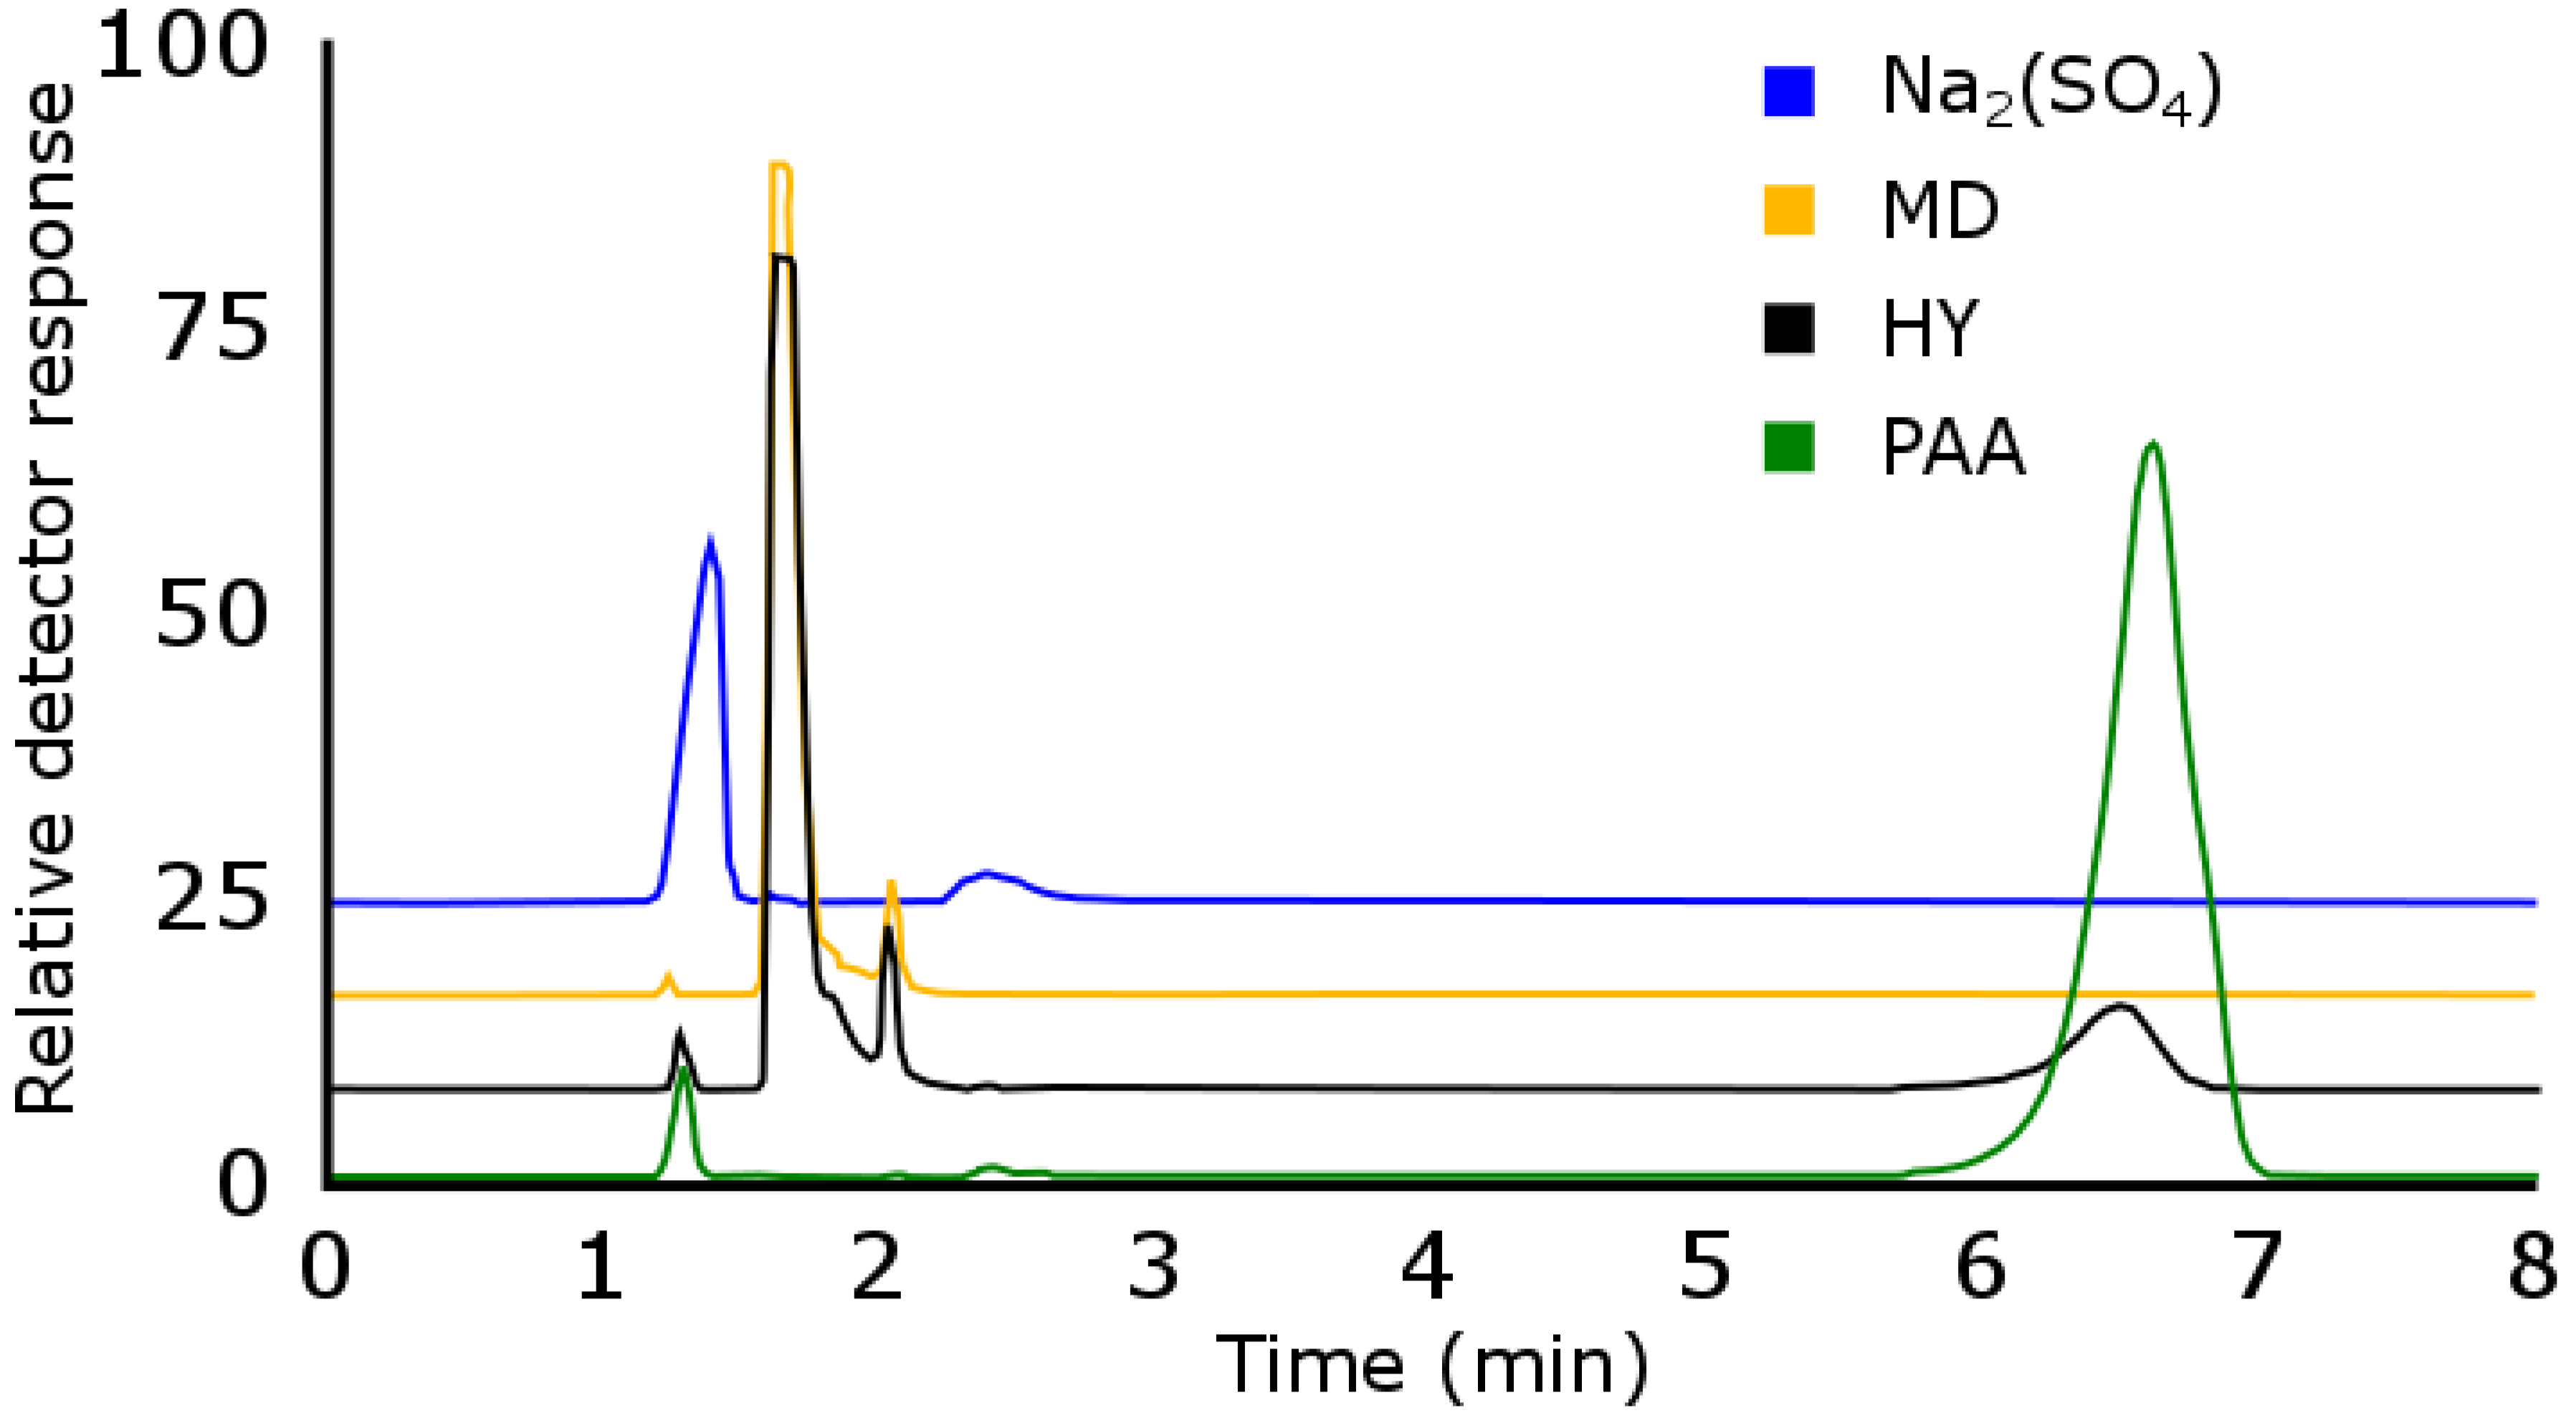
Samples of PAA, MD, HY and industrial salt additives (known to be present in the reaction mixture) were injected onto an EPS RPLC column. The EPS column was believed to provide higher selectivity (compared to conventional C18 columns) due to interactions between the PAA and uncapped silanols on the surface of the stationary phase. The resulting chromatograms can be seen in Figure 3. A peak was found to elute before the unretained time (t0), i.e., around 1.2 min. This was assigned to the anion HSO4, arising from the sulphate, which was present in all samples containing PAA, and which was thought to be electrostatically excluded from the pores of the stationary phase. The exclusion of the anion suggested a negative surface charge, even at pH = 2.3. MD eluted around t0 (1.8 min), except for a small fraction, which was slightly retained (around 2 min). MS analysis (Figure S3, in Supplementary Material) revealed that the MD peak around t0 (at 1.8 min, Figure 3) contained low-molecular-weight monomers and oligomers (2–7 MD units, Δ m/z 162.07 (C6H10O5), Table S1). The slightly retained tail (at 2.1 min, Figure 3) featured sizable oligomers (5–8 MD units, Δ m/z 162.05 (C6H10O5), Table S1). These results suggested that the higher MW MD showed slight retention in RPLC, resulting in a tailing t0 peak. The sharp peak (2.1 min) overlapping with this higher MW MD tail was thought to be a system peak, due to equilibration disturbance upon injection, or to an additive present in the MD. Both PAA and hybrid-polymer samples showed a retained peak eluting around 6.5 min. If the hybrid polymer sample were to contain free PAA (i.e., excess reagent from the reaction) this might overlap with PAA bonded to MD (i.e., the hybrid polymer). No separation between the two polymers was expected to occur. Mass spectrometry of the isolated 6.5 min peak showed a PAA series of 5 to 12 units (Δ m/z 72.02 (C3H4O2), Table S1) in the PAA sample (Figure S4, Table S1) and a PAA series of 5 to 18 units (Δ m/z 72.02 (C3H4O2), Table S1) in the hybrid (Figure S5). No masses corresponding to PAA-MD moieties were found. Therefore, the retained peak from the hybrid-polymer sample was collected and analysed off-line by FT-IR spectroscopy. The comparison of the spectra of the collected peaks can be seen in Supplementary Material (Figure S2). The main conclusion from the FT-IR comparison was that the retained peak of HY showed characteristic absorption bands for both PAA and MD. Given that MD was not retained under the conditions used, we found it probable that the moieties responsible for the MD-characteristic absorption bands in the retained HY peak were bonded to PAA. This concurred with the assumption that the hybrid polymer would overlap with free PAA in the retained peak (if there is free PAA in the sample). Since the quantification of the hybrid polymer was of interest, further research was aimed at separating the hybrid polymer and any free PAA possibly present in the sample.

Breakthrough in Extended Polar Selectivity C18 Reversed-Phase Liquid Chromatography

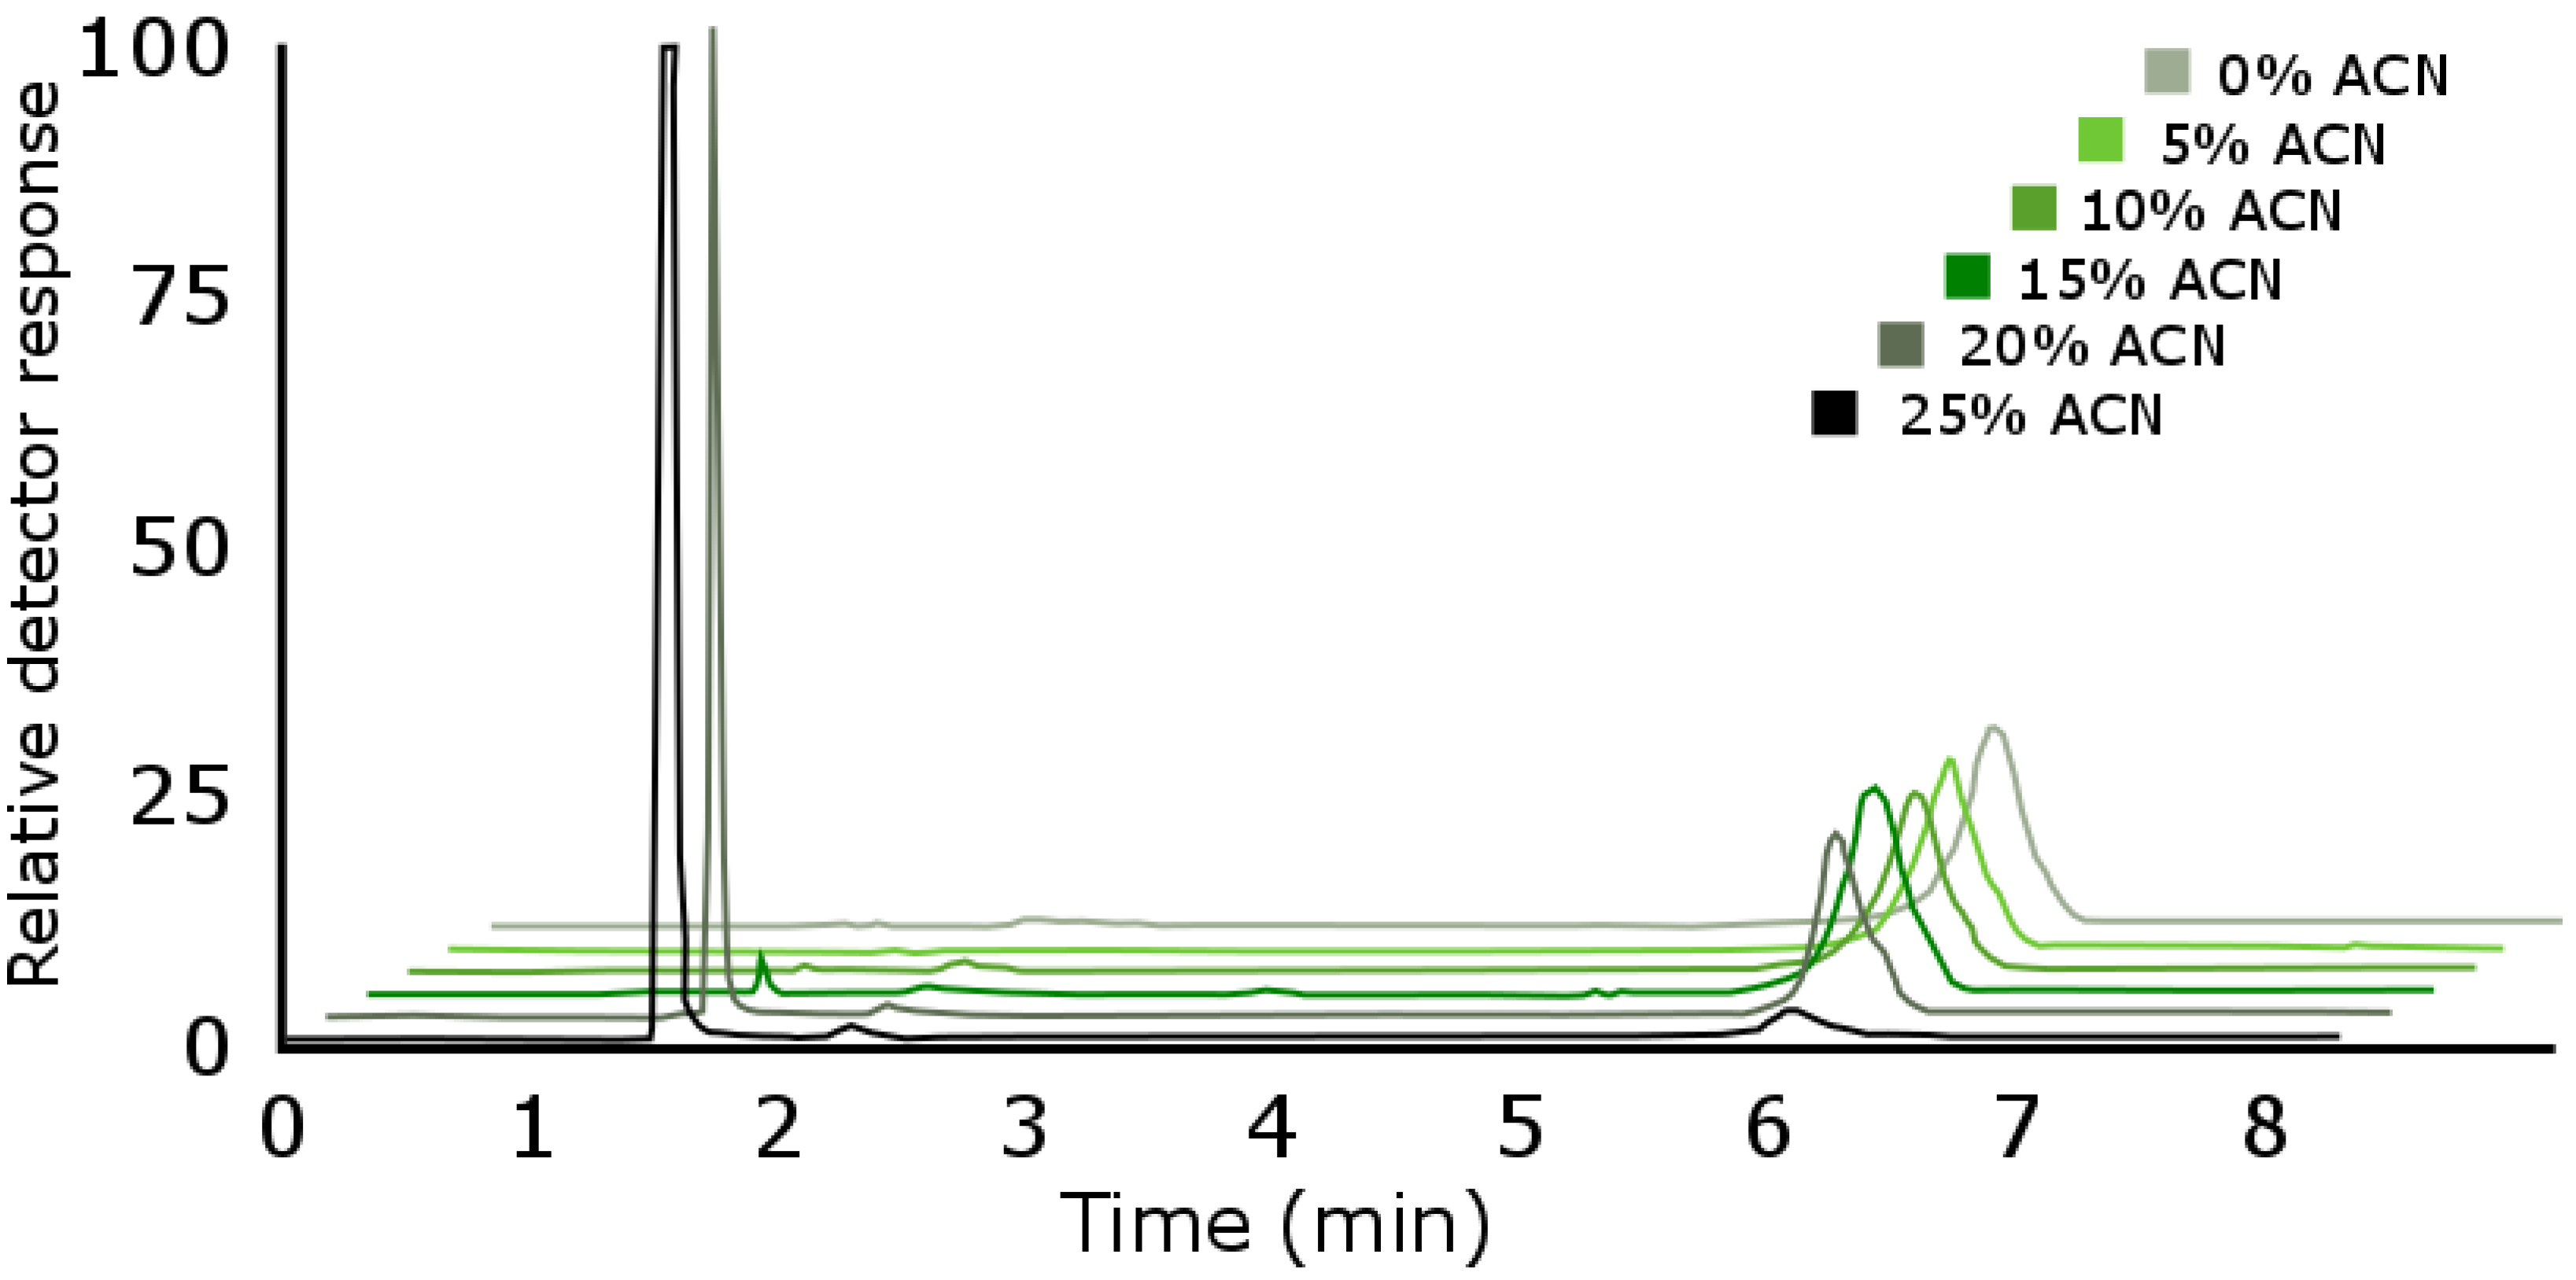
To decide on the suitability of a second-dimension column in a comprehensive LC × LC setup for a given sample, both system compatibility and retention orthogonality must be investigated. Various factors have been shown to negatively affect LC × LC separations with RPLC in the second dimension [19]. For instance, injection solvents have been shown to cause breakthrough in interaction chromatography. In the case of polymeric analytes, injection conditions and sample solubility are generally dominant factors [20]. In an effort to investigate how the retentive properties of PAA in the RPLC dimension could be utilized in an LC × LC setup, an injection-solvent-compatibility study was conducted. Figure 4 shows that (when injecting 100-µL samples on this 4.6 mm i.d. column) acetonitrile concentrations in the injection solvent of 10% v/v or more led to the breakthrough of PAA, i.e., some PAA migrates with the unretained injection-solvent plug to elute around t0. The severity of this effect depended on the strength of the injection solvent. A total of 20% v/v already led to severe breakthrough, even though most of the PAA was retained under the injection conditions (Figure 4). When qualitative information suffices, partial breakthrough of the PAA in the RPLC second dimension may be acceptable. The resulting 2D chromatograms are shown in Section 3.2.2. Care should be taken when the solubility of polysaccharides is considered, since a simple visual test of dissolution has proven to be insufficient, even when no precipitate was observed upon centrifugation [21].

Titan C18 Reversed Phase-Chromatography for 2D

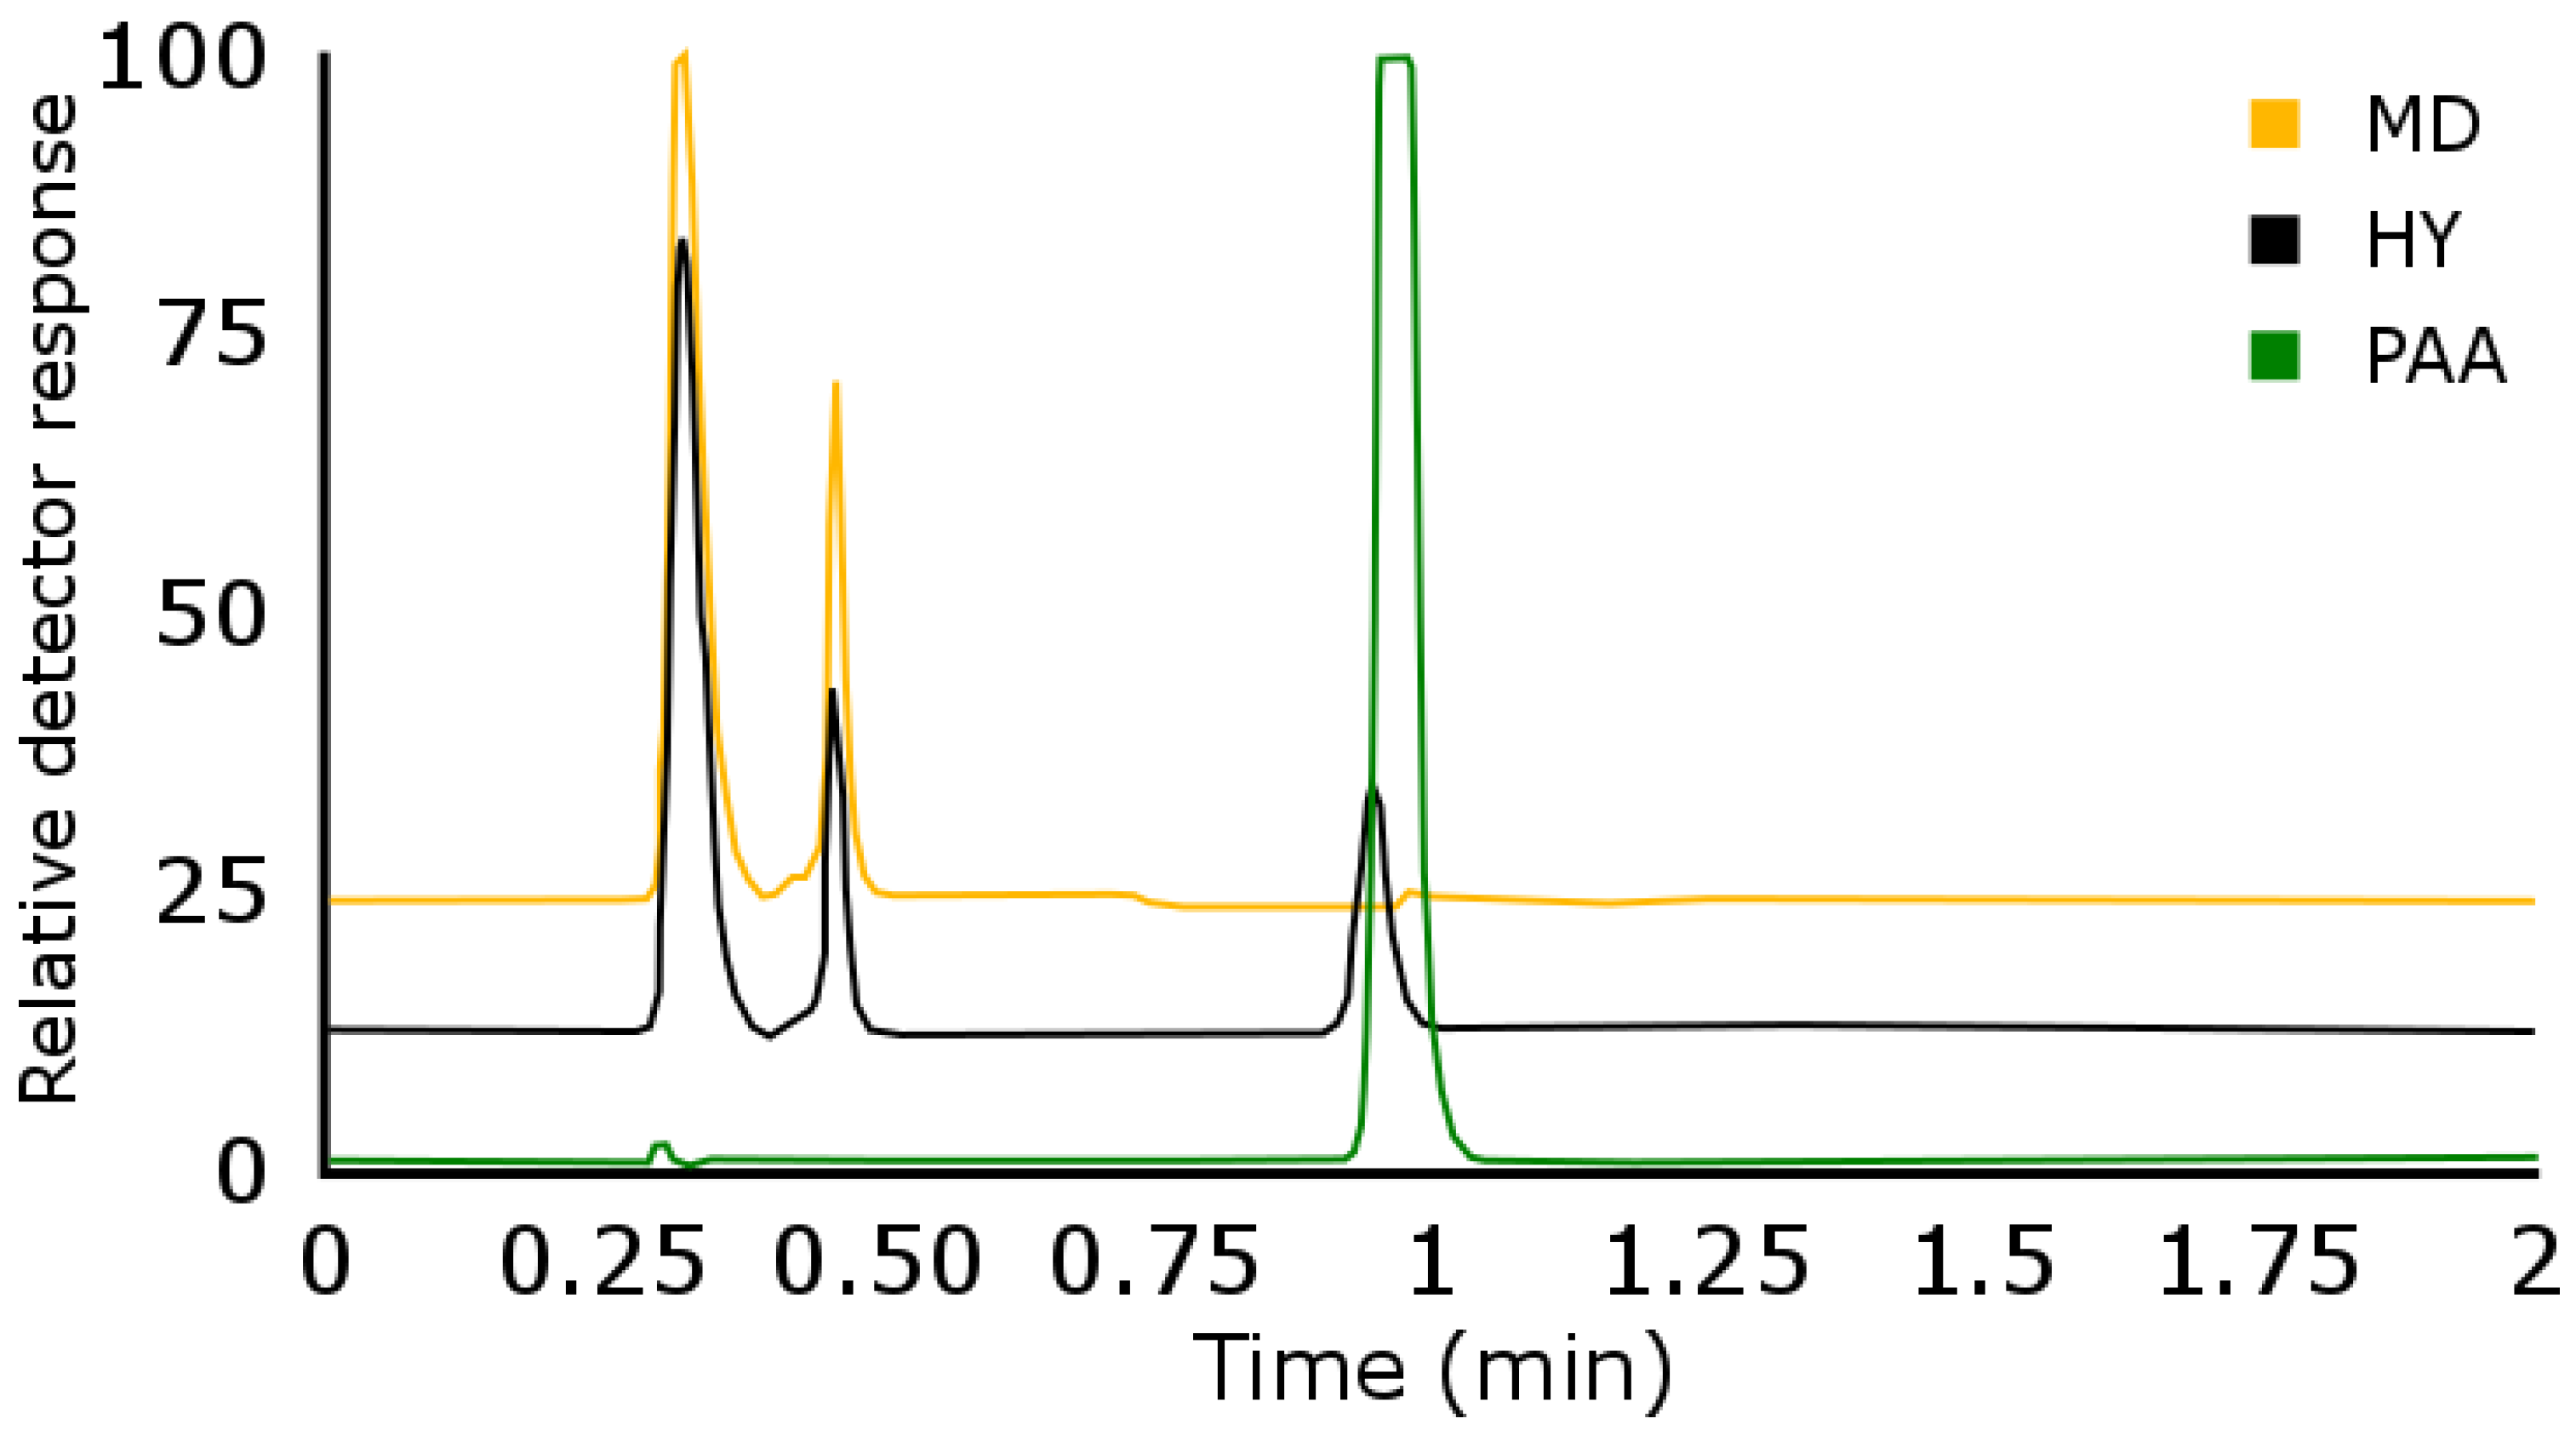
In the context of LC × LC, the 2D separation must be fast enough to sample 2-3 fractions per 1D peak [21]. For the analysis in question, this means that a much faster RPLC separation is required than achieved by the long EPS column with 5-μm particles. Therefore, a Titan C18 column (30 × 2.1 mm i.d., 1.9 μm particles) was selected. It showed essentially the same separation (Figure 5) as the EPS column (Figure 3), with an injection solvent that did not contain acetonitrile (hence no breakthrough). A large unretained peak appeared at about 0.25 min (t0; MD and additives) and a slightly-retained peak at about 0.40 min (system peak due to injection-plug-related equilibrium disturbance, or possibly an additive present in the MD). These MD peaks eluted under isocratic conditions, i.e., before the gradient reached the top of the column. The PAA was eluted from the column by a gradient in about 1 min. This column was used as the 2D column in SEC × RPLC (Section 3.2.1) and PGC × RPLC experiments (Figure S7 in Supplementary Material).

3.1.3. Hydrophilic-Interaction Liquid Chromatography (HILIC)

HILIC is generally considered a suitable mode of separation for saccharide monomers, oligomers, and polymers [22,23]. The goal of the HILIC analysis was to retain the MD and HY longer than the PAA, resulting in a separation that would be complementary to the RPLC system described in Section 3.1.2.
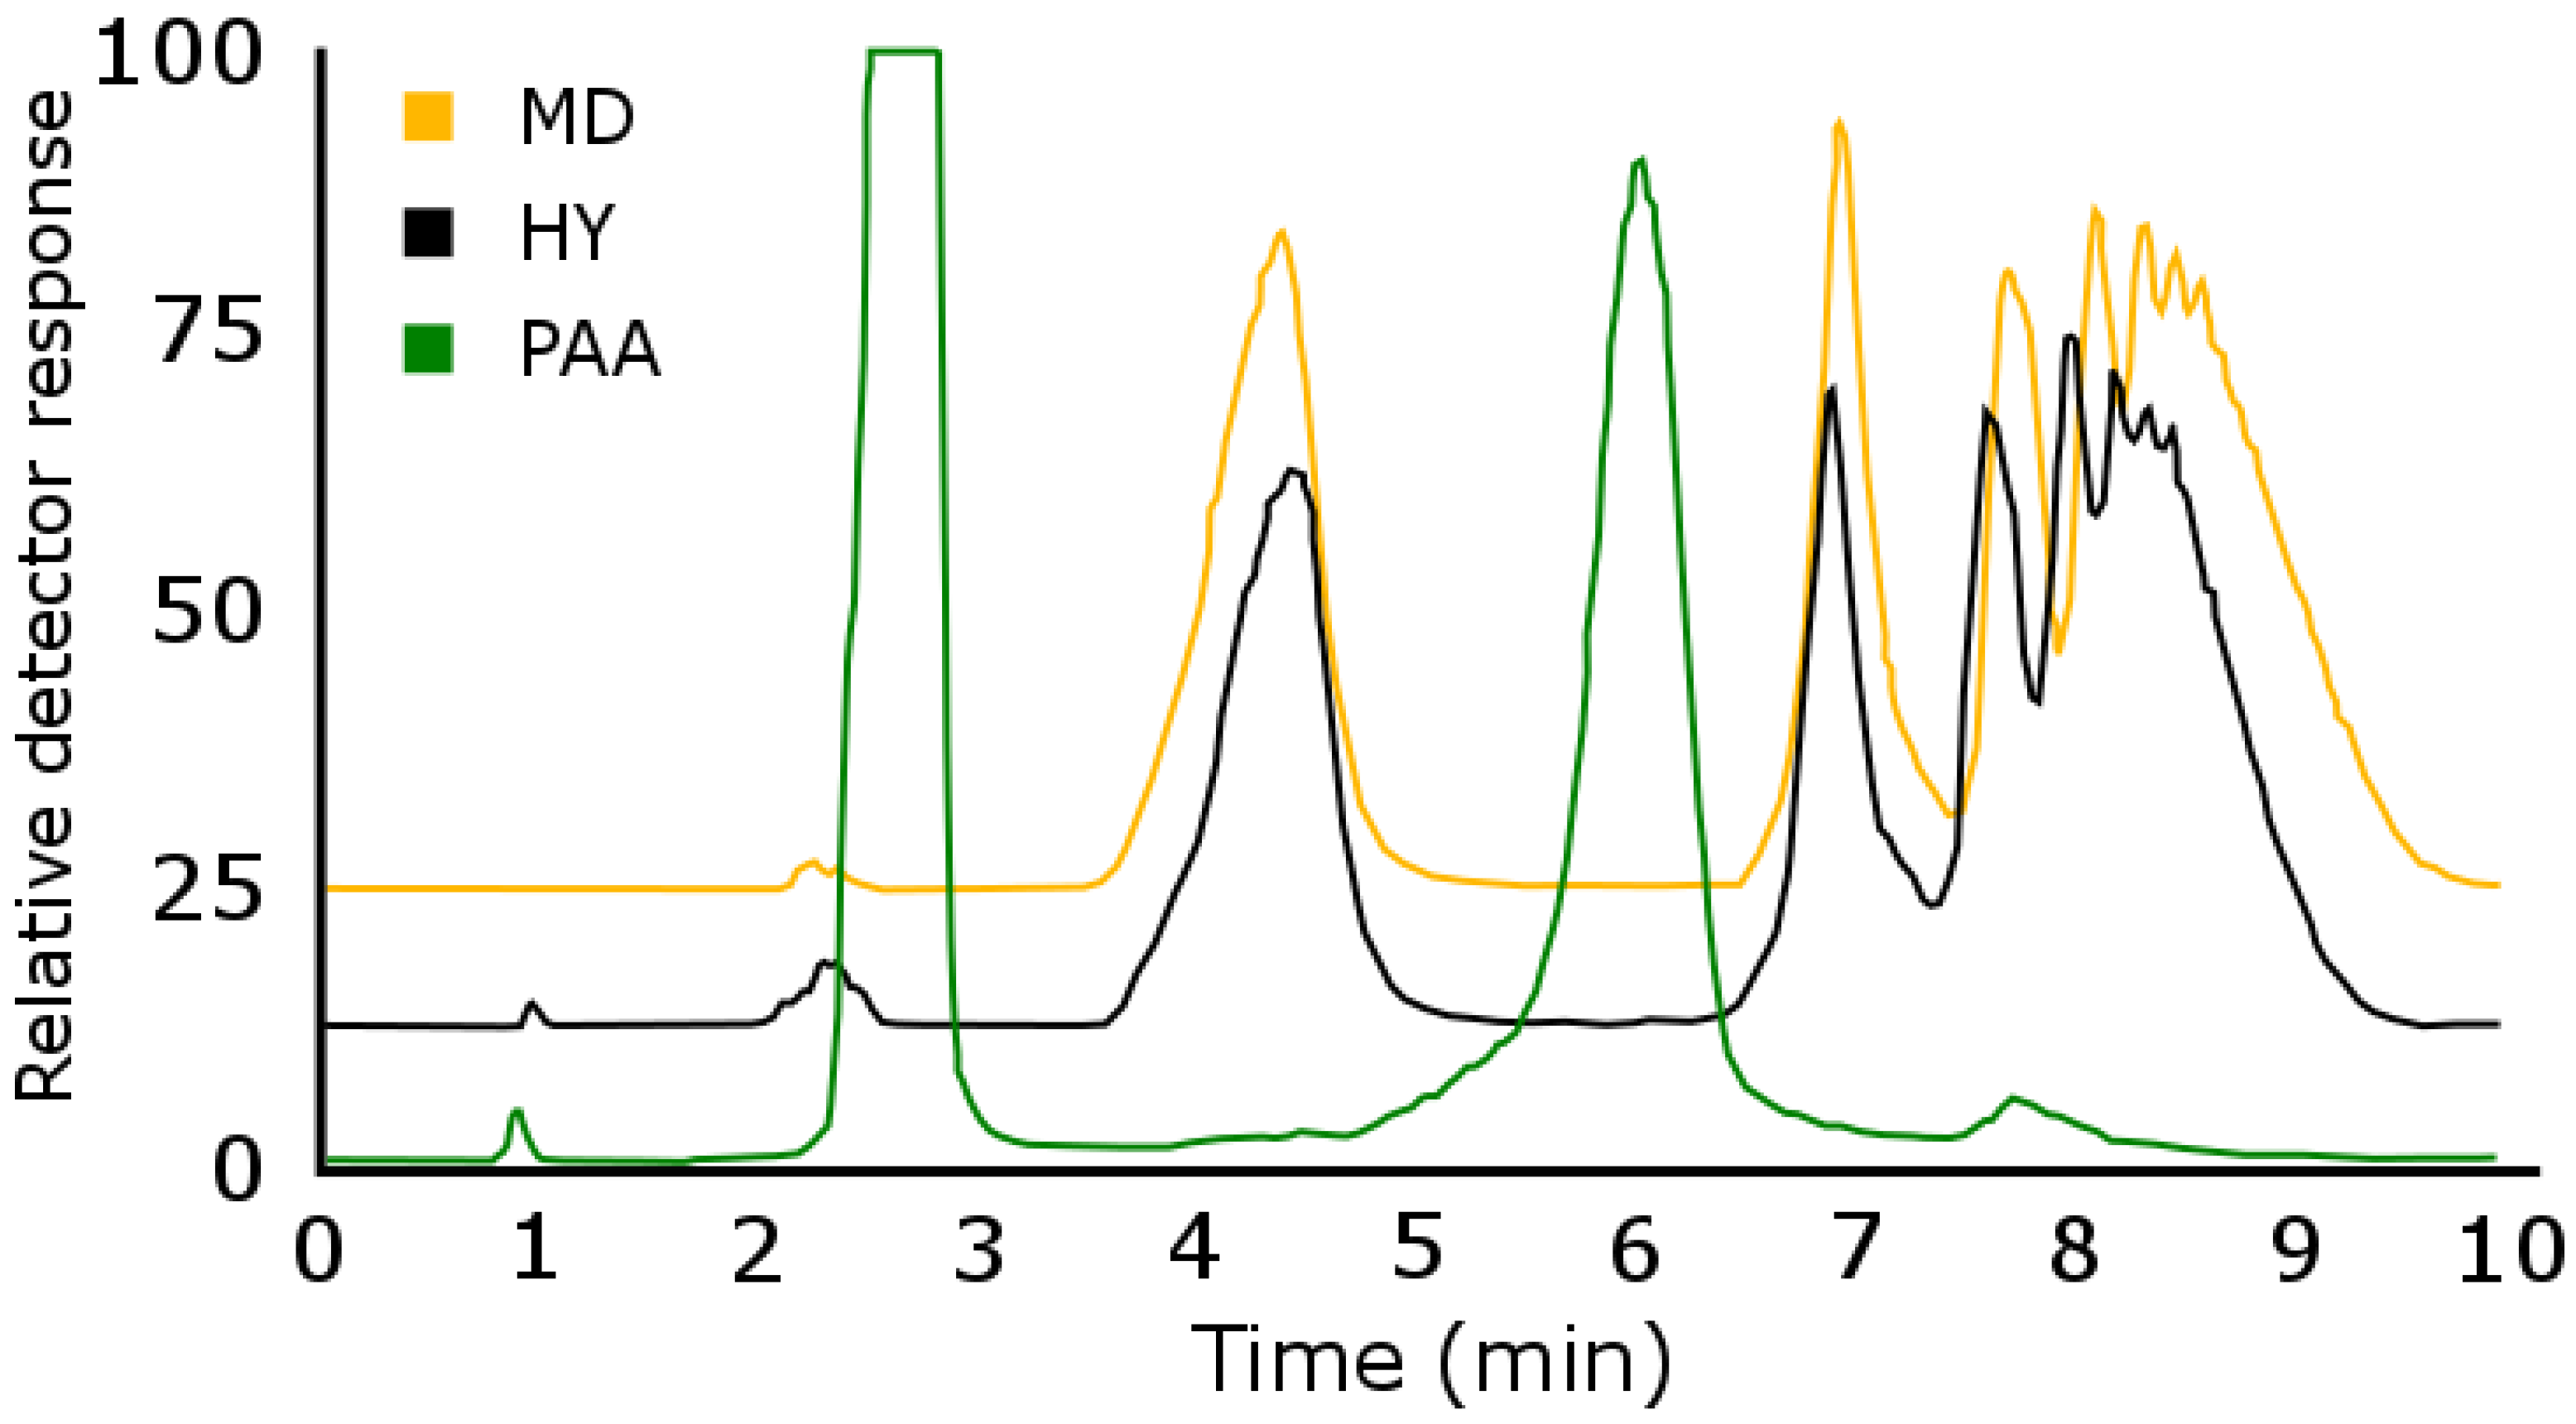
In this work, a bare-silica HILIC column was intended as a 1D column in combination with a 2D RPLC column, to take advantage of complementary selectivities. With an eye on LC × LC separation, injections were made with higher than usual analyte concentrations (i.e., 8.5 mg/mL, 2 μL injection volume). The resulting chromatograms can be seen in Figure 6.
In the PAA and HY samples, a small peak was visible before t0 at about 1 min. This peak was believed to represent excluded salts used in PAA polymerization. Therefore, it was not present in the MD sample. The t0 peak (2.2 min) is believed to represent unretained additives. The monomer, eluting at just over 4 min (see Figure S8 in Supplementary Material), was baseline separated from the polymeric part of the sample (eluting between 6.5 and 9.5 min). These latter signals revealed some separation for the low-MW oligomers, but little separation for the higher-MW polymers. The PAA chromatogram showed a small excluded salt peak around 1 min, a large peak at 2.7 min and a peak at 6 min. The peak at 2.7 min was a breakthrough peak and it contained the bulk of the injected PAA. The peak at 6 min represented retained PAA. Part of the injected analyte would continuously fall behind the injection solvent plug as it was diluted while migrating through the chromatographic column. Therefore, no baseline separation was achieved between the breakthrough peak close to t0 and the retained peak for PAA (eluting mainly between 5 and 6.5 min). For a detailed explanation of the breakthrough phenomenon, the reader is directed to [7]. The difference between the chromatograms obtained for the MD and PAA samples showed that HILIC could allow differentiation between the bulk of the MD and the PAA. The retained PAA peak did not overlap with the MD signals, suggesting that a good chromatographic separation is possible if breakthrough can be avoided. The breakthrough peak of PAA also shows little overlap with the MD signals under the present conditions. However, the breakthrough peak fundamentally lacks precision and is sensitive to interferences, which jeopardizes quantitative analysis. The HY chromatogram is similar to that of the MD and not to PAA. The absence of both breakthrough for MD and a retained PAA peak suggests that the hybrid either overlaps with any excess MD, has different retention behaviour from the free PAA, or is otherwise not detected. If there is any free PAA in the HY sample, then it would be expected to show up as a breakthrough peak (t0) or a retained PAA peak (5–6.5 min). Neither is observed. There is a slight increase in the intensity of the t0 peak of the HY sample compared to that of the MD sample, but there is no evidence for ascribing this to free PAA. The separation of Figure 6 suggests that a separation of PAA and MD on HILIC is orthogonal to RPLC, making it an interesting candidate for LC × LC. In contrast to aq-SEC, solvent incompatibility issues must be addressed to realize such a coupling.

3.2. LC × LC Separations

3.2.1. Aqueous-SEC × RPLC

The combination of aq-SEC and RPLC was considered to be of interest due to the expectation that the hybrid polymer would have a higher molecular weight than either the PAA or the MD separately, as it is a combination of the two. The coupling between the two columns is nearly ideal, since the aq-SEC eluent is a weak injection solvent for the 2D separation. The area of interest in the aq-SEC chromatogram is the high-molecular-weight region, where the hybrid polymer is expected to elute (Figure 2).
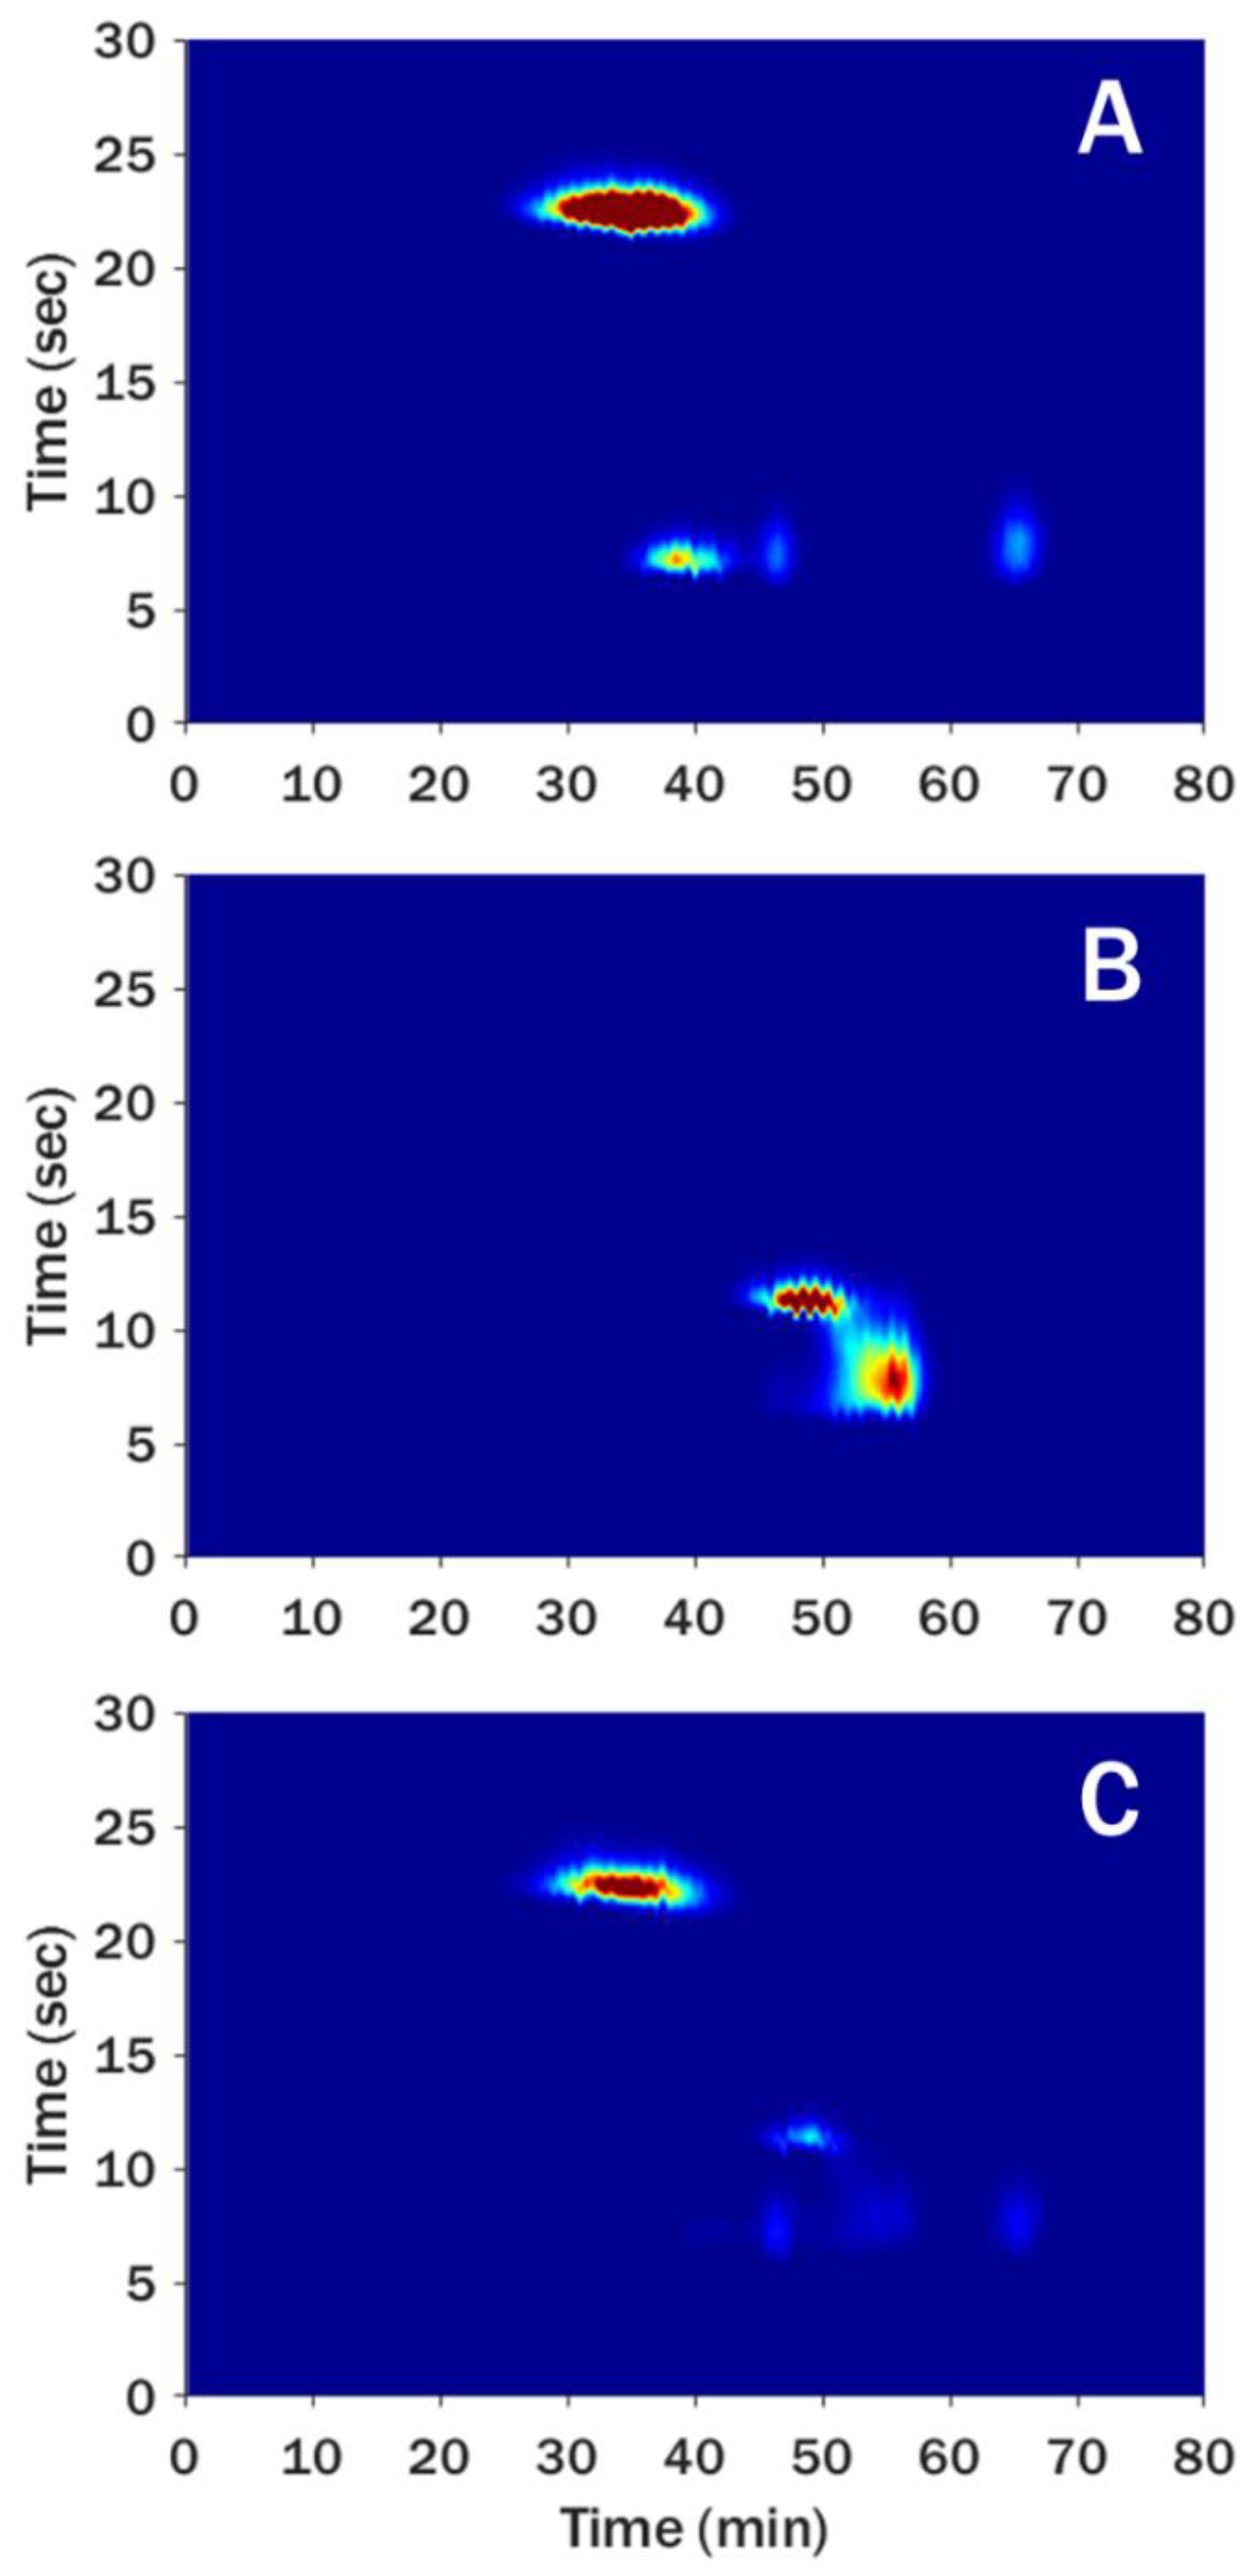
Figure 7 shows aq-SEC × RPLC chromatograms obtained for PAA (Figure 7A), MD (Figure 7B) and the hybrid polymer (Figure 7C). The main PAA peak in Figure 7A elutes first from the SEC column (around 30–40 min), indicating a relatively high molecular weight. This peak is strongly retained in the second (RPLC) dimension. There is no breakthrough of this peak because of the weak injection solvent (as supported by Figure 4). The other signals (lower molecular weight, unretained in RPLC) represent additives in the PAA, including the salt that was also observed in one-dimensional RPLC (Figure 3 and Figure 5). The aq-SEC × RPLC chromatogram of MD (Figure 7B) shows two signals, both with a relatively low molecular weight, with the larger molecules being slightly more retained in the (vertical) RPLC direction. In the chromatogram of the HY sample (Figure 7C) only a small fraction of unreacted MD can be discerned. The majority of the sample is found to be of a high molecular weight, indicating that most of the MD has reacted, presumably with PAA to form the hybrid polymer. However, the resolution of this LC × LC separation was not sufficient to distinguish between the hybrid polymer (Figure 7C) and the unreacted PAA (Figure 7A). Perhaps this is due to the low 1D flow rate in the SEC elution window, which was necessary to achieve a sufficiently high modulation frequency to avoid undersampling. Because aq-SEC × RPLC did not provide conclusive evidence, HILIC × RPLC was attempted.

3.2.2. HILIC × RPLC

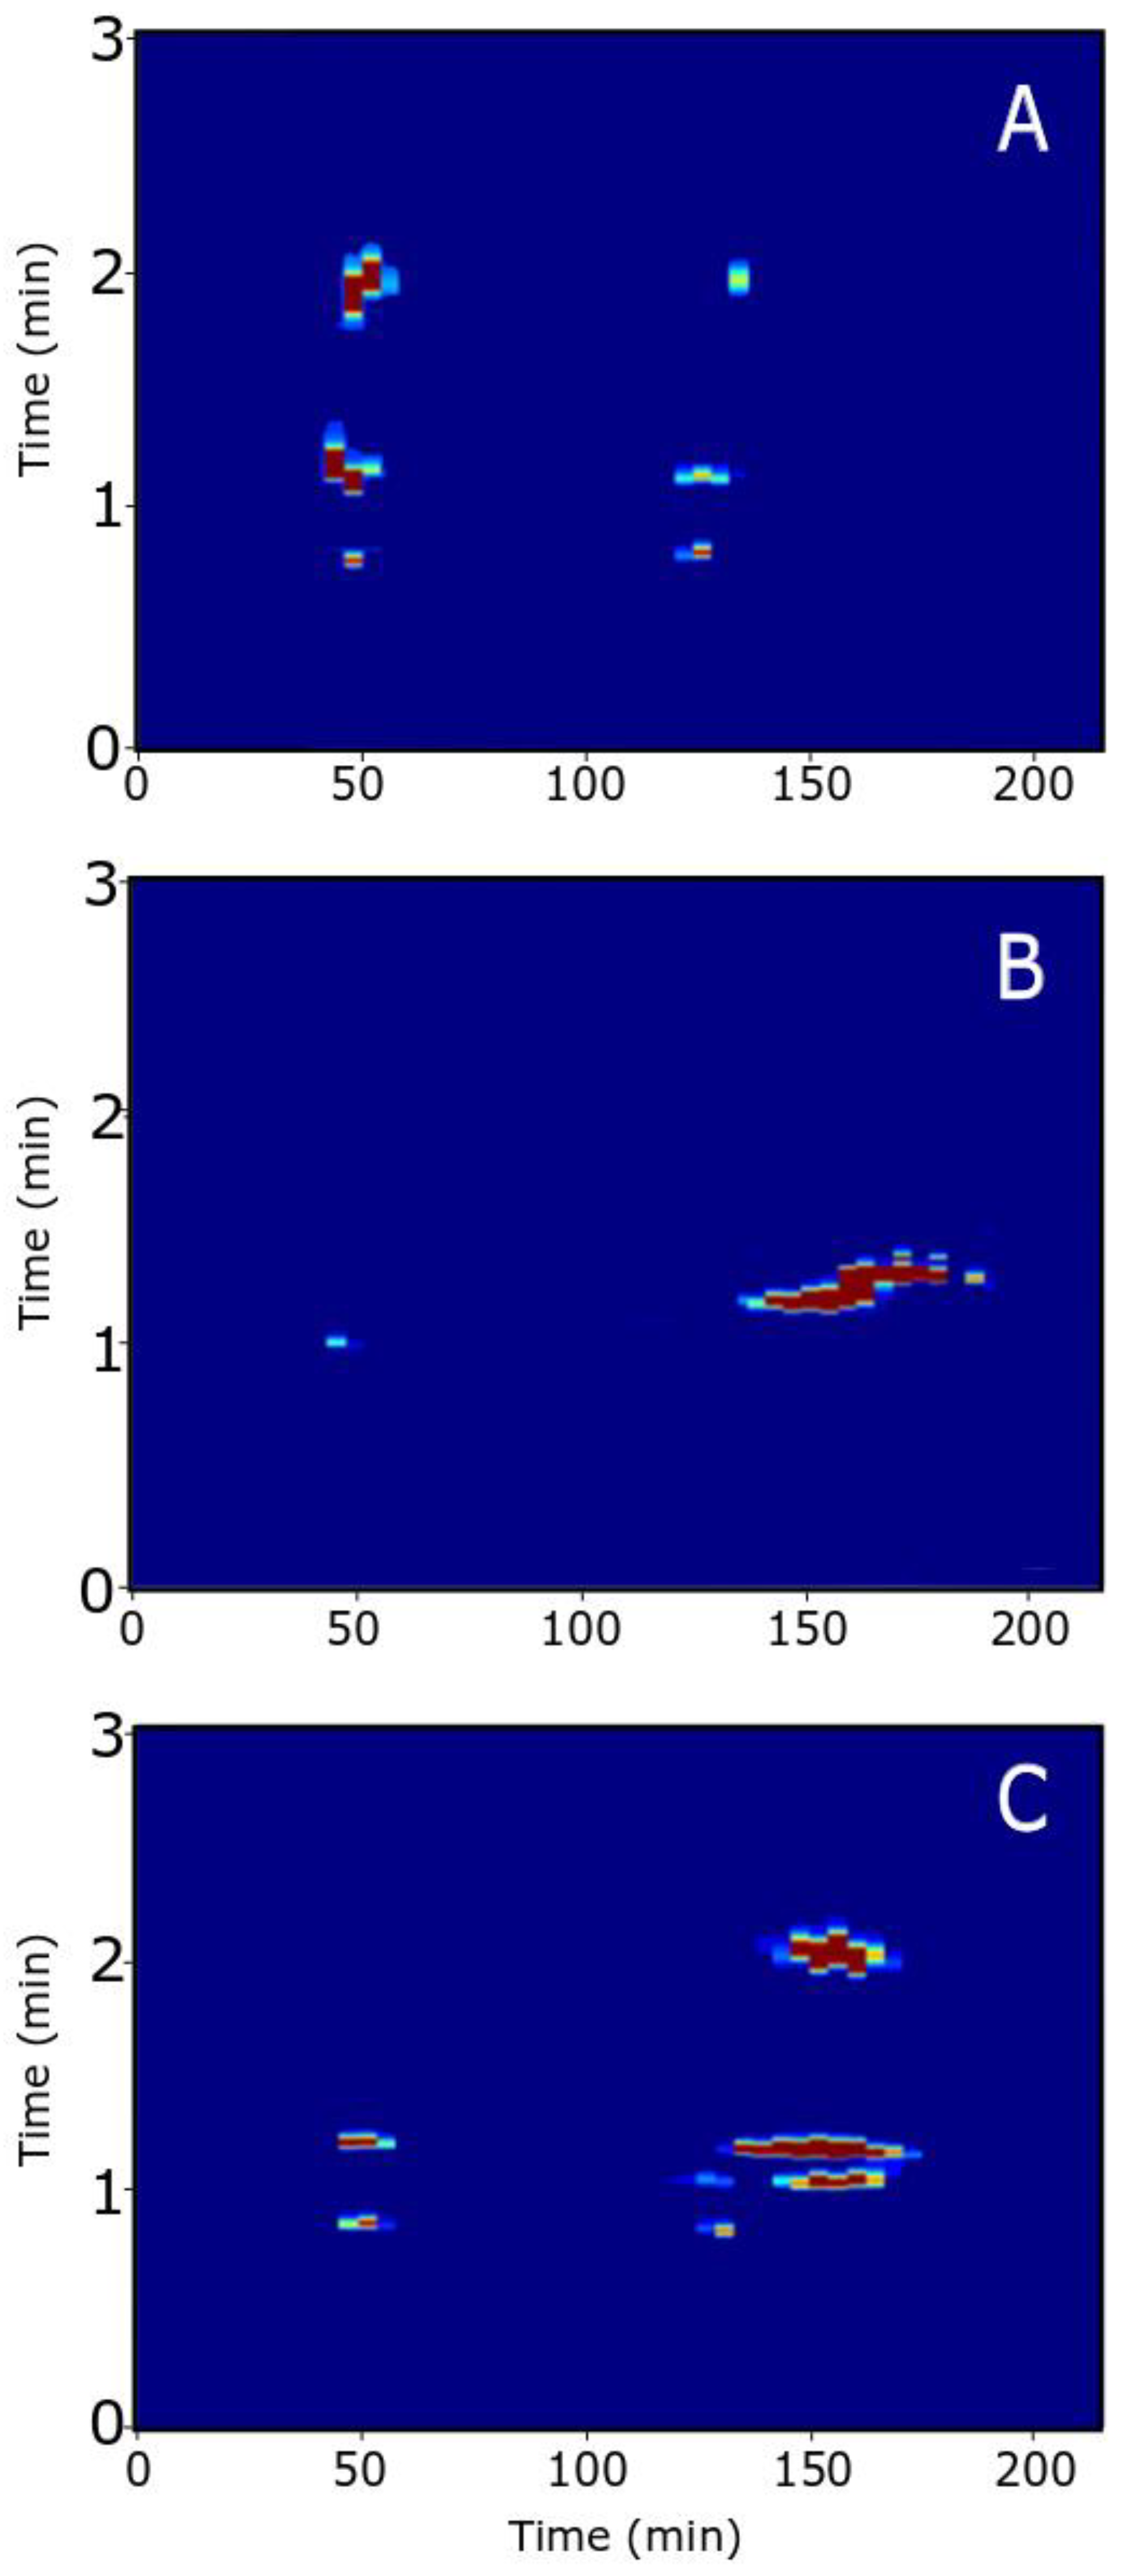
The selectivity of HILIC and RPLC is considered orthogonal for various types of analytes, and HILIC × RPLC has been the second-most-published column combination for LC × LC in recent years [2]. Few of those publications critically consider the solvent incompatibility arising from injecting the 1D effluent into the 2D system [24]. For polymers, however, HILIC × RPLC is less frequently employed. Montero et al. [25] used such a combination for polyphenolic compounds and Groeneveld et al. utilized HILIC × RPLC effectively for polyether polyols, while critically evaluating breakthrough effects [26]. In the case of a PAA-MD hybrid polymer, the coupling of these mechanisms leads to breakthrough of various components of the sample, as is seen in the HILIC × RPLC chromatograms of Figure 8. PAA showed breakthrough in 1D HILIC (Figure 6) and this is also seen in Figure 8A. The injection of the PAA reference sample results in a signal split up in two groups in the horizontal (HILIC) direction, i.e., a retained group of peaks around 130 min and a (more intense) group of peaks due to breakthrough around 50 min. The patterns of the peaks in the vertical direction (RPLC) are identical, with signals around 0.8 (excluded salts), 1.0 (t0, indicative of breakthrough) and 2 min (PAA). All the peaks around 50 min are aligned vertically, which again suggests this is a breakthrough peak. There is some selectivity in the horizontal direction among the retained peaks around 130 min.
The conditions of the first-dimension HILIC gradient (90% to 4% ACN from 0 to 50 min) cause the 1D effluent to be a very strong 2D injection solvent, causing breakthrough also in the 2D RPLC separation. This is in line with the effects of the injection solvent described in Section 3.1.2.
The unreacted MD (Figure 8B) shows expected behaviour, i.e., retention in the horizontal (HILIC) dimension, eluting from about 130 to about 180 min, and mostly unretained in the RPLC dimension (5% ACN to 30% in, 1 to 1.5 min). There is a slight difference in retention between the early-eluting MD (140–160 min) and the later fractions (160–180 min) in the RPLC dimension. Off-line MS analysis revealed a molecular-weight difference between these fractions (Supplementary Material, Figure S3), with the high-molecular-weight part eluting later in both HILIC and RPLC. Despite the various challenges associated with the HILIC × RPLC separation, a chromatogram of the potential hybrid polymer showed interesting features (Figure 8C). One peak present in the hybrid sample showed significant retention in both the HILIC and RPLC dimensions (150 and 2 min, respectively), suggesting the presence of the sought-after hybrid polymer. Hybrid moieties appeared to overlap with MD in the HILIC dimension. The separation of the hybrid is supported by the IR analysis of the collected fractions (Supplementary Material, Figure S2), with this particular peak showing both MD- and PAA-related absorption bands. A comparison between the chromatograms of PAA (A) and HY (C) in Figure 8 revealed that the intensity of the PAA t0 breakthrough peak (retention time about 50 min) is lower in the HY sample than in the PAA standard (Figure 8A). This suggested that the PAA had reacted to form the hybrid.
The coupling of HILIC and RPLC seemed to suffice to prove the existence of the hybrid polymer. However, the extent of breakthrough suffered when coupling these two retention mechanisms in the present set-up rendered quantification impossible. An overlay of the HILIC × RPLC chromatograms of PAA, MD, and HY can be seen in Supplementary Material (Figure S9).

4. Conclusions

In this work, we explored how information on a complex sample may be gained from a combination of comprehensive two-dimensional liquid-chromatography techniques. To separate a hybrid-polymer product from residual starting materials and other compounds present (maltodextrin, poly(acrylic acid) and additives), a suitable chromatographic system should be able to retain the hybrid polymer more or less than other components. Since no one-dimensional phase system was found suitable to separate the hybrid polymer from all other constituents, LC × LC separations were attempted, whereby one dimension should separate the hybrid polymer from free PAA and the other dimension should separate it from MD. Column scouting yielded five columns that showed promising retention properties for the sample and these were coupled to form three different LC × LC separation systems. The chromatographic consequences of phase-system incompatibility are numerous when considered in the context of LC × LC, as has been described in detail elsewhere [27]. However, even sub-optimal column combinations may provide analytically relevant separations when the two different selectivities match the sample dimensions. Together, the combinations of aqueous size-exclusion chromatography with reversed-phase liquid chromatography (aq-SEC × RPLC) and hydrophilic-interaction liquid chromatography with RPLC (HILIC × RPLC) provided the success of a grafting reaction. The latter combination proved most informative. However, severe breakthrough effects were observed in both dimensions, which impeded quantitative analysis. While aq-SEC × RPLC and alternative, more-compatible combinations, such as ion-exchange chromatography (IEX) coupled with RPLC, may yield fewer chromatographic artefacts, they have less potential to provide information on the constituents forming the hybrid than HILIC × RPLC.
There are several opportunities for future work in the development of an LC × LC setup for the analysis of PAA-MD polymer hybrids. The combination of a porous-graphitic carbon (PGC) stationary phase with a conventional RPLC on a C18 column (see the Supplementary Material Section S3.2) may be useful if conditions can be found to elute PAA from the column in a repeatable manner. In recent work, Wach et al. presented separations on a zeolite column with water as a mobile phase, showing interesting retention properties [28]. Such a separation, combined with RPLC, may achieve the desired separation of PAA-MD hybrid polymers from its reactants. Modulation in LC × LC is an active area of research and for the analysis presented here, 2D breakthrough may possibly be prevented by active-modulation techniques, such as the addition of a weak solvent (with adequate mixing) at the modulation stage, known as active-solvent modulation (ASM, [29]), the use of trapping columns in the modulator, known as stationary-phase assisted modulation (SPAM, [30]) or in-column focusing (ICF, [27]). The ASM modulation of PAA for a RPLC 2D has recently been demonstrated in a pseudo-comprehensive approach [18]. In the case of the LC × LC (HILIC × RPLC) of PAA-MD hybrids, small mixing volumes or a dedicated solvent-mixing device between separation dimensions could be used to mitigate or even prevent breakthrough effects in the LC × LC (HILIC × RPLC) of PAA-MD hybrids [29,31].

Supplementary Materials

The following are available online at https://www.mdpi.com/2297-8739/7/3/41/s1, Figure S1: Fractionation windows of EPS RPLC separations, Figure S2: Comparison of FR-IR spectra, Figure S3: Comparison between MS spectra, Figure S4: MS spectrum of a retained peak in RPLC, Figure S5: MS spectrum recorded from a retained peak in RPLC, Figure S6: PGC chromatogram, Figure S7: PGC × RPLC analysis, Figure S8: HILIC chromatogram, Figure S9: An overlay of HILIC × RPLC. Table S1: List of detected and assigned mass fragments to MD and PAA series. Section S3.1: Porous graphitic carbon (PGC) as a stationary phase. Section S3.2: PGC × RPLC.

Author Contributions

Conceptualization, J.P., Y.M. and P.J.S.; Investigation, H.C.v.d.V. and G.G.; Methodology, H.C.v.d.V., J.P., G.G., A.F.G.G. and S.v.d.W.; Project administration, Y.M. and P.J.S.; Resources, J.P.; Supervision, A.F.G.G., S.v.d.W., Y.M. and P.J.S.; Validation, H.C.v.d.V., G.G. and A.F.G.G.; Visualization, H.C.v.d.V.; Writing—original draft, H.C.v.d.V.; Writing—review & editing, H.C.v.d.V., J.P., T.S.B., A.F.G.G., S.v.d.W. and P.J.S. All authors have read and agreed to the published version of the manuscript.

Funding

This research received funding from The Netherlands Organization for Scientific Research (NWO) in the framework of the Technology Area COAST program (HYPERformance LC project; 053.21.102). A.F.G. Gargano acknowledges the NWO-VENI grant (722.015.009) for the IPA project.

Acknowledgments

The authors acknowledge G.R Hilton and J.W. van Velde for MS measurements, J. Swart for FTIR measurements and A. Swaneveld for experiments on breakthrough in RPLC.

Conflicts of Interest

The authors declare no conflict of interest.

References

  1. Giddings, J. Sample dimensionality: A predictor of order-disorder in component peak distribution in multidimensional separation. J. Chromatogr. A 1995, 703, 3–15. [Google Scholar] [CrossRef]
  2. Pirok, B.W.; Stoll, D.R.; Schoenmakers, P.J. Recent developments in two-dimensional liquid chromatography: Fundamental improvements for practical applications. Anal. Chem. 2018, 91, 240–263. [Google Scholar] [CrossRef] [PubMed] [Green Version]
  3. Pirok, B.W.; Gargano, A.; Schoenmakers, P.J. Optimizing separations in online comprehensive two-dimensional liquid chromatography. J. Sep. Sci. 2017, 41, 68–98. [Google Scholar] [CrossRef] [Green Version]
  4. Pirok, B.W.; Pous-Torres, S.; Ortiz-Bolsico, C.; Vivó-Truyols, G.; Schoenmakers, P. Program for the interpretive optimization of two-dimensional resolution. J. Chromatogr. A 2016, 1450, 29–37. [Google Scholar] [CrossRef]
  5. Groeneveld, G.; Pirok, B.W.J.; Schoenmakers, P. Perspectives on the future of multi-dimensional platforms. Faraday Discuss. 2019, 218, 72–100. [Google Scholar] [CrossRef]
  6. Schure, M.R.; Davis, J.M. Orthogonal separations: Comparison of orthogonality metrics by statistical analysis. J. Chromatogr. A 2015, 1414, 60–76. [Google Scholar] [CrossRef]
  7. Jiang, X.; Van Der Horst, A.; Schoenmakers, P. Breakthrough of polymers in interactive liquid chromatography. J. Chromatogr. A 2002, 982, 55–68. [Google Scholar] [CrossRef]
  8. Moreno, F.J.; Montilla, A.; Villamiel, M.; Corzo, N.; Olano, A. Analysis, structural characterization, and bioactivity of oligosaccharides derived from lactose. Electrophoresis 2014, 35, 1519–1534. [Google Scholar] [CrossRef] [Green Version]
  9. Nagy, G.; Peng, T.; Pohl, N.L.B. Recent liquid chromatographic approaches and developments for the separation and purification of carbohydrates. Anal. Methods 2017, 9, 3579–3593. [Google Scholar] [CrossRef] [Green Version]
  10. Ortiz, A.M.; Matute, A.I.R.; Sanz, M.L.; Moreno, F.J.; Herrero, M. Separation of di- and trisaccharide mixtures by comprehensive two-dimensional liquid chromatography. Application to prebiotic oligosaccharides. Anal. Chim. Acta 2019, 1060, 125–132. [Google Scholar] [CrossRef] [Green Version]
  11. Al Samman, M.; Radke, W.; Khalyavina, A.; Lederer, A. Retention behavior of linear, branched, and hyperbranched polyesters in interaction liquid chromatography. Macromolecules 2010, 43, 3215–3220. [Google Scholar] [CrossRef]
  12. Loiseau, J.; Doerr, N.; Suau, J.M.; Egraz, J.B.; Llauro, M.F.; Ladavière, C.; Claverie, J.P. Synthesis and characterization of poly(acrylic acid) produced by raft polymerization. application as a very efficient dispersant of CaCO3, kaolin, and TiO2. Macromolecules 2003, 36, 3066–3077. [Google Scholar] [CrossRef]
  13. Viktor, Z.; Farcet, C.; Moire, C.; Brothier, F.; Pfukwa, H.; Pasch, H. Comprehensive two-dimensional liquid chromatography for the characterization of acrylate-modified hyaluronic acid. Anal. Bioanal. Chem. 2019, 411, 3321–3330. [Google Scholar] [CrossRef]
  14. Gaborieau, M.; Castignolles, P. Size-exclusion chromatography (SEC) of branched polymers and polysaccharides. Anal. Bioanal. Chem. 2010, 399, 1413–1423. [Google Scholar] [CrossRef] [PubMed] [Green Version]
  15. Wu, F.; Dong, K.; Zhu, M.; Zhang, Q.; Xie, B.; Li, D.; Gan, H.; Linhardt, R.J.; Zhang, Z. Development of a method to analyze the complexes of enoxaparin and platelet factor 4 with size-exclusion chromatography. J. Pharm. Biomed. Anal. 2019, 164, 668–671. [Google Scholar] [CrossRef]
  16. Ouyang, Y.; Zeng, Y.; Rong, Y.; Song, Y.; Shi, L.; Chen, B.; Yang, X.; Xu, N.; Linhardt, R.J.; Zhang, Z. Profiling analysis of low molecular weight heparins by multiple heart-cutting two dimensional chromatography with quadruple time-of-flight mass spectrometry. Anal. Chem. 2015, 87, 8957–8963. [Google Scholar] [CrossRef] [PubMed]
  17. Witono, J.R.; Marsman, J.; Noordergraaf, W.; Heeres, H.; Janssen, L.P.B.M. Improved homopolymer separation to enable the application of 1H NMR and HPLC for the determination of the reaction parameters of the graft copolymerization of acrylic acid onto starch. Carbohydr. Res. 2013, 370, 38–45. [Google Scholar] [CrossRef]
  18. Yang, P.; Gao, W.; Zhang, T.; Pursch, M.; Luong, J.; Sattler, W.; Singh, A.; Backer, S. Two-dimensional liquid chromatography with active solvent modulation for studying monomer incorporation in copolymer dispersants. J. Sep. Sci. 2019, 42, 2805–2815. [Google Scholar] [CrossRef]
  19. Stoll, D.R.; Talus, E.S.; Harmes, D.C.; Zhang, K. Evaluation of detection sensitivity in comprehensive two-dimensional liquid chromatography separations of an active pharmaceutical ingredient and its degradants. Anal. Bioanal. Chem. 2014, 407, 265–277. [Google Scholar] [CrossRef]
  20. Schmitz, S.; Dona, A.C.; Castignolles, P.; Gilbert, R.G.; Gaborieau, M. Assessment of the extent of starch dissolution in dimethyl sulfoxide by1H NMR spectroscopy. Macromol. Biosci. 2009, 9, 506–514. [Google Scholar] [CrossRef]
  21. Potts, L.W.; Stoll, D.R.; Li, X.; Carr, P.W. The impact of sampling time on peak capacity and analysis speed in on-line comprehensive two-dimensional liquid chromatography. J. Chromatogr. A 2010, 1217, 5700–5709. [Google Scholar] [CrossRef] [PubMed] [Green Version]
  22. Li, L.; Zhang, F.; Zaia, J.; Linhardt, R.J. Top-down approach for the direct characterization of low molecular weight heparins using LC-FT-MS. Anal. Chem. 2012, 84, 8822–8829. [Google Scholar] [CrossRef] [PubMed] [Green Version]
  23. Li, G.; Steppich, J.; Wang, Z.; Sun, Y.; Xue, C.; Linhardt, R.J.; Li, L. Bottom-up low molecular weight heparin analysis using liquid chromatography-fourier transform mass spectrometry for extensive characterization. Anal. Chem. 2014, 86, 6626–6632. [Google Scholar] [CrossRef] [PubMed]
  24. Montero, L.; Ibáñez, E.; Russo, M.; Rastrelli, L.; Cifuentes, A.; Herrero, M. Focusing and non-focusing modulation strategies for the improvement of on-line two-dimensional hydrophilic interaction chromatography × reversed phase profiling of complex food samples. Anal. Chim. Acta 2017, 985, 202–212. [Google Scholar] [CrossRef] [PubMed] [Green Version]
  25. Montero, L.; Sánchez-Camargo, A.P.; Garcia-Cañas, V.; Tanniou, A.; Stiger-Pouvreau, V.; Russo, M.; Rastrelli, L.; Cifuentes, A.; Herrero, M.; Ibáñez, E.; et al. Anti-proliferative activity and chemical characterization by comprehensive two-dimensional liquid chromatography coupled to mass spectrometry of phlorotannins from the brown macroalga Sargassum muticum collected on North-Atlantic coasts. J. Chromatogr. A 2016, 1428, 115–125. [Google Scholar] [CrossRef] [PubMed]
  26. Groeneveld, G.; Dunkle, M.N.; Rinken, M.; Gargano, A.; De Niet, A.; Pursch, M.; Mes, E.P.; Schoenmakers, P. Characterization of complex polyether polyols using comprehensive two-dimensional liquid chromatography hyphenated to high-resolution mass spectrometry. J. Chromatogr. A 2018, 1569, 128–138. [Google Scholar] [CrossRef]
  27. Van De Ven, H.; Gargano, A.; Van Der Wal, S.; Schoenmakers, P. Switching solvent and enhancing analyte concentrations in small effluent fractions using in-column focusing. J. Chromatogr. A 2016, 1427, 90–95. [Google Scholar] [CrossRef] [PubMed]
  28. Wach, W.; Fornefett, I.; Buttersack, C.; Buchholz, K. Adsorption and HPLC of carbohydrates and related hydroxy compounds on zeolites. Anal. Methods 2018, 10, 1817–1832. [Google Scholar] [CrossRef]
  29. Stoll, D.R.; Shoykhet, K.; Petersson, P.; Buckenmaier, S. Active solvent modulation: A Valve-based approach to improve separation compatibility in two-dimensional liquid chromatography. Anal. Chem. 2017, 89, 9260–9267. [Google Scholar] [CrossRef] [PubMed]
  30. Vonk, R.J.; Gargano, A.; Davydova, E.; Dekker, H.L.; Eeltink, S.; De Koning, L.J.; Schoenmakers, P. Comprehensive two-dimensional liquid chromatography with stationary-phase-assisted modulation coupled to high-resolution mass spectrometry applied to proteome analysis of saccharomyces cerevisiae. Anal. Chem. 2015, 87, 5387–5394. [Google Scholar] [CrossRef]
  31. Ianovska, M.A.; Mulder, P.P.M.F.A.; Verpoorte, E. Development of small-volume, microfluidic chaotic mixers for future application in two-dimensional liquid chromatography. RSC Adv. 2017, 7, 9090–9099. [Google Scholar] [CrossRef] [Green Version]
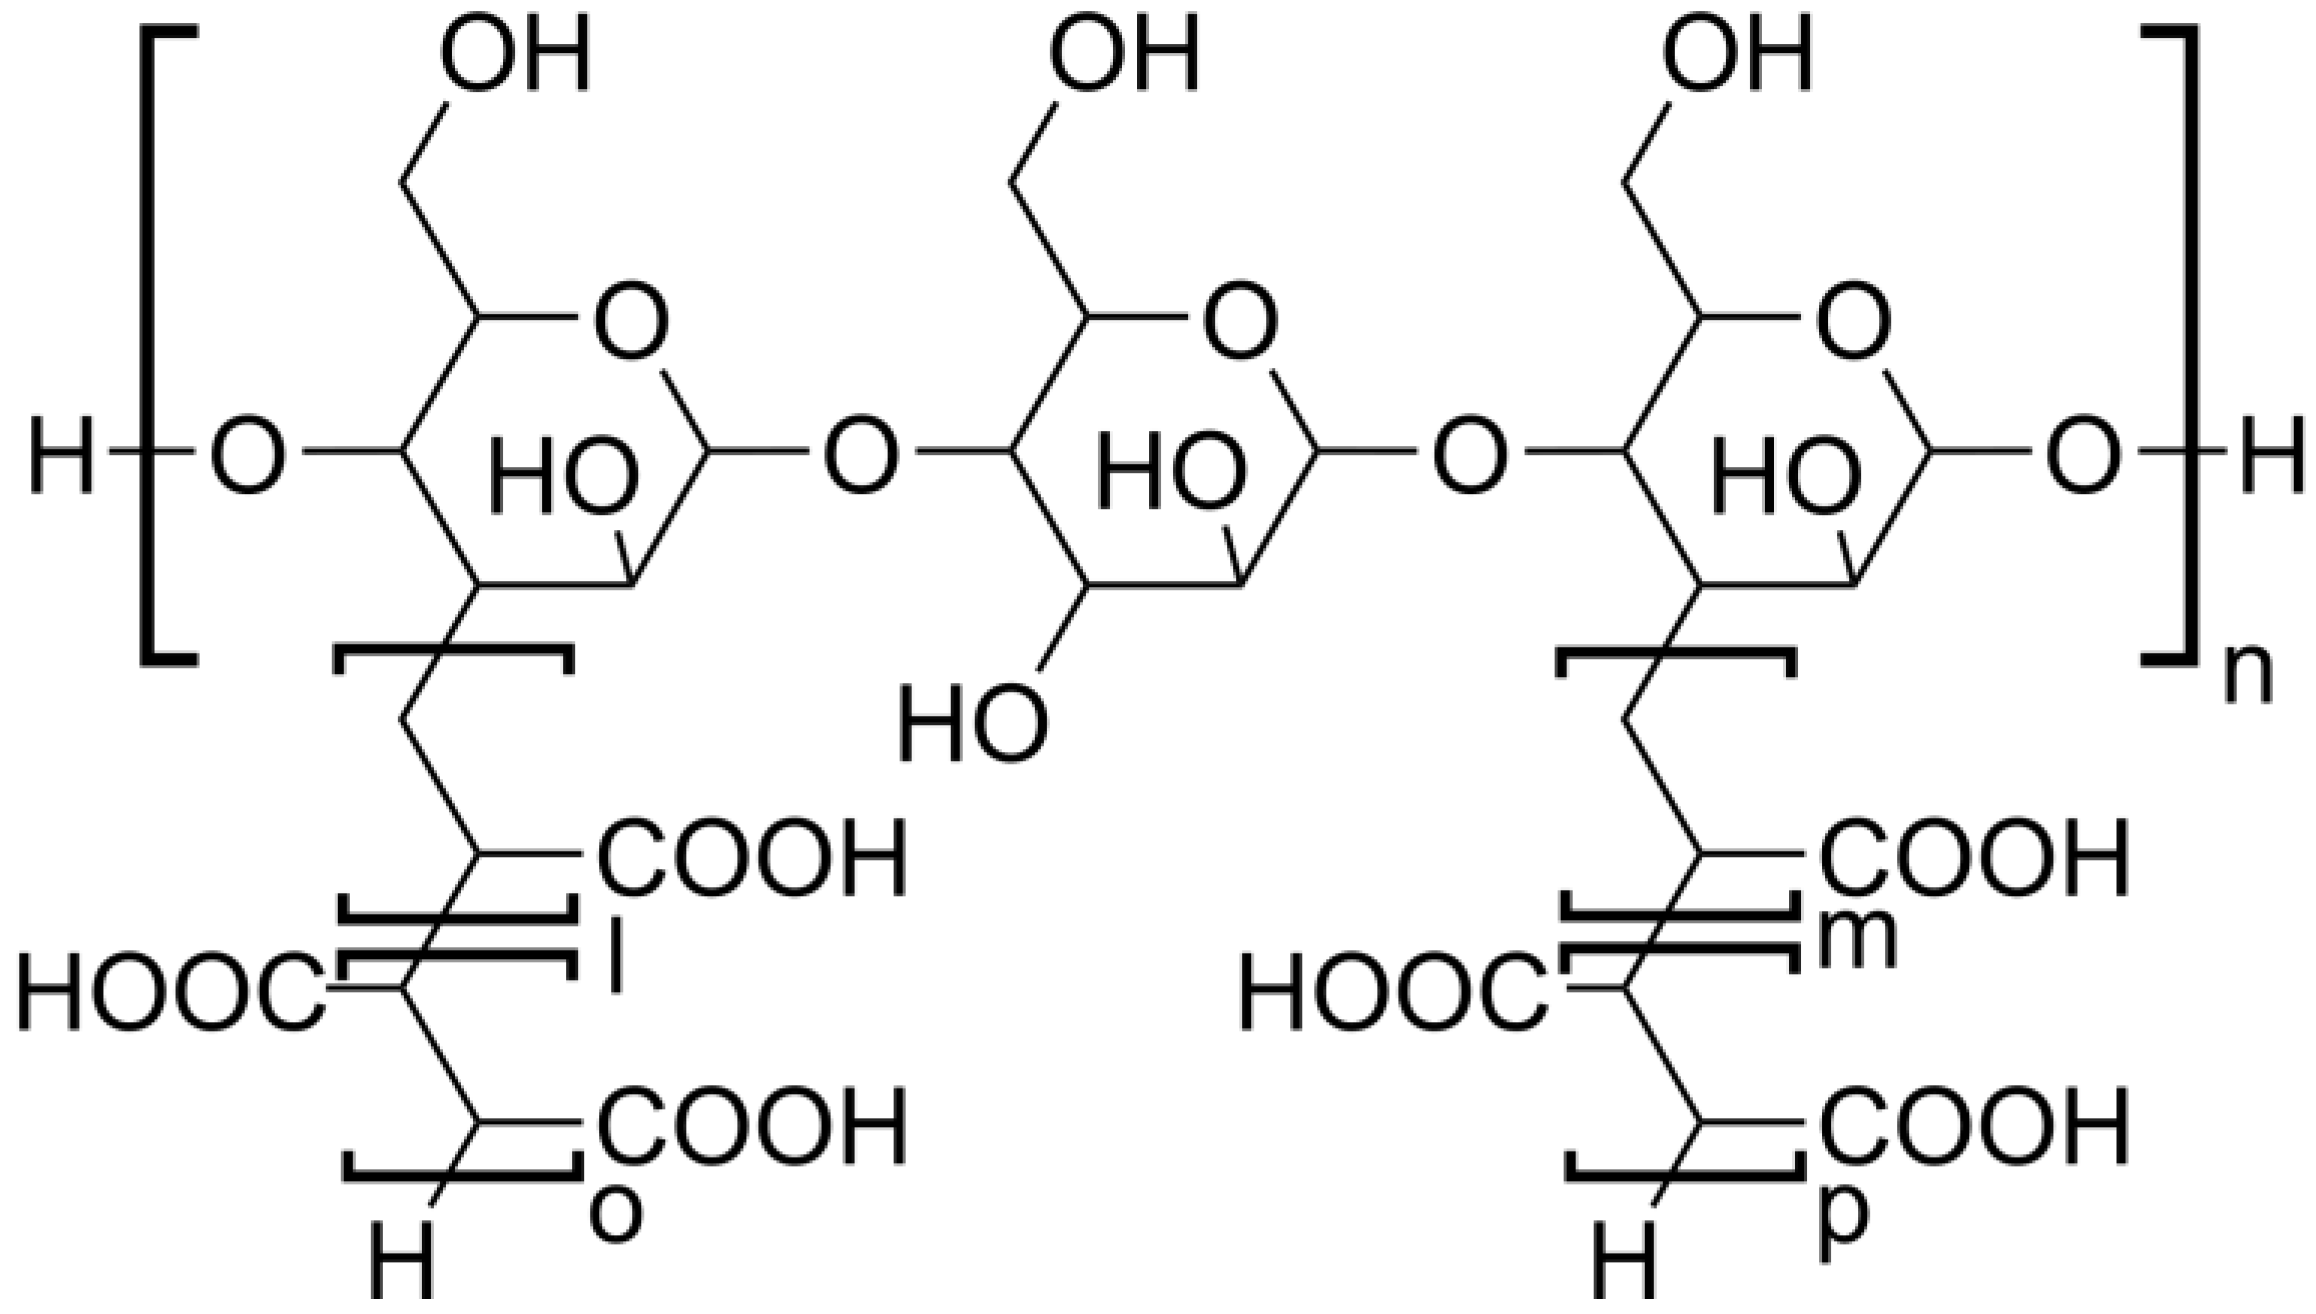
Figure 1. Possible structure of the poly(acrylic acid) chains with maltodextrin (PAA-MD) hybrid graft polymer resulting from radical polymerization. Units denoted l, m, n, o and p are of unknown lengths.
Separations 07 00041 g001
Figure 2. aq-SEC chromatograms of PAA, MD and hybrid polymer (HY) samples. A total of 20 µL of 10 mg/mL injection on a TSK-GEL GMPWxl column (300 × 7.8 mm i.d., 13 µm particles). Chromatograms were recorded at 1.0 mL/min flow rate, with a 0.05-M ammonium acetate buffer (pH 6) using refractive index (RI) detection. Chromatograms are shifted in the y-direction for clarity.
Separations 07 00041 g002
Figure 3. Overlay of Extended Polar Selectivity (EPS) Reversed-Phase Liquid Chromatography (RPLC) chromatograms of Na2(SO)4, HY, PAA and MD samples (1 mg/mL). Column: Platinum EPS C18 (250 × 4.6 mm i.d., 5-µm particles); mobile phase A: 100% H2O (0.1% FA); mobile phase B: 100% acetonitrile (ACN) (0.1% FA); flow rate: 2 mL/min; gradient: 3–30% B, (3 to 7 min); detection: evaporative light-scattering detector (ELSD). Chromatograms are shifted in the y-direction for clarity.
Separations 07 00041 g003
Figure 4. Breakthrough in EPS RPLC. PAA samples injected in different injection solvents. Analyte concentration: 0.0017 mg/mL; injection volume: 100 µL; platinum EPS C18 (250 × 4.6 mm i.d., 5-µm particles). Mobile phase A: 100% H2O (0.1% FA); mobile phase B: 100% ACN (0.1% FA); flow rate: 2 mL/min; gradient: 3–30% B, (3 to 7 min); ELSD detection. Chromatograms are shifted in the x and y directions for clarity.
Separations 07 00041 g004
Figure 5. Fast RPLC for 2D separation. Chromatograms of PAA, HY, and MD samples (5 µL of 1 mg/mL injection), obtained on a Titan C18 column (30 × 2.1 mm i.d., 1.9 μm particles). Mobile phase A: 100% H2O (0.1% FA); mobile phase B: 100% ACN (0.1% FA); flow rate: 0.4 mL/min; gradient: 4–30% B, (0.5 to 1 min); ELSD detection. Chromatograms are shifted in the y-direction for clarity.
Separations 07 00041 g005
Figure 6. HILIC separation of PAA, HY, and MD samples (2 µL injection, 8.5 mg/mL dissolved in 100% H2O, 0.1% FA), obtained on a HILIC Kinetex bare-silica column (150 × 4.6 i.d., 2.6 µm particles). Mobile phase A: 100% H2O (0.1% FA); mobile phase B: 100% ACN (0.1% FA); flow rate: 1 mL/min; gradient: 96–10% B, (1 to 8 min). ELSD detection. Chromatograms are shifted in the y-direction for clarity.
Separations 07 00041 g006
Figure 7. aq-SEC × RPLC analysis of (A) PAA, (B) MD, and (C) HY. 20 µL of 20 mg/mL injection dissolved in 100% H2O, 0.1% FA. 1D: SEC, TSK-GEL GMPWxl (300 × 7.8 mm i.d., 13 µm particles). Mobile phase: 0.5 mL/min ammonium acetate 0.05 M for 13 min, then the flow rate was lowered to 0.1 mL/min to allow for more frequent sampling of the 1D elution window. A total of 50 µL modulation loops. 2D: Titan C18 (30 × 2.1 mm i.d., 1.9 μm particles). Mobile phase A: 100% H2O (0.1% FA, 0.25% ACN); mobile phase B: 100% ACN (0.1% FA); flow rate: 1 mL/min; gradient: 4–30% B, (6 to 12 s). Detection: ELSD.
Separations 07 00041 g007
Figure 8. HILIC × RPLC chromatograms of (A) PAA, (B) MD, and (C) hybrid polymer (HY). (2 µL of 20 mg/mL injection dissolved in 100% H2O, 0.1% FA). 1D: HILIC Kinetex bare-silica column (150 × 4.6 mm i.d., 2.6-µm particles). Mobile phase A: 100% H2O (0.1% FA); mobile phase B: 100% ACN (0.1% FA) Flow rate 40 μL/min; gradient 90-4% B, (0 to 50 min), 120-μL loops. 2D: RPLC Platinum EPS column C18 (250 × 4.6 mm i.d., 5-µm particles). Mobile phase A: 100% H2O (0.1% FA); mobile phase B: 100% ACN (0.1% FA); flow rate: 4 mL/min; gradient: 5-30% B, (1 to 1.5 min). Detection: ELSD.
Separations 07 00041 g008