Article

Study of the Oxidative Forced Degradation of Glutathione in Its Nutraceutical Formulations Using Zone Fluidics and Green Liquid Chromatography

by
Apostolia Tsiasioti
1,
Constantinos K. Zacharis
2,
Anastasia-Stella Zotou
1 and
Paraskevas D. Tzanavaras
1,*
1
Laboratory of Analytical Chemistry, School of Chemistry, Faculty of Sciences, Aristotle University of Thessaloniki, 54124 Thessaloniki, Greece
2
Laboratory of Pharmaceutical Analysis, Department of Pharmaceutical Technology, School of Pharmacy, Aristotle University of Thessaloniki, 54124 Thessaloniki, Greece
*
Author to whom correspondence should be addressed.
Separations 2020, 7(1), 16; https://doi.org/10.3390/separations7010016
Submission received: 27 December 2019 / Revised: 4 February 2020 / Accepted: 19 February 2020 / Published: 3 March 2020
(This article belongs to the Special Issue Research as Development Perspective 2019)

Abstract

:
In the present study, we report the results of our investigation of the oxidative forced degradation of glutathione in its nutraceutical formulations by two validated analytical methods. The first is based on the reaction of glutathione with o-phthalaldehyde through an automated zone fluidics flow platform and fluorimetric detection (λex/λem = 340/425 nm). The second is based on the separation of glutathione and its oxidation product by a green reversed-phase HPLC method coupled to direct UV detection, at 210 nm. A solution of 3% w/v H2O2 provided fast oxidation of more than 95% of glutathione to yield oxidized glutathione in a time period of 180 min. The mechanism of the oxidation was proved to follow pseudo-first order kinetics. The k, t90 and t1/2 values were calculated.

1. Introduction

Forced degradation includes a group of actions that involves the intentional subjecting of drug products and active ingredients at conditions more severe than accelerated stability ones (hydrolysis, photolysis, thermal and oxidation). The goal is to generate degradation products that can lead to critical information about the stability of the molecule [1]. According to the ICH guidelines, stress testing is intended to identify the likely degradation products, which further helps in determining the intrinsic stability of the molecule and establishing degradation pathways, and also to validate the stability indicating procedures used [2]. Forced degradation is also useful for other purposes, such as formulation development (e.g., compatibility with excipients, production environment, etc.), packaging development and the design of the official stability studies.
One of the main chemical reactions that affects the stability of a drug is oxidation, which involves the removal of electrons from a molecule (or the addition of oxygen). Such reactions can typically be initiated by light, heat or certain trace metals. Despite the fact that oxidation is a rather common pathway for drug decomposition, it has not been investigated in the same extent compared to, e.g., hydrolysis, since specific actions can reduce its effect to acceptable levels (e.g., storage in the absence of light and oxygen, use of antioxidants in the formulation, etc.) [3].
The most commonly used oxidant agent in forced degradation studies is hydrogen peroxide (H2O2), while other oxidizing agents, such as metal ions, oxygen and radical initiators (e.g., azo-bis-isobutyronitrile), can also be used. The selection of the oxidizing agent, its concentration and the overall degradation conditions depend on the chemical properties of the examined drug substance. It has been reported that 0.1%–3.0% w/v hydrogen peroxide at neutral pH and room temperature could be adequate for the generation of relevant degradation products within a maximum period of seven days [4].
From an analytical chemistry point of view, an effective step for the determination of glutathione (GSH) seems to be derivatization by using a suitable reagent through either the –NH2 or the –SH moieties [5]. Derivatization of GSH does not only enhance its detectability (UV-Vis or fluorescence), but it also stabilizes the analyte and improves its chromatographic behavior under reversed-phase conditions. Among others, o-phthalaldehyde (OPA) seems to be an advantageous derivatization reagent since it reacts fast and selectively with GSH to form a fluorescent tricyclic derivative, under mild conditions, and it is commercially available at a low purchase cost [6]. Alternatively, derivatization can be avoided by direct detection of GSH at the low UV region (λ = 200–220 nm) combined with a suitable separation technique. The latter, although more simple and straightforward, approach is considerably less sensitive; it is not viable when complicated samples have to be processed in terms of matrix interferences [7].
The objectives of the present report was to subject glutathione (GSH)-containing nutraceuticals in oxidation forced degradation studies, including the investigation of the oxidation kinetics by two newly developed and validated analytical methods: (i) an automated flow method that is based on the reaction of GSH with (OPA) under zone fluidics (ZF) conditions [8]; and (ii) a simple and green HPLC-UV method that utilizes a 100% aqueous mobile phase by using a specialized reversed-phase column [9]. GSH available nutraceutical formulations were selected for this purpose since (i) GSH is the principal low-molecular-weight thiol in most cells [10]; (ii) GSH has high antioxidant properties and protects cells against oxidative stress; (iii) low GSH concentrations have been connected to various pathological conditions, ranging from diabetes to Parkinson’s disease [11]; and (iv) it is a rather unstable compound that it is easily oxidized through its –SH group to form the di-sulfide analogue (oxidized GSH or GSSG). From a structural point of view, GSH has different functional groups that undergo acid–base reactions (pK1 = 2.12 (–COOH), pK2 = 3.59 (–COOH), pK3 = 8.75 (–NH2), pK4 = 9.65 (–SH) [12], and due to the presence of metal-binding functional groups, it is an effective ligand for many metal ions [13].

2. Materials and Methods

2.1. Instrumentation

The zone fluidics (ZF) instrumentation consisted of a peristaltic pump (Minipuls3, Gilson, Middleton, WI, USA), a micro-electrically actuated 10-port valve (Valco, Ontario, Canada) and a flow-through spectrofluorimetric detector (RF-551, Shimadzu, Kyoto, Japan). All necessary connections of the flow configuration were made of PTFE tubing (0.5 or 0.7 mm i.d.). Programming and control of the ZF system were performed through a LabVIEW (National Instruments®, Austin, TX, USA) based program developed in-house. Data acquisition was carried out through the Clarity® software (version 4.0.3, DataApex, Prague, Czech Republic).
A Shimadzu HPLC system consisted of two LC-20AD high-pressure isocratic pumps, an SIL-20AC HT thermostated autosampler, a CTO-20AC thermostated column compartment and an SPD-20A PDA detector (Kyoto, Japan). The control of the instrument and the data handling were carried out via the LC Solutions (version 1.25 SP4) software. Detection was carried out at 210 nm. All separations were performed on an analytical column that was fully compatible with 100% aqueous mobile phases (Prevail® C18, 150 × 4.6 mm i.d., 5 μm, Alltech, Nicholasville, KY, USA).

2.2. Reagents and Solutions

Glutathione (GSH, Fluka, Munich, Germany), o-phthalaldehyde (OPA, Fluka), oxidized glutathione (GSSG, Fluka), ethylenediaminetetraacetic acid (EDTA) (Merck, Darmstadt, Germany), NaOH/HCl (Sigma, St. Louis, MO, USA), H2O2 (Merck) and potassium hydrogen phosphate (Sigma) were all of analytical grade. Doubly deionized water was produced by a Milli-Q system (Direct-Q UV, Millipore, Bedford, MA, USA).
The standard stock solution of GSH was prepared daily, at a concentration level of 1000 mg L−1 in 10 mmol L−1 EDTA, to avoid catalytic oxidation by trace metals. Working solutions for the ZF (1.5–30 mg L−1) and HPLC (50–1000 mg L−1) methods, respectively, were also prepared daily by serial dilutions in the same solvent.
The derivatizing reagent (OPA) was prepared at an amount concentration of 15 mmol L−1 by dissolving the appropriate amount in 0.5 mL methanol, followed by the addition of 9.5 mL of doubly deionized water [8]. Under these conditions the OPA solution was found to be stable for a practical period of 5 working days, stored at 4 °C, in an amber-glass vial.
The HPLC mobile phase consisted of 20 mmol L−1 phosphate buffer (pH = 2.5) + 1 mmol L−1 EDTA, to exclude interaction of GSH with potentially bleeding metals from the metallic parts of the instrumentation (column housing, transfer lines, etc.) [14]. The mobile phase was prepared on a daily basis and was filtered under vacuum through 0.2 μm filters (Whatman®, Maidstone, UK), prior to pumping through the LC column.

2.3. HPLC Conditions

GSH and GSSG were separated isocratically at ambient temperature, using 100% aqueous mobile phase (see Section 2.2) and a suitable reversed phase column (see Section 2.1). The flow rate was 1 mL min−1, and the injection volume was 20 μL. Both compounds were detected at 210 nm. Under the selected HPLC conditions, GSH was eluted at 3.5 min and GSSG at 8.1 min.

2.4. ZF Conditions

The ZF consisted of the following steps: volumes of 100 μL of OPA (15 mmol L−1), 70 μL of phosphate buffer (200 mmol L−1, pH = 8) and 150 μL of samples or standards were stacked sequentially in the holding coil (HC) of the ZF sensor. On-line mixing of the zones and product development was achieved on passage through a 100 cm long reaction coil (RC), at a flow rate of 0.6 mL min−1. The OPA-GSH derivative was monitored fluorimetrically at λex/λem = 340/425 nm. The sampling throughput was 23 h−1. The ZF sequence is depicted graphically in Figure 1, and more experimental details are provided in Table 1.

2.5. Oxidative Forced Degradation of GSH

Commercially available GSH nutraceuticals were obtained from local suppliers. Six capsules (labeled value 50 mg of GSH per capsule) were individually dispersed in 50 mL of 10 mmol L−1 EDTA and extracted ultrasonically for 15 min. The resulted suspensions were centrifuged at 2000× g for 10 min, and a portion was further filtered through 0.45 μm disposable syringe filters. HPLC analysis was carried out directly, while 50-fold dilution was required for ZF analysis.
Oxidative forced degradation was achieved by spiking a fraction of the samples with concentrated H2O2 to a final amount concentration of 3% w/v. The kinetic profile of the oxidation was monitored by repetitive HPLC or ZF analysis at predefined time intervals.

3. Results and Discussion
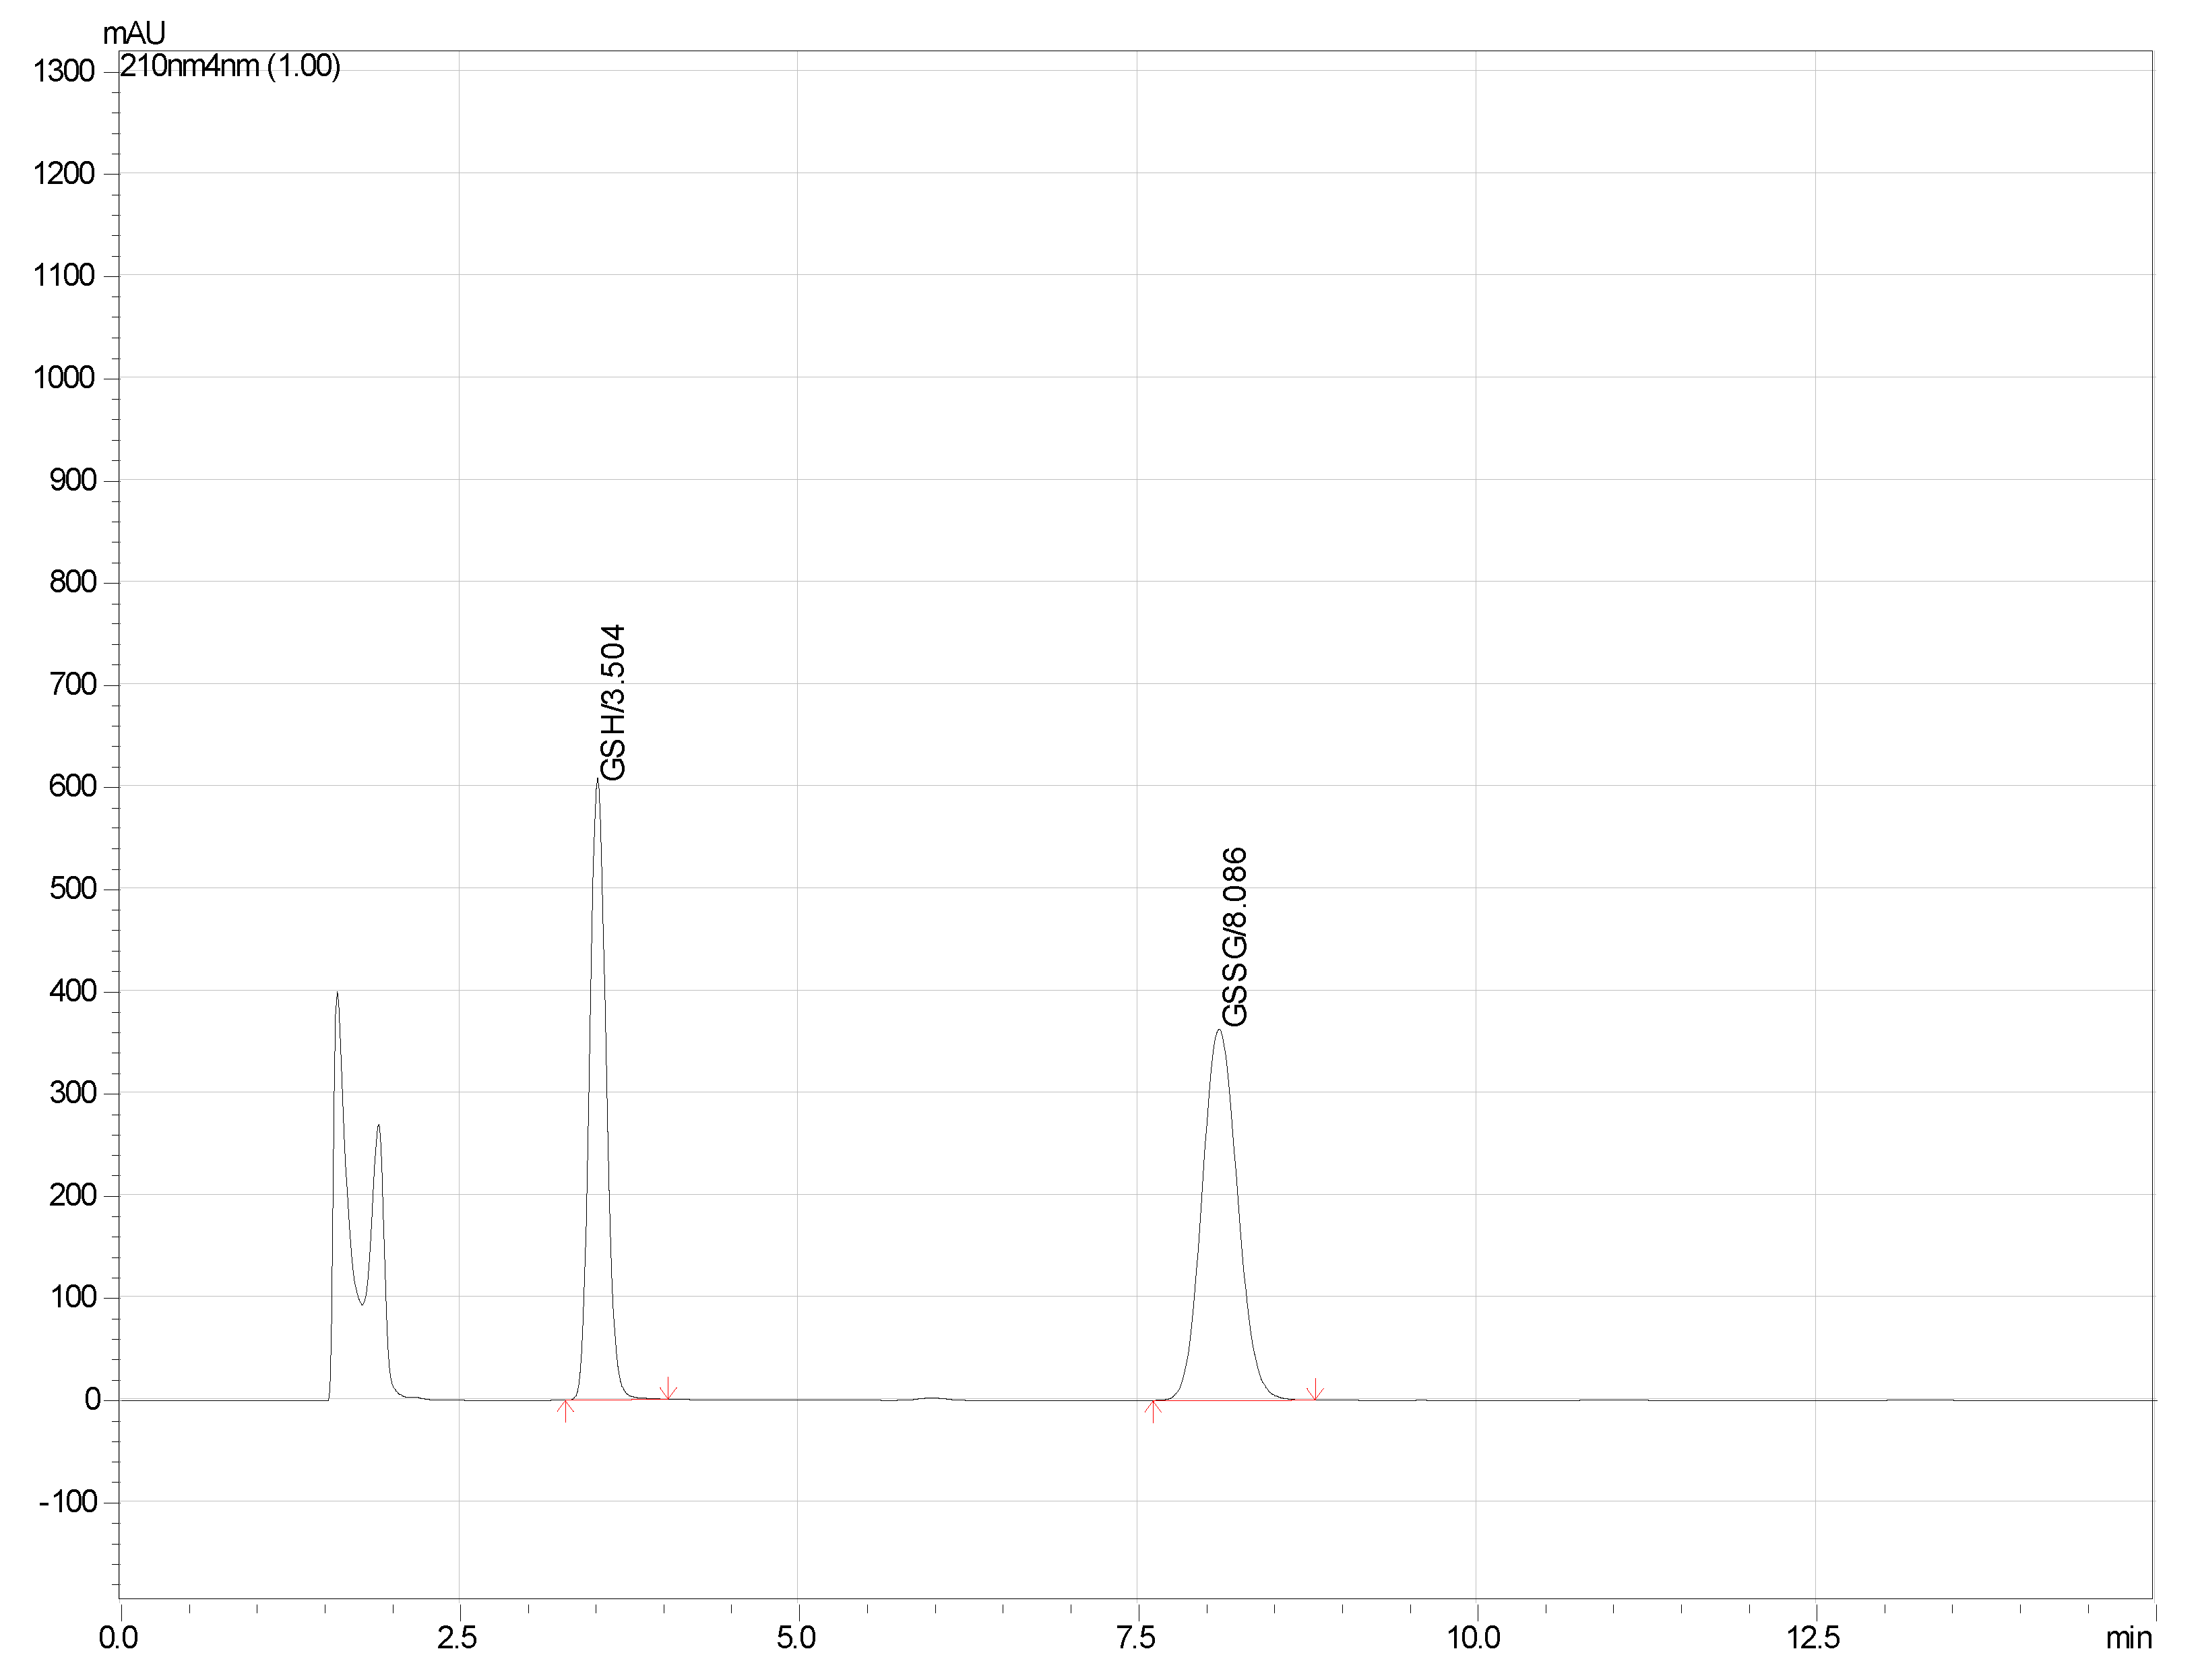
3.1. HPLC Method

GSH and GSSG are highly polar analytes, and their retention on reversed-phase columns is generally low. To overcome this, a solution is to use highly aqueous mobile phases, which are generally more suitable for the efficient chromatographic separation of such compounds [15]. The Prevail C18 column, according to the manufacturer, is capable of long-term operation at mobile phases ranging from 100% aqueous to 100% organic [16], while typical stationary phases with C18 functional groups tend to collapse under long-term usage with mobile phases containing less than 5% v/v organic solvents [17].
Phosphate buffer at acidic pH was examined as 100% aqueous mobile phase. The acidic pH is necessary in order to suppress the ionization of the carboxylic moieties and enhance the retention of the thiolic compounds on the reversed phase column. The mobile phase also contained 1 mmol L−1 EDTA, to avoid potential oxidation of GSH by traces of metallic ions [18]. A combination of 20 mmol L−1 phosphate at a pH of 2.5 provided sufficient retention of GSH and adequate resolution versus GSSG at a reasonable analysis time. The performance characteristics of the HPLC method are summarized in Table 2. A representative chromatogram from a standard GSH/GSSG solution can be found in Figure 2.
Validation of the HPLC method included linearity, LOD and LOQ, within-day and day-to-day precision. Both GSH and GSSG could be determined in the range of 50–1000 mg L−1. The wide linear range offers the advantage of direct monitoring of the oxidative forced degradation without pretreatment, while the 50 mg L−1 low concentration limit corresponds to 95% degradation of GSH. The respective regression equations were as follows:
A(GSH) = 9312 (±257) × [GSH] + 27,327 (±13,291)
A(GSSG) = 12,530 (±179) × [GSSG] + 15,894 (±9236)
where A is the peak area at 210 nm. The regression coefficients were 0.9991 and 0.9994 for GSH and GSSG, respectively, and the percent residuals <±3%. The LODs (S/N = 3) were 4.7 and 2.4 mg L−1, respectively. Within-day precision was better than 1% for both analytes (100 and 500 mg L−1, n = 12). The day-to-day precision was evaluated by calculation of the RSD of the slopes of calibration curves obtained within six consecutive working days. The experimental results confirmed the reproducibility of the method, offering an RSD of 4.5% for GSH and 3.7% for GSSG. The accuracy was validated by spiking known amounts of GSH and GSSG in the nutraceuticals’ matrix. The percent recoveries at two concentration levels of 100 and 500 mg L−1 ranged between 98.8% and 100.7% for GSH (n = 6) and between 98.5% and 101.8% for GSSG (n = 6).

3.2. OPA-Based Zone Fluidics Method

As mentioned above, the oxidative forced degradation of GSH was also examined by an in-house developed and validated automated flow method [6]. Due to the unique mechanism of the OPA-GSH reaction the automated flow-based protocol offers unique selectivity and more than adequate sensitivity for the selected application.
In terms of selectivity, our experiments were focused on two key parameters: (i) the study of H2O2 as a potentially interfering compound and (ii) on the accurate measurement of GSH in the presence of excess GSSG that is expected to be the main oxidation product. In the case of the oxidant, we examined the effect of various concentrations of H2O2 in the range of 0.1%–5% w/v. Injection of H2O2 in the selected range failed to produce any signal statistically different from the blank values. It was therefore concluded that the study of the oxidation of GSH in the presence of a large excess of the oxidant is feasible by the selected non-separation flow method. In the case of GSSG, a critical parameter for the accurate quantification of GSH in the presence of excess of GSSG is the pH of the derivatization reaction. GSH reacts specifically with OPA at a pH value of 8, while a highly basic environment favors the hydrolysis/cleavage of the -S-S- bond [19], leading to the back-formation of GSH. We carried out a series of experiments, analyzing mixtures of GSH and GSSG at various mass concentration ratios. The results are tabulated in Table 3. As can be seen, the percent recoveries were satisfactory even at extreme GSH:GSSG ratios that correspond to > 90% oxidation of the analyte.
From the analytical figures of merit point of view, the OPA-based automated zone fluidics method enables the determination of GSH in the range of 1–30 mg L−1 with LOD of 0.3 mg L−1 [20]. The regression coefficient was >0.999, and the percent residuals ranged between −1.2% and +1.9%. The within-day precision was 0.7% (at 10 mg L−1, n = 12). The day-to-day precision was evaluated by calculation of the RSD of the slopes of calibration curves obtained within six consecutive working days. The experimental results confirmed the reproducibility of the method, offering an RSD of 4.2%. The accuracy was validated by spiking known amounts of GSH in the nutraceuticals’ matrix. The percent recoveries at two concentration levels of 5 and 15 mg L−1 ranged between 99.0% and 102.1% (n = 6).

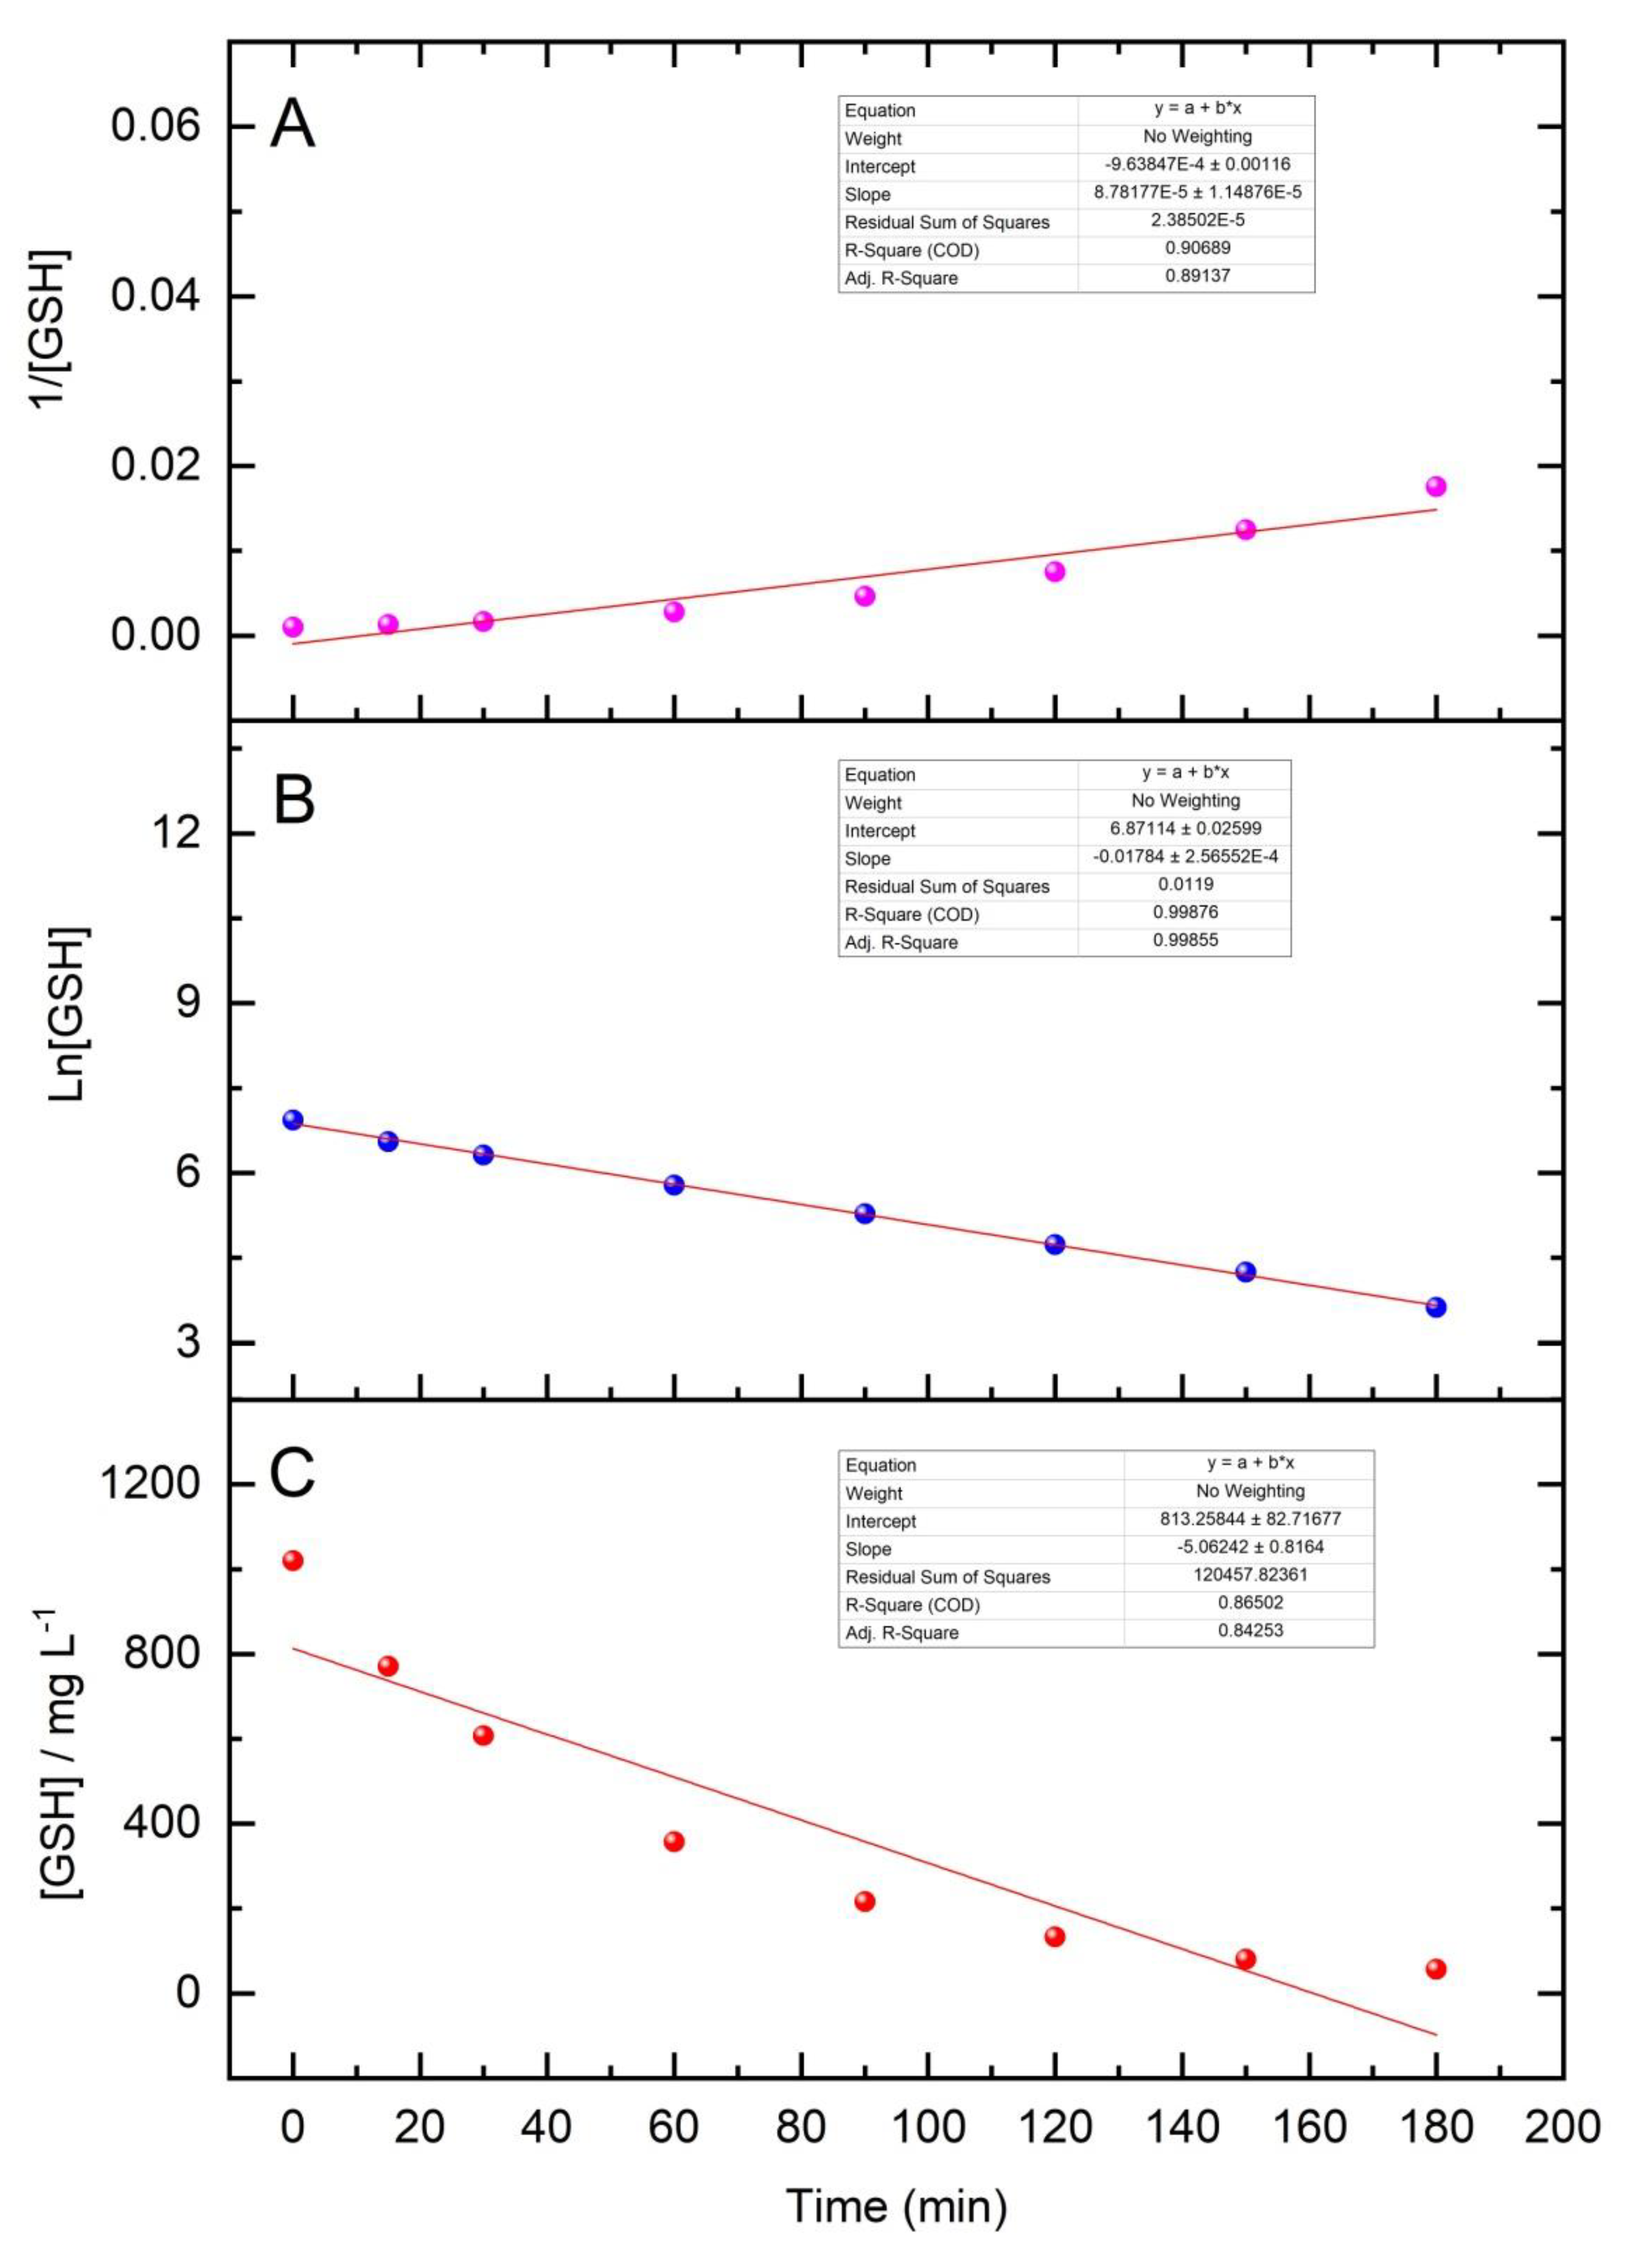
3.3. Oxidative Forced Degradation Results and Kinetics

The importance of kinetics lies in providing a reasonable approach to drug stability, prediction of shelf-life of pharmaceutical dosage form and optimum storage conditions [21]. The determination and estimation of the degradation rate of an active pharmaceutical ingredient in its pure form or in the final product will provide valuable information on tools that can be applied and adopted in order to increase the stability, shelf-life and safety of the drug [22].
Following the experimental protocol described in Section 2.5, a representative oxidative degradation profile of GSH in its nutraceutical formulation, using both analytical methods, can be found in Figure 3. As can be seen in Figure 3A, by using HPLC, we can simultaneously monitor the oxidation of GSH and the formation of GSSG, which is the main oxidation product. On the other hand, the non-separation automated flow method provides information only on the oxidation of GSH (Figure 3B). The oxidative instability of GSH was confirmed, since more than 95% were oxidized within 180 min. An overlaid series of chromatograms at various oxidation time intervals is depicted in Figure 4.
As for the oxidation pathway, GSSG was identified by HPLC as the major degradation product. However, its “plateau” concentration corresponds only to ca. 70% oxidation of GSH, indicating more non-UV absorbing or non-retained degradation by-products under the selected experimental conditions. A close look at Figure 3A reveals that quantitative GSH-GSSG mass balance was observed for oxidation intervals in the range of 0–30 min. At longer reaction times, alternative oxidation paths seems to take over; this result is in accordance to previously reported theoretical studies. Other potential oxidation products may include GSOG, GSO2G, GSO2H and GSO3H [23,24]. Ongoing research using mass spectrometric detection intends to identify all oxidative by-products of GSH and to propose a stability-indicating method suitable for their quantification.
The order of the oxidation reaction of GSH with H2O2 was evaluated by fitting three kinetic models, i.e., zero, first and second order [25]. As can be seen in Figure 5 and Figure 6, using both HPLC and SI, the linearity was excellent for the first-order oxidation kinetics model (r > 0.99). In our case, since the oxidant is in great excess, and it is practically not consumed, the reaction follows pseudo-first-order kinetics, with the k values being 0.0180 and 0.0178 min−1, obtained from HPLC and ZF data, respectively.
The slopes of the regression lines of the first-order degradation model were statistically compared, using the Student’s t-test, according to the following equation [26]:
t = b A b B s b A b B
where bA and bB are the slopes of the regression lines, and sbA-bB is the standard error between the difference of the two slopes, which is calculated as follow:
s b A b B = ( s y , x 2 ) p ( x 2 ) A + ( s y , x 2 ) p ( x 2 ) B
where (s2y,x)p is the pooled residual mean square, and the subscripts A and B are stated to the regression lines being compared. The calculation of the critical values of t-test was performed by taking into account (nA − 2) + (nB − 2) degrees of freedom. The results indicated that no significant difference (at the 95% confidence level) between the two models was observed (t = 0.367 < tcritical).
The t90 (time required to degrade 10% of the drug—often interpreted as the shelf-life under the specific experimental conditions) and t1/2 (time required to degrade 50% of the drug) values were calculated as follows:
t 1 / 2 = l n 2 k = 0.693 k = 38.5   min   ( HPLC )
t 90 = l n 1.11 k = 0.104 k = 5.8   min   ( HPLC )
and confirmed the instability of GSH under oxidative conditions.

4. Conclusions

In this research project, a simple and green HPLC method with direct UV detection and an automated flow method based on zone fluidics with fluorimetric detection proved to be suitable for the monitoring of the oxidative degradation kinetics of glutathione in its nutraceutical formulations. By using HPLC, both the consumption of GSH and the formation of its main degradation product, GSSG, can be monitored simultaneously. Both methods offer satisfactory analytical figures of merit for the intended purpose. Almost 95% GSH was degraded fast by 3% w/v H2O2 within 180 min, with GSSG being the predominant product (70%). Mass balance indicated that the oxidation pathway is more complicated and that additional oxidation products are formed. The oxidation degradation proved to follow pseudo-first-order reaction kinetics.

Author Contributions

P.D.T. conceptualization, supervision and writing—review and editing; A.T. validation, investigation and writing—original draft preparation; A.-S.Z. methodology and writing—review and editing; C.K.Z. supervision, methodology, investigation and writing—review and editing. All authors have read and agreed to the published version of the manuscript.

Funding

This research received no external funding.

Acknowledgments

In this section you can acknowledge any support given which is not covered by the author contribution or funding sections. This may include administrative and technical support, or donations in kind (e.g., materials used for experiments).

Conflicts of Interest

The authors declare no conflicts of interest.

References

  1. Rawat, T.; Pandey, I.P. Forced degradation studies for drug substances and drug products- scientific and regulatory considerations. J. Pharm. Sci. Res. 2015, 7, 238–241. [Google Scholar]
  2. FDA. Guidance for Industry Q1A(R2) Stability Testing of New Drug Substances and Products; ICH: Geneva, Switzerland, 2003.
  3. Snape, T.J.; Astles, A.M.; Davies, J. Understanding the chemical basis of drug stability and degradation. Pharm. J. 2010, 285, 416–417. [Google Scholar]
  4. Basak, A.K.; Raw, A.S.; Yu, L.X.; Alsante, K.M.; Ando, A.; Brown, R.; Ensing, J.; Hatajik, T.D.; Kong, W.; Tsuda, Y. The role of degradant profiling in active pharmaceutical ingredients and drug products. Adv. Drug Deliv. Rev. 2007, 59, 29–37. [Google Scholar]
  5. Camera, E.; Picardo, M. Analytical methods to investigate glutathione and related compounds in biological and pathological processes. J. Chromatogr. B 2002, 781, 181–206. [Google Scholar] [CrossRef]
  6. Tsiasioti, A.; Iakovidou, I.; Zacharis, C.K.; Tzanavaras, P.D. Automated fluorimetric sensor for glutathione based on zone fluidics. Spectrochim. Acta Part A Mol. Biomol. Spectrosc. 2019. [Google Scholar] [CrossRef] [PubMed]
  7. Begic, A.; Djuric, A.; Gobeljic, B.; Stevanovic, I.; Lukic, V.; Stanojevic, I.; Ninkovic, M.; Saso, L.; Vojvodic, D.; Djukic, M. The simple isocratic HPLC—UV method for the simultaneous determination of reduced and oxidized glutathione in animal tissue. Acta Chromatogr. 2017, 29, 67–84. [Google Scholar] [CrossRef] [Green Version]
  8. Tzanavaras, P.D.; Papadimitriou, S.; Zacharis, C.K. Automated Stopped-Flow Fluorimetric Sensor for Biologically Active Adamantane Derivatives Based on Zone Fluidics. Molecules 2019, 24, 3975. [Google Scholar] [CrossRef] [PubMed] [Green Version]
  9. Zacharis, C.K.; Tzanavaras, P.D.; Zotou, A. Ethyl propiolate as a post-column derivatization reagent for thiols: Development of a green liquid chromatographic method for the determination of glutathione in vegetables. Anal. Chim. Acta 2011, 690, 122–128. [Google Scholar] [CrossRef] [PubMed]
  10. Noctor, G.; Mhamdi, A.; Chaouch, S.; Han, Y.; Neukermans, J.; Marquez-garcia, B.; Queval, G.; Foyer, C.H. Glutathione in plants: An integrated overview. Plant Cell Environ. 2012, 35, 454–484. [Google Scholar] [CrossRef] [PubMed]
  11. Otto, M.; Magerus, T.; Langland, J.O. The use of intravenous glutathione for symptom management of Parkinson’s disease: A case report. Altern. Ther. Health Med. 2018, 24, 56–60. [Google Scholar] [PubMed]
  12. Dawson, R.M.C. Data for Biochemical Research, 3rd ed.; Oxford science publications: New York, NY, USA, 1987. [Google Scholar]
  13. Krezel, A.; Bal, W. Coordination chemistry of glutathione. Acta Biochim. Pol. 1999, 46, 567–580. [Google Scholar] [CrossRef] [PubMed] [Green Version]
  14. Bidlingmeyer, B.; Wang, Q. Additives for Reversed-Phase Hplc Mobile Phases. U.S. Patent 7,125,492 B2, 24 October 2006. [Google Scholar]
  15. Gritti, F.; Gilar, M.; Walter, T.H.; Wyndham, K. Retention loss of reversed-phase chromatographic columns using 100% aqueous mobile phases from fundamental insights to best practice. J. Chromatogr. A 2020, 1612. [Google Scholar] [CrossRef] [PubMed]
  16. Alltech® PrevailTM Introduction. Available online: www.discoverysciences.com (accessed on 12 December 2019).
  17. Przybyciel, M.; Majors, R.E. Phase Collapse in Reversed-Phase LC. LC GC Eur. 2002, 15, 1–5. [Google Scholar]
  18. Tang, D.; Shafer, M.M.; Vang, K.; Karner, D.A.; Armstrong, D.E. Determination of dissolved thiols using solid-phase extraction and liquid chromatographic determination of fluorescently derivatized thiolic compounds. J. Chromatogr. A 2003, 998, 31–40. [Google Scholar] [CrossRef]
  19. Angeli, V.; Chen, H.; Mester, Z.; Rao, Y.; D’Ulivo, A.; Bramanti, E. Derivatization of GSSG by pHMB in alkaline media. Determination of oxidized glutathione in blood. Talanta 2010, 82, 815–820. [Google Scholar] [CrossRef] [PubMed]
  20. Hayashi, Y.; Matsuda, R.; Ito, K.; Nishimura, W.; Imai, K.; Maeda, M. Detection limit estimated from slope of calibration curve: An application to competitive ELISA. Anal. Sci. Int. J. Jpn. Soc. Anal. Chem. 2005, 21, 167–169. [Google Scholar] [CrossRef] [PubMed] [Green Version]
  21. Moussa, B.A.; Hashem, H.M.A.; Mahrouse, M.A.; Mahmoud, S.T. Experimental Design Approach in HPLC Method Development: Application for the Simultaneous Determination of Sacubitril and Valsartan in Presence of Their Impurities and Investigation of Degradation Kinetics. Chromatographia 2018, 81, 139–156. [Google Scholar] [CrossRef]
  22. Drug Stability and Kinetics. Available online: https://www.scribd.com/doc/76640703/Drug-Stability-and-Kinetics (accessed on 21 February 2020).
  23. Abedinzadeh, Z.; Gardes-Albert, M.; Ferradini, C. Kinetic study of the oxidation mechanism of glutathione by hydrogen peroxide in neutral aqueous medium. Can. J. Chem. 1989, 67, 1247–1255. [Google Scholar] [CrossRef]
  24. Finley, J.W.; Wheeler, E.L.; Witt, S.C. Oxidation of glutathione by hydrogen peroxide and other oxidizing agents. J. Agric. Food Chem. 1981, 29, 404–407. [Google Scholar] [CrossRef] [PubMed]
  25. de Oliveira, M.A.; da Silva, G.D.; Campos, M.S.T. Chemical degradation kinetics of fibrates: Bezafibrate, ciprofibrate and fenofibrate. Braz. J. Pharm. Sci. 2016, 52, 545–553. [Google Scholar] [CrossRef] [Green Version]
  26. Zar, J. Biostatistical Analysis, 4th ed.; Prentice Hall: Upper New Jersey River, NJ, USA, 1999. [Google Scholar]
Figure 1. Zone fluidics (ZF) sequence and configuration: PP = pump, HC = holding coil, RC = reaction coil, FL = fluorimetric detector and W = waste (for experimental details, see Section 2.4).
Separations 07 00016 g001
Figure 2. Representative HPLC chromatogram from the analysis of a mixture of GSH and GSSG (500 mg L−1 each).
Separations 07 00016 g002
Figure 3. Oxidative degradation of GSH by HPLC (A) and ZF (B).
Separations 07 00016 g003
Figure 4. Representative HPLC chromatograms from the oxidation study of GSH at time intervals of t = 0 min (fuchsia line), t = 90 min (black line) and t = 180 min (blue line).
Separations 07 00016 g004
Figure 5. Kinetic models of the oxidative degradation of GSH by HPLC; (A) zero order, (B) first order and (C) second order.
Separations 07 00016 g005
Figure 6. Kinetic models of the oxidative degradation of GSH by ZF; (A) zero order, (B) first order and (C) second order.
Separations 07 00016 g006
Table 1. ZF steps for the determination of GSH.
Time (s)Pump ActionFlow RateVolume (μL)Valve PositionAction Description
(mL min−1)
0Off1Selection of OPA reagent port
10Aspirate0.61001Aspiration of OPA in the holding coil
1Off2Selection of buffer port
7Aspirate0.6702Aspiration of buffer in the holding coil
1Off3Selection of sample port
15Aspirate0.61503Aspiration of sample in the holding coil
1Off Selection of detector port
120Deliver0.612004Propulsion of reaction mixture to detector
0Off4End of measuring cycle
Table 2. HPLC figures of merit for the separation of GSH/GSSG.
HPLC ParameterGSHGSSG
Retention time (min)3.58.1
Retention factor1.194.1
Theoretical plates/m43,00034,100
Tailing factor1.151.11
Resolution factor12.6
Table 3. Determination of GSH in the presence of GSSG by the OPA flow method.
GSH (mg L−1)GSSG (mg L−1)Recovery (%)
10100.0
1010101.8
1050100.5
1010098.2
1025097.4
10500102.7
101000103.5

