Abstract
A phosphogypsum flotation tailings-derived zeolite (PGTZ) was synthesized from the tailings produced during the reverse flotation of phosphogypsum through alkaline fusion and hydrothermal treatment. The response surface methodology (RSM) utilizing a three-level Box–Behnken design (BBD) was used to assess the adsorption of MB by PGTZ. Polynomial regression models were developed to analyze the effects of process parameters on adsorption capacity (qe). The maximum MB adsorption occurred under the following optimized conditions: PGTZ dosage = 5.31 g·L−1; initial MB concentration = 294.59 mg·L−1; pH = 7.42; and adsorption time = 187.89 min. Additionally, adsorption isotherm and kinetic models were fitted to the experimental data to determine model parameters. The Langmuir isotherm model and pseudo-second-order kinetic model incorporating intraparticle diffusion were able to effectively predict MB adsorption onto PGTZ. Thermodynamic analyses indicated that the adsorption process was spontaneous, with strong chemical interactions between MB and PGTZ.
1. Introduction
In the midst of the consequences of high-speed industrialization, water pollution has come to be a major concern with significant negative impacts. Among innumerable aqueous contaminants, dyes have provoked growing concern due to their wide application in various industries, including pharmaceutical, printing, textile, food, and leather. Dye wastewater is characterized by a dark color, a high organic contaminant content, complex composition, the presence of heavy metals, biological toxicity, and near-nonbiodegradability [1,2,3,4]. Dyes are resistant to photodegradation and oxidation and contain a variety of organic substances with biological toxicity and/or the “three carcinogens” properties (carcinogenic, teratogenic, mutagenic); hence, dyes can cause great harm to the environment. Meanwhile, dyes in wastewater are light-absorbing, which reduces the transparency and consumes a great deal of oxygen in water [5,6,7]. Therefore, dye pollution can cause oxygen deficiency in bodies of water, thus impacting the proliferation of aquatic organisms and microorganisms, as well as visual pollution.
Methylene blue (MB) is a type of phenothiazine salt with an unstable positive charge. Its appearance is dark green-bronze, lustrous, and crystalline (trihydrate); it can be dissolved in water/ethanol but not in ether. The stability of methylene blue is relatively strong in air; when dissolved, the solution becomes alkaline and toxic. MB is extensively utilized in chemical indicators, dyes, biological dyes, and drug manufacturing. MB produces severe environmental pollution because it can only be degraded very slightly by using common techniques [8,9,10]. At present, treatment methods for wastewater containing organic dyes mainly include the biological method [11,12,13], coagulation method [14,15], oxidation method [16,17,18], adsorption method [19,20,21,22,23], and membrane separation method [24,25,26]. The biological treatment of dye wastewater is often suboptimal due to variability in pH, temperature, and dye, compounded by sludge bulking and polymeric micelle instability. For the coagulation method, the operational cost and amount of sludge are both high and the dewatering process is difficult, which leads to this treatment producing a poor effect in terms of dyes. Oxidation methods incur prohibitive costs with unrecoverable catalysts. Common oxidants exhibit limited oxidizing power and nonselective oxidation while introducing impurities that cause secondary contamination. Conversely, membrane separation achieves high removal rates and enables dye recovery from wastewater. While operationally simple, membrane processes incur high capital costs and require elevated operating pressures, leading to substantial energy consumption that hampers their industrial adoption. Based on the above analysis, the adsorption method is considered as the most preferential technique due to its high efficiency, technological simplicity, convenience, and economic feasibility at industrial scales [17,27,28,29].
Adsorption technologies stand out due to the effectiveness and efficiency of the employed adsorbents. To address the issue of dye wastewater and develop solutions for dye removal from wastewater, significant research on novel adsorbent synthesis and composite materials has been conducted. Activated carbon features a developed pore structure and substantial specific surface area, offering strong qe for MB [30,31,32,33]. It can effectively adsorb methylene blue molecules from wastewater, achieving high removal rates. However, its relatively high cost and complexity in regeneration limit its large-scale application. Meanwhile, zeolite has a microporous structure with a large specific surface area and numerous adsorption sites. Its framework structure contains negatively charged aluminum atoms, which are compensated for by exchangeable cations such as Na+ and Ca2+. Methylene blue cations exchange with zeolitic cations or adsorb onto zeolite surfaces via electrostatic attraction. Zeolite materials play a key role in the adsorption treatment of MB [34,35,36,37]. They offer eco-friendly, efficient, and cost-effective advantages, with great application prospects in the field of sewage treatment, environmental monitoring, dye recycling, and environmental remediation.
Phosphogypsum is an industrial by-product manufactured during the production of phosphate-based materials. Its large quantities pose storage and environmental challenges [38,39,40]. Reverse flotation is an effective method for purifying phosphogypsum and involves adding collectors and frothers to selectively adsorb impurities such as quartz and organic matter onto bubbles, thereby achieving separation [41,42,43,44]. The tailings produced during the reverse flotation process mainly consist of impurities such as quartz and organic matter. According to previous research, solid waste rich in aluminosilicates can be used to synthesize high-quality zeolite materials [45]. The tailings produced pose environmental challenges because of their large volume, potential for heavy metal leaching, and other pollution risks. Converting these wastes into zeolite materials reduces landfill requirements and prevents environmental hazards caused by their stacking, such as soil and water pollution, thereby alleviating environmental pressures.
Utilizing solid waste to produce zeolite materials aligns with the principles of a circular economy. Although the conversion of other wastes to zeolites is known, the specific chemical nature and challenges of PGT make this a distinct and previously unreported achievement. Namely, to the best of our knowledge, the first report on the synthesis of PGT-derived zeolite (PGTZ) adsorbent specifically and its application for MB adsorption was presented in this work. This work prepared PGTZ to maximize the economic potential of tailings through resource utilization and to reduce reliance on natural mineral resources for zeolite production, conserving finite resources and achieving sustainable resource utilization. Moreover, the MB adsorptive capability of PGTZ is studied and enhanced through a Box–Behnken design (BBD)-based response surface methodology (RSM). Simultaneously, the relative effects of contributing factors are analyzed. Moreover, multiple typical models are applied to investigate the kinetics and equilibrium data related to the adsorption mechanism.
2. Materials and Methods
2.1. Experimental Materials
The phosphogypsum flotation tailings (PGT) used in this study were produced during reverse flotation of phosphogypsum at Xinyangfeng agricultural technology Co., Ltd., Jingmen, China. The chemical composition of the PGT is presented in Table 1. The major oxides are SiO2 (50.36 wt%), Al2O3 (6.68 wt%), and CaO (4.82 wt%), with lesser amounts of Fe2O3 (3.46 wt%) and MgO (0.26 wt%). The sum of these major oxides is 65.58 wt%. The remaining mass is attributed to other components not measured by XRF, such as sulfur trioxide (SO3), water, carbonates, and organic matter, which are common constituents of PGT. Moreover, we also have performed additional analysis using ICP on the initial PGT to quantify trace heavy metal concentrations. The data (see Table S1) confirms that concentrations of potentially hazardous elements (e.g., Cd, Cr, As, Pb) in the PGT are well within the safety thresholds for soil environmental quality-risk control standard for soil contamination of development land (GB 366600-2018) [46]. The dye, i.e., methylene blue (MB), was obtained from Tianjin chemical reagent research institute, Tianjin, China. The MB concentrations were adjusted to initial operational concentrations (C0) ranging from 100 to 350 mg·L−1 by thinning out the MB stock solution (1000 mg·L−1) using distilled water. Moreover, the other chemical reagents used in these studies were of analytical grade (Sinopharm Chemical Reagent Co., Ltd., Shanghai, China); no further treatment was performed.

Table 1.
Chemical components of PGT.
2.2. Preparation of PGTZ
In pursuit of optimal dissolution performance, the PGT was initially subjected to ball milling at 650 rpm for 30 min. The milled PGT was then sieved through a 100-mesh (a nominal aperture size of 150 µm) screen before proceeding to the synthesis stage. The PGTZ synthesis in this study involved a two-step process of alkaline fusion followed by hydrothermal treatment. During the standard procedure, to ensure a homogeneous mixture of PGT and NaOH, their mixing ratio was precisely controlled at 1:1.3 (wt%: wt%) for the PGTZ synthesis. The mixed materials were first roasted in a ceramic container within a muffle furnace at 600 °C for 90 min. Subsequently, the fusion product was removed from the furnace and left to cool. Once cooling was complete, 3.0 g of the cooled fusion product was accurately weighed and thoroughly dissolved in 50 mL of 2.0 mol/L NaOH solution. Upon completion of the dissolution process, 2.0 g of NaAlO2 (Sinopharm Chemical Reagent Co., Ltd.) was added into the suspension. The suspension was then mixed intensely at 100 °C for 1.0 h. Subsequently, it underwent a 5.0 h aging period without stirring to facilitate the achievement of the desired crystallization state. Eventually, the solid PGTZ product was subsequently filtered, washed, and dried at 80 °C.
2.3. Experimental Design and Adsorption Studies
As a mathematical statistical regression model, BBD for RSM was selected for design adsorption of MB using PGTZ as an adsorbent. There were four prime factors, including PGTZ dosage (A), initial MB concentration (B), initial pH (C), and adsorption time (D); these were determined to be independent variables based on the one-factor experimental results, and were analyzed at three levels (i.e., −1, 0, +1) to optimize the output response. To optimize the factors, maximizing the qe of MB onto PGTZ was selected as the goal of optimization. Table 2 displays the variables and the levels of BBD-RSM used. The Design–Expert (Stat-Ease) software trial version 10.0.4.0 64-bit was selected to apply the BBD for the response surface methodology (RSM), in order to assess the four variables at three different levels. The F-test was performed to assess the significance of the model equation and its terms; the coefficient of determination R2 and adjusted R2 were calculated to express the quality of the quadratic model equation; and analysis of variance (ANOVA) was performed for evaluation of the statistical significance of the model. As far as obtaining optimal values was concerned, a regression equation and response surface plot were applied.
Table 2.
Experimental values and coded values of four operating parameters.
Based on Table 2, all the batch experiments with 100 mL of the desired initial MB concentration and initial pH were placed into a 250 mL Erlenmeyer flask. Then, the desired dosage of PGTZ was added to the flask. Finally, the flasks were fixed on a translatory shaker under continual stirring of 200 rpm at 25 °C. After predetermined time intervals, analysts obtained samples and performed filtration followed by analysis with a UV–vis spectrophotometer (TU1901, Persee, Beijing, China) at 665 nm. On the basis of a suggestion provided by the Design–Expert software, a total of 29 runs were performed, as detailed in Table S2. All batch experiments were carried out in triplicate, and the reported values for qe represent the mean ± standard deviation. The principal parameter of the MB adsorption process, i.e., the corresponding qe values of PGTZ, was established using Equation (1):
where C0 and Ce are the initial and equilibrium concentrations of MB (mg·L−1); V represents the batch working volume (L); and m indicates the weight of PGTZ (g).
2.4. Adsorption Isotherms and Kinetic Studies
Study of the adsorption isotherm was carried out under following circumstances: at 25 °C, 30 °C, and 35 °C, stirring 0.6 g of PGTZ with 100 mL of MB solution under 100–350 mg·L−1 in 250 mL conical flasks, maintaining pH at 6.0 until equilibrium was reached. Study of the kinetic experiments was carried out in a near-identical manner: the MB solution (100 mL, 200 mg·L−1) was stirred at various adsorption temperatures (25 °C, 30 °C, and 35 °C) with 0.6 g of PGTZ in 250 mL Erlenmeyer flasks for 15–255 min. During the experiments, at predetermined time intervals, a certain volume of the solution was collected for kinetics, and an additional amount was collected for isotherms at the time when equilibrium was obtained. All batch experiments were carried out in triplicate, and the reported values for qe represent the mean ± standard deviation. Furthermore, batch experiments provide insights into adsorbate transfer kinetics, interfacial equilibrium (isotherm studies), and chemical energy functions (thermodynamic investigations, including activation energy estimation).
2.5. Characterization
XRD (D8 Discover, Bruker, Berlin, Germany) was employed with a step width of 0.02° and a scan speed of 1°/min in determination of crystalline phases. XRF spectroscopy (Axios, PANalytical, Almelo, Holland) was utilized with an X-ray tube (Rh target, 50 kV, 1 mA) while the resulting characteristic X-rays are detected with a wavelength-dispersive (WDXRF) system under standardized temperature in determination of major chemical composition of PGTZ. Field emission scanning electron microscopy (FE-SEM) (Mira3, Tescan, Brno, Czech Republic) is run at 1–15 kV, 10 µA, 3–5 mm working distance, 10−3–10−4 Pa vacuum, on a 5–10 nm Au sputter-coated conductive mount to observe of crystal morphology along with particle size. Nitrogen adsorption method helped in determination of specific surface area (SSA). With help of ASAP2020 (Micromeritics, Norcross, GA, USA), nitrogen sorption experiments were measured by adsorbing N2 at −196 °C after outgassing 100–300 mg powder at 150–200 °C for 2–4 h under <10−2 Pa vacuum. A pH meter (pHS-3C, Leici, Shanghai, China) with a combination electrode (E-201-C, Leici, Shanghai, China) was used for measurement of the solution’s pH.
3. Results and Discussion
3.1. Material Properties of PGTZ
Figure 1 portrays the XRD patterns of the obtained PGTZ. The manifestation of well-defined diffraction peaks at 2θ values of 7.18°, 10.15°, 16.07°, 23.94°, 27.06°, and 29.89° (Cu radiation) was due to the reflections from zeolite A. Namely, XRD pattern confirms that the product is composed mainly of zeolite A, with no other crystalline phase detectable. While the XRD pattern shows no discernible peaks corresponding to residual quartz or other crystalline phases from the original PGT, their presence in minor amounts within an amorphous phase cannot be ruled out. The high intensity of the zeolite A peaks suggests that any such amorphous content is likely minimal, indicating a high degree of conversion. The SEM images of the prepared PGTZ sample are shown in Figure 2. The SEM images revealed that the synthetic PGTZ particles were cubic in shape, with a relatively smooth surface and uniform size distribution. Zeolite A was typically characterized by a cubic morphology, which was a well-documented feature in the literature. The SEM images from this study showed that the synthesized PGTZ exhibited a typical cubic structure, similar to the commercial zeolite A and other synthesized samples reported in previous studies [47,48]. The FT-IR spectra of the PGTZ material are illustrated in Figure 3. The peak at 1003 cm−1 corresponds to T-O-T vibrations (T = Si/Al tetrahedra) in zeolite. Peaks at 562 cm−1 are assigned to double rings, peaks at 437 cm−1 are assigned to internal TO4 tetrahedral vibrations, and peaks at 660 cm−1 are assigned to asymmetric stretching modes. Around 606 cm−1, there are absorption peaks corresponding to the stretching vibrations of Al-O bonds in the framework. There were also absorption peaks at 880 cm−1 associated with the bending vibrations of Si-O bonds. Additionally, peaks at 3418 cm−1 (stretching) and 1640 cm−1 (bending) express O-H stretching and H-O-H bending vibrations. In addition to the SEM morphology and XRD and FTIR analyses, the FTIR analyses of the synthesized PGTZ match well with the reference data. This further confirmed the successful synthesis of zeolite A. Meanwhile, the BET surface area of PGTZ was roughly calculated to be 44.2 m2·g−1, while its total pore volume was roughly measured at 0.102 cm3·g−1 (for the N2 adsorption–desorption data for PGTZ, please see Figure S1), further providing strong evidence that a substantial amount of the larger surface area and porous PGTZ compound was generated in the synthesis process straight from PGT. The primary reason for the lower surface area is the inherent chemical composition of the PGT precursor. Unlike pure chemical reagents, PGT contains significant amounts of non-reactive or poorly reactive silica and other organic matter. These impurities do not convert into microporous zeolite during synthesis and act as a “diluent”, lowering the overall specific surface area of the bulk product. The relevant literature report similarly moderate surface areas for zeolites synthesized from other complex waste streams, such as fly ash or blast furnace slag [49,50,51,52,53]. This will help contextualize our result as being typical and expected for a waste-derived zeolite rather than a pure-phase material. The PGT always contains measurable natural radionuclides (mainly 126Ra, 232Th, 40K), yet the internal and external exposure indices of China’s mainstream stockpiles are consistently below 1.0, satisfying GB 6566-2010 limits [54]. Moreover, the hydrothermal synthesis process itself, particularly the alkaline conditions and the formation of a stable crystalline zeolite structure, acts to effectively immobilize any potential radioactive constituents. Consequently, its radiological risk of PGTZ in water treatment applications is negligible. And the conversion of PGT into a crystalline PGTZ effectively traps non-soluble species within the stable mineral framework, minimizing leaching.
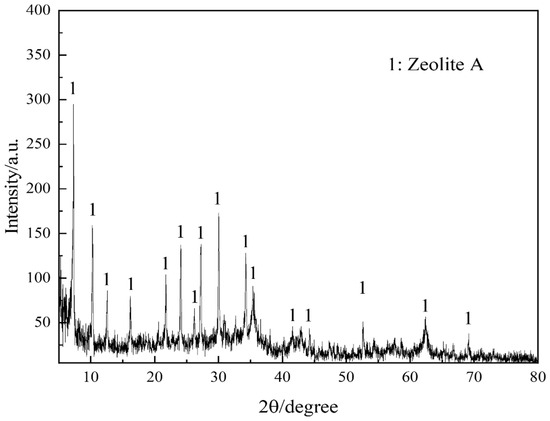
Figure 1.
XRD pattern of PGTZ.
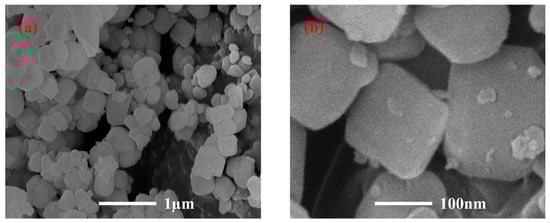
Figure 2.
SEM images of PGTZ. (a) Scale bar = 1 μm; (b) Scale bar = 100 nm.
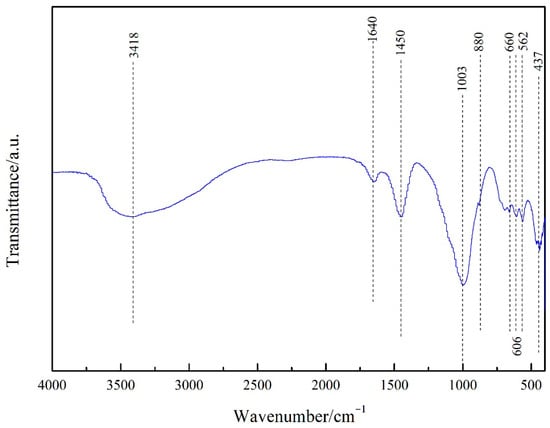
Figure 3.
FT-IR spectrum of PGTZ.
3.2. Model Fitting
The statistical package within the Design–Expert software assisted in designing the 29 total runs, and the relevant experimental data are shown in Table S2. The Box–Behnken design efficiently facilitated second-order response surface modeling for relevant factors. Furthermore, Table 3 displays ANOVA results evaluating the significance of the regression model. As can be observed from Table 3, the model F-value of 50.87 indicates the great significance of the model, which guarantees that the regression equation provided explains the majority of the variation in the response observed for the MB sorption onto the PGTZ material. There was only a 0.01% chance that an F-value at this level would take place as a result of noise [55,56,57]. On the other hand, the fact that the p-values are lower than 0.0500 is a clear indication that the model terms are of importance under the selected conditions. In this case, A, B, C, D, AC, CD, A2, B2, C2, and D2 are noteworthy model terms with respect to the response qe. Compared to additional terms, the higher F values for initial MB concentration (factor B) and initial pH (factor C) demonstrate their greater impact on qe. Furthermore, the higher values of the sum of squares for the initial MB concentration (factor B) and initial pH (factor C) once more verify their greater comparative impact on qe variation. To further elucidate the relative impact of each parameter, a Pareto diagram of the standardized effects is presented in Figure S2. This Pareto diagram again visually confirms that the initial MB concentration (factor B) had the most significant influence on the qe, followed by initial pH (factor C).
Table 3.
ANOVA for RSM parameters for quadratic models.
The maximum qe was predicted via second-order equations. The model is presented in its full quadratic form to maintain hierarchy, ensuring unbiased estimates for all coefficients, even though some interaction terms were not statistically significant. In terms of actual factors, the following equation displays the empirical relationships between tested variables and responses:
qe = 2.40 + 3.23A + 0.11B − 5.54C + 0.077D + 0.0025AB + 0.50AC − 0.0089AD − 0.0023BC + 0.00017BD + 0.012CD − 0.55A2 − 0.00017B2 + 0.24C2 − 0.00035D2
Typically, positive signs in equations indicate synergistic variable interactions, whereas negative signs denote antagonistic effects. The model fit statistics can be viewed in Table 4. The value determined for R2 is 0.9807, and the high R2 value indicates a positive correlation between factual and predicted values. Additionally, the pred. R2 (0.8890) and adj. R2 (0.9614) show rational concordance. The difference between the predicted R2 and adjusted R2 is greater than 0.2 which, once again, indicates the reliability of the model. Measurement of the signal-to-noise ratio requires sufficient precision. A recommendable ratio would be greater than 4; the value of 27.5997, therefore, demonstrates that the signal is more than adequate. Therefore, this model is capable of navigating the design space. Moreover, the normal plot of residuals (Figure 4a) suits the common distribution, as the graph almost follows a straight line, which is an indication that the residuals are in line with common distribution. In addition, the qe plot between the actual values measured and the predicted values evaluated (Figure 4b) further demonstrates that the model’s prediction capability is remarkable.
Table 4.
Model fit statistics.
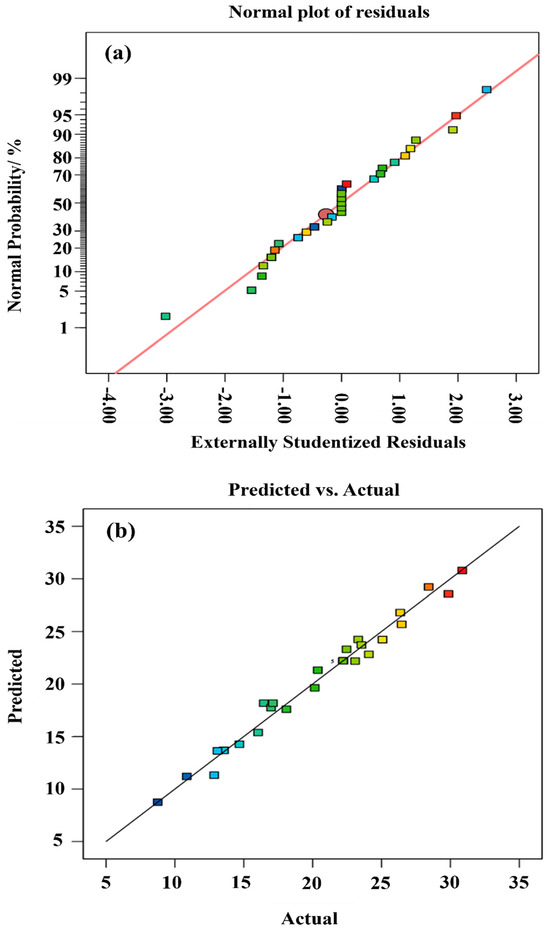
Figure 4.
Diagnostic plots. (a) Normal plot of residuals and (b) Predicted vs. actual qe values.
3.3. Effects of Process Variables
The effects of interactions between the four variables and the qe for MB were assessed using the RSM, and the results are shown as 3D surface plots (see Figure 5). Figure 5a represents the simultaneous influence of PGTZ dosage and initial MB concentration on qe. The dosage of PGTZ is inversely proportional to the qe. In other words, the PGTZ dosage had a negative effect on the qe. This characteristic arises because the quantity of active sites on the adsorbent surface is relatively adequate for an MB concentration at a low adsorbent dosage. However, with an increase in the adsorbent dose, the number of adsorption sites expands, leading to the desaturation of adsorption sites. The qe also increased with higher initial MB concentration, likely due to enhanced collision probability between MB molecules and PGTZ particles. As a result, more MB ions would circle around active sites of PGTZ; thus, a more extensive diffusion process of the adsorbent surface into the micropores would take place [10,58,59]. From observation, as well as discussion in the literature concerning other adsorbents, a similar trend in MB sorption capacity variation with adsorbent dosage was observed [28,60,61,62,63].
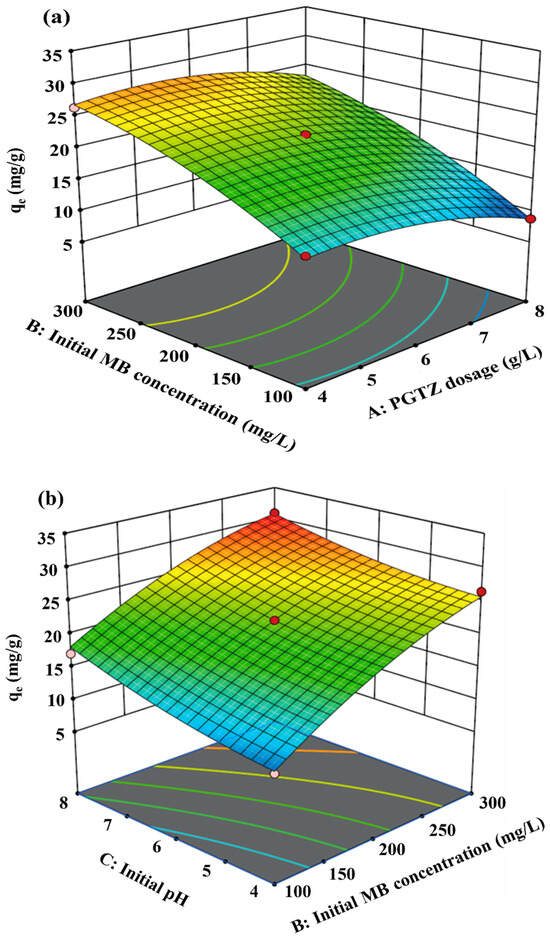
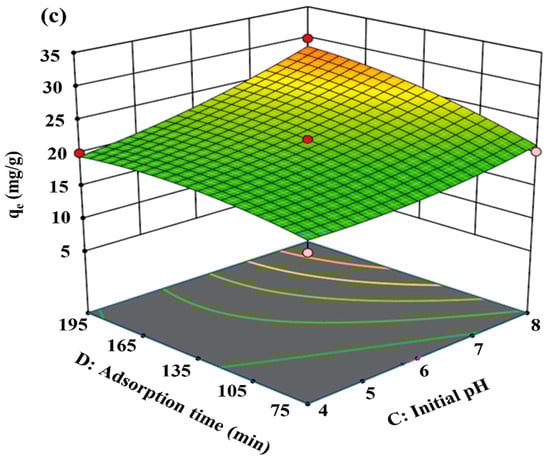
Figure 5.
Simultaneous effect of AB (a), BC (b), and CD (c) on qe.
Figure 5b depicts simultaneous effects of the initial MB concentration and pH on qe. Elevated adsorption capacities resulted from concurrent increases in MB concentration and pH. Adsorption enhancement occurred with pH elevation across different initial MB concentrations. According to the zeta potential of PGTZ (see Figure S3), the pHzpc of PGTZ can be calculated as 4.27. When the solution pH was below pHzpc, PGTZ’s surface became protonated, hindering adsorption of cationic MB owing to electrostatic repulsion. The PGTZ surface was negatively charged at a pH above pHzpc. This may lead to electrostatic attraction between the MB and PGTZ surfaces, thereby enhancing the MB uptake [64,65,66]. However, the adsorption data indicate an insignificant relationship between capacity and solution pH; namely, electrostatic interaction may not be the primary mechanism of the adsorption process between MB and PGTZ [56,67].
Figure 5c represents the simultaneous effect of adsorption time and initial pH on qe. Obviously, the amount of MB uptake increased with increasing adsorption time: with a longer adsorption time, a more sufficient contact between MB and PGTZ particles is obtained, resulting in an increase in the qe.
3.4. Independent Variables
To analyze the influence of four different factors on qe concurrently, a perturbation plot was utilized (Figure 6). More or less, all factors turned out to be controlling parameters in terms of achieving maximum qe. Due to the evidence of a sharp curvature for the PGTZ dosage (factor A) and initial MB concentration (factor B), it can be speculated that the qe for MB adsorption was more responsive to those parameters. Specifically, compared with the first two parameters, the qe was less responsive to initial pH (factor C) and adsorption time (factor D), as evidenced by the flatter curve trends.
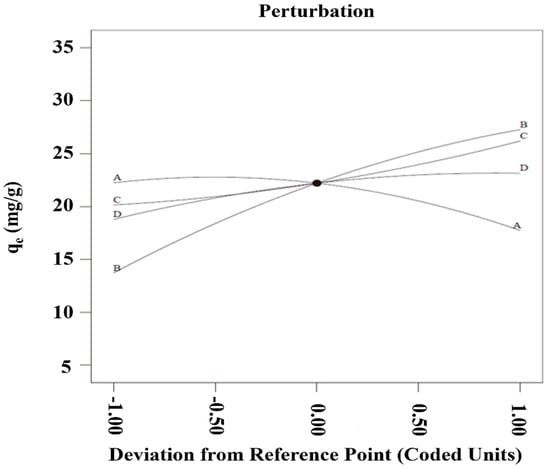
Figure 6.
Perturbation plot of all the variables on qe.
3.5. Desirability Function Optimization
The response surface methodology (RSM) primarily identifies optimal values of significant variables to maximize response. Beginning at a random point, it ascends the steepest slope toward the maximum. The objective in the present study was to maximize the qe. Numerical optimization located the point at which the desired maximum occurred. The significance of each goal varied with regard to the other goals. Table 5 displays some solutions for qe provided by the software, which can provide a total of 100 solutions. The value of desirability generated in all solutions selected shows that the estimated function may be able to represent the experimental model and desired conditions. Moreover, we have performed a confirmatory batch experiment at the predicted optimal conditions (PGTZ dosage = 5.31 g·L−1, initial MB concentration = 294.59 mg·L−1, pH = 7.42, adsorption time = 187.89 min). The experimental MB uptake was 31.12 mg·g−1 and the relative error between the predicted optimum (32.31 mg·g−1) and the validated confirmation run (31.12 mg·g−1) was 3.68%. The excellent agreement between the predicted and experimental values validates the model’s utility at the predicted optimal condition.
Table 5.
Numerical optimization solutions.
3.6. Adsorption Isotherms
Adsorption isotherms were analyzed to determine dye distribution coefficients between solid and liquid phases at chemical equilibrium. During the liquid–solid adsorption, mass transfer of the liquid solute takes place from the liquid phase to solid surface. The relationships between pollutant species and adsorbent material at a fixed temperature can be qualitatively, as well as quantitatively, interpreted through the analysis of adsorption isotherms. Meanwhile, adsorption isotherm studies determined the nature of the adsorption and the maximum capacity. Experimental MB equilibrium data were fitted to standard models, including the Langmuir Equation (3), Freundlich Equation (4), Temkin Equation (5), and Dubinin–Radushkevich (D-R) models Equations (6) and (7). The equations of the isotherm models are as follows. Table 6 lists the relative parameters of each equation obtained using linear regressive analysis and the corresponding model parameters with correlation coefficients.
where KL denotes the adsorption equilibrium constant (L·mg−1); q0 represents the maximum monolayer capacity (mg·g−1); qₑ represents the equilibrium adsorption capacity (mg·g−1); and Cₑ represents the equilibrium concentration (mg·L−1). KF [(mg·g−1)(L·mg−1)ⁿ] and 1/n represent adsorption capacity and intensity, respectively. Aₜ is the binding constant (L·mol−1), Bₜ relates to adsorption heat, and ε the Polanyi potential energy (mol2·kJ−2).
Table 6.
Isotherm parameters for the adsorption of MB.
From Table 6 and Supplementary Figures S4 and S5, it is evident that via the coefficient of determination (R2), the MB adsorption onto PGTZ is better represented using the Langmuir isotherm (R2 = 0.9834, 0.9866, and 0.9869 at 25, 30, and 35 °C) as compared to the Freundlich isotherm (R2 = 0.9058, 0.9508, and 0.8561 at 25, 30, and 35 °C), Tempkin isotherm (R2 = 0.9252, 0.9437, and 0.9129 at 25, 30, and 35 °C), and D-R isotherm (R2 = 0.8447, 0.7065, and 0.5738 at 25, 30, and 35 °C). Since the adjusted R2 (R2adj) accounts for the number of predictors in the model, preventing overestimation of fit, while the root mean square error (RMSE) offers a clear measure of the average prediction error. The goodness-of-fit for the isotherm models was also evaluated using both the R2adj and the RMSE. The Langmuir model yielded the highest R2adj and the relatively lower RMSE (see Table 6), again confirming it as the most appropriate model for describing the equilibrium data. Specifically, the Langmuir isotherm exhibits the highest accuracy in terms of describing experimental equilibrium adsorption data. Moreover, the values of KL show an increasing trend with an increase in temperature, allowing one to infer that MB adsorption is an endothermic process. In addition, dimensionless separation factors (RL) are obtained in the range of 0.035–0.32 for all the adsorption temperatures studied. Therefore, the adsorption process of MB on PGTZ is accurately described.
The Freundlich equation suits heterogeneous surfaces well, and the parameter of n indicates the suitability of the adsorbent surface. When n > 1 (i.e., 0 < 1/n < 1), the surface of the PGTZ is well suited to the adsorption process. When the Freundlich model was applied to match the experimental equilibrium data, the value of 1/n was found to be in the range of 0.1651–0.3965 at adsorption temperatures of 25–35 °C. The 1/n value for MB adsorption was in the range of 0–1, suggesting positive cooperation in MB adsorption onto PGTZ. The above results demonstrate that PGTZ is a promising candidate for MB adsorption.
Because it demonstrated the lowest R2 value, the D-R isotherm model was the least accurate for equilibrium adsorption data prediction. Moreover, the energy of activation—i.e., the E value—can serve as guarantee for the chemisorptive or physical adsorption nature of MB removal on PGTZ. Regarding the measurement of the value, the values (71.68 kJ·mol−1) above 8 kJ·mol−1 are suggestive of a chemisorption type of MB adsorption. For the Temkin model, the obtained parameter B value indicates lower adsorption energy, suggesting that the adsorption is of a physical nature. However, this result is inconsistent with the calculated activation energy ( value) obtained from the D-R isotherm model and adsorption kinetics (see Section 3.8). This can be attributed to the fact that the Temkin model is more suitable for describing equilibrium adsorption in the gas phase rather than the liquid phase [67,68]. Based on the above, the Temkin model is not a desirable model for measuring the adsorption of MB on PGTZ. According to the above analysis, the adsorption of MB on PGTZ was found to be favorable. Through comparison of the isotherm models displayed in Table 6, the models’ accuracies were found to be in the following order: Langmuir > Freundlich > D-R > Temkin. To verify the accuracy of the above adsorption isotherm fitting, we also have re-fitted the equilibrium data for all four isotherm models (Langmuir, Freundlich, Temkin, and Dubinin-Radushkevich) using non-linear regression analysis (the results can be seen Figure S6). And we have confirmed that the conclusion regarding the best-fit model remains unchanged, which strengthens our original interpretation.
To evaluate the practical potential of the developed PGTZ, its performance was compared with other adsorbents as summarized in Table S2. The maximum qe of our adsorbent (31.65 mg·g−1) for MB is significantly higher or similar than that of other adsorbents. These comparisons suggest that the PGTZ presents a competitive, cost-effective alternative for the removal of MB. Despite the moderate BET specific surface, the PGTZ exhibited a high qe for MB, indicating that the available surface sites are highly effective and accessible to the dye molecules.
3.7. Kinetic Studies
To predict the kinetic behavior regarding the adsorption of MB onto PGTZ, the following kinetics models were utilized for interpolation of the experimental data at different adsorption temperatures: the pseudo-first-order (see Figure S7), pseudo-second-order (see Figure S8), and intraparticle diffusion model (see Figure S8). The above-mentioned kinetics models are shown in Equations (8)–(10):
where qe (mg·g−1) denotes equilibrium adsorption capacity; qₜ (mg·g−1) denotes capacity at time t; k1 (min−1) denotes the pseudo-first-order rate constant; k2 (g·mg−1·min−1) denotes the pseudo-second-order rate constant; kᵢd denotes the intra-particle diffusion constant (mg·g−1·min−1/2); and C denotes the intercept.
The various parameters and correlation coefficients (R2) of the various kinetic models were calculated and are listed in Table 7. For the pseudo-first-order model, the qe(exp) does not match the calculated values of qe under various adsorption temperatures. The inapplicability of the pseudo-first-order model for MB adsorption kinetics on PGTZ was further confirmed by the significant deviations in R2 values from unity at all adsorption temperatures. However, when the pseudo-second-order kinetic model was applied, the R2 for the pseudo-second-order kinetic model at different adsorption temperatures approached unity (>0.99), and the qe value was in neat alignment with qe(exp) for the pseudo-second-order model. As also presented in Table 7, the pseudo-second-order model provided an excellent fit to the experimental data, with an R2adj value > 0.99 and an RMSE < 0.30 under different temperatures. These metrics are superior to those of the pseudo-first-order model and intra-particle diffusion model. Consequently, pseudo-second-order models demonstrated greater accuracy in describing the kinetic behavior of the adsorption of MB using the PGTZ material. The high correlation with the pseudo-second-order model suggests a chemisorption process where the availability of adsorption sites predominantly controls the adsorption rate, rather than mass transfer diffusion alone.
Table 7.
The constants and correlation coefficients of various kinetic models for adsorption of MB onto PGTZ.
However, the pseudo-second-order model failed to identify the rate-limiting step. Thus, intra-particle diffusion was used to examine this controlling mechanism in the adsorption process [58,67,69]. Usually, the instantaneous or external surface adsorption, diffusion to inner active sites, and equilibrium stage or saturation were the three steps identified in the adsorption mechanism and were presumed to be rate control steps. However, two distinct straight lines with different slopes for 25–35 °C adsorption temperature were observed, and none of them passed through the origin in this study. Namely, the multi-linear plot with segments not passing through the origin indicates a multi-stage adsorption process (see Figure S8). From Table 7, the initial steep portion (Kid1) likely corresponds to the rapid external surface adsorption or film diffusion, while the subsequent gentler slope (Kid2) is attributed to the slower intraparticle diffusion. The non-zero intercept confirms that intraparticle diffusion is not the sole rate-controlling step throughout the process. Diffusion to internal sites likely constituted the rate-limiting step due to lower Kid values. Consequently, MB adsorption onto PGTZ was accurately described by the pseudo-second-order model incorporating intraparticle diffusion.
3.8. Thermodynamic Investigation and Estimation of Activation Energy
The thermodynamic parameters and activation energy supply constructive information relating to the adsorption process. Key thermodynamic parameters—Gibbs free energy (ΔG), enthalpy (ΔH), entropy (ΔS), and activation energy (Ea)—were calculated using Equations (11)–(13) and are presented in Table 8 and Figure 7.
where ΔH = enthalpy (kJ·mol−1); ΔS = entropy (J·mol−1·K−1); ΔG = Gibbs free energy (kJ·mol−1); KL = adsorption equilibrium constant (L·mol−1); R = gas constant (8.314 J·mol−1·K−1); T = absolute temperature (K); Ea = activation energy (kJ·mol−1); k2 = pseudo-second-order rate constant (g·mol−1·s−1); and A = Arrhenius pre-exponential factor (g·mol−1·s−1). Positive ΔH (40.75 kJ·mol−1) and ΔS (151.86 J·mol−1·K−1) values confirm endothermicity and viability of the MB removal process. The magnitude of the ΔH value (~40 kJ·mol−1) further suggests that MB uptake on PGTZ is chemisorptive in nature, as it exceeds the typical threshold for physisorption. The positive value of ΔS indicates an increase in randomness at the solid-solution interface during adsorption. This is likely due to the displacement of water molecules or counter-ions from the zeolite surface by the MB cations, which are then released into the solution, increasing its disorder. The calculated ΔG values of this adsorption process are −4.53, −5.29, and −6.05 for 25 °C, 30 °C, and 35 °C, respectively. The negative ΔG values confirm the feasible and spontaneous process of MB removal using the PGTZ material. Via the slope in Figure 7, Ea was calculated to be 28.78 kJ·mol−1, again indicating the chemisorptive interactions between MB and PGTZ material in nature. To facilitate reproducibility and provide a clear overview, we summarize all key model parameters in Table S4.
Table 8.
Thermodynamic parameters for the adsorption of MB onto PGTZ.
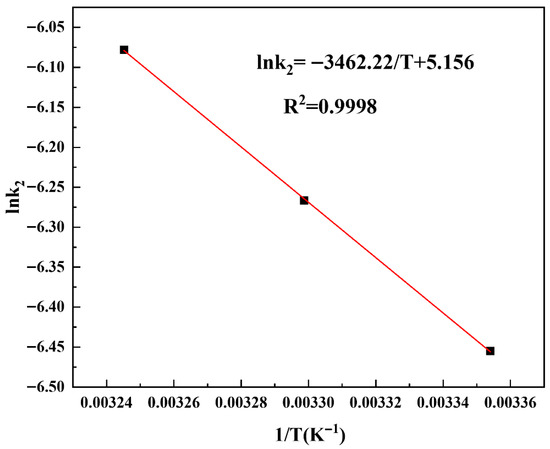
Figure 7.
Plot of lnk2 versus T−1.
3.9. Reusability of PGTZ
Dye adsorption onto PGTZ surfaces constitutes a reversible process. The reusability of PGTZ is a noteworthy feature in terms of justifying its economic viability. To assess the reusability of PGTZ, a comparison of MB uptake capacity with both fresh and regenerated PGTZ was carried out (see Figure 8). Furthermore, regeneration was performed via the “NaCl regeneration” method based on reports from the literature. It was found that the qe for MB adsorption decreased to 16.87 mg·g−1 after the fifth regeneration, roughly 77% of the qe of fresh PGTZ material. The gradual decrease in qe over five cycles is attributed to the irreversible occupation of some active sites or potential pore blockage by strongly adsorbed dye molecules that NaCl washing could not remove [70]. Moreover, a minor loss of crystallinity or structural changes by residual dye could also be contributing factors. The mild NaCl solution was selected for regeneration to minimize chemical consumption and potential damage to the adsorbent structure. However, more rigorous regeneration methods, such as washing with organic solvents (e.g., ethanol) or mild thermal treatment, could potentially restore performance more effectively by removing more stubborn dye molecules. Exploring these alternative regeneration strategies to improve cycling stability is our key research direction for future work. While this study demonstrates the excellent reusability of the PGTZ adsorbent, a complete circular economy approach would also involve the recovery and reuse of the MB dye itself. A valuable direction for future work would be to develop methods for the concentration, purification, and reuse of the MB desorbed from the spent adsorbent, thereby closing the material loop entirely.
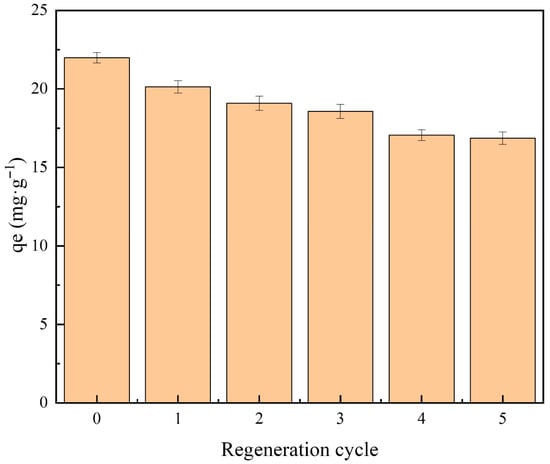
Figure 8.
Comparison of MB uptake capacity using fresh and regenerated PGTZ. (PGTZ dosage = 0.6 g·100 mL−1; initial MB concentration = 200 mg·L−1; temperature = 25 °C; contact time = 200 min; pH = 6.0).
4. Conclusions
A novel PGTZ material was synthesized from PGT via alkaline fusion and hydrothermal treatment and was utilized for adsorption of MB from an aqueous solution. The MB adsorption process onto the PGTZ material was optimized by employing a multivariate BBD approach in combination with RSM. The optimization goal for the maximum qe of MB was determined to be a PGTZ dosage of 5.31 g·L−1, an initial MB concentration of 294.59, an initial pH of 7.42, and an adsorption time of 187.89 min at the temperature of 25 °C. Under the optimized conditions, a maximum adsorption capacity of approximately 31.65 mg·g−1 was achieved for MB. The Langmuir isotherm (R2 = 0.9834−0.9869, 25–35 °C) best described MB equilibrium adsorption onto PGTZ. Kinetic analysis at multiple temperatures confirmed the pseudo-second-order model’s applicability, complemented by intraparticle diffusion. A thermodynamic study showed that the values of ΔH (40.75 kJ·mol−1) and ΔG (−4.53, −5.29, and −6.05 kJ·mol−1 at 25, 30, and 35 °C, respectively) confirm an endothermic and spontaneous adsorption process. Meanwhile, the activation energy (Ea) was calculated to be 28.78 kJ·mol−1, indicating the strong chemical interactions between MB and PGTZ. After NaCl regeneration, the qe for MB of PGTZ dropped to 16.87 mg·g−1 after at least five adsorption–desorption cycles, which is approximately 77% of the capacity of fresh PGTZ. The PGTZ adsorbent shows promise for the treatment of dye-contaminated wastewater, particularly in scenarios where a cost-effective, waste-derived material is advantageous. Future research should focus on scaling up the synthesis, testing the adsorbent in continuous-flow systems and with real industrial effluents, and exploring more rigorous regeneration techniques to further improve its reusability.
Supplementary Materials
The following supporting information can be downloaded at: https://www.mdpi.com/article/10.3390/separations12100286/s1, Table S1: Heavy metal content in PGT; Table S2: Examined factors assigned in the Box-Behnken design of RSM with experimental values of responses qe; Table S3: Comparison of maximum adsorption capacity of MB on various adsorbents [71,72,73,74,75,76,77,78,79,80,81,82,83,84]; Table S4: The compact parameter summary; Figure S1: The N2 adsorption-desorption isotherms of the PGTZ; Figure S2: Pareto diagram of the standardized effects; Figure S3: Zeta potential of PGTZ as a function of pH; Figure S4: Linear regression analysis of (a) Langmuir isotherm plots; (b) Freundlich isotherm plots; (c) Tempkin isotherm plots.; Figure S5: Linear regression analysis of D-R isotherm plots; Figure S6: Non-linear regression analysis of (A) Langmuir isotherm plots; (B) Freundlich isotherm plots; (C) Tempkin isotherm plots and (D) D-R isotherm plots; Figure S7: Pseudo-first-order model kinetic plots; Figure S8.: Pseudo-second-order model kinetic plots; Figure S9: Intra-particle diffusion model kinetic plots.
Author Contributions
C.L.: Data curation, Formal Analysis, Investigation, Methodology, Visualization, Writing—Original Draft, Funding Acquisition, Project administration. J.Y.: Investigation, Writing-review & editing. S.L.: Formal Analysis, Investigation. N.L.: Methodology, Writing-review & editing. L.Z.: Data curation, Formal Analysis. L.R.: Data curation, Writing-review & editing. All authors have read and agreed to the published version of the manuscript.
Funding
The authors are grateful for the Project funded by the Major Science and Technology Innovation Plan Project of Jingmen (No. 2023ZDYF004) and Scientific Research Project of Education Department of Hubei Province (No. F2023026).
Data Availability Statement
Data is contained within the article or Supplementary Material.
Conflicts of Interest
The authors declare that they have no known competing financial interests or personal relationships that could have appeared to influence the work reported in this paper.
References
- Rahimi, Z.; Zinatizadeh, A.A.; Zinadini, S.; van Loosdrecht, M. A Hydrophilic and Antifouling Nanofiltration Membrane Modified by Citric Acid Functionalized Tannic Acid (CA-f-TA) Nanocomposite for Dye Removal from Biologically Treated Baker’s Yeast Wastewater. J. Environ. Chem. Eng. 2021, 9, 104963. [Google Scholar] [CrossRef]
- Pai, S.; Kini, M.S.; Selvaraj, R. A Review on Adsorptive Removal of Dyes from Wastewater by Hydroxyapatite Nanocomposites. Environ. Sci. Pollut. Res. 2021, 28, 11835–11849. [Google Scholar] [CrossRef] [PubMed]
- Bagotia, N.; Sharma, A.K.; Kumar, S. A Review on Modified Sugarcane Bagasse Biosorbent for Removal of Dyes. Chemosphere 2021, 268, 129309. [Google Scholar] [CrossRef]
- Ren, J.; Li, R.; Wang, X.; Li, M.; Yang, W. A Superabsorbent Hydrogel for Removal of Dyes from Aqueous Solution. J. Polym. Environ. 2022, 30, 3327–3339. [Google Scholar] [CrossRef]
- Jawad, A.H.; Abdulhameed, A.S.; Mastuli, M.S. Acid-Factionalized Biomass Material for Methylene Blue Dye Removal: A Comprehensive Adsorption and Mechanism Study. J. Taibah Univ. Sci. 2020, 14, 305–313. [Google Scholar] [CrossRef]
- Turan-Ertas, T. Biological and Physical-Chemical Treatment of Textile Dyeing Wastewater for Color and COD Removal. Ozone-Sci. Eng. 2001, 23, 199–206. [Google Scholar] [CrossRef]
- Vaiano, V.; Iervolino, G.; Rizzo, L.; Sannino, D. Advanced Oxidation Processes for the Removal of Food Dyes in Wastewater. Curr. Org. Chem. 2017, 21, 1068–1073. [Google Scholar] [CrossRef]
- Thillainayagam, B.P.; Nagalingam, R.; Saravanan, P. Batch and Column Studies on Removal of Methylene Blue Dye by Microalgae Biochar. Biomass Convers. Biorefinery 2022, 13, 10327–10342. [Google Scholar] [CrossRef]
- Rakass, S.; Oudghiri Hassani, H.; Mohmoud, A.; Kooli, F.; Abboudi, M.; Assirey, E.; Al Wadaani, F. Highly Efficient Methylene Blue Dye Removal by Nickel Molybdate Nanosorbent. Molecules 2021, 26, 1378. [Google Scholar] [CrossRef]
- Kenawy, E.-R.; Tenhu, H.; Khattab, S.A.; Eldeeb, A.A.; Azaam, M.M. Highly Efficient Adsorbent Material for Removal of Methylene Blue Dye Based on Functionalized Polyacrylonitrile. Eur. Polym. J. 2022, 169, 111138. [Google Scholar] [CrossRef]
- Gong, X.; Tian, W.; Wang, L.; Bai, J.; Qiao, K.; Zhao, J. Biological Regeneration of Brewery Spent Diatomite and Its Reuse in Basic Dye and Chromium (III) Ions Removal. Process. Saf. Environ. Prot. 2019, 128, 353–361. [Google Scholar] [CrossRef]
- Przystaś, W.; Zabłocka-Godlewska, E.; Grabińska-Sota, E. Biological Removal of Azo and Triphenylmethane Dyes and Toxicity of Process By-Products. Water Air Soil Pollut. 2012, 223, 1581–1592. [Google Scholar] [CrossRef]
- Bhatia, D.; Sharma, N.R.; Singh, J.; Kanwar, R.S. Biological Methods for Textile Dye Removal from Wastewater: A Review. Crit. Rev. Environ. Sci. Technol. 2017, 47, 1836–1876. [Google Scholar] [CrossRef]
- Ihaddaden, S.; Aberkane, D.; Boukerroui, A.; Robert, D. Removal of Methylene Blue (Basic Dye) by Coagulation-Flocculation with Biomaterials (Bentonite and Opuntia Ficus Indica). J. Water. Process. Eng. 2022, 49, 102952. [Google Scholar] [CrossRef]
- Bustos-Terrones, Y.A.; Hermosillo-Nevárez, J.J.; Ramírez-Pereda, B.; Vaca, M.; Rangel-Peraza, J.G.; Bustos-Terrones, V.; Rojas-Valencia, M.N. Removal of BB9 Textile Dye by Biological, Physical, Chemical, and Electrochemical Treatments. J. Taiwan Inst. Chem. Eng. 2021, 121, 29–37. [Google Scholar] [CrossRef]
- Piaskowski, K.; Świderska-Dąbrowska, R.; Zarzycki, P.K. Dye Removal from Water and Wastewater Using Various Physical, Chemical, and Biological Processes. J. AOAC. Int. 2018, 101, 1371–1384. [Google Scholar] [CrossRef] [PubMed]
- Katheresan, V.; Kansedo, J.; Lau, S.Y. Efficiency of Various Recent Wastewater Dye Removal Methods: A Review. J. Environ. Chem. Eng. 2018, 6, 4676–4697. [Google Scholar] [CrossRef]
- Ledakowicz, S.; Paździor, K. Recent Achievements in Dyes Removal Focused on Advanced Oxidation Processes Integrated with Biological Methods. Molecules 2021, 26, 870. [Google Scholar] [CrossRef]
- Alshehri, A.A.; Alharbi, L.M.; Malik, M.A. Chitosan-Templated Synthesis of Fe2O3, NiO, and NiFe2O4 Nanoparticles for Efficient Methylene Blue Dye Removal. Polymers 2025, 17, 2750. [Google Scholar] [CrossRef]
- Yasin, S.A.; Sharaf Zeebaree, S.Y.; Sharaf Zeebaree, A.Y.; Haji Zebari, O.I.; Saeed, I.A. The Efficient Removal of Methylene Blue Dye Using CuO/PET Nanocomposite in Aqueous Solutions. Catalysts 2021, 11, 241. [Google Scholar] [CrossRef]
- Kadhom, M.; Albayati, N.; Alalwan, H.; Al-Furaiji, M. Removal of Dyes by Agricultural Waste. Sustain. Chem. Pharm. 2020, 16, 100259. [Google Scholar] [CrossRef]
- Sriram, G.; Bendre, A.; Mariappan, E.; Altalhi, T.; Kigga, M.; Ching, Y.C.; Jung, H.-Y.; Bhaduri, B.; Kurkuri, M. Recent Trends in the Application of Metal-Organic Frameworks (MOFs) for the Removal of Toxic Dyes and Their Removal Mechanism-a Review. Sustain. Mater. Technol. 2022, 31, e00378. [Google Scholar] [CrossRef]
- Salama, A.; Shoueir, K.R.; Aljohani, H.A. Preparation of Sustainable Nanocomposite as New Adsorbent for Dyes Removal. Fibers Polym. 2017, 18, 1825–1830. [Google Scholar] [CrossRef]
- Li, Z.; Yang, P.; Gao, Z.; Song, M.; Fang, Q.; Xue, M.; Qiu, S. A New ZIF Molecular-Sieving Membrane for High-Efficiency Dye Removal. Chem. Commun. 2019, 55, 3505–3508. [Google Scholar] [CrossRef]
- Zhao, Y.; Yang, Q.; Yan, B.; Liu, B.; Gu, Y.; Lin, Y.; Shang, J.; Liu, W.; Chen, S.; Lan, J. Aminated Polyacrylonitrile Nanofiber Membranes for the Removal of Organic Dyes. ACS Appl. Nano Mater. 2022, 5, 1131–1140. [Google Scholar] [CrossRef]
- Kim, H.-J.; Lee, U.; Kim, H.-W.; Cho, M.; Lee, J. Zero Discharge of Dyes and Regeneration of a Washing Solution in Membrane-Based Dye Removal by Cold Plasma Treatment. Membranes 2022, 12, 546. [Google Scholar] [CrossRef]
- Aragaw, T.A.; Bogale, F.M. Biomass-Based Adsorbents for Removal of Dyes From Wastewater: A Review. Front. Environ. Sci. 2021, 9, 764958. [Google Scholar] [CrossRef]
- Okoniewska, E. Removal of Selected Dyes on Activated Carbons. Sustainability 2021, 13, 4300. [Google Scholar] [CrossRef]
- Tara, N.; Siddiqui, S.I.; Rathi, G.; Chaudhry, S.A.; Inamuddin; Asiri, A.M. Nano-Engineered Adsorbent for the Removal of Dyes from Water: A Review. Curr. Anal. Chem. 2020, 16, 14–40. [Google Scholar] [CrossRef]
- El Maguana, Y.; Elhadiri, N.; Benchanaa, M.; Chikri, R. Activated Carbon for Dyes Removal: Modeling and Understanding the Adsorption Process. J. Chem. 2020, 2020, 2096834. [Google Scholar] [CrossRef]
- Momtazan, F.; Vafaei, A.; Ghaedi, M.; Ghaedi, A.M.; Emadzadeh, D.; Lau, W.-J.; Baneshi, M.M. Application of Copper Sulfide Nanoparticles Loaded Activated Carbon for Simultaneous Adsorption of Ternary Dyes: Response Surface Methodology. Korean J. Chem. Eng. 2018, 35, 1108–1118. [Google Scholar] [CrossRef]
- Wang, Y.; Ji, Q.; Li, H. Preparation, Characterization of Chitin-Based Activated Carbon for Orange II Removal. BioResources 2023, 18, 5041–5056. [Google Scholar] [CrossRef]
- Yousef, T.A.; Sahu, U.K.; Jawad, A.H.; Abd Malek, N.N.; Al Duaij, O.K.; ALOthman, Z.A. Fruit Peel-Based Mesoporous Activated Carbon via Microwave Assisted K2 CO3 Activation: Box Behnken Design and Desirability Function for Methylene Blue Dye Adsorption. Int. J. Phytoremediat. 2023, 25, 1142–1154. [Google Scholar] [CrossRef] [PubMed]
- Chumee, J.; Javadi, B.; Peungsamran, N.; Kumpun, S.; Seekakee, J.; Hoonsuwan, T.; Ohama, P. Synthesis of Zeolite P-Metal Organic Composite Beads for Superior Cationic Dye Removal. Inorg. Chem. Commun. 2025, 177, 114344. [Google Scholar] [CrossRef]
- Jia, X.; Kanbaiguli, M.; Zhang, B.; Huang, Y.; Peydayesh, M.; Huang, Q. Anisotropic Chitosan-Nanocellulose/Zeolite Imidazolate Frameworks-8 Aerogel for Sustainable Dye Removal. J. Colloid Interface Sci. 2024, 676, 298–309. [Google Scholar] [CrossRef] [PubMed]
- Majid, Z.; AbdulRazak, A.A.; Noori, W.A.H. Modification of Zeolite by Magnetic Nanoparticles for Organic Dye Removal. Arab. J. Sci. Eng. 2019, 44, 5457–5474. [Google Scholar] [CrossRef]
- Rakanović, M.; Vukojević, A.; Savanović, M.M.; Armaković, S.; Pelemiš, S.; Živić, F.; Sladojević, S.; Armaković, S.J. Zeolites as Adsorbents and Photocatalysts for Removal of Dyes from the Aqueous Environment. Molecules 2022, 27, 6582. [Google Scholar] [CrossRef]
- Hassoune, H.; Lahhit, M.; Khalid, A.; Lachehab, A. Application of Leaching Tests on Phosphogypsum by Infiltration-Percolation. Water Sci. Technol. 2017, 76, 1844–1851. [Google Scholar] [CrossRef]
- Msila, X.; Billing, D.G.; Barnard, W. Capture and Storage of CO2 into Waste Phosphogypsum: The Modified Merseburg Process. Clean Technol. Environ. Policy 2016, 18, 2709–2715. [Google Scholar] [CrossRef]
- Peng, B.; Yang, Z.; Yang, Z.; Peng, J. Effects of pH and Fineness of Phosphogypsum on Mechanical Performance of Cement–Phosphogypsum-Stabilized Soil and Classification for Road-Used Phosphogypsum. Coatings 2020, 10, 1021. [Google Scholar] [CrossRef]
- Du, M.; Wang, J.; Dong, F.; Wang, Z.; Yang, F.; Tan, H.; Fu, K.; Wang, W. The Study on the Effect of Flotation Purification on the Performance of α-Hemihydrate Gypsum Prepared from Phosphogypsum. Sci. Rep. 2022, 12, 95. [Google Scholar] [CrossRef] [PubMed]
- Filippov, L.O.; Duverger, A.; Filippova, I.V.; Kasaini, H.; Thiry, J. Selective Flotation of Silicates and Ca-Bearing Minerals: The Role of Non-Ionic Reagent on Cationic Flotation. Miner. Eng. 2012, 36–38, 314–323. [Google Scholar] [CrossRef]
- Qi, M.; Peng, W.; Wang, W.; Cao, Y.; Fan, G.; Huang, Y. Simple and Efficient Method for Purification and Recovery of Gypsum from Phosphogypsum: Reverse-Direct Flotation and Mechanism. J. Mol. Liq. 2023, 371, 121111. [Google Scholar] [CrossRef]
- Zhang, H.; Chai, W.; Cao, Y. Flotation Separation of Quartz from Gypsum Using Benzyl Quaternary Ammonium Salt as Collector. Appl. Surf. Sci. 2022, 576, 151834. [Google Scholar] [CrossRef]
- Li, C.; Zhong, H.; Wang, S.; Xue, J.; Zhang, Z. Removal of Basic Dye (Methylene Blue) from Aqueous Solution Using Zeolite Synthesized from Electrolytic Manganese Residue. J. Ind. Eng. Chem. 2015, 23, 344–352. [Google Scholar] [CrossRef]
- GB36600—2018; Soil Environmental Quality Risk Control Standard for Soil Contamination of Development Land. China Environmental Science Press: Beijing, China, 2019.
- Murakami, T.; Sugano, Y.; Kinami, T.; Narushima, T.; Iguchi, Y.; Ouchi, C. Alkali Hydrothermal Synthesis of Zeolite A Using Oxide By-Products. ISIJ Int. 2011, 51, 158–165. [Google Scholar] [CrossRef]
- Sugano, Y.; Sahara, R.; Murakami, T.; Narushima, T.; Iguchi, Y.; Ouchi, C. Hydrothermal Synthesis of Zeolite A Using Blast Furnace Slag. ISIJ Int. 2005, 45, 937–945. [Google Scholar] [CrossRef]
- Zhang, K.; Van Dyk, L.; He, D.; Deng, J.; Liu, S.; Zhao, H. Synthesis of Zeolite from Fly Ash and Its Adsorption of Phosphorus in Wastewater. Green Process. Synth. 2021, 10, 349–360. [Google Scholar] [CrossRef]
- Liu, W.; Aldahri, T.; Xu, C.; Li, C.; Rohani, S. Synthesis of Sole Gismondine-Type Zeolite from Blast Furnace Slag during CO2 Mineralization Process. J. Environ. Chem. Eng. 2021, 9, 104652. [Google Scholar] [CrossRef]
- Khalid, H.R.; Lee, N.K.; Park, S.M.; Abbas, N.; Lee, H.K. Synthesis of Geopolymer-Supported Zeolites via Robust One-Step Method and Their Adsorption Potential. J. Hazard. Mater. 2018, 353, 522–533. [Google Scholar] [CrossRef]
- Ren, X.; Xiao, L.; Qu, R.; Liu, S.; Ye, D.; Song, H.; Wu, W.; Zheng, C.; Wu, X.; Gao, X. Synthesis and Characterization of a Single Phase Zeolite A Using Coal Fly Ash. RSC Adv. 2018, 8, 42200–42209. [Google Scholar] [CrossRef] [PubMed]
- Mlonka-Mędrala, A.; Hasan, T.; Kalawa, W.; Sowa, M.; Sztekler, K.; Pinto, M.L.; Mika, Ł. Possibilities of Using Zeolites Synthesized from Fly Ash in Adsorption Chillers. Energies 2022, 15, 7444. [Google Scholar] [CrossRef]
- GB 6566-2010; Specification for Limit of Radionuclide Inbuilding Stone. China Standard Press: Beijing, China, 2011.
- Avramović, J.M.; Veličković, A.V.; Stamenković, O.S.; Rajković, K.M.; Milić, P.S.; Veljković, V.B. Optimization of Sunflower Oil Ethanolysis Catalyzed by Calcium Oxide: RSM versus ANN-GA. Energy Convers. Manag. 2015, 105, 1149–1156. [Google Scholar] [CrossRef]
- Pavlović, M.D.; Buntić, A.V.; Mihajlovski, K.R.; Šiler-Marinković, S.S.; Antonović, D.G.; Radovanović, Ž.; Dimitrijević-Branković, S.I. Rapid Cationic Dye Adsorption on Polyphenol-Extracted Coffee Grounds—A Response Surface Methodology Approach. J. Taiwan Inst. Chem. Eng. 2014, 45, 1691–1699. [Google Scholar] [CrossRef]
- Krupa, A.N.D.; Abigail, M.E.A.; Santhosh, C.; Grace, A.N.; Vimala, R. Optimization of Process Parameters for the Microbial Synthesis of Silver Nanoparticles Using 3-Level Box–Behnken Design. Ecol. Eng. 2016, 87, 168–174. [Google Scholar] [CrossRef]
- Parvizi Ghaleh, S.; Khodapanah, E.; Tabatabaei-Nezhad, S.A. Comprehensive Monolayer Two-Parameter Isotherm and Kinetic Studies of Thiamine Adsorption on Clay Minerals: Experimental and Modeling Approaches. J. Mol. Liq. 2020, 306, 112942. [Google Scholar] [CrossRef]
- Jethave, G.; Fegade, U.; Attarde, S.; Ingle, S. Facile Synthesis of Lead Doped Zinc-Aluminum Oxide Nanoparticles (LD-ZAO-NPs) for Efficient Adsorption of Anionic Dye: Kinetic, Isotherm and Thermodynamic Behaviors. J. Ind. Eng. Chem. 2017, 53, 294–306. [Google Scholar] [CrossRef]
- Njuguna, D.G.; Schönherr, H. Xanthan Gum Hydrogels as High-Capacity Adsorbents for Dye Removal. ACS Appl. Polym. Mater. 2021, 3, 3142–3152. [Google Scholar] [CrossRef]
- Wang, H.; Zhou, P.; Guo, R.; Wang, Y.; Zhan, H.; Yuan, Y. Synthesis of Rectorite/Fe3O4/ZnO Composites and Their Application for the Removal of Methylene Blue Dye. Catalysts 2018, 8, 107. [Google Scholar] [CrossRef]
- Khan, M.A.; Ahmad, A.; Umar, K.; Nabi, S.A. Synthesis, Characterization, and Biological Applications of Nanocomposites for the Removal of Heavy Metals and Dyes. Ind. Eng. Chem. Res. 2015, 54, 76–82. [Google Scholar] [CrossRef]
- Sharma, K.; Dalai, A.K.; Vyas, R.K. Removal of Synthetic Dyes from Multicomponent Industrial Wastewaters. Rev. Chem. Eng. 2017, 34, 107–134. [Google Scholar] [CrossRef]
- He, H.; Luo, Z.; Yu, C. Diatomite-Anchored g-C3N4 Nanosheets for Selective Removal of Organic Dyes. J. Alloys Compd. 2020, 816, 152652. [Google Scholar] [CrossRef]
- Crini, G.; Torri, G.; Lichtfouse, E.; Kyzas, G.Z.; Wilson, L.D.; Morin-Crini, N. Dye Removal by Biosorption Using Cross-Linked Chitosan-Based Hydrogels. Environ. Chem. Lett. 2019, 17, 1645–1666. [Google Scholar] [CrossRef]
- Coura, J.C.; Profeti, D.; Profeti, L.P.R. Eco-Friendly Chitosan/Quartzite Composite as Adsorbent for Dye Removal. Mater. Chem. Phys. 2020, 256, 123711. [Google Scholar] [CrossRef]
- Abbasi, N.; Khan, S.A.; Khan, T.A. Response Surface Methodology Mediated Process Optimization of Celestine Blue B Uptake by Novel Custard Apple Seeds Activated Carbon/FeMoO4 Nanocomposite. J. Water Process. Eng. 2021, 43, 102267. [Google Scholar] [CrossRef]
- Saadi, R.; Saadi, Z.; Fazaeli, R.; Fard, N.E. Monolayer and Multilayer Adsorption Isotherm Models for Sorption from Aqueous Media. Korean J. Chem. Eng. 2015, 32, 787–799. [Google Scholar] [CrossRef]
- Thirunavukkarasu, A.; Nithya, R. Adsorption of Acid Orange 7 Using Green Synthesized CaO/CeO2 Composite: An Insight into Kinetics, Equilibrium, Thermodynamics, Mass Transfer and Statistical Models. J. Taiwan Inst. Chem. Eng. 2020, 111, 44–62. [Google Scholar] [CrossRef]
- Sverjensky, D.A.; Fukushi, K. Anion Adsorption on Oxide Surfaces: Inclusion of the Water Dipole in Modeling the Electrostatics of Ligand Exchange. Environ. Sci. Technol. 2006, 40, 263–271. [Google Scholar] [CrossRef]
- Fang, Y.; Yang, L.; Rao, F.; Zheng, Y.; Song, Z. Adsorption Behavior and Mechanism of MB, Pb(II) and Cu(II) on Porous Geopolymers. Ceram. Int. 2025, 51, 11455–11466. [Google Scholar] [CrossRef]
- Patel, P.; Gupta, S.; Mondal, P. Modeling and Optimization of Process Parameters of MB Dye Adsorption Using Waste-Derived Chemically Activated Biosorbents. Biomass Convers. Biorefinery 2022, 13, 13461–13480. [Google Scholar] [CrossRef]
- Zhou, G.; Wang, Q.; Song, R.; Li, S.; Yang, S.; Zhang, Q. Synthesis of Core-Double-Shell Structured Fe3O4@PDA/HKUST-1: Characterization Analysis and Adsorption Performance on Cationic MB Dyes. J. Phys. Chem. Solids 2023, 172, 111094. [Google Scholar] [CrossRef]
- Jaberi, H.; Emami, E.; Mousazadeh, M.H. CDs/HMS for Removal of MB Dye with Highly Adsorption Capacity: Isotherm, Kinetic, and Thermodynamic Study. Int. J. Environ. Sci. Technol. 2021, 19, 5167–5180. [Google Scholar] [CrossRef]
- Wang, R.; Shi, K.; Huang, D.; Zhang, J.; An, S. Synthesis and Degradation Kinetics of TiO2/GO Composites with Highly Efficient Activity for Adsorption and Photocatalytic Degradation of MB. Sci. Rep. 2019, 9, 18744. [Google Scholar] [CrossRef]
- Qiu, J.; Feng, Y.; Zhang, X.; Jia, M.; Yao, J. Acid-Promoted Synthesis of UiO-66 for Highly Selective Adsorption of Anionic Dyes: Adsorption Performance and Mechanisms. J. Colloid Interface Sci. 2017, 499, 151–158. [Google Scholar] [CrossRef]
- Alpat, S.K.; Özbayrak, Ö.; Alpat, Ş.; Akçay, H. The Adsorption Kinetics and Removal of Cationic Dye, Toluidine Blue O, from Aqueous Solution with Turkish Zeolite. J. Hazard. Mater. 2008, 151, 213–220. [Google Scholar] [CrossRef]
- Han, R.; Zhang, J.; Han, P.; Wang, Y.; Zhao, Z.; Tang, M. Study of Equilibrium, Kinetic and Thermodynamic Parameters about Methylene Blue Adsorption onto Natural Zeolite. Chem. Eng. J. 2009, 145, 496–504. [Google Scholar] [CrossRef]
- Wang, Q.; Wang, H.; Hu, X.; Fan, Z.; Wang, Y.; Ma, P.; Niu, J.; Wang, J. Synthesis and Structure of a Copper-Based Functional Network for Efficient Organic Dye Adsorption. Inorg. Chem. 2022, 61, 19764–19772. [Google Scholar] [CrossRef] [PubMed]
- Wu, C.; Zhao, Z.; Zhong, J.; Lv, Y.; Yan, X.; Wu, Y.; Zhang, H. Adsorption of Dye through Hydrochar Derived from Co-Hydrothermal Carbonization of Garden Waste and Sewage Sludge: The Adsorption Enhancement Mechanism of Lignin Component. J. Water Process. Eng. 2024, 67, 106233. [Google Scholar] [CrossRef]
- Taweekarn, T.; Wongniramaikul, W.; Boonkanon, C.; Phanrit, C.; Sriprom, W.; Limsakul, W.; Towanlong, W.; Phawachalotorn, C.; Choodum, A. Starch Biocryogel for Removal of Methylene Blue by Batch Adsorption. Polymers 2022, 14, 5543. [Google Scholar] [CrossRef]
- Deori, N.; Paul, S.; Lahkar, S.; Brahma, S. Ultrasonic-Assisted Nitrate Anion Incorporation in Triaminoguanidium Chloride Based Covalent Organic Polymer for Methylene Blue Dye Adsorption. Chem.-Asian J. 2024, 19, e202400046. [Google Scholar] [CrossRef]
- Taşdelen, B.; Çifçi, D.İ.; Meriç, S. Preparation and Characterization of Chitosan/AMPS/Kaolinite Composite Hydrogels for Adsorption of Methylene Blue. Polym. Bull. 2021, 79, 9643–9662. [Google Scholar] [CrossRef]
- Shukor, H.; Yaser, A.Z.; Shoparwe, N.F.; Makhtar, M.M.Z.; Mokhtar, N. Biosorption Study of Methylene Blue (MB) and Brilliant Red Remazol (BRR) by Coconut Dregs. Int. J. Chem. Eng. 2022, 2022, 8153617. [Google Scholar] [CrossRef]


Disclaimer/Publisher’s Note: The statements, opinions and data contained in all publications are solely those of the individual author(s) and contributor(s) and not of MDPI and/or the editor(s). MDPI and/or the editor(s) disclaim responsibility for any injury to people or property resulting from any ideas, methods, instructions or products referred to in the content. |
© 2025 by the authors. Licensee MDPI, Basel, Switzerland. This article is an open access article distributed under the terms and conditions of the Creative Commons Attribution (CC BY) license (https://creativecommons.org/licenses/by/4.0/).