1. Introduction
Electrodialysis is an advanced separation technology that uses an electric current to move ions through semi-permeable membranes. This process is commonly used in industry to desalinate water, concentrate solutions, and recover valuable ingredients [
1,
2,
3]. In electrodialysis, the solution is often placed between a cation-exchange membrane (permitting only positive ions) and an anion-exchange membrane (permitting only negative ions). Under the influence of an electric current, these ions are attracted to the electrodes with the opposite charge, passing through the appropriate membranes, which effectively separates them from the solution [
4,
5,
6,
7]. Bipolar membranes are also used in electrodialysis processes [
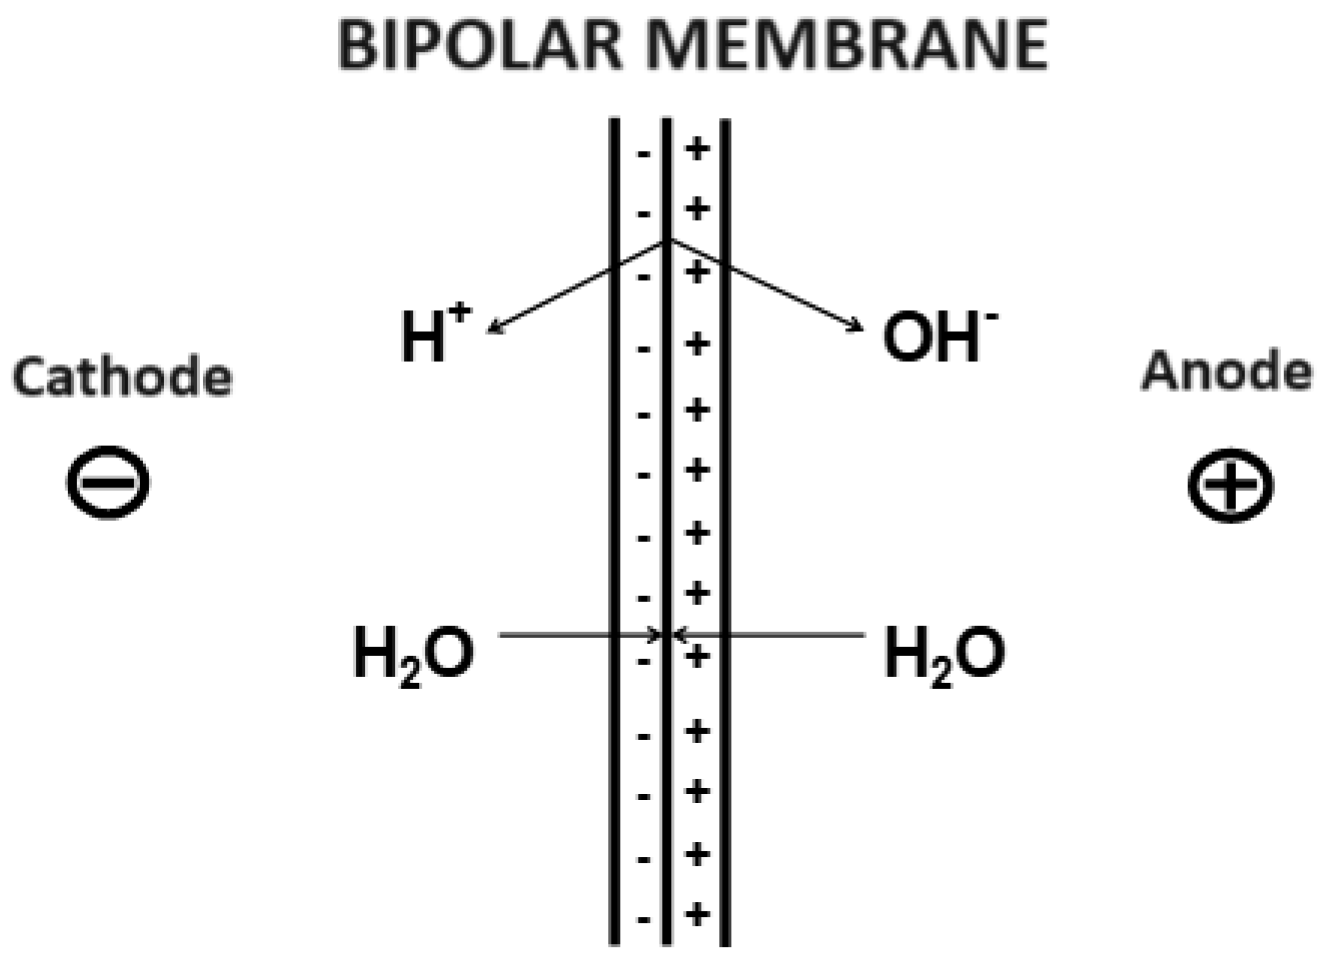
8]. Bipolar membranes are a particular type of membrane that can conduct cations and anions, making them extremely useful in electrodialysis processes. They are composed of two layers: a combined cation-selective membrane (with built-in functional groups with a negative electric charge) and an anion-selective membrane (with built-in functional groups with a positive electric charge) [
9]. A schematic diagram of a bipolar membrane is shown in
Figure 1. Bipolar membranes are a crucial element in reverse electrodialysis and bipolar membrane electrodialysis, which are technologies that enable even greater control over the separation process. Thanks to their unique ability to conduct both types of ions, bipolar membranes can open new opportunities for industry in efficient and sustainable resource management [
10]. The electrodialysis process is highly efficient and technologically sustainable, making it an attractive option for many industrial applications.
The electrodialysis process can be used to produce perrhenic acid, which is a secondary market product produced from rhenium [
11]. However, a critical aspect is the selection of appropriately selective and durable membranes tailored to specific needs [
12,
13,
14]. One of the known methods for the electrodialytic production of perrhenic acid is a process carried out in a seven-chamber reactor, where MA-40 anion exchange and MK-40 cation exchange membranes are installed alternately [
15]. However, this method has disadvantages. The first requirement is that multiple ion-exchange membranes are needed to construct a single-membrane cell [
16,
17,
18,
19]. Additionally, it is recommended to regularly remove the acid from the concentration chamber so that the HReO
4 concentration does not exceed >200 g/dm
3 [
20,
21]. When the concentration exceeds this value, both the selectivity and strength of the membranes used decrease significantly, which leads to a reduction in the transport of ReO
4− ions through the membrane and a reduction in the efficiency of the process [
22]. Moreover, the authors should have focused on analyzing the impurities in the obtained HReO
4 concentrate. Therefore, it is important to conduct additional research in this area to ensure the highest quality of the final product [
23,
24,
25,
26].
The method proposed in this article offers significant improvements in the production of perrhenic acid. The main advantage is the ability to produce high-purity perrhenic acid (less than <100 ppm of impurities) with a concentration of >100 g/dm3 HReO4. This method, based on a two-stage electrodialysis process, allows for the concentration of perrhenic acid that is >100 g/dm3 and its purification from potential impurities and ammonium ions. This approach is more effective and efficient compared to the methods mentioned above. Overall, the proposed solution offers significant improvements in efficiency, final product purity, and purification capabilities, making it an attractive choice for producing perrhenic acid.
This paper is centered on laboratory experiments aimed at producing high-purity perrhenic acid. A series of tests were conducted using the electrodialysis process, which involved four solutions: a diluate, a concentrate, an anolyte, and a catholyte. These investigations provided insights into how key process parameters—such as the flow rates of process streams, current densities, and concentrations of individual solutions—affect the purity of the resulting perrhenic acid. The objective of these tests was to identify the most optimal parameters for the electrodialysis process to yield high-purity perrhenic acid. Subsequent steps involved concentrating the perrhenic acid to a level exceeding 100 g/dm3, followed by a purification process to remove any impurities, which primarily include ammonium ions (NH4+). The culmination of this research was the development of a technological blueprint for the production of high-purity HReO4.
2. Materials and Method
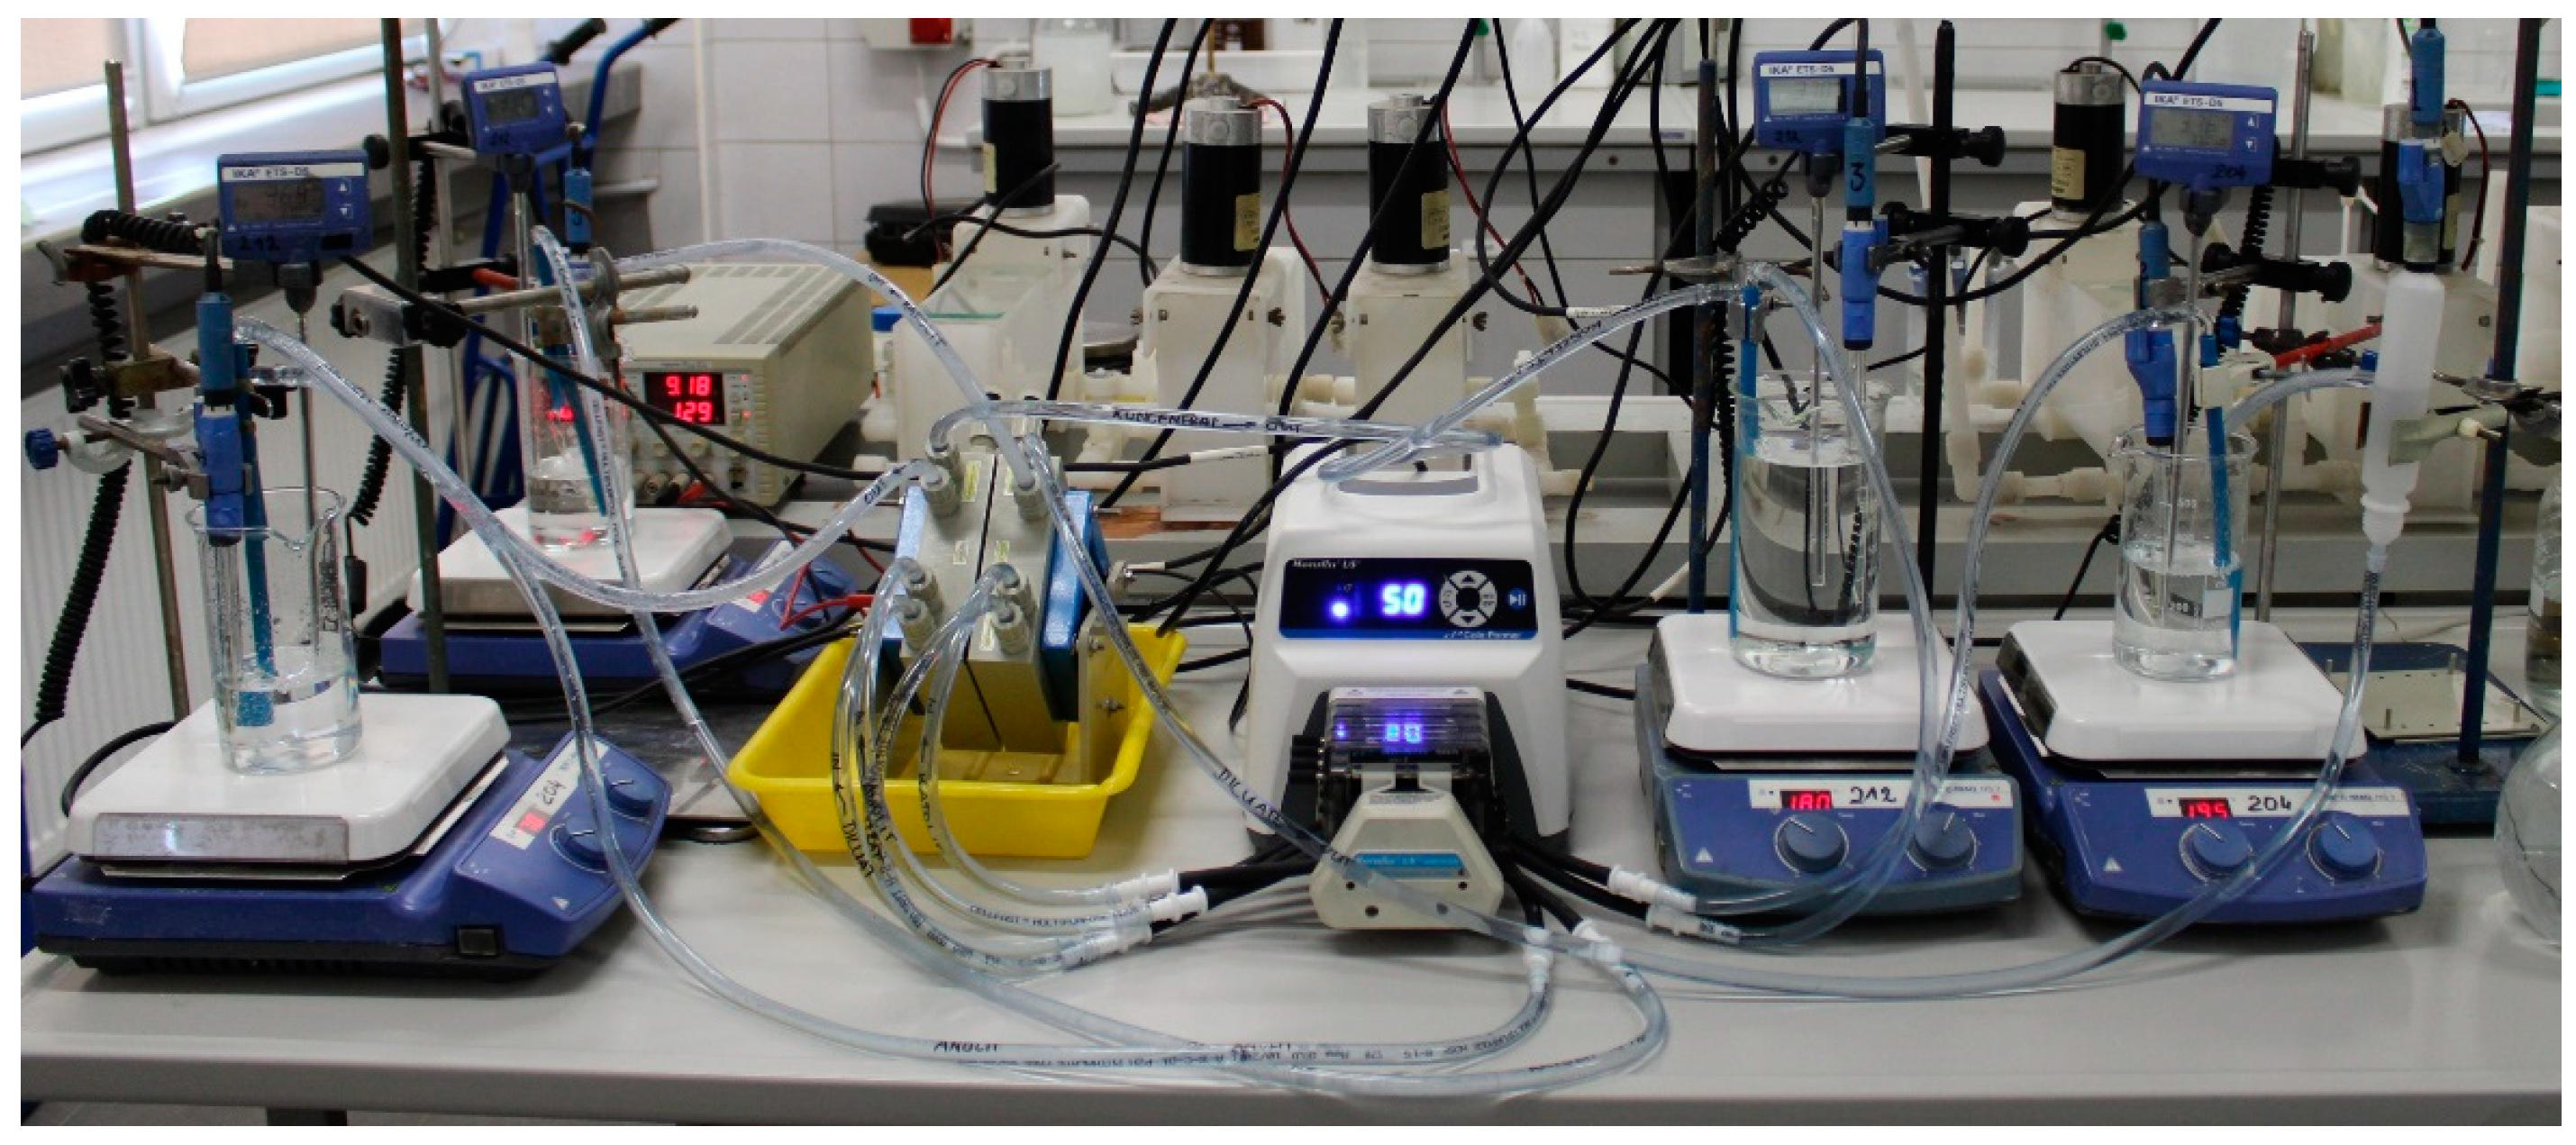
Trials in double-flow system (
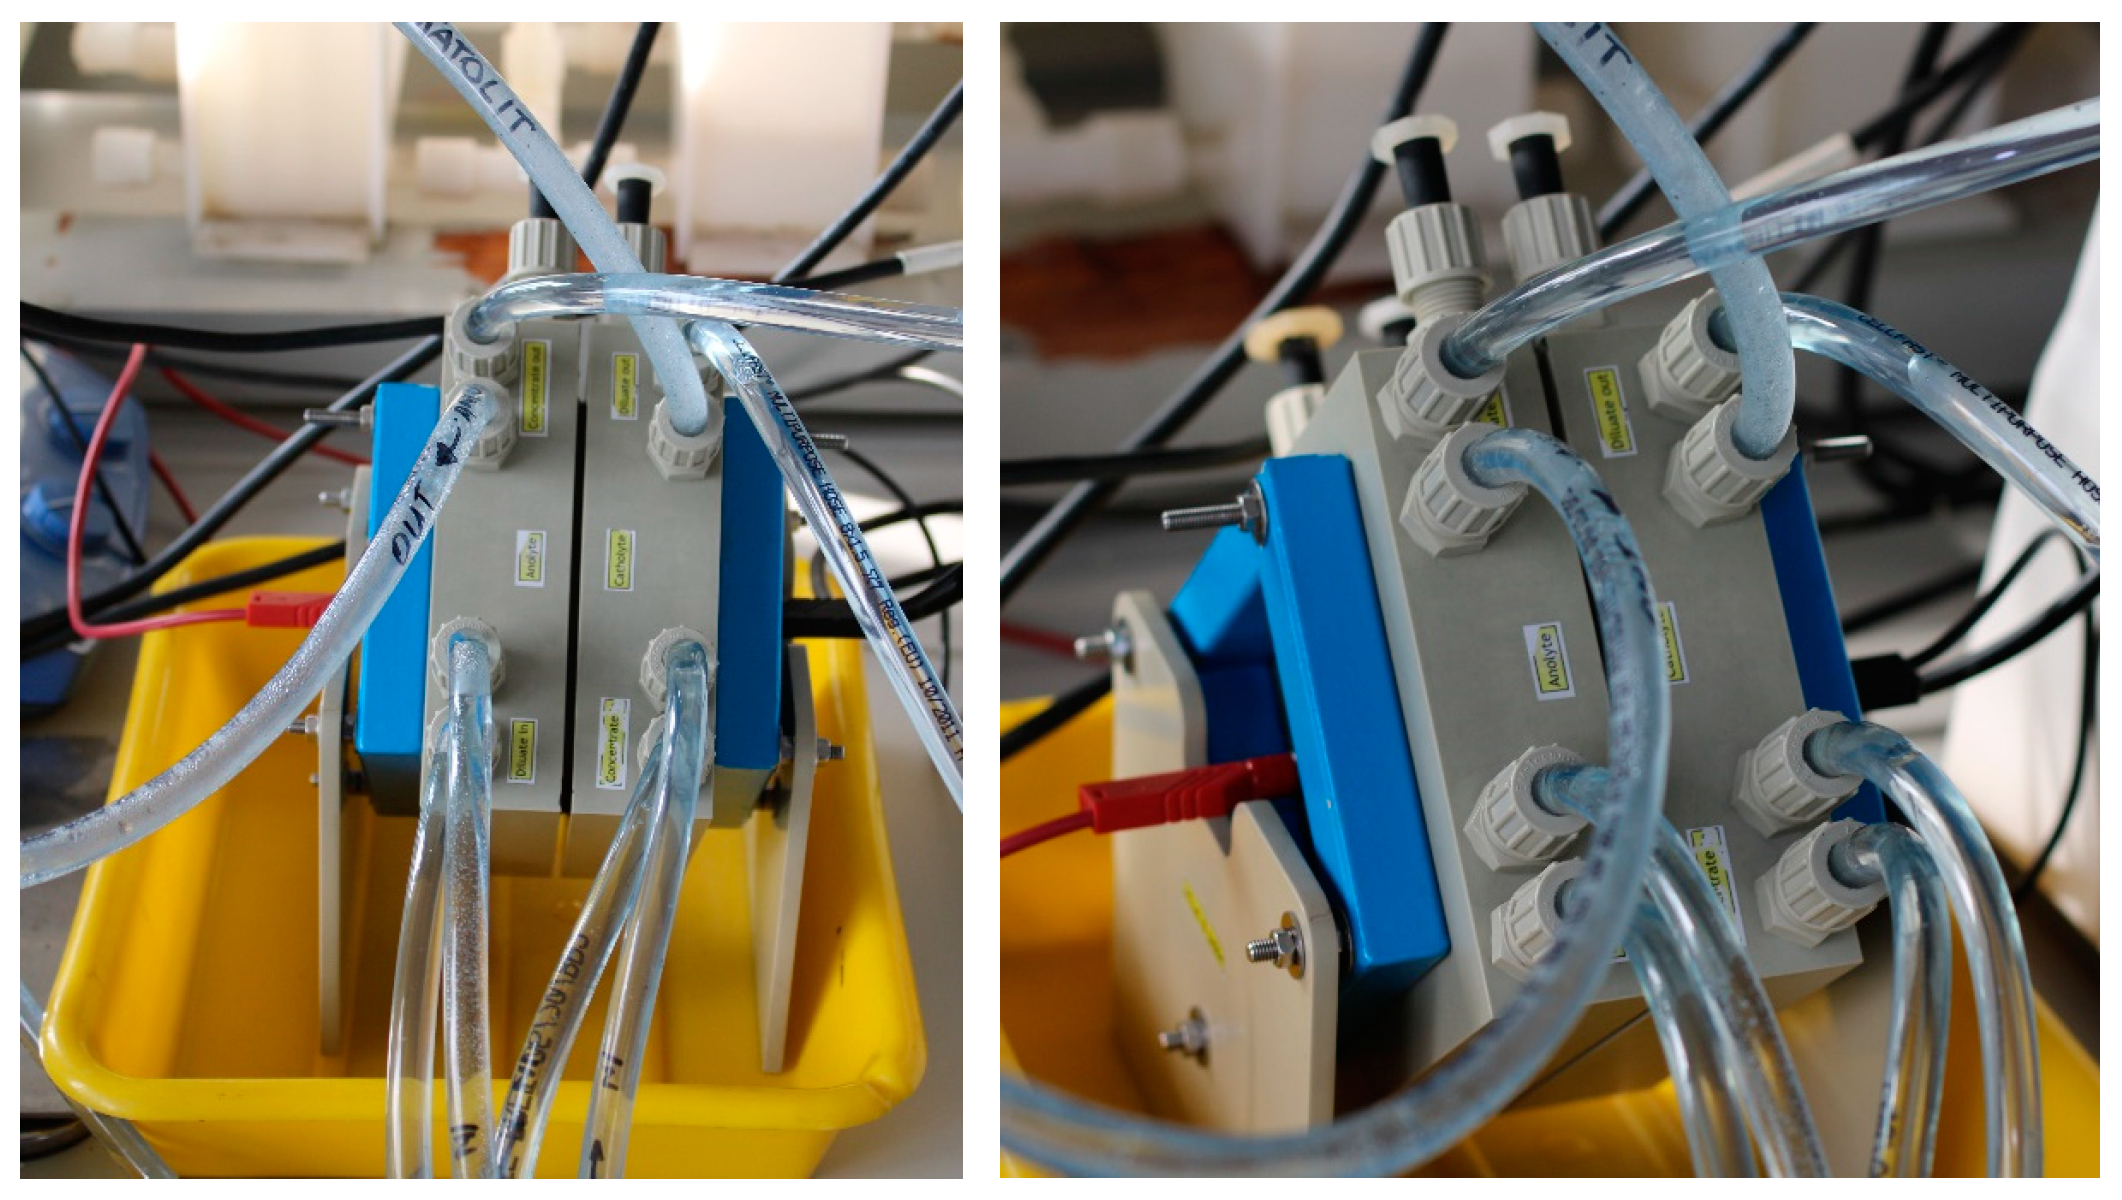
Figure 2) were performed using electrodialyser PC Cell ED 640 04 (
Figure 3), supplied by PCCell (Heusweiler, Germany), which enables use of 5 sets of membranes in a package, with 3 membranes of size 110 × 110 mm in each set, with active surface area of a membrane of 64 cm
2 (PCCell, Heusweiler, Germany). Additionally, a peristaltic pump with 4 working heads (Masterflex, Gelsenkirchen, Germany), 4 tanks for circulating solutions, power supply UTP3705S (Uni-T, Garwolin, Poland), 4 magnetic mixers with heating mode (IKA, Warsaw, Poland), and 5 pH meters (Endress+Hauser, Wroclaw, Poland) were used.
Temperature and pH of circulating solutions were continuously measured using pH meters from Endress+Hauser and electrodes CPS41D-7BC2B1, combined with recording system, in ten-second intervals. Four types of solutions with a set concentration were used: concentrate—perrhenic acid with a concentration of 40 g/dm3 HReO4, the diluate—ammonium perrhenate with a concentration of 25 g/dm3 NH4ReO4 (INNOVATOR sp. z.o.o., Gliwice, Poland), the catholyte—perrhenic acid with a concentration of 30 g/dm3 HReO4, and the anolyte—perrhenic acid—with a concentration of 30 g/dm3 HReO4. This perrhenic acid was obtained from secondary raw materials—superalloy scrap waste—generated during previous projects realized in Łukasiewicz—IMN. The concentrate was enriched and concentrated in the ReO4− ions from a second solution—diluate. Catholyte and anolyte were circulating solutions, in which cathode and anode were immersed. Process solutions were pumped by peristaltic pumps. This research used three types of membranes: bipolar PC bip, cation-exchange PC SK, and anion-exchange PC SA.
The membranes used for testing were characterized by low electrical resistance, high selectivity, and good chemical and mechanical resistance. Generally, the effect of ionoselectivity of membranes depends on the positively or negatively charged compounds built into their structures, which attract ions with varying strengths (allowing them to be transported through the membrane) or repel them (causing separation of the solution) [
27,
28]. Their mutual exclusion causes the problem of selecting the optimal parameters for ion exchange membranes. An example is the degree of cross-linking of the polymer on which the membrane is based; its increase improves mechanical strength while increasing electrical resistance. The increasing density of functional groups in the membrane matrix results in lower electrical resistance. Still, at the same time, the tendency of the membrane to swell increases, and its mechanical stability decreases. This makes it necessary to select the appropriate membrane for a specific need. The characteristics of the ion-exchange membranes used in these studies are presented in
Table 1.
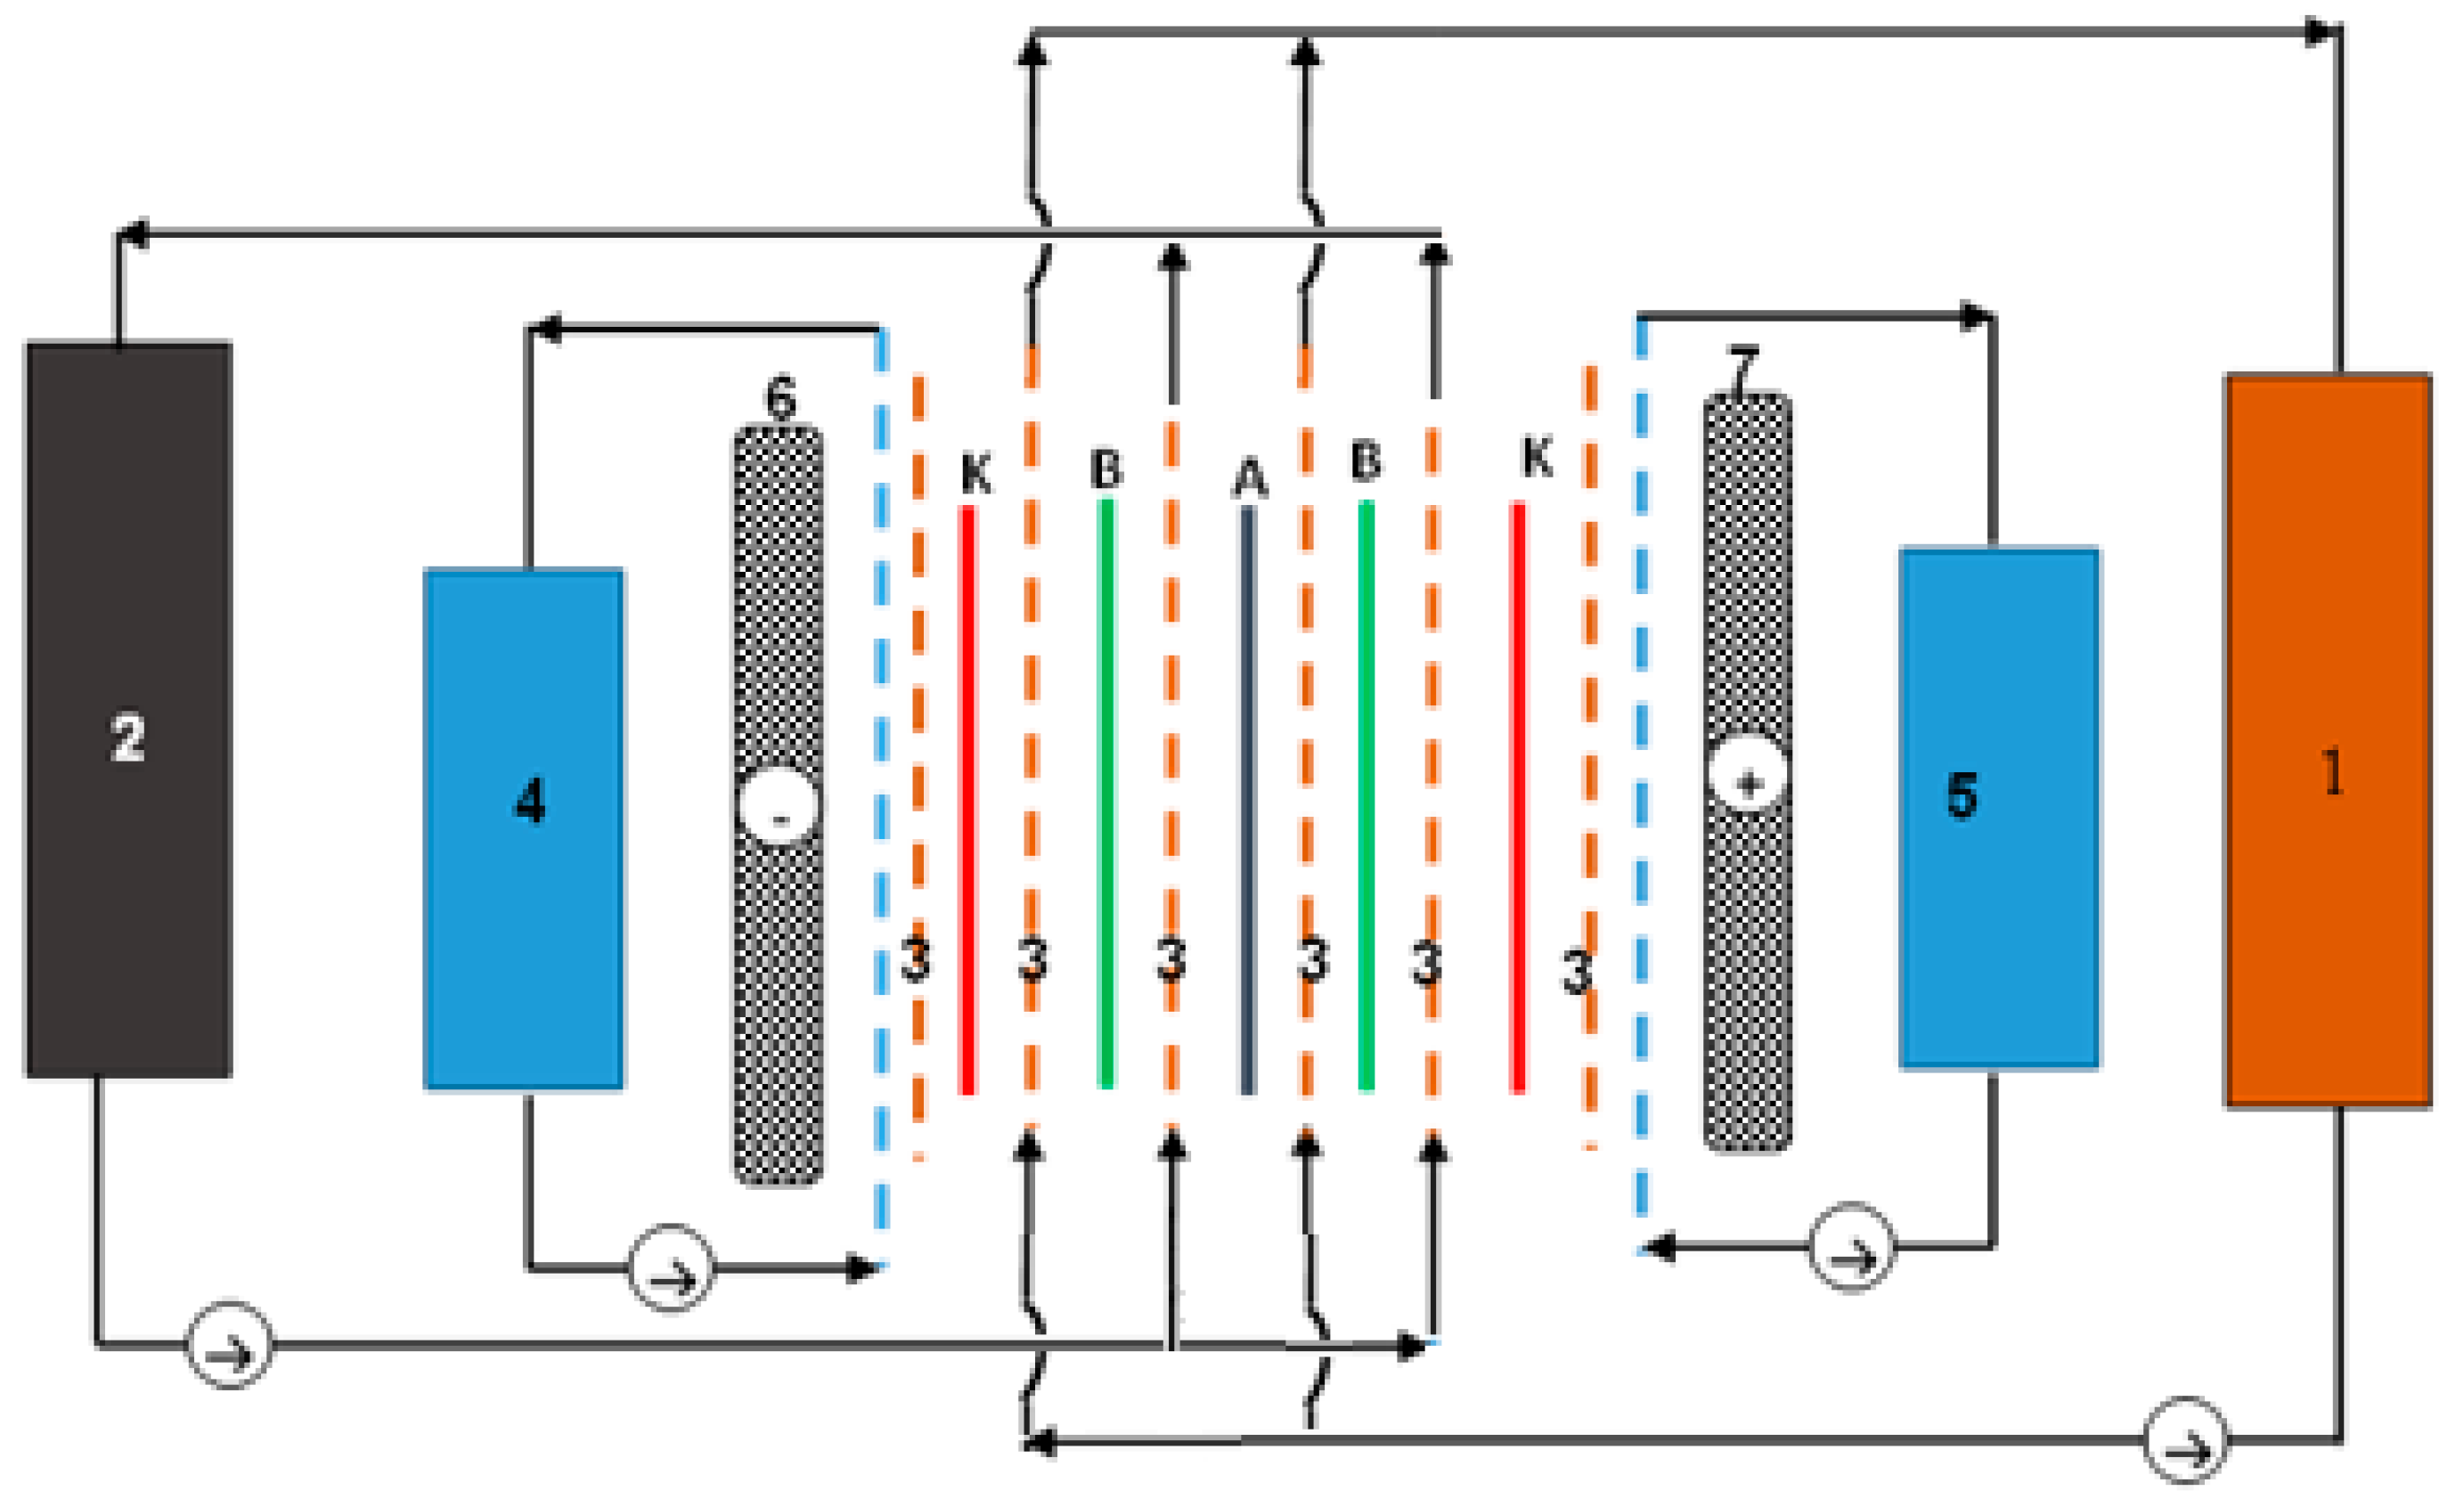
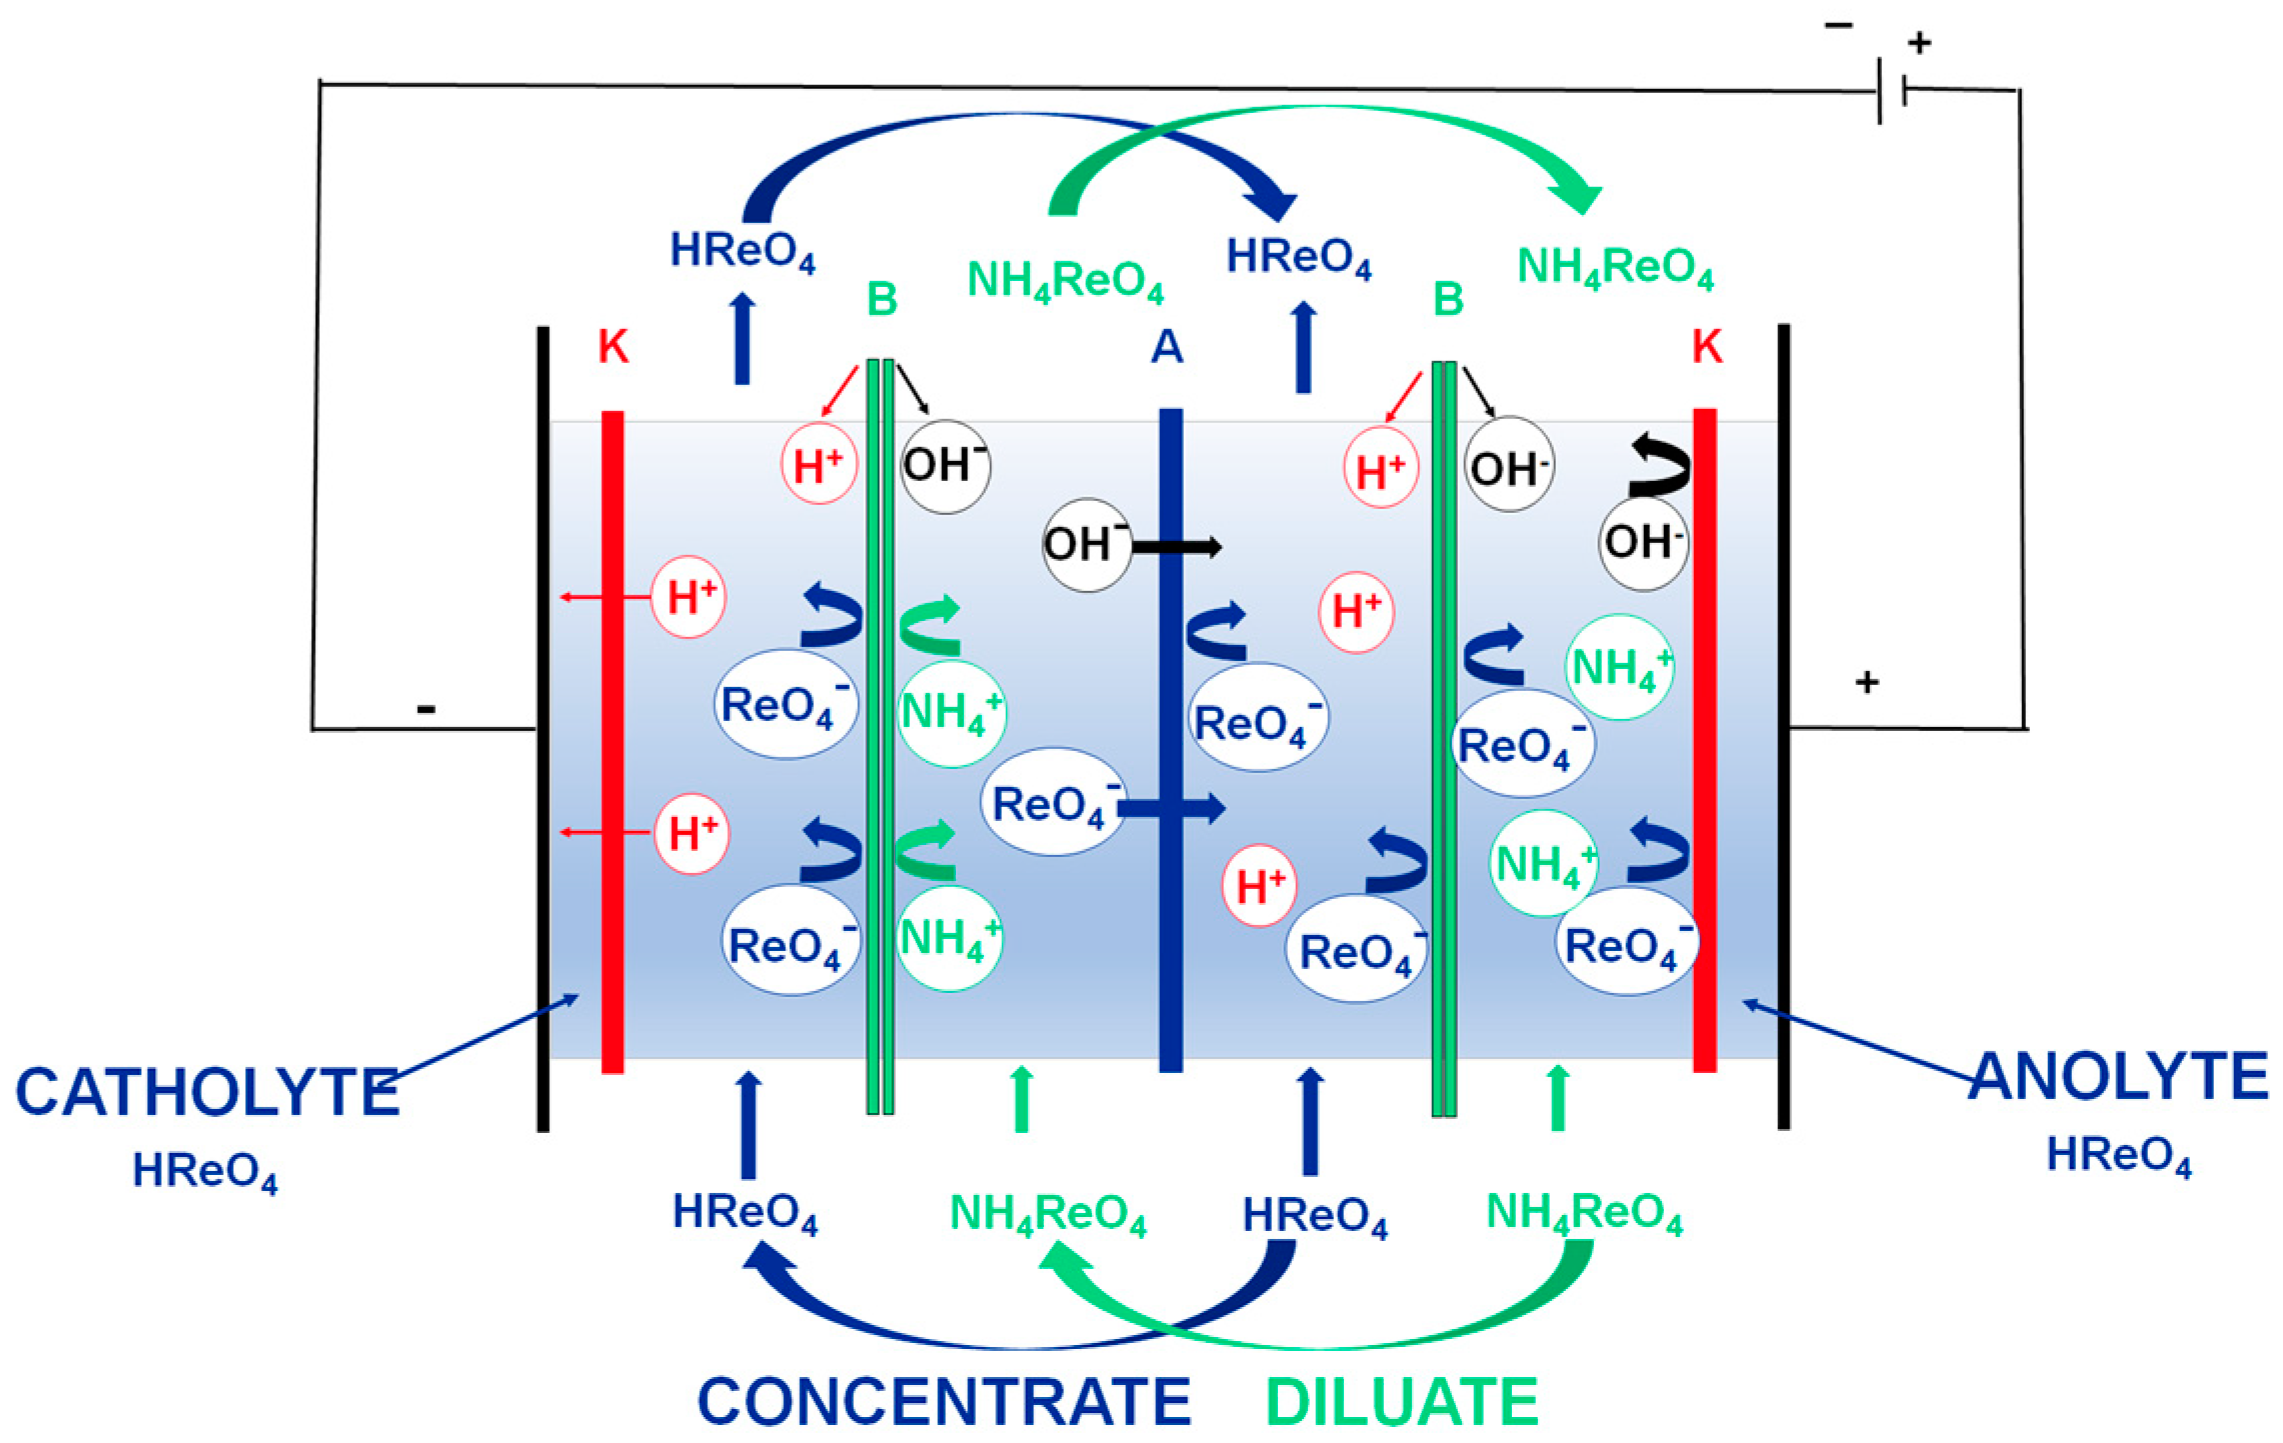
Each of process streams were continuously mixed in buffer tank and temperature-stabilized by the heating elements of magnetic mixers, with thermocouples immersed in solutions. This allowed us to keep temperature constant within whole electrodialyser and circulating solutions. The procedure of electrodialysis was as follows: all solutions were heated to 35 °C prior to pumping to electrodialyser, a stack of ion-selective membranes and sheet spacers was prepared, and then they were placed in the electrodialyser. Scheme of the electrodialyser construction with the membrane assembly in double-flow system is presented in
Figure 4, with the ion flow in double-flow system in
Figure 5.
Initial samples were collected after entire deaeration of system and flow stabilization. The process was started when power supply was turned on, and set current intensity was chosen, which was kept constant during the process. Samples were collected periodically from all or selected streams. Voltage and temperature were monitored as well. The final point was the moment when pH reached 10.6 in diluate, satisfying depletion of ReO4− ions to <1 g/dm3 (process efficiency > 90%) and/or when a sudden and significant increase in voltage occurred. The solution’s volume was measured and samples were collected. Each test was performed three times. A statistical analysis was conducted and standard deviations were plotted on the charts.
Process efficiency was calculated from Equation (1):
where
C0 and
C1 are the concentration of diluate at the beginning and at the end of process in mol/dm
3.
3. Results and Discussion
Within these experiments:
− The effect of the flow intensity of process streams through an electrodialyser, including the current density and concentration of selected process streams on the purity of the produced perrhenic acid, were examined;
− Trials for the production of perrhenic acid, with a concentration of >100 g/dm3 using electrodialysis, were performed;
− Purification of the produced perrhenic acid, with the use of electrodialysis, was performed.
3.1. Flow Intensity
One of the examined parameters was the flow intensity of the process streams through the electrodialyser. Tests were performed with set values of 0.75 dm
3/h, 3.0 dm
3/h, 4.5 dm
3/h, 5.0 dm
3/h, and 7.0 dm
3/h, keeping a constant current density of 300 A/m
2, and a temperature of 35 °C. The initial volumes of the concentrate, diluate, catholyte, and anolyte were 0.35 dm
3 each. Electrodialysis was carried out until the diluate pH value reached a minimum of 10.6—this meant that the ReO
4− ions in the diluate were depleted—while the current voltage was monitored. After completing the tests, the following process durations were recorded and are presented in
Table 2.
At the lowest stream flow rate—0.75 dm
3/h—the electrodialysis time was as long as 5 h, while for the remaining samples, it was less than 2 h.
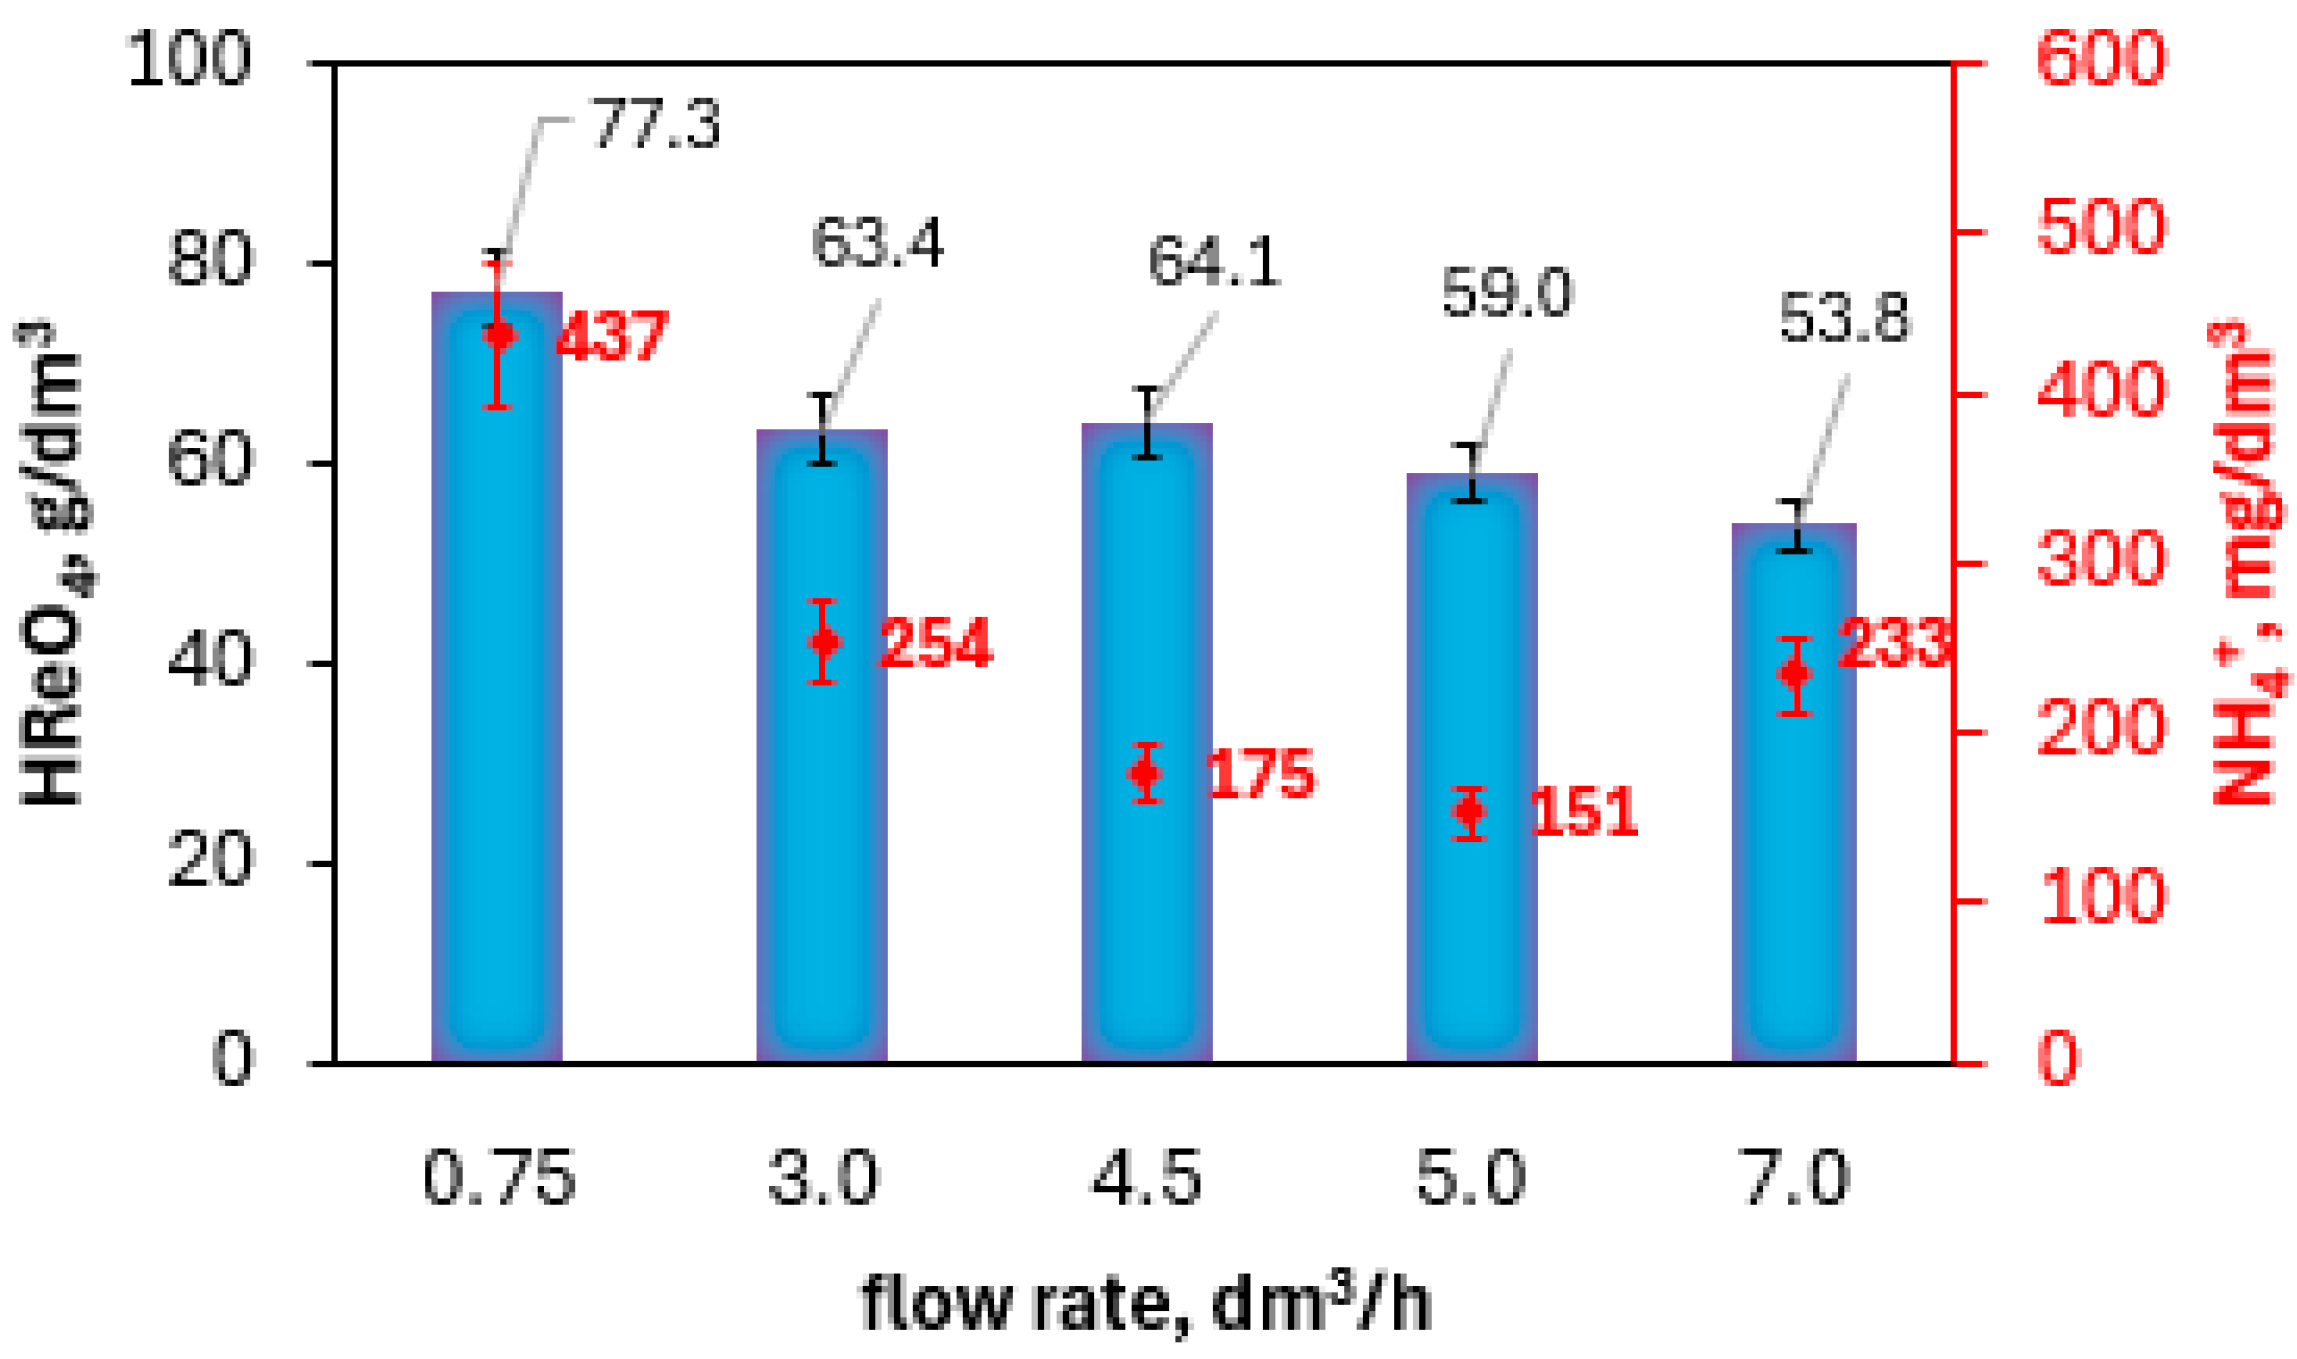
Figure 6 shows the concentration values of the perrhenic acid and ammonium ions in the concentrates, obtained after electrodialysis, depending on the flow rate of the process streams used.
As the initial concentration of the perrhenic acid in the concentrate was 40 g/dm3, a significant increase in Re, up to 77 g/dm3, can be observed. The bigger the flow intensity of the process streams, the lower the contamination with ammonium ions (the exception is 7 dm3/h) and the lower the rhenium increase in the concentrate. The amount of migrating ammonium ions depends on the time of electrodialysis and the flow intensity of the process streams. The lowest level of contamination of the concentrate with NH4+ ions (151 mg/dm3) was found at the flow intensity of 5 dm3/h. The process efficiency in all five electrodialysis experiments was above 90%. Consequently, the most favorable flow intensity was said to be in the range of 3.0–4.5 dm3.
3.2. Current Density
The next parameter tested was current density. While designing an electrodialysis process, special attention should be paid to limiting current density, which is the maximum current that can be passed through a given membrane without a visible increase in the electrical resistance of the system or deterioration of the current efficiency. The ions responsible for current transport through the membrane are almost entirely removed from the solution layer directly adjacent to the membrane on the diluate side. It is necessary to use a higher voltage to maintain a constant current with the increased electrical resistance of the solution. When there are no ions to transport the current, the reverse transport of anions through the cation-exchange membrane begins. The next stage is the decomposition of water molecules into H
+ and OH
− ions, which serve as charge carriers and cause direct changes in the pH. These phenomena are undesirable and reduce the efficiency of the process. Four different current density values were used in the tests: 150, 200, 250, and 300 A/m². In these experiments, a solution of NH
4ReO
4, with about a concentration of 25 g/dm³, was used as the diluate, and the temperature of all the solutions was maintained at 35 °C. The flow rate of the process streams through the electrodialyser was set at 3.0 dm³/h. And similarly to before, electrodialysis was carried out until the pH of the diluate reached at least 10.6. The times of each process vs. the applied current densities are presented in
Table 3
.
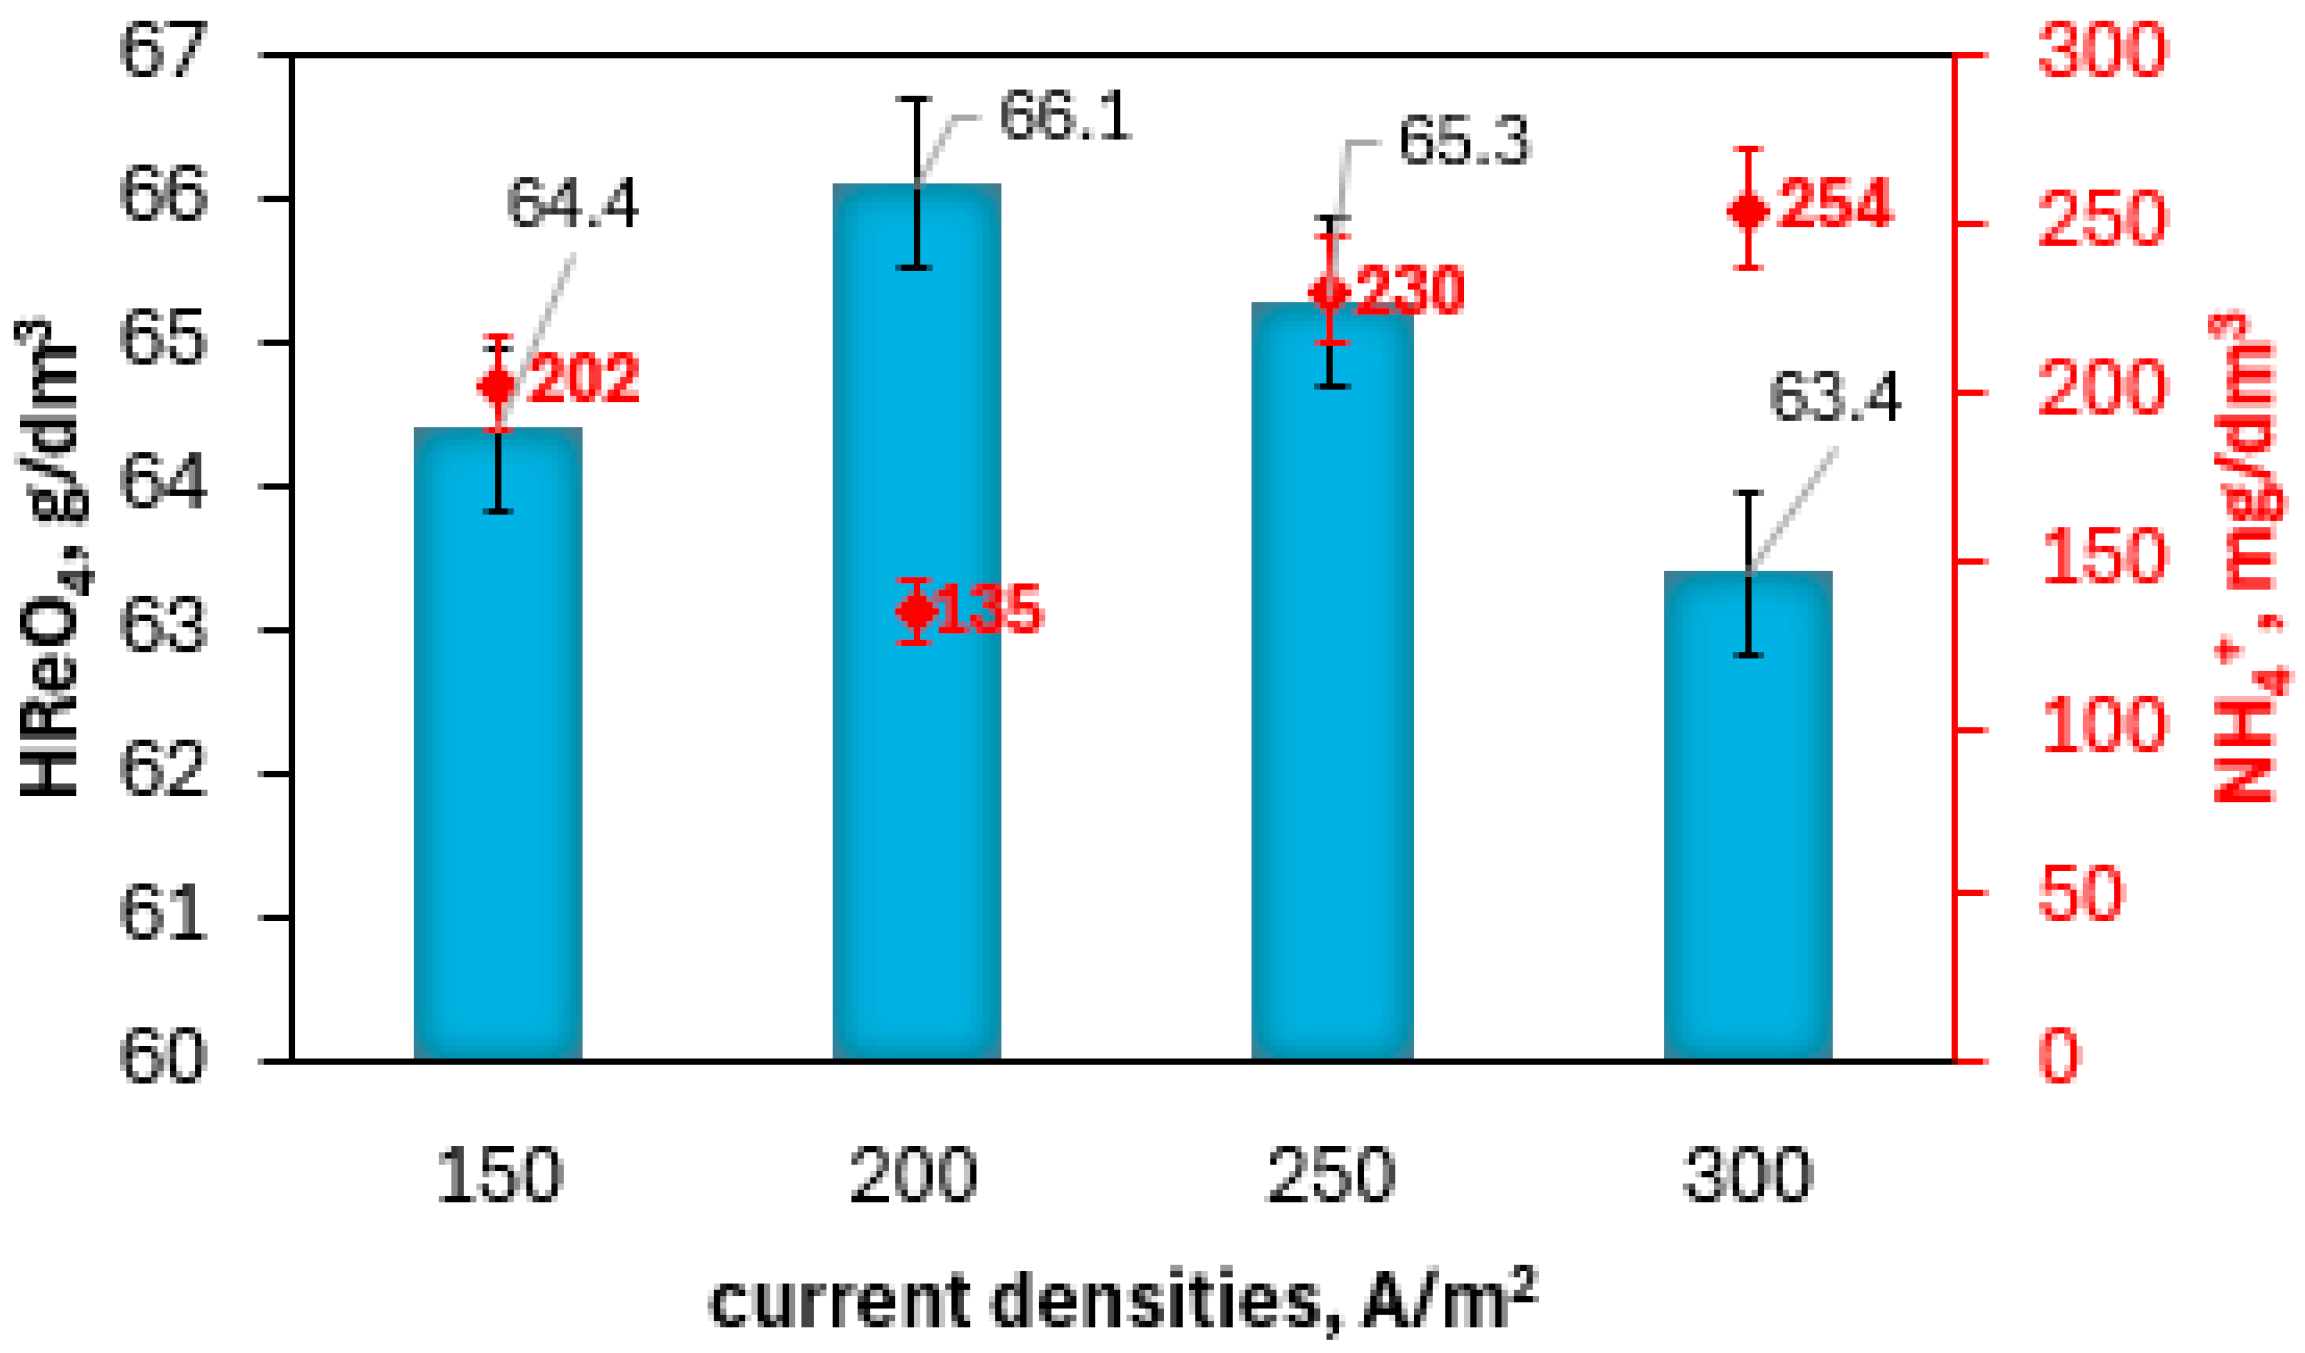
The higher the current density used, the shorter the electrodialysis process time. The concentration of the perrhenic acid and ammonium ions in the produced concentrates after electrodialysis vs. the current densities are presented in
Figure 7.
As a result, an increase in the concentration of HReO
4 was observed in all concentrates up to ~65 g/dm
3. The lowest concentration of NH
4+ ions (135 mg/dm
3) was obtained at 200 A/m
2. The concentration of ammonium ions in other trials was >200 mg/dm
3. The change in the perrhenic acid concentration in both the anolyte and catholyte and the rhenium in the diluate, both before and after the process for all four attempts, are presented in
Table 4.
Based on the data in the
Table 4, the following trends can be noticed:
− In the anolyte, regardless of the current density, the concentration of the perrhenic acid increases after the end of the electrodialysis process;
− In the catholyte, the concentration of the perrhenic acid increases after the electrodialysis process at a current density of 150 A/m2 while for the densities of 200, 250, and 300 A/m2, it decreases;
− In the diluate, the rhenium concentration drops below 0.50 g/dm3 for all current densities after the electrodialysis process is completed.
The process efficiencies in all electrodialysis experiments reached above 90%. It was determined that the most favorable current density value is 200 A/m2.
Applications of New Kind of Diluate for Different Current Densities
There were also tests with varied initial concentrations of particular process streams. The combined anolyte and catholyte from the previous trials was used as a diluate. Prior to electrodialysis, the following concentrations were found: Re—25.6 g/dm
3 and NH
4+—123 mg/dm
3. Regarding the anolyte, catholyte, and concentrate, the same set, as previously described, was used: concentrate—40 g/dm
3 HReO
4, catholyte—30 g/dm
3 HReO
4, and anolyte—30 g/dm
3 HReO
4. The temperature was at 35 °C and the flow intensity was 3.0 dm
3/h. The current density used was varied: 150, 200, and 300 A/m
2. The tests were carried out until the pH value was reached—10.6 in the diluate—while the current voltage was monitored simultaneously. The time need to finish each process vs. the current densities is presented in
Table 5.
With the increase in current density, the electrodialysis process time increases from 1.6 h for 150 A/m
2 to 2.1 h for 200 A/m
2 and up to 3.6 h for 300 A/m
2.
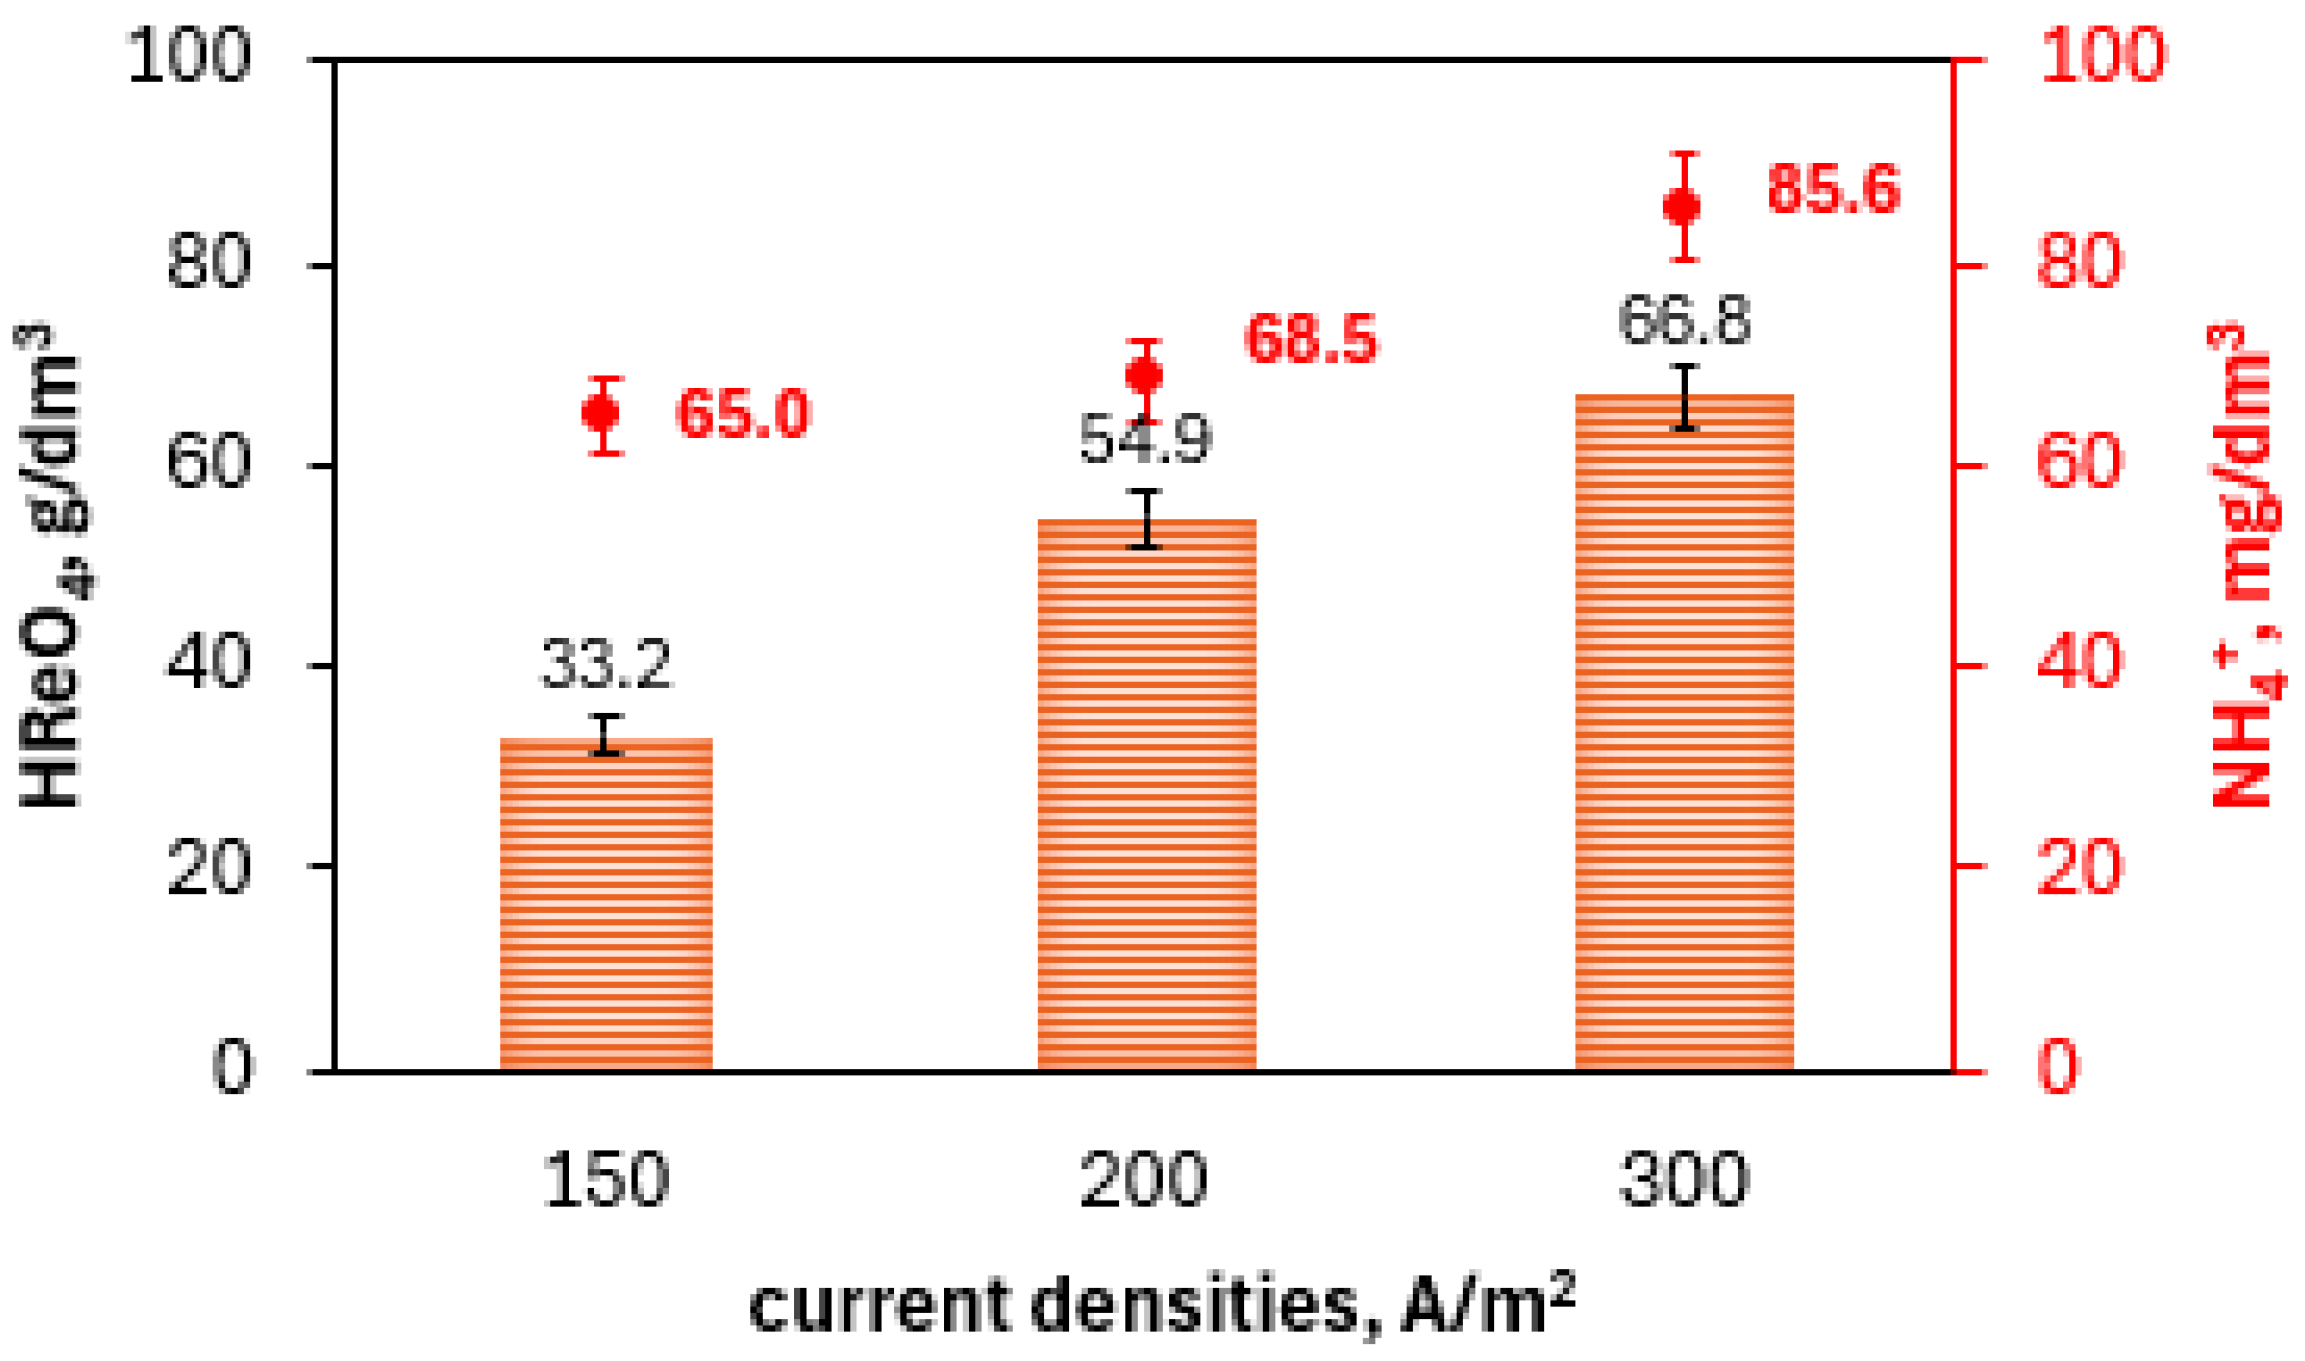
Figure 8 shows the concentration values of the perrhenic acid and ammonium ions in the obtained concentrates after electrodialysis, depending on the current density used and using a new type of diluate.
The analysis of the obtained results satisfied that the higher current density, with a new feed (Re—25.6 g/dm
3, and NH
4+—123 mg/dm
3), the higher the concentration of the perrhenic acid in the produced concentrate. Moreover, the increase in the current density results in an increase in the contamination of the concentrate with ammonium ions. The relationship between the electrodialysis time and the applied current densities, with a use of a new feed, is presented in
Figure 9.
It appears that increases in the current density result in increased electrodialysis times, ranging from 1.6 h at 150 A/m2 (gray line), to 2.1 h at 200 A/m2 (orange line), and up to 3.6 h at 300 A/m2. The phenomena of a sudden change in the diluate pH to ~8 was observed later when a higher current density was used.
3.3. Concentration and Purification of Perrhenic Acid >100 g/dm3
Attempts were made to concentrate perrhenic acid in a double-flow stream and were realized in five cycles. In each of them, a new portion of the diluate—with ammonium perrhenate as a source of ReO
4− ions—was used. When the pH of the diluate achieved a value of 10.6, the ReO
4− depleted solution was rejected and a new one was used. The entire process took a total of 8 h. The relationship between the change in the HReO
4 concentration in the concentrate and the pH of the diluate during the electrodialysis process is presented in
Figure 10.
The whole process took 8 h across five cycles, which allowed us to increase the concentration of the concentrate from 40 g/dm
3 to 148.7 g/dm
3 HReO
4, while simultaneously contaminating it with NH
4+ ions up to a concentration of 530 mg/dm
3. In all cycles, the process efficiency was above 90%. Despite the contamination with ammonium ions, the concentrates were successfully enriched in rhenium, lowering the rhenium amount in the diluates from 17.5 g/dm
3 to <1.0 g/dm
3 Re. The produced concentrate, with a concentration of 148.7 g/dm
3 HReO
4 and 530 mg/dm
3 NH
4+, was electrodialatically purified to lower the concentration of NH
4+ to <100 mg/dm
3. It was used as the diluate in the next stage. The purification was performed at 200 A/m
2, with a flow rate of 3.0 dm
3/h, a temperature of 35 °C, and a time of 8 h. The applied method allowed us to produce a concentrate with concentrations of 169.7 g/dm
3 HReO
4 and 70 mg/dm
3 NH
4+. Based on this, a technological scheme for perrhenic acid production, with a concentration of >100 g/dm
3 and a high purity, was developed (
Figure 11).
The electrodialytic method used to purify the perrhenic acid made it possible to obtain a concentrate with the following composition: 169.7 g/dm
3 HReO
4 and 70 mg/dm
3 NH
4+. On this basis, a technological scheme (
Figure 12) was developed for obtaining high-purity perrhenic acid with a concentration of >100 g/dm
3.
The proposed technological scheme consists of two successive electrodialysis processes. In the first stage, the HReO4 solution should be used as the feed in the Concentrate I stream and the NH4ReO4 solution should be used in the Diluate I stream. During this process, an HReO4 solution with a concentration of ~150 g/dm3 is obtained in the Concentrate I stream and the Diluate I stream is depleted of ReO4− ions. The exhausted Diluate I stream can be returned to the process and used to dissolve a new portion of ammonium perrhenate. In the second stage, a fresh solution of 40 g/dm3 HReO4 should be used as the feed in the Concentrate II stream, and the perrhenic acid solution obtained in the first stage should be used as the feed in the Diluate II stream. During this stage, a solution of ~170 g/dm3 HReO4 is obtained in the Concentrate II stream, and the exhausted Diluate II stream containing most of the impurities can be returned to the first stage and serve as a base for the preparation of the input to the Diluate I stream. The process parameters are a temperature of 35 °C, current density of 200 A/m2, and flow rate of process streams through the electrolyser of 3.0 dm3/h. After working on the system for a long time, it is necessary to determine the moment for removing part of the solution to remove the accumulating impurities.
4. Conclusions
Laboratory tests were conducted for the production of high-purity perrhenic acid using a current membrane technique—electrodialysis—in a two-stream system. A stack of cation-exchange, anion-exchange, and bipolar membranes, as well as sheet spacers, were selected to perform these experiments. The most favorable parameters of the electrodialysis process for obtaining high-purity perrhenic acid were determined, such as the temperature, current density, flow rate, and concentrations of individual process streams. It was determined that the most favorable flow rate of the process streams through the electrodialyser is 3.0–4.5 dm3. The most favorable current density value is 200 A/m2 and the process temperature is 35 °C. It is also possible to use a diluate with an initial concentration of 25.6 g/dm3 of rhenium and 123 mg/dm3 of ammonium ions without any visible deterioration of the process efficiency or the purity of the obtained HReO4 concentrate.
Finally, high-purity perrhenic acid (containing <1 ppm Ca, <10 ppm K, <1 ppm Mg, <1 ppm Cu, <1 ppm Na, <1 ppm Mo, <1 ppm Ni, <1 ppm Pb, <1 ppm Fe, <1 ppm Co, and <1 ppm Zn) with a rhenium concentration of >100 g/dm3 was obtained in the electrodialysis process with an efficiency of >90%. A two-stream system using three ion-exchange membranes was employed to develop a technological scheme consisting of two successive electrodialysis processes. In the first stage, perrhenic acid is produced from a solution of ammonium perrhenate. The obtained acid is cleaned of potential impurities and ammonium ions in the second stage.
Author Contributions
Conceptualization, P.K.; methodology, P.K., D.K. and G.B.; validation, K.L.-S., D.K. and P.D.; formal analysis, K.L.-S., G.B. and M.C.; investigation, P.K., K.P., J.M., S.O., P.D. and K.G.; resources, P.K., D.K., K.L-S. and G.B.; data curation, P.K., A.G. and D.K.; writing—original draft preparation, P.K.; writing—review and editing, S.O., M.C. and K.L.-S.; visualization, P.K., D.B., A.G. and M.C.; supervision, D.K., G.B. and P.D.; project administration, K.L.-S.; funding acquisition, K.L-S. All authors have read and agreed to the published version of the manuscript.
Funding
This work was funded by the Norwegian Financial Mechanism 2014–2021—Small Grant 2020 NOR/SGS//RenMet/0049/2020-00 (11/PE/0146/21)—entitled “Innovative hydrometallurgical technologies for the production of rhenium compounds from recycled waste materials for catalysis, electromobility, aviation, and defense industry”.
Data Availability Statement
The data presented in this study are available upon request from the corresponding author. The data are not publicly available due to a patent application and project contract.
Conflicts of Interest
The authors declare no conflicts of interest. The funders had no role in the design of the study, in the collection, analyses, or interpretation of data, in the writing of the manuscript, or in the decision to publish the results.
References
- Robeson, L.M. Polymer Membrane. In Polymer Science: A Comprehensive Reference; Matyjaszewski, K., Möller, M., Eds.; Elsevier: Amsterdam, The Netherlands, 2012; Volume 8, pp. 325–347. [Google Scholar] [CrossRef]
- Zagorodnyaya, A.N.; Abisheva, Z.S.; Agapova, L.Y.; Sharipov, A.S. Purification of Crude Ammonium Perrhenate from Potassium by Recrystallization, Sorption, and Membrane Electrodialysis. Theor. Found. Chem. Eng. 2019, 53, 841–847. [Google Scholar] [CrossRef]
- Sarode, S.; Upadhyay, P.; Khosa, M.A.; Mak, T.; Shakir, A.; Song, S.; Ullah, A. Overview of wastewater treatment methods with special focus on biopolymer chitin-chitosan. Int. J. Biol. Macromol. 2019, 121, 1086–1100. [Google Scholar] [CrossRef] [PubMed]
- Ibanez, R.; Stamatialis, D.F.; Wessling, M. Role of membrane surface in concentration polarization at cation exchange membranes. J. Membr. Sci. 2004, 239, 119–128. [Google Scholar] [CrossRef]
- Barragán, V.M.; Ruíz-Bauzá, C. Current–Voltage Curves for Ion-Exchange Membranes: A Method for Determining the Limiting Current Density. J. Colloid Interface Sci. 1998, 205, 365–373. [Google Scholar] [CrossRef] [PubMed]
- Tongwen, X.; Weihua, Y. Fundamental studies of a new series of anion exchange membranes: Membrane preparation and characterization. J. Membr. Sci. 2001, 190, 159–166. [Google Scholar] [CrossRef]
- Boucher, M.; Turcotte, N.; Guillemette, V.; Lantagne, G.; Chapotot, A.; Pourcelly, G.; Sandeaux, R.; Gavach, C. Recovery of spent acid by electrodialysis in the zinc hydrometallurgy industry: Performance study of different cation-exchange membranes. Hydrometallurgy 1997, 45, 137–160. [Google Scholar] [CrossRef]
- Bauer, B.; Gerner, F.J.; Strathmann, H. Development of bipolar membranes. Desalination 1988, 68, 279–292. [Google Scholar] [CrossRef]
- Jiang, C.; Hossain, M.M.; Li, Y.; Wang, Y.; Xu, T. Ion Exchange Membranes for Electrodialysis: A Comprehensive Review of Recent Advances. J. Membr. Sep. Technol. 2014, 3, 185–205. [Google Scholar] [CrossRef]
- Balster, J.; Srinkantharajah, S.; Sumbharaju, R.; Pünt, I.; Lammertink, R.G.H.; Stamatialis, D.F.; Wessling, M. Tailoring the interface layer of the bipolar membrane. J. Membr. Sci. 2010, 365, 389–398. [Google Scholar] [CrossRef]
- Orda, S.; Drzazga, M.; Leszczyńska-Sejda, K.; Ciszewski, M.; Kocur, A.; Branecka, P.; Gall, K.; Słaboń, M.; Lemanowicz, M. Investigations of the Density and Solubility of Ammonium Perrhenate and Potassium Perrhenate Aqueous Solutions. Crystals 2023, 16, 5481. [Google Scholar] [CrossRef]
- Marunova, K.V.; Stepanova, M.A. Use of electrodialysis for production and purification of rhenium compounds. In Proceedings of the IV Soviet Union Meeting on Rhenium Problem, Moscow, Russia; 1976; pp. 87–89. [Google Scholar]
- Marunova, K.V.; Stepanov, M.A. Experience on industrial operation of electrodialysis plant for production of ammonia perrhenate. Non-Ferr. Metall. 1977, 18, 25–27. [Google Scholar]
- Borisova, L.V.; Prasolova, O.D.; Yermakov, A.N.; Zarinskii, V.A.; Ponomareva, E.I.; Rakhmetov, B.A. Method of Rhenium Extraction–USSR839085. 1989. [Google Scholar]
- Agapova, L.Y.; Ponomareva, E.I.; Abisheva, Z.S. Production of concentrated rhenium acid by electrodialysis of rhenium salts solutions. Hydrometallurgy 2001, 60, 117–122. [Google Scholar] [CrossRef]
- Kuznetsova, O.G.; Levin, A.M.; Sevost’yanov, M.A.; Tsybin, O.I.; Bol’shikh, A.O.; Bol’shikh, M.A. Improved Electrodialysis Synthesis of Perrhenic Acid from the Electrolytes of Processing the Wastes of Tungsten–Rhenium Alloys. Russ. Metall. (Met.) 2020, 1, 71–76. [Google Scholar] [CrossRef]
- Kuznetsova, O.G.; Levin, A.M.; Sevostyanov, M.A.; Bolshih, A.O. The improvement of rhenium recovery technology from W-Re alloys. J. Phys. Conf. Ser. 2018, 1134, 012032. [Google Scholar] [CrossRef]
- Palant, A.A.; Levin, A.M.; Bruckvin, V.A. Preparation of concentrated solutions of rhenium acid by electrodialysis. Non-Ferr. Met. 2010, 11, 62–64. [Google Scholar]
- Palant, A.A.; Bryukvin, V.A.; Levin, A.M.; Reshetova, O.V. Electrodialysis Synthesis of Concentrated Solutions of Perrhenic Acid. Russ. Metall. (Met.) 2011, 3, 185–187. [Google Scholar] [CrossRef]
- Guro, V.P. Ammonium perrhenate purification and rhenium recovery from heat-resistant rhenium-nickel superalloys. 21st Int. Conf. Metall. Mater. 2012, 7. [Google Scholar]
- Benke, G.; Anyszkiewicz, K.; Hac, D.; Litwinionek, K.; Leszczyńska-Sejda, K. Progress in the methods of recovering rhenium from copper metallurgy. Przemysł Chem. 2006, 85, 793–797. [Google Scholar]
- Leszczyńska-Sejda, K.; Benke, G.; Anyszkiewicz, K. A new method for preparing perrhenic acid from an aqueous ammonium perrhenate solution. Przemysł Chem. 2006, 89, 847–850. [Google Scholar]
- Palant, A.A.; Bryukvin, V.A.; Levchuk, O.M.; Reshetova, O.V. Effect of Temperature on the Corrosion of Some Materials in Perrhenic Acid Solutions. Russ. Metall. (Met.) 2011, 5, 413–414. [Google Scholar] [CrossRef]
- Abisheva, Z.S.; Agapova, L.Y.; Ponomareva, E.I.; Abdrakhmanova, Z.T. Application of Electrodialysis Method for High Purity Metal Rhenium Obtaining. In Proceedings of the 7th International Symposium on Technetium and Rhenium—Science and Utilization, Moscow, Russia, 4–8 July 2011; pp. 247–252. [Google Scholar]
- Abisheva, Z.S.; Ponomareva, E.I.; Agapova, L.Y. Electrodialysis in Technology of Production of Re Compounds. Gorn. Zhurnal 2005, 5, 73–76. [Google Scholar]
- Levin, A.M.; Levchuk, O.M. Electrochemical Recovery of Rhenium from W–Re Alloys in the Form of Perrhenic Acid: I. Fundamentals of the Process. Russ. Metall. (Met.) 2017, 1, 47–53. [Google Scholar] [CrossRef]
- Nazif, A.; Karkhanechi, H.; Saljoughi, E.; Mousavi, S.M.; Matsuyama, H. Recent progress in membrane development, affecting parameters, and applications of reverse electrodialysis: A review. J. Water Process Eng. 2022, 47, 102706. [Google Scholar] [CrossRef]
- Mei, Y.; Tang, C.T. Recent developments and future perspectives of reverse electrodialysis technology: A review. Desalination 2018, 425, 156–174. [Google Scholar] [CrossRef]
Figure 1.
Schematic diagram of a bipolar membrane.
Figure 1.
Schematic diagram of a bipolar membrane.
Figure 2.
Set for electrodialysis test.
Figure 2.
Set for electrodialysis test.
Figure 3.
Electrodialyser PC Cell ED 640 04.
Figure 3.
Electrodialyser PC Cell ED 640 04.
Figure 4.
Scheme of the electrodialyser construction: 1—concentrate flow; 2—diluate flow; 3—spacer; 4—catholyte flow; 5—anolyte flow; 6—cathode; 7—anode; A—anionite membrane; K—cationite membrane; and B—bipolar membrane.
Figure 4.
Scheme of the electrodialyser construction: 1—concentrate flow; 2—diluate flow; 3—spacer; 4—catholyte flow; 5—anolyte flow; 6—cathode; 7—anode; A—anionite membrane; K—cationite membrane; and B—bipolar membrane.
Figure 5.
Ion flow in double-flow system.
Figure 5.
Ion flow in double-flow system.
Figure 6.
Concentration of perrhenic acid in produced concentrates and concentration of ammonium ions with respect to flow intensity of process streams.
Figure 6.
Concentration of perrhenic acid in produced concentrates and concentration of ammonium ions with respect to flow intensity of process streams.
Figure 7.
Concentration of perrhenic acid and ammonium ions in produced concentrates after electrodialysis vs. current densities.
Figure 7.
Concentration of perrhenic acid and ammonium ions in produced concentrates after electrodialysis vs. current densities.
Figure 8.
Concentration of perrhenic acid and ammonium ions in concentrates after electrodialysis vs. applied current densities, with a use of a new feed (combined).
Figure 8.
Concentration of perrhenic acid and ammonium ions in concentrates after electrodialysis vs. applied current densities, with a use of a new feed (combined).
Figure 9.
Relation between electrodialysis time and applied current densities with a use of a new feed.
Figure 9.
Relation between electrodialysis time and applied current densities with a use of a new feed.
Figure 10.
Change in HReO4 concentration in the concentrate and pH of the diluate in a 5-cycle extended electrodialysis process.
Figure 10.
Change in HReO4 concentration in the concentrate and pH of the diluate in a 5-cycle extended electrodialysis process.
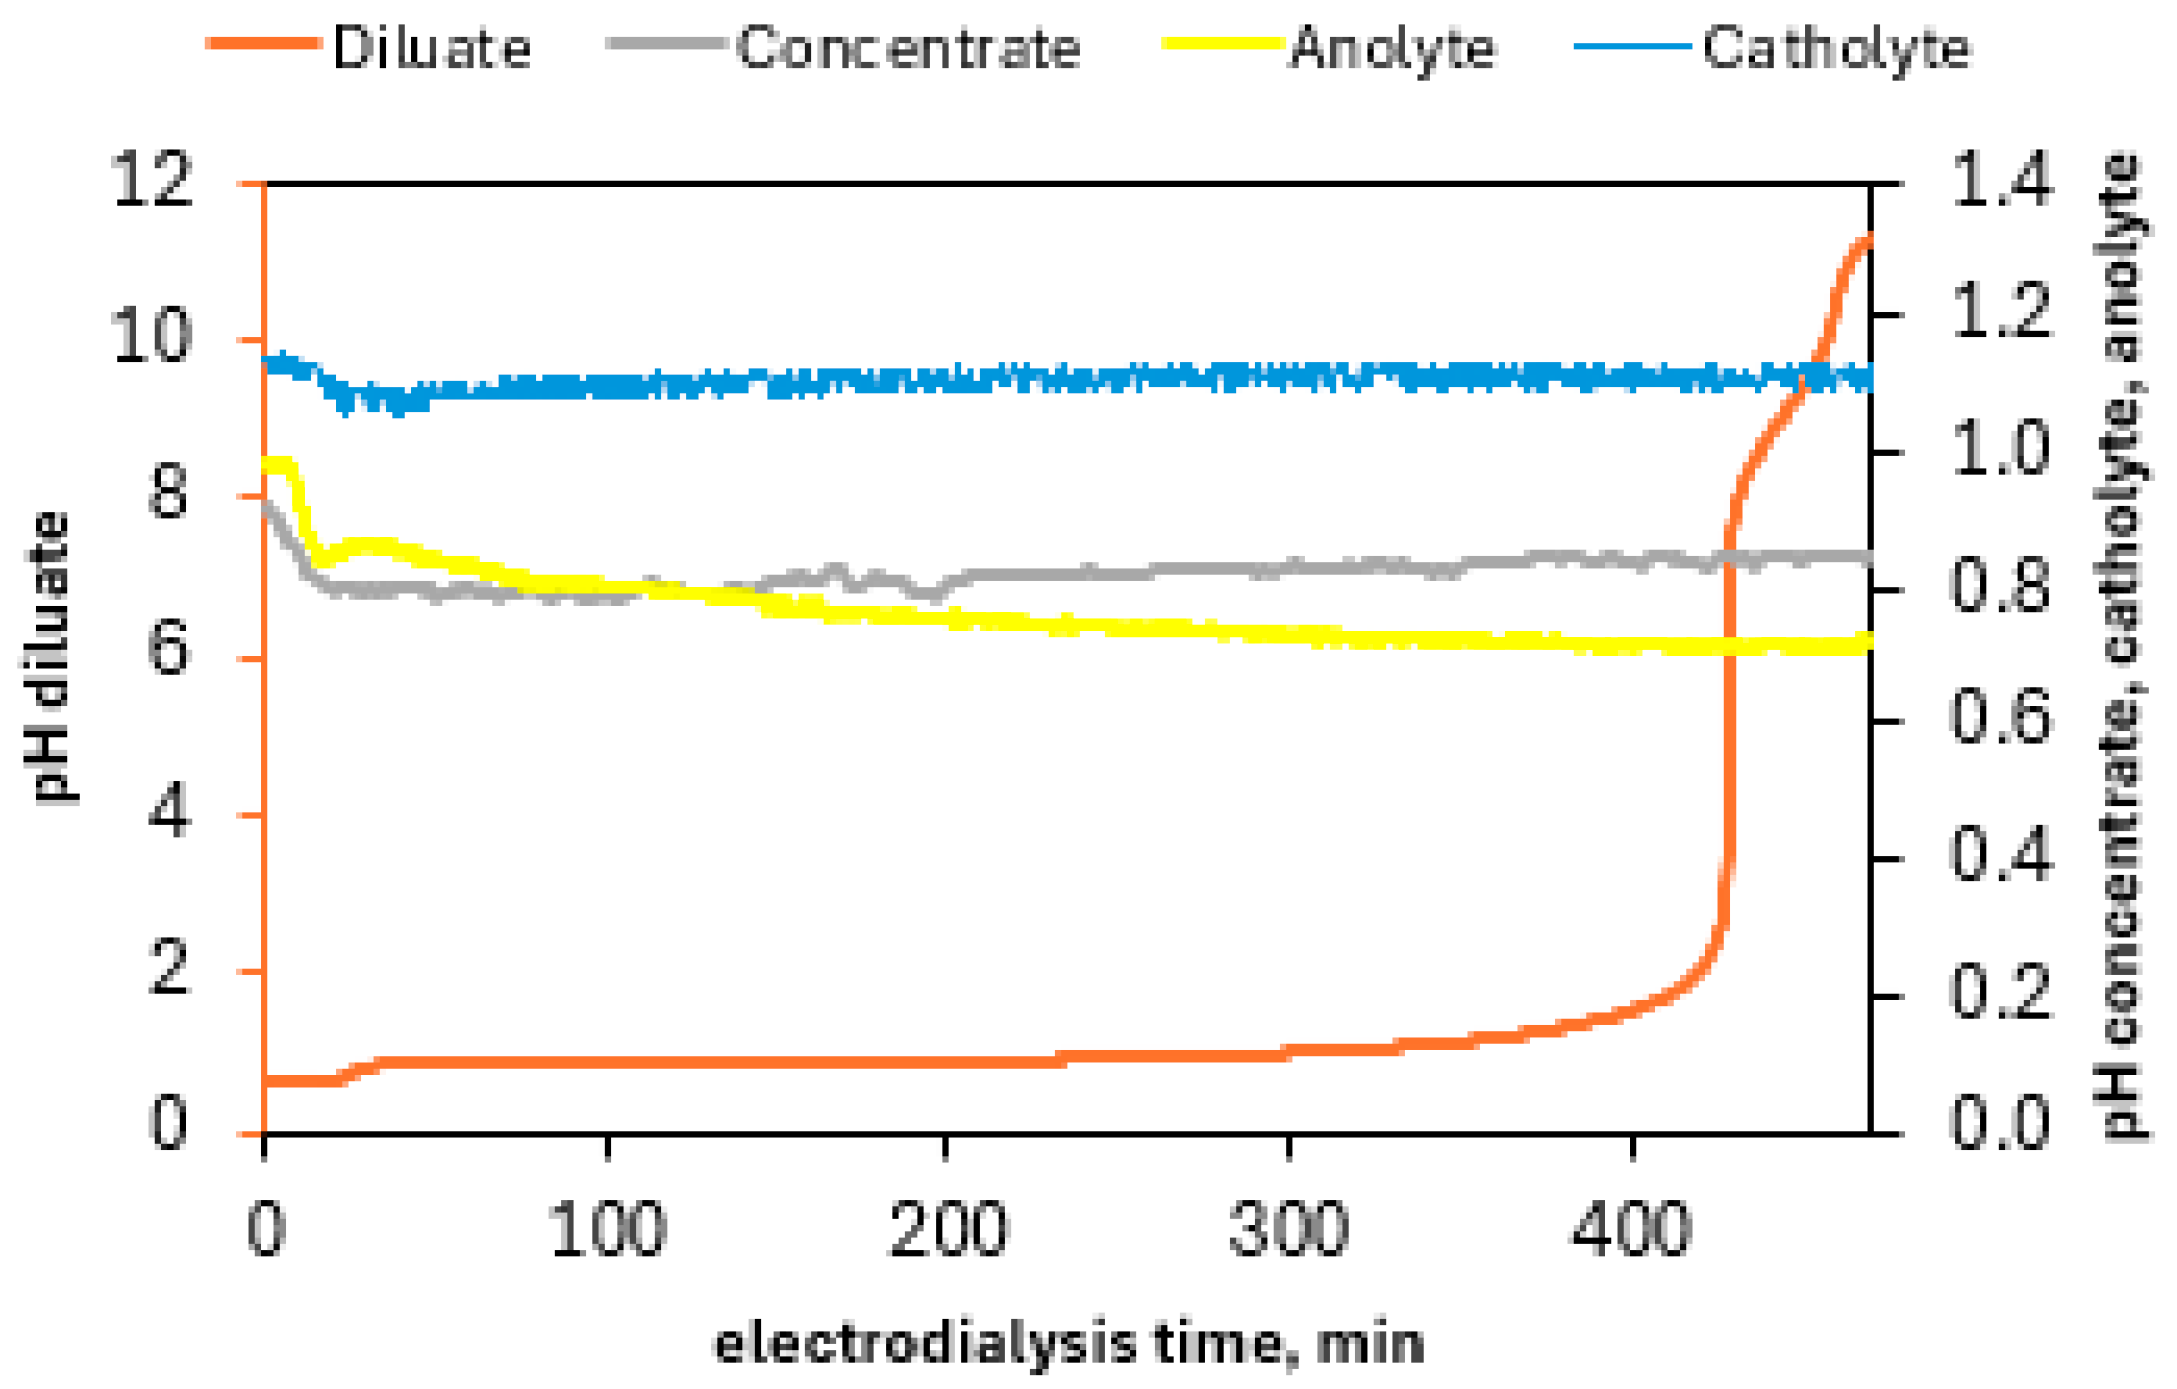
Figure 11.
Change of pH of all process streams during the electrolytic purification process.
Figure 11.
Change of pH of all process streams during the electrolytic purification process.
Figure 12.
Technological scheme for production of high-purity perrhenic acid.
Figure 12.
Technological scheme for production of high-purity perrhenic acid.
Table 1.
Characteristics of ion-exchange membranes used in research.
Table 1.
Characteristics of ion-exchange membranes used in research.
| Membrane | Type | Resistant Electric,
Ω · cm2 | Interchangeable Capacity,
eq/g | Maximum Temperature Process, °C | Thickness,
µm | Resilience
Mechanical,
kg/cm2 | H2O Content in a Dry State, % |
|---|
| PC bip | bipolar | <3 | - | 40 | 200–350 | - | - |
| PC SK | cation exchanger
strongly acidic | ~2.5 | 3 | 50 | 100–120 | 4–5 | ~9 |
| PC SA | anion exchanger
strongly basic | ~1.8 | 0.7–1.2 | 60 | 100–110 | 4–5 | ~14 |
Table 2.
Influence of flow intensity of process streams on the duration of electrodialysis.
Table 2.
Influence of flow intensity of process streams on the duration of electrodialysis.
| Flow Intensity of Streams, dm3/h | Electrodialysis Time, h |
|---|
| 0.75 | 5.0 |
| 3.0 | 1.4 |
| 4.5 | 1.6 |
| 5.0 | 1.2 |
| 7.0 | 1.8 |
Table 3.
Time of each electrodialysis process vs. applied current densities.
Table 3.
Time of each electrodialysis process vs. applied current densities.
| Current Density, A/m2 | Electrodialysis Time, h |
|---|
| 150 | 2.0 |
| 200 | 1.8 |
| 250 | 1.6 |
| 300 | 1.4 |
Table 4.
The change in perrhenic acid concentration in anolyte and catholyte and rhenium in diluate, both before and after process, for all four attempts.
Table 4.
The change in perrhenic acid concentration in anolyte and catholyte and rhenium in diluate, both before and after process, for all four attempts.
| Current Density, A/m2 | Anolyte HReO4, g/dm3 | Catholyte HReO4, g/dm3 | Diluate Re, g/dm3 |
|---|
| Before | After | Before | After | Before | After |
|---|
| 150 | 30.0 | 34.4 | 30.0 | 31.6 | 17.5 | 0.35 |
| 200 | 30.9 | 29.1 | 0.20 |
| 250 | 31.4 | 28.7 | 0.12 |
| 300 | 30.5 | 28.9 | 0.14 |
Table 5.
Electrodialysis time vs. current densities in trials with new combined diluate.
Table 5.
Electrodialysis time vs. current densities in trials with new combined diluate.
| Current Density, A/m2 | Electrodialysis Time, h |
|---|
| 150 | 1.6 |
| 200 | 2.1 |
| 300 | 3.6 |
| Disclaimer/Publisher’s Note: The statements, opinions and data contained in all publications are solely those of the individual author(s) and contributor(s) and not of MDPI and/or the editor(s). MDPI and/or the editor(s) disclaim responsibility for any injury to people or property resulting from any ideas, methods, instructions or products referred to in the content. |
© 2024 by the authors. Licensee MDPI, Basel, Switzerland. This article is an open access article distributed under the terms and conditions of the Creative Commons Attribution (CC BY) license (https://creativecommons.org/licenses/by/4.0/).
