Abstract
In the continuous scaling-up process of the separating system, a mechanism exists that transforms the behavior of the flow field, resulting in deviations from the original model and conclusions. The paper examined the effects of the scale up of a fluidized bed by CFD. It was observed that increasing the diameter reduces the amplitude of axial density fluctuations. Similarly, increasing the static height increases the amplitude. Moreover, increasing the static bed height enhances the visibility of the cyclic flow structure of gas and solid phases. The flow structure in large bed diameters is disrupted. The impact of changing the bed diameter on bed density is more significant than the static height. As the bed diameter increases, the bubble disturbance decreases and the aggregation phase gradually disappears while the proportion of the emulsified phase keeps increasing. This study will guide and assist in the future application of separated fluidized beds in industry.
1. Introduction
At present, research on the fluidization and separation characteristics of fluidized beds is limited to technical theories and conditions and is conducted at the laboratory level. The structure formed by multi-component particles is complex, and there is a mechanism of flow field behavior transformation during the scaling-up process, which leads to deviations in the theoretical prediction model and experimental conclusions [1]. In addition, when gas–solid separation fluidized beds are scaled up, the size of bubbles increases significantly, particle back-mixing becomes more severe, and abnormal fluidization phenomena like channel flow and agglomeration occur more quickly in the bed. As a result, the bed density becomes uneven, and the efficiency of mineral particle separation deteriorates. These issues are commonly known as the system’s scaling-up effect [2].
Circulation, flow, and contacting patterns in large reactors differ from those in small-scale units [3]. In the pilot reactor, the bubble size reached the bed diameter, causing slugging. In large commercial reactors, bubbles could grow continuously, and their rise velocity also increased proportionally [4]. The slug rise velocity is slower than the bubble rise velocity [5]. De Groot et al. [6,7,8] discovered that bed expansion depends on bed diameter and is affected by wall effects. Contact with the reactor wall may impact the interaction between particles and gas in the bed. When enlarging the gas–solid fluidized bed, it is necessary to consider the impact of the reactor diameter on fluid dynamics [9,10]. Frye et al. [11] studied how bed diameter affects the chemical conversion of ozone decomposition reactions. The reaction rate was observed to decrease gradually as the bed diameter increased, with three sizes examined (R = 0.051 m, 0.203 m, and 0.762 m). In addition, Fu [12] observed that the minimum fluidization velocity of B-type particles increases gradually as the bed height increases. Scaling laws for fluidized beds have been developed by Glicksman [13] and Horio [14]. The purpose of these laws is to serve as a reference for creating small-scale, cold flow models that exhibit the same hydrodynamic behavior as large, hot commercial units.
The fluidized bed’s deviation from the theoretical model and experimental conclusions may be attributed to scale issues. Therefore, accurately revealing the scaling-up effect during the continuous scaling-up process of the separation fluidized bed is crucial for restricting its industrial scaling-up.
Experimental research is frequently restricted by measurement methods and testing conditions, which leads to most studies being confined to macroscopic scales. Obtaining all possible microscale information in laboratory- and industrial-scale research is not possible. Simple experimental methods are not effective in identifying the complex structure of fluid-particle systems. Numerical simulation has become an important method for studying gas–solid two-phase interaction in this context. It can provide theoretical guidance for regulating fluidized beds at micro- and macroscales [15,16,17,18].
Currently, there are two main models used for simulating gas–solid fluidized beds: the Euler–Euler (EE) model and the Euler–Lagrange (EL) model. EL models usually consider the solid phase as a separate entity called the Discrete Element Method (DEM), while the gas phase is treated as a continuous phase. The EE model is alternatively referred to as the Two-Fluid Model (TFM) [19,20,21,22]. The Navier–Stokes equation is used to model the gas and solid phases as interpenetrating continuums. TFM has a major benefit in that it can handle a large number of particles without the need to track the trajectory of each individual particle. CFD-DEM is also a commonly used simulation method, but it also has limitations such as high computational complexity, dependence on particle material models, sensitivity to time steps, and sensitivity to boundary conditions [23,24,25]. ANSYS Fluent achieves the best convergence speed and accuracy by utilizing multiple solving methods and multi-grid accelerated convergence techniques [26,27,28].
In the traditional chemical industry, researchers have scaled up reactors based on proposed scaling methods and achieved good research results [29,30]. But, at the current stage, there is no clear conclusion regarding gas–solid separation fluidized beds; therefore, a fixed proportion cannot be used for scaling up. In this paper, we gradually increase the bed diameter and height to simulate the scaling-up process of the system and hoped to reveal the scaling-up effect of fluidized dry separating machines. This study utilized the ANSYS Fluent 2021R1 software with Two-Fluid Model in order to analyze the variations in axial and radial density fluctuations, gas–solid two-phase flow velocity, and two-phase distribution during the scale-up process of gas–solid fluidized beds.
2. Numerical Method
The simulation parameters are provided in Table 1. The bed size was configured in a two-dimensional view. Gas was introduced from the bottom, with an initial particle volume fraction set at 0.6. The wall condition was maintained as a no-slip condition, and additional details are presented in Table 1. The simulation process sets various static bed heights and diameters as follows: 20 cm, 30 cm, 50 cm, and 70 cm for bed heights and 10 cm, 15 cm, and 38 cm for bed diameters, as shown in Figure 1. The fluidization regime belongs to bubbling of fluidized bed. All control equations are listed in the Appendix A.

Table 1.
Parameter set for the simulation.
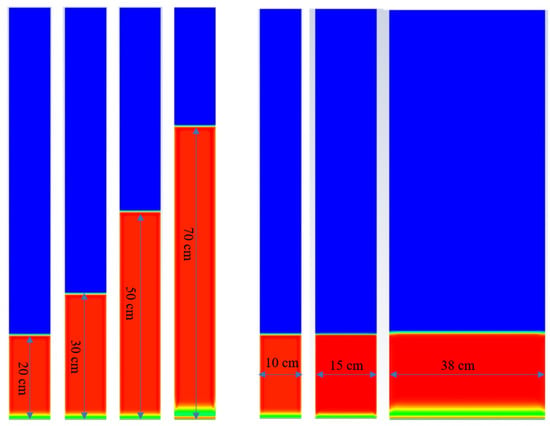
Figure 1.
Different fluidized bed sizes.
3. Results and Discussion
3.1. Grid Independence
The parameter of grid size has a significant impact on the accuracy and efficiency of the simulation process. Therefore, before formal discussion, this section will first discuss the grid independence of the simulation results. We use four grid sizes (3 ds, 5 ds, 10 ds, 20 ds), where dp is the particle size. Gas velocity Ug = 0.2 m/s, static bed height Hs = 20 mm. Figure 2 shows the variation of static pressure along the axial height simulated under different grid sizes, with a statistical time of 10 s. It can be seen that the distribution trend of static pressure for grid sizes of 10 times and 20 times particle sizes is basically consistent. Similarly, conducting grid independence checks on fluidized beds of other diameters ultimately yields the optimal grid size. Considering the calculation time factor, a grid with a particle size of 10 times will be used as the standard for all simulation calculations in subsequent discussions.
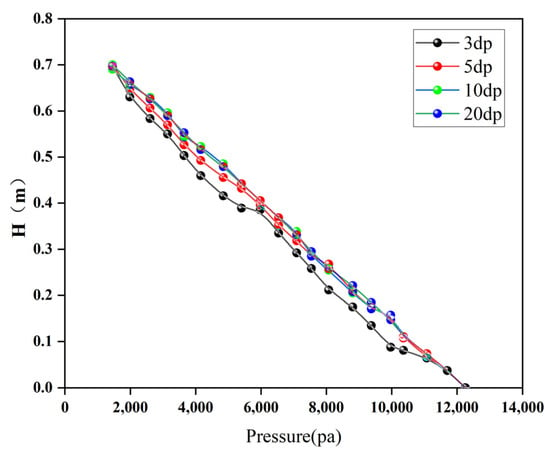
Figure 2.
The influence of grid size on the axial pressure (R = 15 cm).
3.2. Changes in Axial Density of the Bed
Figure 3 shows the axial density variation of the bed at position 2/D across various bed diameters (D:10, 15, 38) and bed heights (H:20, 30, 50, 70). From the graph, it is evident that when the bed height is constant, increasing the bed diameter leads to a decrease in the amplitude of axial density fluctuation in the bed. Similarly, when the bed diameter remains constant, increasing the static bed height results in a gradual increase in the amplitude of axial density fluctuation in the bed. Based on Figure 4, it can be observed that the bed diameter and static bed height have minimal impact on the axial average density. Under the same static bed height conditions, the average bed density increases, and the standard deviation of density fluctuations decreases as the bed diameter increases. This is because, when combined with Figure 5, the smaller the bed diameter, the bubble can grow and approach the bed diameter more easily. This leads to severe density fluctuations and a decrease in the average bed density. On the contrary, as the bed diameter increases, the impact of bubble motion on global density fluctuations decreases, and the average bed density increases. Furthermore, when considering the same bed diameter, the influence of static bed height on the average axial density of the bed is not substantial. However, it does have a notable effect on the fluctuation of axial density. Specifically, as the static bed height increases, the standard deviation of axial density fluctuation of the bed also increases. The reason is that as the static bed height increases, the growth of bubbles becomes closer to sufficient and has a greater impact on the axial density of the bed layer.
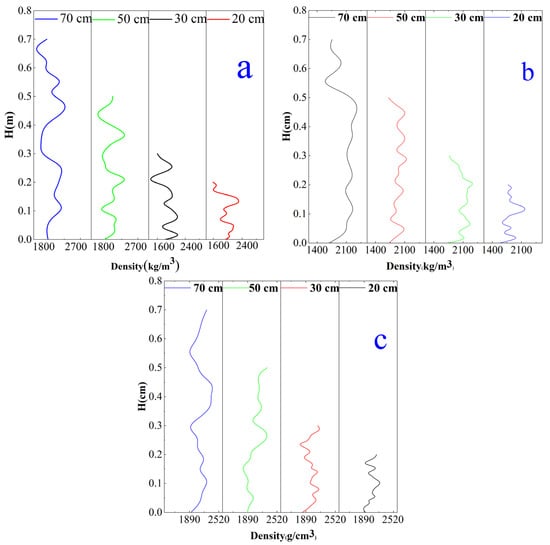
Figure 3.
Changes in axial density of the bed ((a): D = 10 cm, (b): D = 15 cm, (c): D = 38 cm).
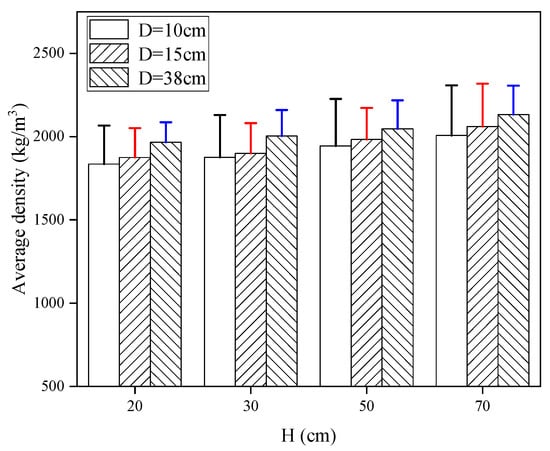
Figure 4.
Average density variation with error bar.
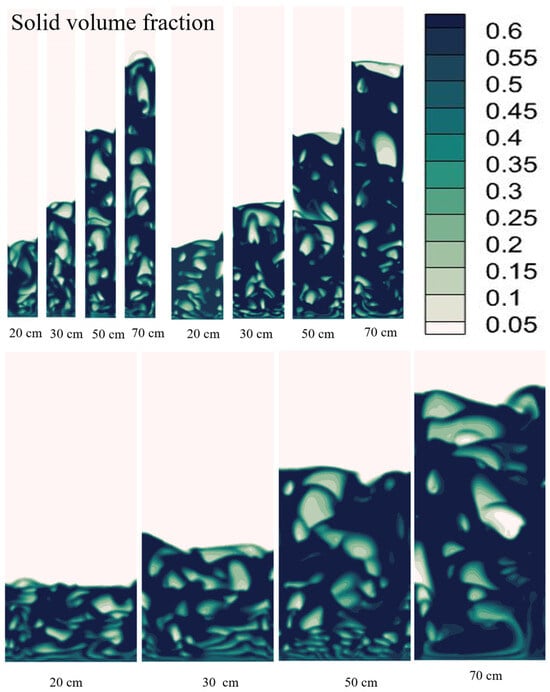
Figure 5.
Solid volume fraction changes under various conditions (t = 5 s).
3.3. Two-Phase Flow Velocity
Understanding the flow structure of fluidized beds is crucial for the design of fluidized bed separators. The flow pattern of particles within a fluidized bed is a significant factor to consider.
Figure 6 and Figure 7 depict axial velocity changes of solid particles and gas at various bed positions. At h/H = 0.5, the gas phase velocity is much greater than the solid phase particle velocity. The velocity at the center is positive, and the velocity at the edge wall is negative. The particles exhibit a circulating flow structure, rising in the middle and falling on both sides within the bed. As the static bed height increases, the cyclic flow structure of gas and solid phases becomes more evident. Furthermore, when comparing small bed diameters, the circulating flow structure at large bed diameters gradually becomes disrupted, resulting in a more uniform and unified flow structure. At h/H = 1.0, the gas phase velocity remains greater than the solid phase particle velocity. The impact of the change in static bed height on the axial particle velocity of the gas–solid two-phase flow is not significant. The primary manifestation is a flow structure where gas and solid particles circulate, rising in the center and falling on either side. The impact of the change in bed diameter on the gas–solid two-phase flow is more prominent. As the bed diameter increases, the axial velocity fluctuation of the gas–solid two-phase flow decreases, and the flow structure becomes more uniform in larger bed diameters. Moreover, the influence of bed diameter is greater at h/H = 1.0 compared to h/H = 0.5. As the fluidized bed size increases, the wall effect weakens, causing smaller velocity fluctuations of particles in larger bed diameters. The graph shows that the gas phase axial velocity has a radial distribution pattern with high values in the middle and low values on both sides. The low solid content at the center allows gas to pass through easily, leading to this primarily.
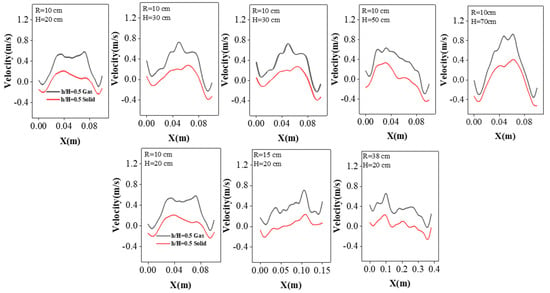
Figure 6.
Radial velocity variation of gas and solids (h/H = 0.5).
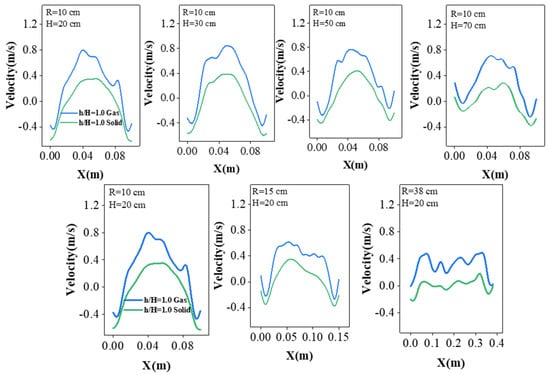
Figure 7.
Radial velocity variation of gas and solids (h/H = 1.0).
3.4. Radial Density Changes in the Bed
Figure 8a,b show the radial density fluctuations of the bed at various h/H = 0.5 positions, with different static bed heights and bed diameters. Based on the graph, it is observed that for a bed diameter of 10 cm, the static bed height does not have a significant impact on the radial density fluctuation of the bed. All variations exhibit similar patterns: low density at the center of the bed layer and high density near the edge wall. The low density in the central area is due to the edge wall effect, which influences the gas flow through the bed. The central solid content is also low, causing the gas to preferentially pass through the bed along the radial center position. In addition, it is evident from Figure 8b that the alteration in bed diameter has a greater influence on the radial bed density when compared to the variation in static bed height. As the bed diameter increases, the radial density fluctuation of the bed stabilizes. The reason for this is that as the bed diameter increases, it becomes more difficult for the bubble size to match the bed diameter. Small bubbles can pass through the bed not only at the radial center position but also along various pathways away from the edge wall area. As the bed diameter increases, the number of pathways increases and the mutual influence decreases. Therefore, the radial density fluctuation region is stable.
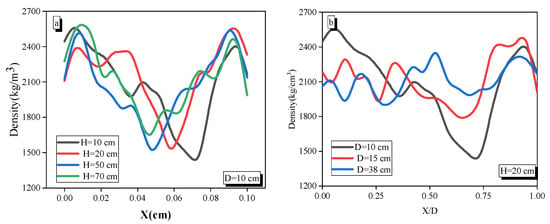
Figure 8.
Radial density variation ((a): D = 10 cm; (b): H = 20 cm).
3.5. Study of Phase Distribution Patterns
Gas–solid fluidization is known for its distinct properties, and the presence of both a bubble phase and emulsion phase in the bed is a prominent fluidization characteristic. The ratio of the bubble phase and emulsified phase composition determines the density and separation performance of the fluidized bed. Therefore, a precise and relevant theory hypothesis is vital for dry separation in fluidized two-phase systems.
Figure 9 shows the solid content fluctuation pattern at the center position of the bed, with a height of H/2, when the values of D and H are 10 cm and 70 cm, respectively. We adjusted the bed flow structure to match three distinct instantaneous solid holdups. Orange dots represent particles. Mark point 1: The solid content is small, about 0.1, indicating a larger bubble passing through the test point. Mark point 2: The solid content is relatively high, around 0.6, indicating a large bubble gradually decreasing below the test point. Point 3: The solid content ranges from 0.3 to 0.4, indicating the initial movement of a bubble from the test point. Based on simulation results and existing research, a solid content of 0.3 is selected as the boundary between the bubble phase and the emulsion phase. The solid content of <0.3 represents the bubble phase, while 0.3 < solid content < 0.6 indicates the emulsion phase. If any, a solid content > 0.6 corresponds to the agglomerate phase. The plotted quadrants in Figure 10 are shown. Based on the quadrant requirements in the figure, the proportions of the bubble phase, emulsion phase, and agglomerate phase can be determined for various conditions.
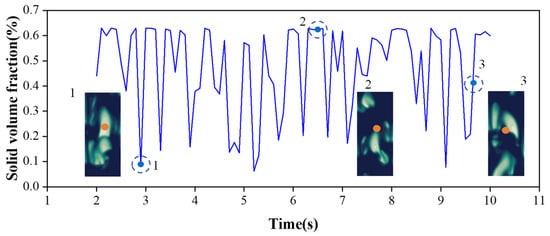
Figure 9.
Instantaneous change in solid volume fraction (D = 10 cm, H = 70 cm).
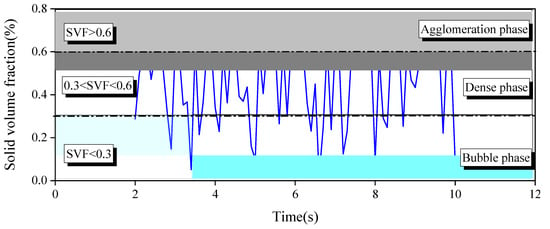
Figure 10.
Multiphase partition diagram (D = 10 cm, H = 50 cm).
Figure 11 and Figure 12 depict the proportional changes of the agglomerate phase, emulsion phase, and bubble phase across various bed diameters and bed heights. Based on the graph, it is evident that with a bed diameter of 10 cm, the proportion of agglomerates increases as the static bed height increases: 25%, 37%, 37%, and 44%. Similarly, the proportions of emulsions decrease to 47%, 38%, 38%, and 35%, and the proportions of bubbles also decrease to 28%, 25%, 25%, and 21%. The ratio of agglomerates increases gradually, while the ratio of bubble phase and emulsion phase decreases gradually. When the bed diameter is 10 cm, as the static bed height increases, the bubble size also increases, and the bubble movement compresses the emulsified phase, leading to agglomerate formation. As the static bed height increases, the disturbance of bubble growth on the bed becomes more apparent. Similarly, as the agglomerate ratio increases, the stability of the bed decreases. With a static bed height of 30 cm, as the bed diameter increases, the proportions of agglomerates are 37%, 0%, and 0%. The proportions of emulsions are 38%, 83%, and 89%. The proportions of bubbles are 25%, 17%, and 11%. This indicates a gradual decrease in the proportions of agglomerates and bubbles and a gradual increase in the proportion of emulsions. In specific static bed height scenarios, when the bubble size is smaller compared to the bed diameter, the bed fluidization becomes more stable. This also leads to smaller bubble disturbance, the gradual disappearance of agglomerates, and an increasing proportion of emulsified phases. Under specific static bed height conditions, it is evident that the greater the diameter of the bed, the higher the likelihood of achieving bed stability.

Figure 11.
Changes in phase proportions under different conditions (D = 10 cm).
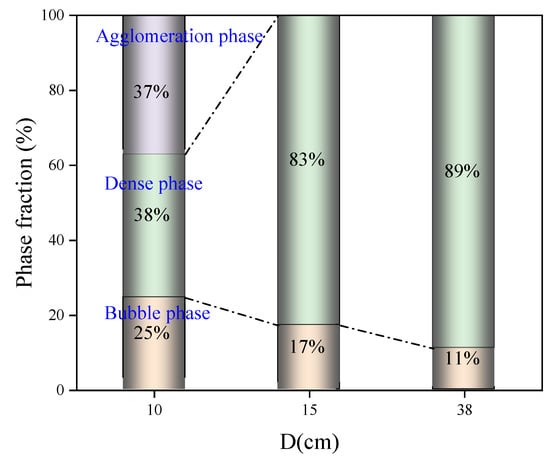
Figure 12.
Phase proportion changes under different conditions (H = 30 cm).
4. Conclusions
The study analyzed the impact of the continuous enlargement process of a fluidized bed on bed density, gas–solid two-phase flow structure, and proportion changes through simulation. The study yielded innovative findings as follows:
(1) As the bed diameter increases, the amplitude of axial density fluctuations in the bed decreases while keeping the bed height constant. As the bed height increases, the amplitude of axial density fluctuations in the bed also increases while keeping the bed diameter constant.
(2) When the static bed height increases, the cyclic flow structure of gas and solid phases becomes more noticeable. In addition, when comparing small bed diameters to large bed diameters, the circulating flow structure gradually becomes disrupted, resulting in a more uniform and unified flow structure.
(3) As the bed diameter gradually increases, the radial density fluctuation of the bed gradually stabilizes. The impact of altering the bed diameter on radial bed density is more notable when compared to the change in static bed height.
(4) In specific static bed height scenarios, a greater bed diameter promotes enhanced bed stability. As the bed height increases, the proportion of agglomerates also increases. As the bed diameter increases, the bubble disturbance decreases, and the aggregation phase gradually disappears while the proportion of the emulsified phase keeps increasing.
Author Contributions
Conceptualization, Z.G. and H.W.; methodology, Z.G.; software, Z.G. and J.W.; validation, Z.G. and J.W.; formal analysis, H.W.; investigation, H.W.; resources, H.W.; data curation, Z.G. and J.W.; writing—original draft preparation, Z.G. and J.W.; writing—review and editing, Z.G. and J.W.; visualization, H.W.; supervision, C.Z.; project administration, C.Z.; funding acquisition, Z.G. and C.Z. All authors have read and agreed to the published version of the manuscript.
Funding
This research was funded by the Scientific Research Foundation for High-level Talents of Anhui University of Science and Technology (2023yjrc05), National Natural Science Foundation of China (52304279), and National Natural Science Foundation of China (52104276, 52220105008).
Data Availability Statement
The original contributions presented in the study are included in the article, further inquiries can be directed to the corresponding author.
Conflicts of Interest
The authors declare no conflict of interest.
Appendix A
Continuity equation (i = gas phase and solid phase)
Momentum equations
For gas phase:
For solid phase:
Constitutive equations
Stress tensor of gas phase
Stress tensor of solid phase
Solid pressure
Radial distribution at contact
Solid phase bulk viscosity
Interphase drag coefficient
Gidaspow model:
Turbulence modeling
References
- Li, J.; Jiang, W.; Tang, S.Y. Experimental Design of Reactor Scaling Criteria Exploration. Exp. Sci. Technol. 2019, 17, 46–50. [Google Scholar]
- Gao, Z.L.; Lu, G.X.; Duan, C.L.; Zhou, C.Y.; Zhu, H.Z. Bed density prediction during fluidized bed scaling up using machine learning. Adv. Powder Technol. 2023, 34, 104278. [Google Scholar] [CrossRef]
- Fitzgerald, T.; Bushnell, D.; Crane, S.; Shieh, Y.-C. Testing of cold scaled bed modeling for fluidized-bed combustors. Powder Technol. 1984, 38, 107–120. [Google Scholar] [CrossRef]
- Knowlton, T.M.; Karri, S.B.R.; Issangya, A. Scale-up of fluidized-bed hydrodynamics. Powder Technol. 2005, 150, 72–77. [Google Scholar] [CrossRef]
- Yang, W.C. Handbook of Fluidization and Fluid-Particle Systems, 1st ed.; Marcel Dekker: New York, NY, USA, 2003. [Google Scholar]
- De Groot, J.H. Fluidization Performance Large Scale Equipment. In Fluidization; Netherlands University Press: Amsterdam, Netherlands, 1967; pp. 348–358. [Google Scholar]
- Werther, J. Influence of the Bed Diameter on the Hydrodynamics of Gas Fluidized Beds. AIChE Symp. Ser. 1974, 70, 53–62. [Google Scholar]
- Bakshi, A.; Altantzis, C.; Glicksman, L.R.; Ghoniem, A.F. Gas-flow distribution in bubbling fluidized beds: CFD-based analysis and impact of operating conditions. Powder Technol. 2017, 316, 500–511. [Google Scholar] [CrossRef]
- Mabrouk, R.; Radmanesh, R.; Chaouki, J.; Guy, C. Scale Effects on Fluidized Bed Hydrodynamics. Int. J. Chem. React. Eng. 2005, 3, 18. [Google Scholar] [CrossRef]
- Bao, G.Q.; Gu, W.G.; Mu, W.G. Machine learning based prediction of minimum fluidization velocity in gas-solid fluidized beds. Clean Coal Technol. 2021, 27, 25–31. [Google Scholar]
- Frye, C.G.; Lake, W.C.; Eckstrom, H.C. Gas-solid contacting with ozone decomposition reaction. AIChE J. 1958, 4, 403–408. [Google Scholar] [CrossRef]
- Zhou, C.Y. Density Adjustment in Gas-Solid fluidized Bed for Beneficiation Using Geldart a Dense Medium. Ph.D. Thesis, China University of Mining and Technology, Xuzhou, China, 2019. [Google Scholar]
- Glicksman, L. Scaling relationships for fluidized beds. Chem. Eng. Sci. 1988, 43, 419. [Google Scholar] [CrossRef]
- Horio, M.; Ishii, H.; Sawa, Y.; Muchi, I. A new similarity rule for fluidized bed scale up. AIChE J. 1986, 32, 1466. [Google Scholar] [CrossRef]
- Luo, H.; Lu, B.N.; Zhang, J.Y.; Wu, H.; Wang, W. A grid-independent EMMS/bubbling drag model for bubbling and turbulent fluidization. Chem. Eng. J. 2017, 326, 47–57. [Google Scholar] [CrossRef]
- He, J.F. Numerical Simulation of Multiphase Fluid Dynamics in an Air Heavy Medium Fluidized Bed Based on the Euler-Euler Model. Ph.D. Thesis, China University of Mining and Technology, Xuzhou, China, 2012. [Google Scholar]
- Luo, J.W.; Wang, Y.B.; Li, W. A dual fluid model of gas-solid bubbling bed structure and its simulation verification. J. Process Eng. 2024, 24, 435–444. (In Chinese) [Google Scholar]
- Van der Hoef, M.A.; Annaland, M.V.; Kuipers, J.A.M. Computational fluid dynamics for dense gas-solid fluidized beds: A multi-scale modeling strategy. Chem. Eng. Sci. 2004, 59, 5157–5165. [Google Scholar] [CrossRef]
- Wang, J.W. Continuum theory for dense gas-solid flow: A state-of the-art review. Chem. Eng. Sci. 2020, 215, 115428. [Google Scholar]
- Beetstra, R.; Van der Hoef, M.A.; Kuipers, J.A.M. Drag force of intermediate Reynolds number flow past mono- and bidisperse arrays of spheres. AIChE J. 2007, 53, 489–501. [Google Scholar] [CrossRef]
- Van der Hoef, M.A.; Beetstra, R.; Kuipers, J.A.M. Lattice-Boltzmann simulations of low-Reynolds-number flow past mono- and bidisperse arrays of spheres: Results for the permeability and drag force. J. Fluid Mech. 2005, 528, 233–254. [Google Scholar] [CrossRef]
- Alobaid, F.; Almohammed, N.; Farid, M.M. Progress in CFD simulations of fluidized beds for chemical and energy process engineering. Prog. Energy Combust. Sci. 2022, 91, 100930. [Google Scholar]
- Handayani, S.U.; Wahyudi, H.; Agustina, S. CFD-DEM Study of heat and mass transfer of ellipsoidal particles in fluidized bed dryers. Powder Technol. 2023, 425, 118535. [Google Scholar] [CrossRef]
- Xie, Y.; Chen, Y.; Fang, Z.; Zhou, H.; Wei, S.; Yang, L. The research of gas-solid fluidized bed bubbling behavior based on CFD-DEM coupled simulation. Chem. Eng. Res. Des. 2023, 195, 166–180. [Google Scholar] [CrossRef]
- Li, G.; Zhang, H.; Ye, X.; Su, Y.; Yu, A.; Tan, Y. Numerical Investigation on Thermal Drying Process of Sludges Based on CFD-DEM. Ind. Eng. Chem. Res. 2023, 62, 16990–17007. [Google Scholar] [CrossRef]
- Zhu, H.P.; Zhou, Z.Y.; Yang, R.Y. Discrete particle simulation of particulate systems: A review of major applications and findings. Chem. Eng. Sci. 2008, 63, 5728–5770. [Google Scholar] [CrossRef]
- Zhu, H.P.; Zhou, Z.Y.; Yang, R.Y. Discrete particle simulation of particulate systems: Theoretical developments. Chem. Eng. Sci. 2007, 62, 3378–3396. [Google Scholar] [CrossRef]
- Rong, L.W.; Dong, K.J.; Yu, A.B. Lattice-Boltzmann simulation of fluid flow through packed beds of spheres: Effect of particle size distribution. Chem. Eng. Sci. 2014, 116, 508–523. [Google Scholar] [CrossRef]
- Mirek, P.; Ziaja, J. The influence of sampling point on solids suspension density applied in scaling of the hydrodynamics of a supercritical CFB boiler. Chem. Process Eng. 2011, 32, 391–399. [Google Scholar] [CrossRef]
- Leckner, B.; Szentannai, P.; Winter, F. Scale-up of fluidized-bed combustion—A review. Fuel 2011, 90, 2951–2964. [Google Scholar] [CrossRef]
Disclaimer/Publisher’s Note: The statements, opinions and data contained in all publications are solely those of the individual author(s) and contributor(s) and not of MDPI and/or the editor(s). MDPI and/or the editor(s) disclaim responsibility for any injury to people or property resulting from any ideas, methods, instructions or products referred to in the content. |
© 2024 by the authors. Licensee MDPI, Basel, Switzerland. This article is an open access article distributed under the terms and conditions of the Creative Commons Attribution (CC BY) license (https://creativecommons.org/licenses/by/4.0/).