Article

A Revisit to Effervescence-Assisted Microextraction of Non-Polar Organic Compounds Using Hydrophobic Magnetic Nanoparticles—Application to the Determination of UV Filters in Natural Waters

by
Efthymia Toti
,
Vasiliki Gouma
,
Vasiliki I. Karagianni
and
Dimosthenis L. Giokas
*
Department of Chemistry, University of Ioannina, 44510 Ioannina, Greece
*
Author to whom correspondence should be addressed.
Separations 2024, 11(11), 315; https://doi.org/10.3390/separations11110315
Submission received: 26 September 2024 / Revised: 23 October 2024 / Accepted: 29 October 2024 / Published: 1 November 2024
(This article belongs to the Section Environmental Separations)

Abstract

:
In this work, we revisited the method of effervescence-assisted microextraction, aiming to assess the effects of the process of effervescence on the extraction efficiency of organic compounds. We used a magnetic nano-sorbent material composed of stearic acid-coated cobalt-ferrite magnetic nanoparticles as an adsorbent and dispersed it in water using 12 combinations of acid and base mixtures at two different mass ratios. The solution pH, the ionic strength, and the duration of effervescence were calculated and correlated to the extraction efficiency of nonpolar UV filters from aqueous samples as model organic compounds. Our findings provide a general perspective into the influence of the process of effervescence on extraction efficiency. Based on these findings, we developed and optimized a new analytical method for extracting UV filters from water samples using HPLC-UV as a detector. Under the optimum experimental conditions (0.2 g fumaric acid/0.1 g Na2CO3, 50 mg of magnetic nanoparticles and methanol as an elution solvent assisted by vortex agitation for 5 min) the method was found to afford good linearity in the calibration curves expanding by two orders of magnitude, satisfactory reproducibility and repeatability (1.8–11.1%), and high recoveries (78.4–127.1%). This research provides a new perspective on the influence of the process of effervescence on the extraction efficiency of nonpolar organic compounds and introduces a new method for extracting UV filters from aqueous media.

Graphical Abstract

1. Introduction

Effervescence-assisted microextraction, developed over a decade ago, is a method that simplifies and streamlines sample preparation processes employing dispersed sorbent materials [1]. The method is based on a simple reaction that produces carbon dioxide bubbles in situ in an aqueous sample solution, effectively promoting the dispersion and mixing of the sorbent (receiving phase) into the solution (donor phase). This approach was developed to minimize the effort associated with the manual and time-consuming steps (e.g., vortex, end-over-end or orbital agitation, ultrasounds) required to bring a small amount of sorbent in contact with the sample solution to achieve the extraction of the analytes [2,3]. Moreover, the method could facilitate on-site sample treatment thus minimizing the problems associated with sample transportation and storage [2,4]. In the course of this time, effervescence-assisted microextraction has evolved to include magnetic sorbents and liquid solvent media (ionic liquids, organic solvents, etc.), further simplifying its use and expanding its analytical application and scope to the extraction of a wide range of organic and inorganic analytes in multiple sample matrices (water, food, biofluids, etc.) [1,2,5,6,7,8,9,10,11,12,13,14].
The development of effervescence-assisted microextraction methods, except for selecting the appropriate extractant (sorbent) phase that can effectively uptake the target analytes, also relies on selecting reagents that generate CO2 and induce the effervescence to effectively disperse the sorbent. Dispersion is an important step in all microextraction methods because they are usually performed under diffusion-controlled conditions stemming from the significant differences in size between the donor solution and the extractant phase [2,15]. Therefore, the intensity and duration of mixing controls the dispersion of the sorbent and, consequently, the diffusion of the analytes from the sample to the sorbent phase and the extraction kinetics. In effervescence-assisted microextraction, long effervescent times and intense bubbling should favor extraction efficiency by maximizing the contact of the extractant phase with the target analytes. For this reason, several studies have tested different acid/base mixtures to find the most appropriate combination, using sodium carbonate or bicarbonate as a base and CO2 donor, and a weak organic acid as a proton source [5,6,7,8,9,10,11,12,13,14].
A retrospection of previous studies shows that there is no consensus on the best acid/base combination, even though the central role of effervescence is to accomplish the mixing and dispersion of the sorbent for adequate time to achieve the extraction [5,6,7,8,9,10,11,12,13,14]. The reason for these differences has not been elucidated. Still, each acid/base mixture can generate bubbles for a different time, and affects the solution’s ionic strength and pH, which are critical parameters that influence the extraction efficiency. Increasing the ionic strength may enhance the extraction efficiency due to the salting-out effect but at high salt concentrations, the viscosity of the solution increases, thus reducing the mass transfer rate of the analytes from the aqueous to the sorbent phase [6,16] due to the viscous resistance effect [17,18]. Similarly, the solution pH affects both the ionization state of the analytes and the surface charge of the sorbent, thus controlling both the mass transfer rate and the extraction efficiency. However, to our knowledge, no study has determined the molar concentration of ionic strength in the solution after effervescence and correlated its value with the extraction efficiency. Along the same line, in some studies, the pH is controlled by the composition of the effervescent tablets (reagents and their ratio) while in others, effervescence is performed in solutions with pre-adjusted pH values. In either case, the different acid/base combinations and concentration ratios induce changes in the final pH of the solution.
In this work, we elaborate on the experimental conditions affecting the efficiency of effervescence-assisted microextraction by testing a wide range of acid/base combinations, aiming to identify the influence of the process of effervescence on extraction efficiency. Using stearic acid-coated magnetic nanoparticles as extraction sorbent, we tested 12 acid/base combinations at two mass ratios. We used these data to develop a sample preparation method for the extraction of organic UV filters from water samples as model hydrophobic organic compounds. The parameters affecting the extraction efficiency, namely the concentration of ionic strength, effervescence time, and the solution pH, were evaluated and discussed in relation to their effect on the extraction efficiency of UV filters. To our knowledge, a quantitative analysis of the experimental parameters affecting the efficiency of effervescence-assisted microextraction has not been reported before. The extraction and determination of UV filters using effervescence-assisted microextraction by magnetic nanoparticles is also presented for the first time.

2. Materials and Methods

2.1. Reagents

Sodium bicarbonate, sodium carbonate anhydrous, sodium di-hydrogen phosphate monohydrate, and L(+)-tartaric acid were obtained by Merck (Darmstadt, Germany). Cobalt(II) nitrate hexahydrate and oxalic acid were procured from Fluka. 2-hydroxy-4-methoxybenzophenone (benzophenone-3 (BZ3)) > 98%, 22-Ethylhexyl 4-(olimethylamino)benzoate (EDP) > 98% and L-ascorbic acid was purchased from Sigma-Aldrich (Steinheim, Germany). Fumaric acid was obtained from BLD PHARMATECH (Reinben, Germany). Citric acid was purchased from Mallinckrodt (St. Louis, MO, USA) and potassium bicarbonate from Carlo Erba (Milan, Italy). Iron(III) chloride hexahydrate was purchased from VWR Chemicals (Darmstadt, Germany). 2-Ethylhexyl 4-Methoxycinnamate (EMC) > 97.0%, 2-Ethylhexyl 2-Cyano-3,3-diphenylacrylate (OCR) > 98% and Iso-amyl 4-Methoxycinnamate (IMC) > 95% were purchased from TCI (Zwijndrecht, Belgium), while 3-(-4-methyl benzylidene)camphor (MBC) > 99.7% was purchased from Guinama S.L (Valencia, Spain).

2.2. Instrumentation

ATR-IR spectra were recorded in a Perkin Elmer Spectrum Two IR. PXRD diffraction patterns were recorded on a Bruker D2 Phaser X-ray diffractometer (CuKα radiation, wavelength = 1.54184 Å). Scanning electron microscopy (SEM) and Energy Dispersive Spectroscopy (EDS) studies were performed in samples, sputter-coated with a 5–10 nm Au film on FEG-SEM Zeiss SUPRA 35VP (resolution 1.7 nm at 15 kV) equipped with an EDS detector (QUANTA 200, Bruker AXS, Billerica, MA, USA). Water contact angles were determined using the drop shape analysis utility of the ImageJ software (v. 1.52a, National Institutes of Health, U.S.A.), and specifically the Low-Bond Axisymmetric Drop Shape Analysis (LBADSA) method. Zeta potential measurements were conducted with a Malvern Zetasizer Nano ZS (Malvern Analytical, Worcestershire, UK) in a two-electrode capillary cell.
The chromatographic separation of the examined UV filters was performed in a Shimadzu HPLC system (Shimadzu, Kyoto, Japan) (LC-20AD high-pressure solvent delivery pump, DGU-20A3 degasser, CTO-10A column oven) equipped with a Hypersil ODS C18 column (250 mm length, 4.6 mm I.D., 5 µm particle size) obtained from MZ Analysentechnick (Mainz, Germany), thermostated at 40 °C. The elution of UV filters was performed isocratically (1.0 mL min−1) with MeOH and water at a mixing ratio of 80:20 (v/v). The chromato-graphic peaks corresponding to each UV filter were recorded at 313 nm for all analytes in an SPD-10AV UV/Vis detector controlled by LC Solution software (v.1.25-SP4, Shimadzu, Kyoto, Japan). The magnetic properties of the samples were studied using a conventional Vibrating Sample Magnetometer (VSM) (LakeShore 7300, Westerville, OH, USA). M versus (vs.) external magnetic field (H) isothermal loops were recorded at constant temperature of 300 K in fields up to +/− 20 kOe.

2.3. Synthesis of Stearic Acid-Coated Cobalt Ferrite Magnetic Nanoparticles

CoFe2O4@stearic acid magnetic nanoparticles (MNPs) were synthesized by mixing 100 mL of a 0.4 M FeCl3·6H2O and 100 mL of a 0.2 M CoNO3·6H2O solutions. Then, 100 mL of a 3 M sodium hydroxide solution was added dropwise under continuous stirring. To this solution, 0.5 mL of stearic acid was introduced, and the mixture was heated to 80 °C for 1 h. The black suspension produced from the above procedure was cooled to room temperature. The magnetic nanoparticles were retained with a strong Nd magnet and washed several times with deionized water until the pH of the washing solution was neutral. Finally, the excess stearic acid was removed by washing the magnetic precipitate with ethanol. The magnetic nanoparticles were dried overnight at 80 °C and manually pulverized into fine (black) powder.

2.4. Preparation of Effervescent Tablets

To prepare effervescent tablets, 50 mg of MNPs, 150 mg of base, and 150 mg of acid (or 200 mg of acid and 100 mg of base for 2:1 acid: base mixtures) were mixed and manually blended in a mortar. The solid mixture was transferred to a 12 mm diameter mold and pressed for 30 min. The tablets were carefully removed and stored in a desiccator until use.

2.5. Experimental Procedure

An effervescent tablet was added to a 10 mL aqueous solution to extract UV filters. A large quantity of CO2 bubbles was immediately produced, lasting 40–240 s depending on the composition of the tablet, causing the vigorous dispersion of the MNPs. All tablets were allowed to complete effervescence up to 300 s. After extraction, a Nd magnet was placed alongside the tube to rapidly collect the MNPs, and the aqueous phase was discarded. The residual water was poured under a gentle stream of nitrogen, and 1 mL of HPLC-grade methanol was added to elute the analytes. Elution was carried out for 5 min, aided by vortex agitation. Finally, the methanolic extract was collected in a new vial (using a Nd magnet to isolate the MNPs), and a 50 μL aliquot was injected into the HPLC for analysis.

2.6. Real Samples

Real water samples (river, lake, and tap water) were collected in amber glass containers from the Louros River and Lake Pamvotis, (Epirus, NW Greece), while the tap water was obtained from the local water supply network. All samples were filtered through 0.45 μm membrane filters and stored in the dark for no more than one week at 4 °C before analysis. Refrigeration during storage was performed to inhibit microbial activity that could lead to changes in the physicochemical properties of the sample (e.g., pH, organic matter, etc.) which may influence the solubility and stability of the target contaminants. Filtration of the samples was employed to remove suspended solids [19]. In clean samples used for spiking experiments, the removal of suspended solids is necessary to avoid sorption of the spiked contaminants. In polluted samples filtration is required to to avoid the re-distribution of the analytes between the solids and the water phase that may lead to an under- or over-estimation of the soluble concentration of the target analytes.

3. Results

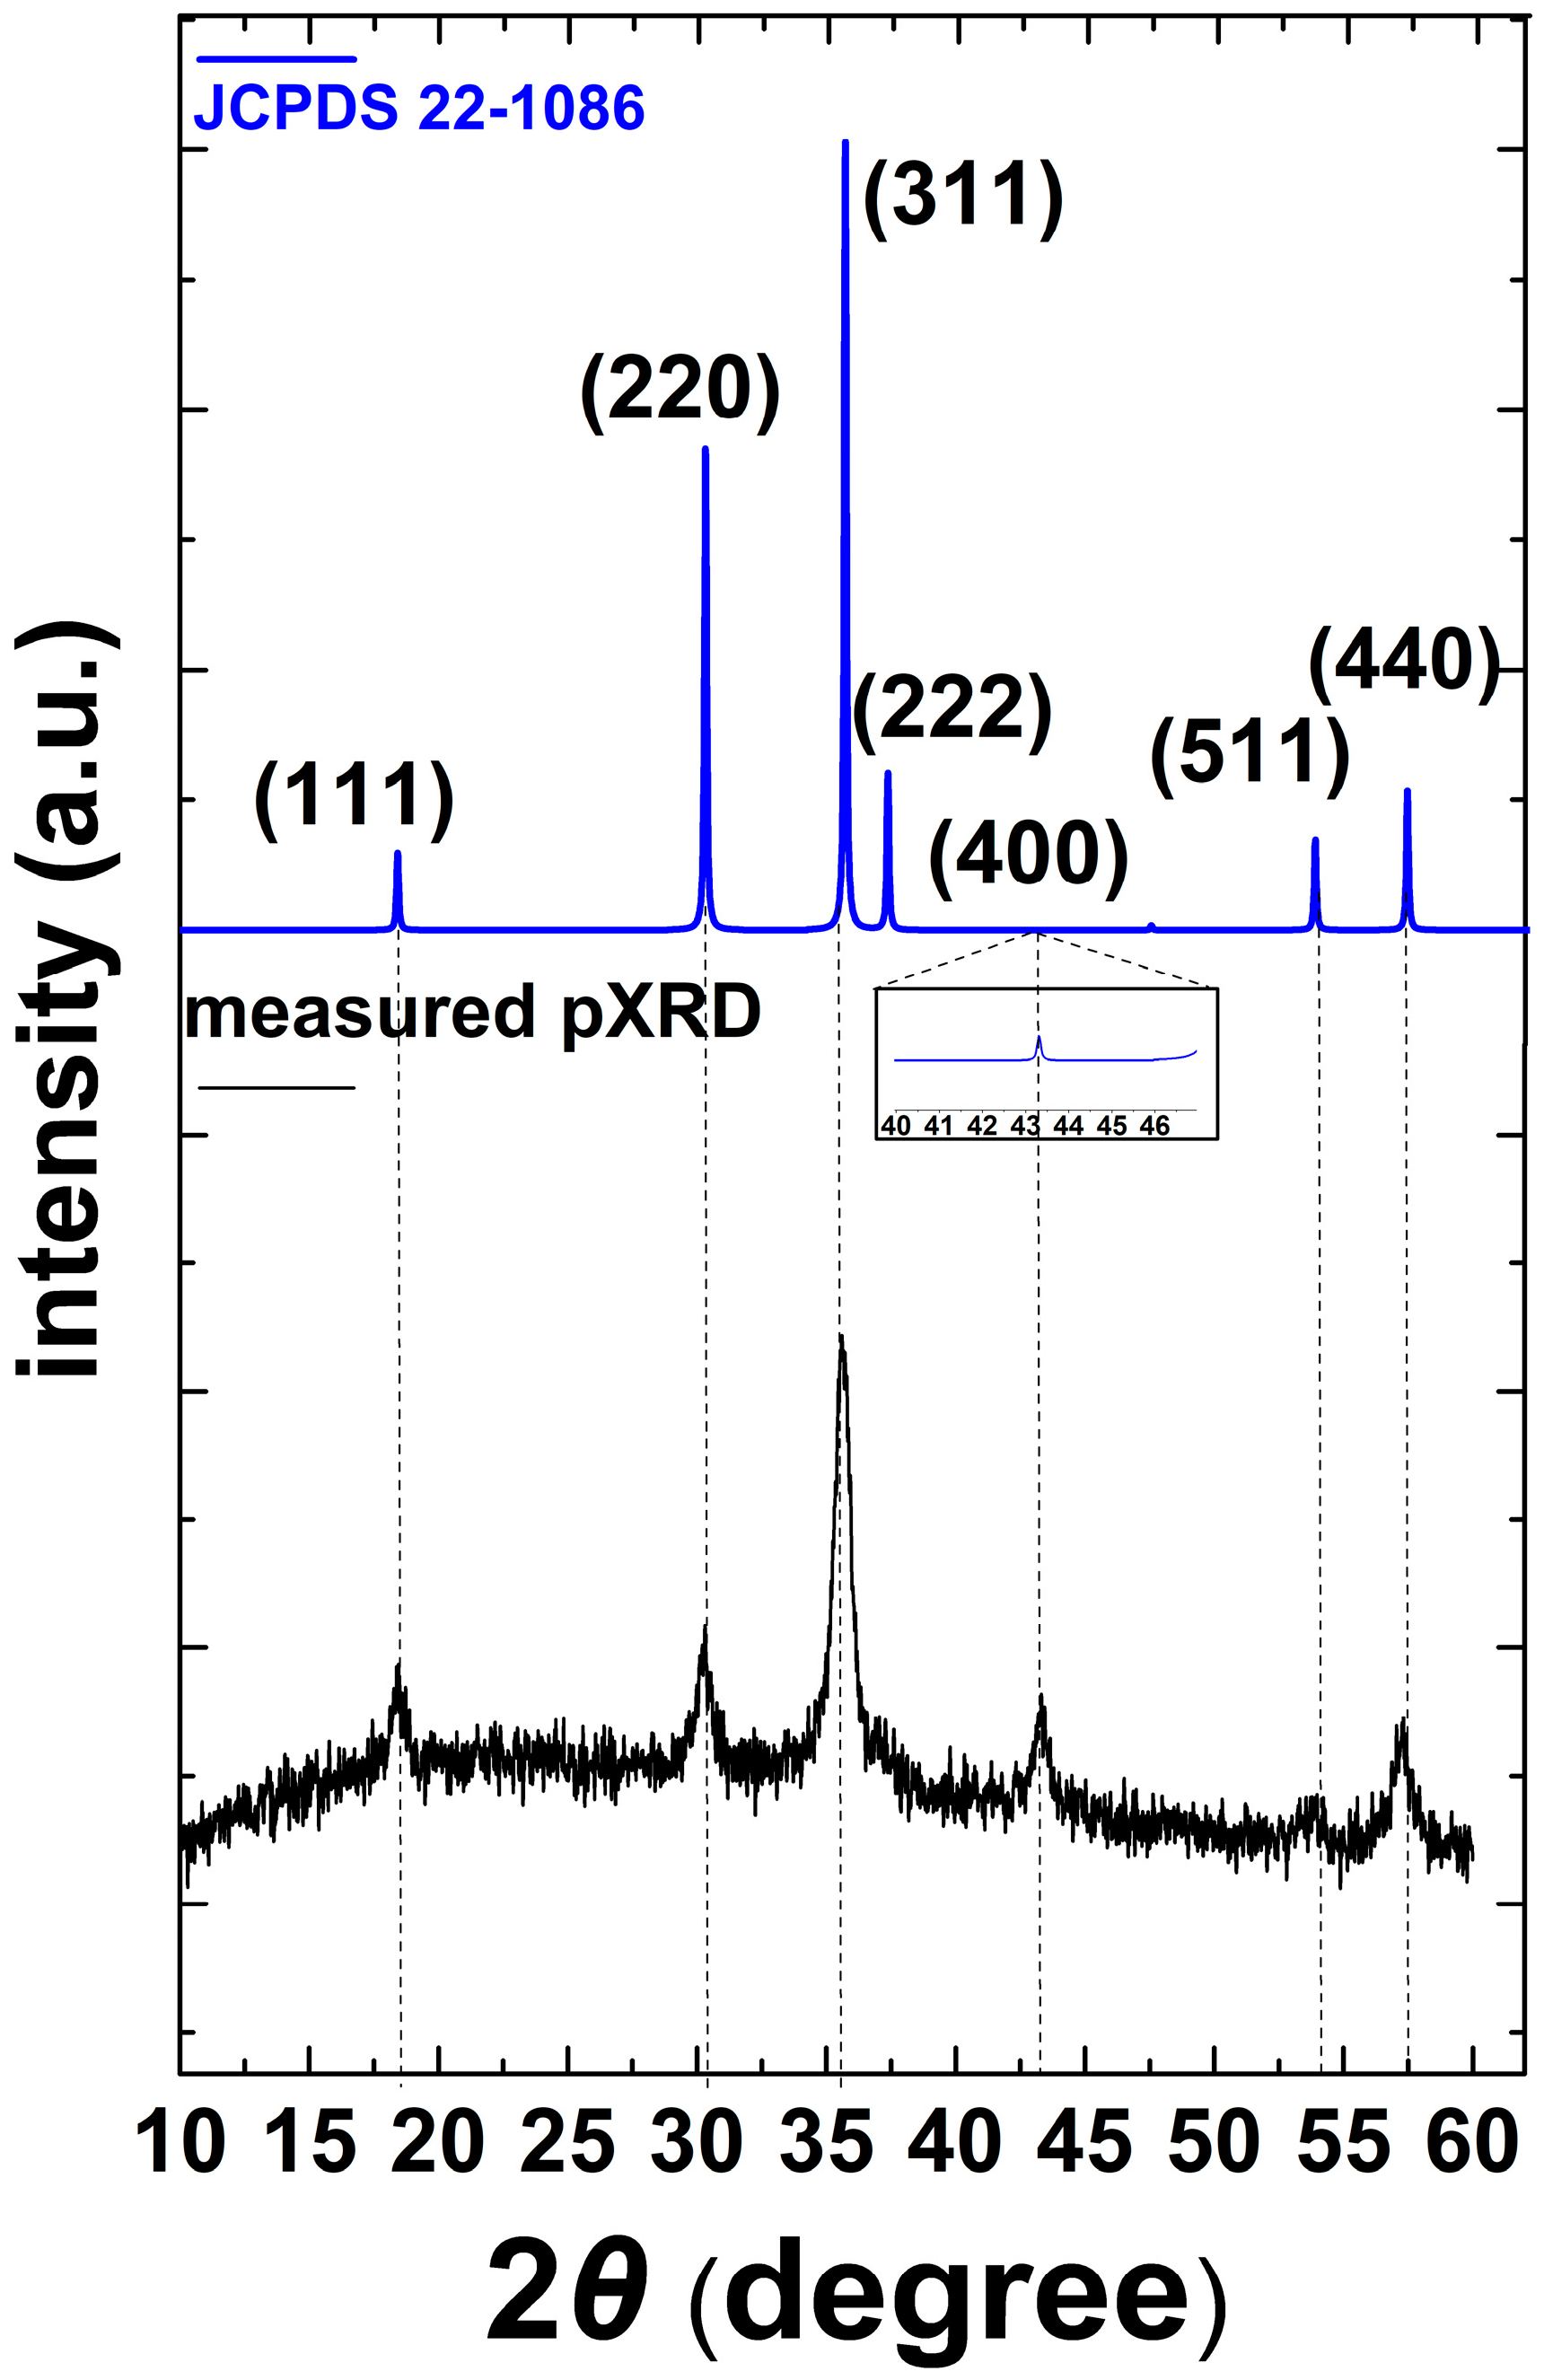
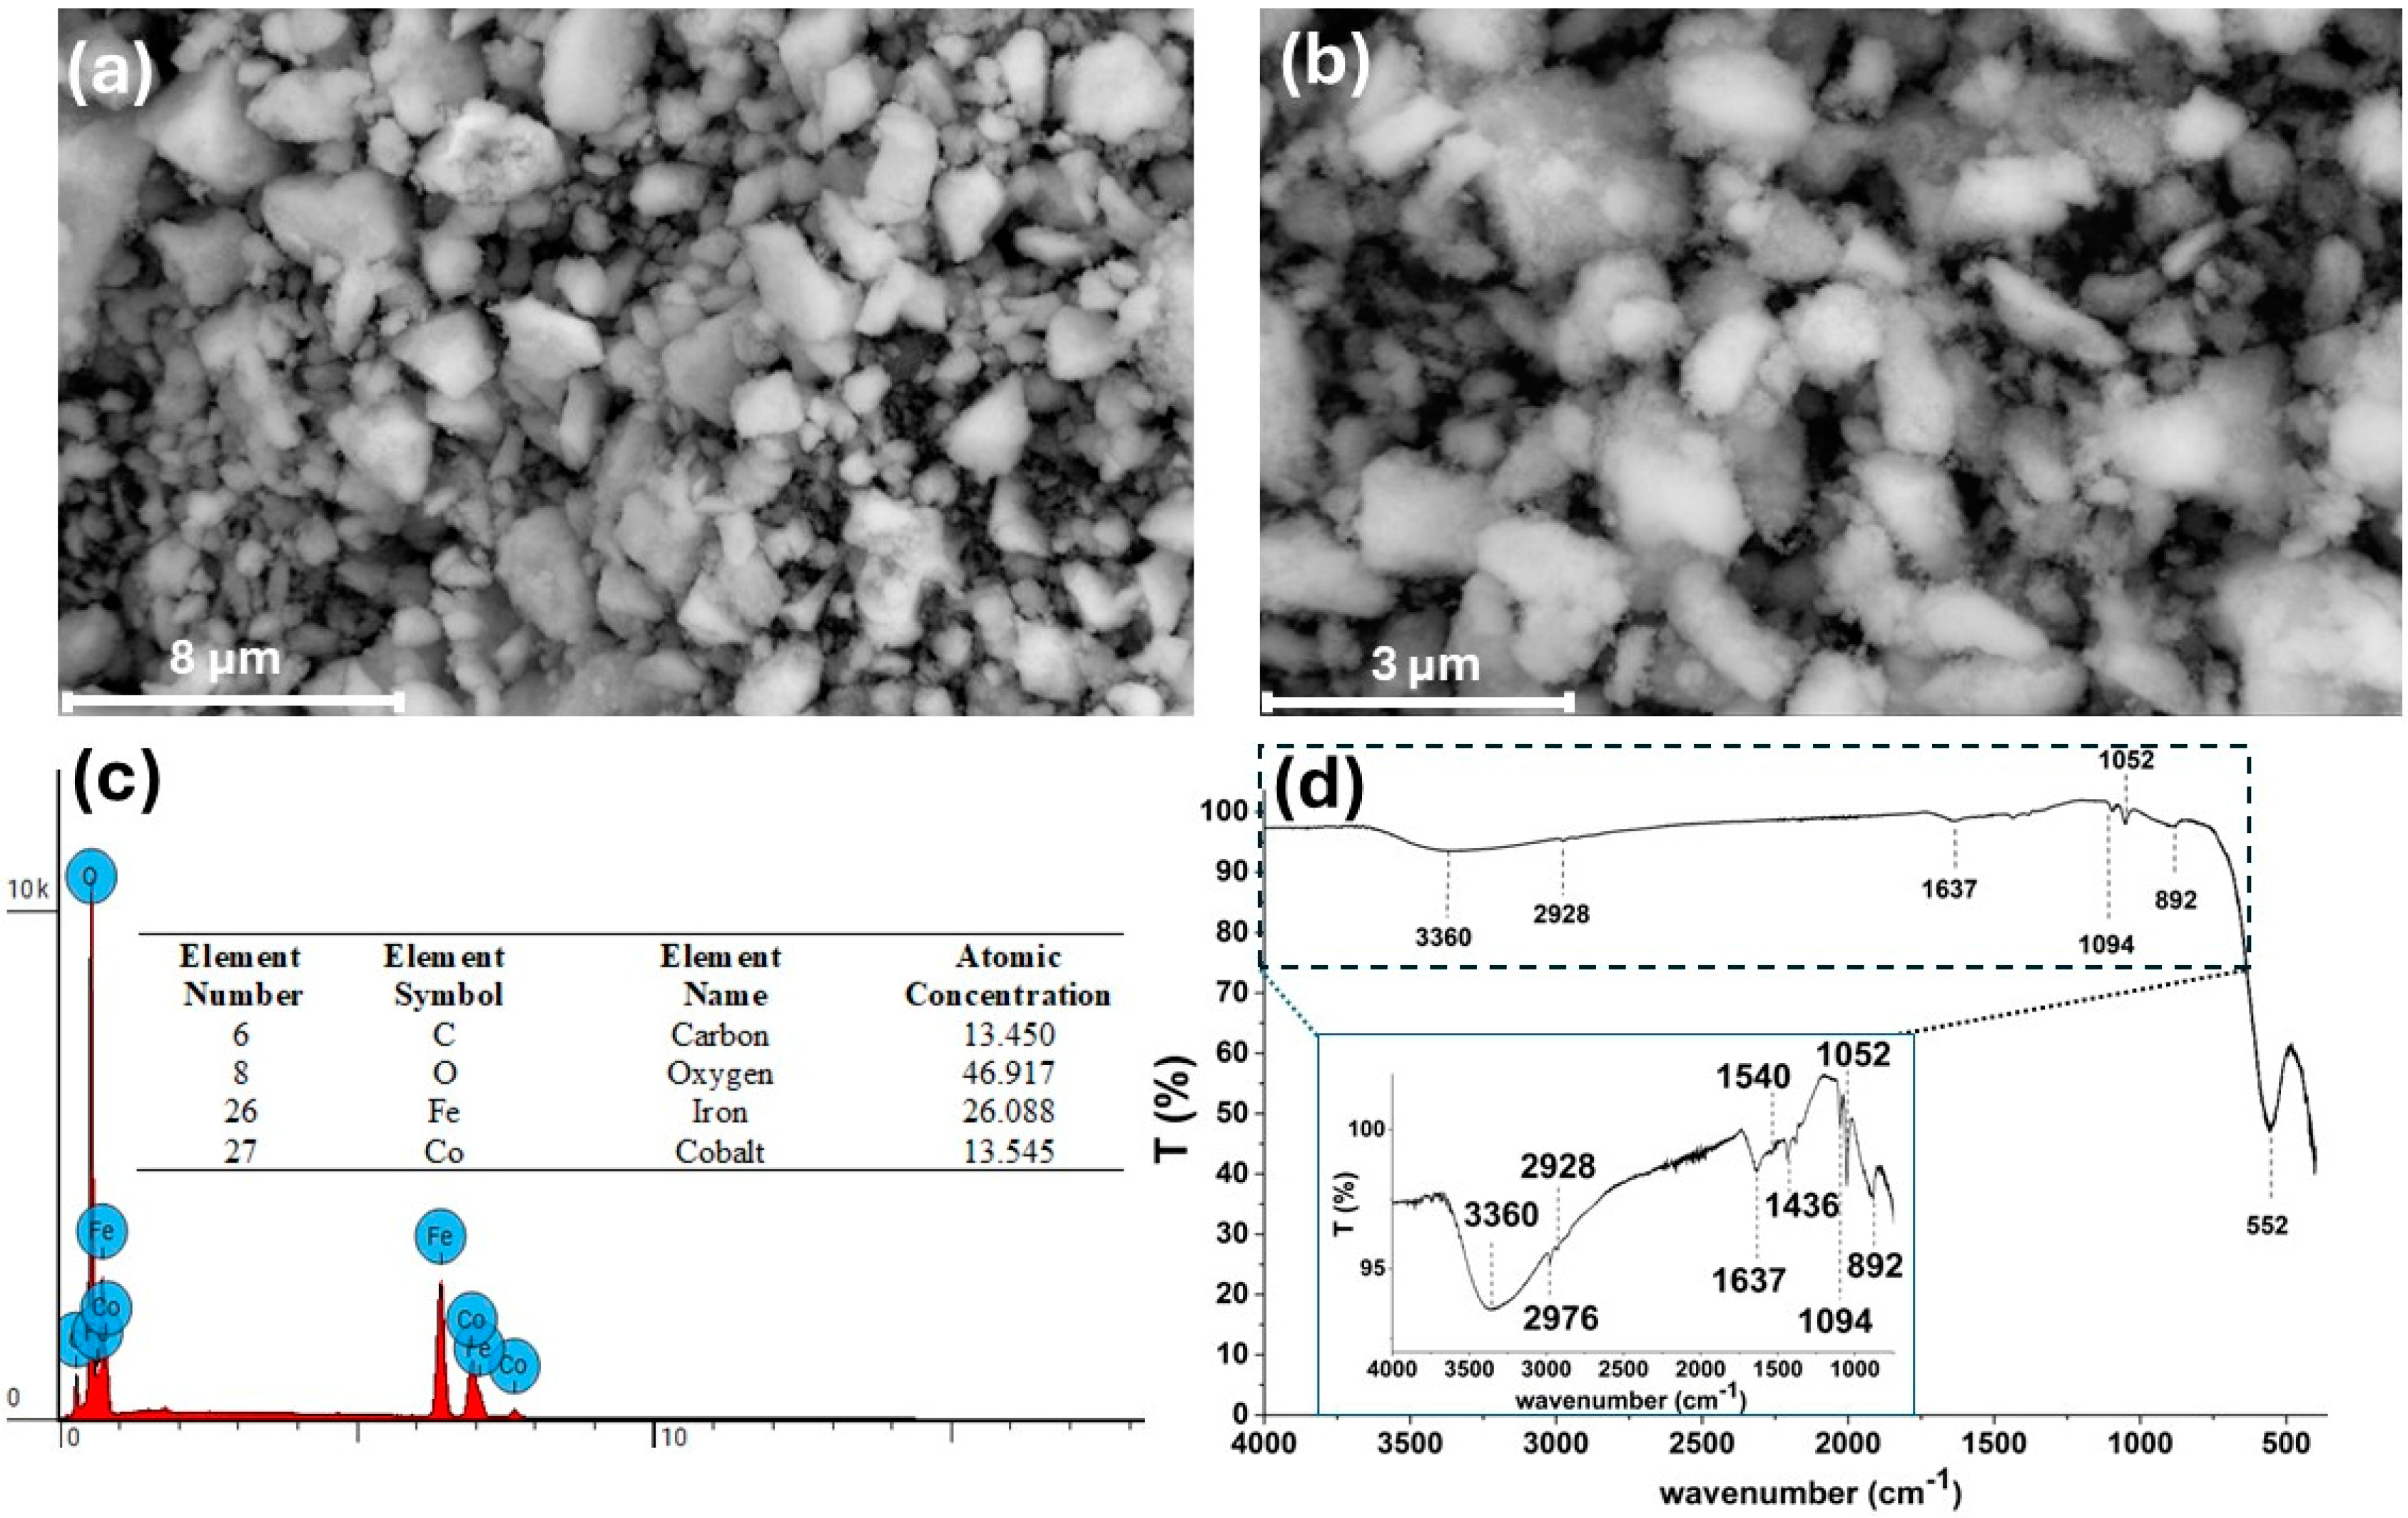
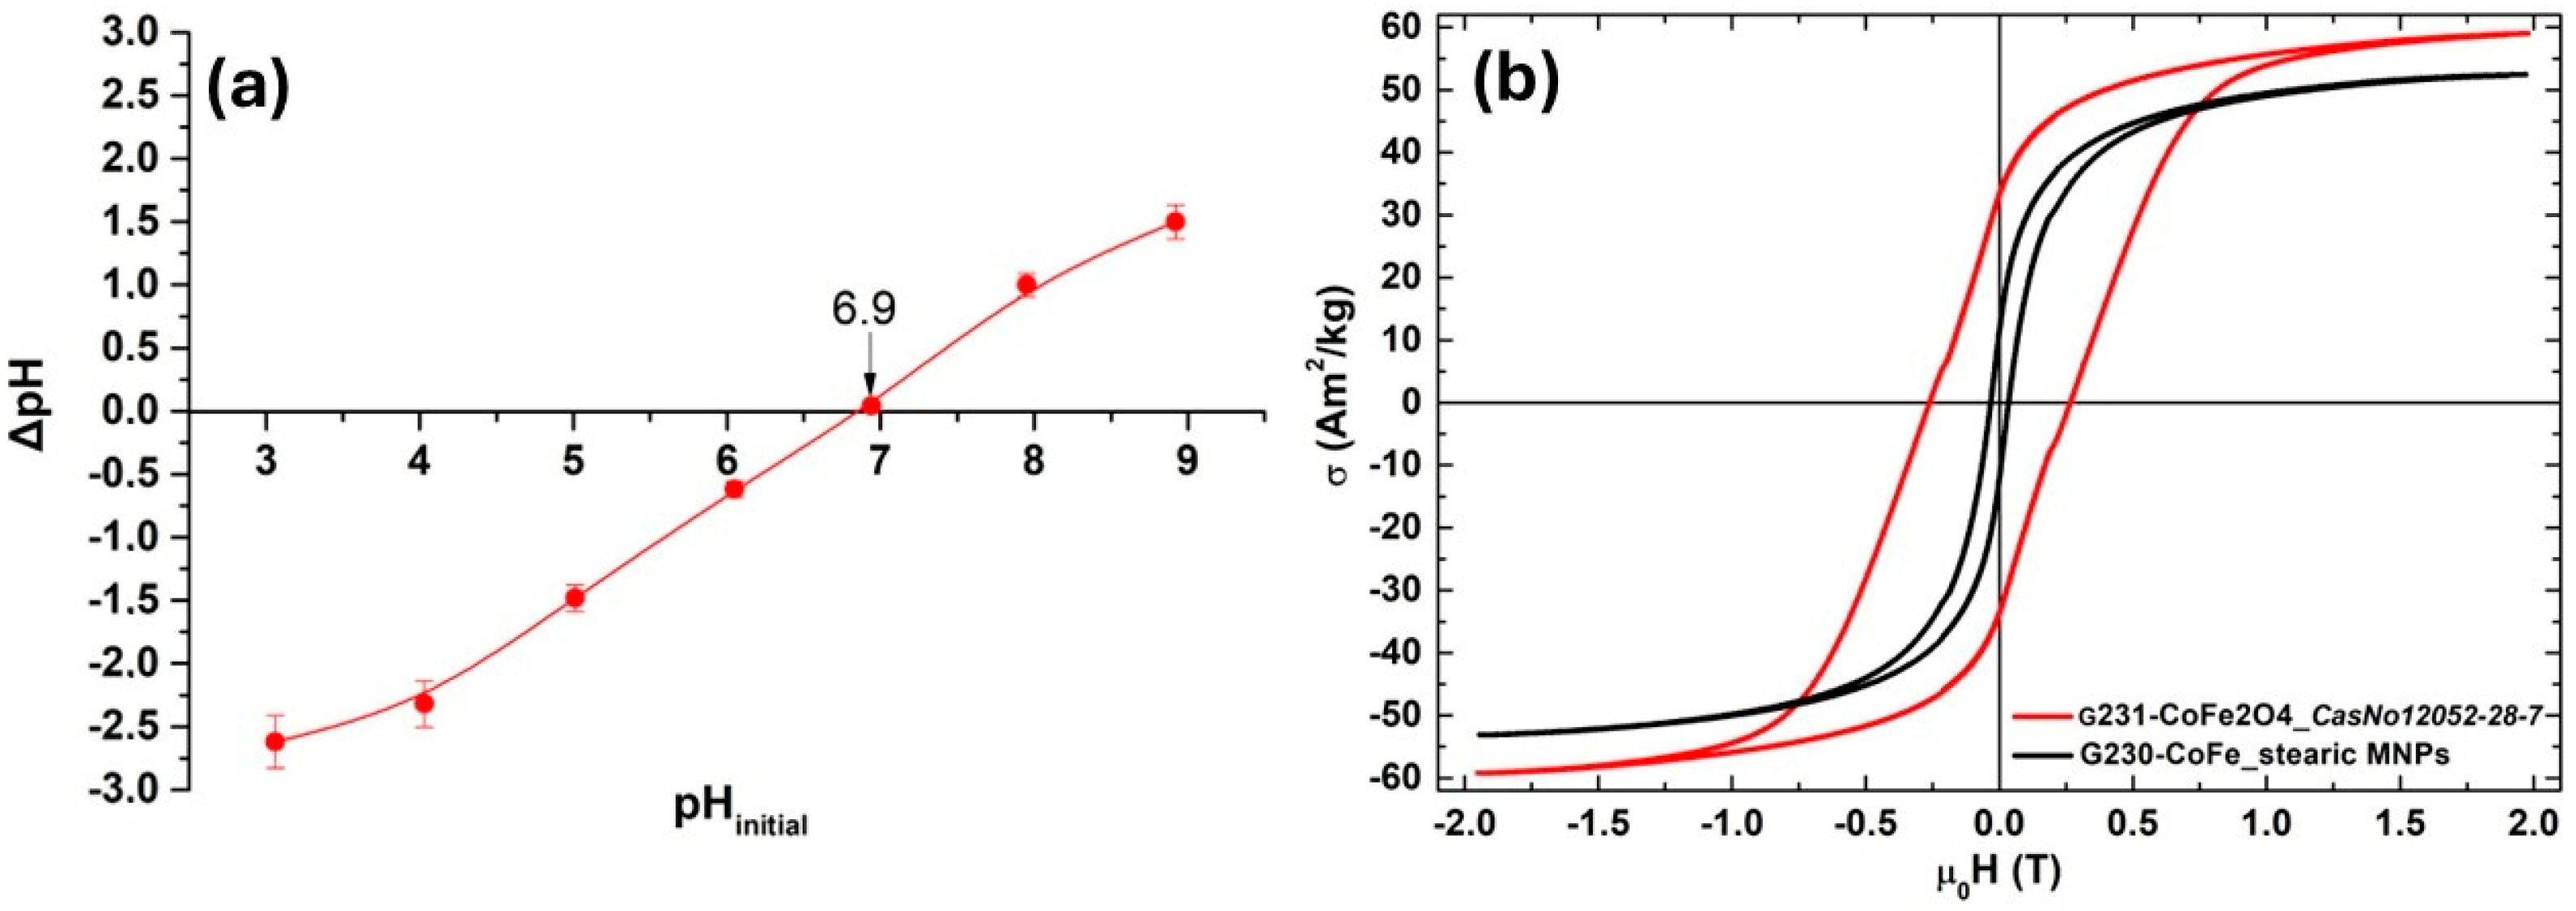
3.1. Characterization of CoFe2O4@Stearic Acid Magnetic Nanoparticles

Powder XRD verified the successful synthesis of CoFe2O4@stearic acid MNPs. The XRD pattern shown in Figure 1 shows the characteristic index peaks at 2θ = 18.53, 30.3, 35.74, 37.26, 43.25, 57.35, 62.94, corresponding to (111) (220) (222) (311) (400) (511) and (440) Bragg reflection, in agreement with JCPDS 22-1086 [20,21].
SEM images (Figure 2a,b) show that the morphology of several MNPs exhibits a cubic spinel structure. Still, due to their high surface energy, they tend to form agglomerates in an order of several hundreds of nanometers. However, agglomeration is not as intense as that usually reported for bare MNPs due to the presence of the fatty acid coating [20]. At higher resolution, the particles appear like snowflakes. These observations agree well with previous studies reporting on the synthesis of CoFe2O4@stearic acid MNPs by co-precipitation [22,23].
The composition of CoFe2O4@stearic acid MNPs was firstly corroborated by EDS measurements (Figure 2c), showing a stoichiometric Fe: Co ratio (2:1) and the presence of carbon at an almost equal percentage to Co, which verifies the presence of stearic acid. Evidence of the formation of the stearic acid coating was also obtained with ATR-IR analysis (Figure 2d). Although the ATR-IR bands of CoFe2O4@stearic acid MNPs were very weak due to the minimal amount of stearic acid used during synthesis [9] (0.23 g/L in this work), several characteristic bands can be detected. The bands at 3360 cm−1 and 1637 cm−1 bands can be assigned to–OH symmetric stretching and H–O–H bending, respectively, of water vapor adsorbed on the nanoparticles [24,25,26]. Stearic acid has a long aliphatic chain, and the methylene modes appear at 2920 and 2850 cm−1, respectively [25,27]. However, in the ATR-IR spectra shown in Figure 2d only the asymmetric CH2 stretch at 2928 cm−1 appears clearly. An additional band at 2976 cm−1 is also evident that may be assigned to C-H stretching [28,29]. This band may appear shifted towards higher wavenumbers in the presence of metal ions especially with the decreasing size of divalent metal cations due to the smaller size of the unit cell for smaller divalent cations [28]. The 1094 and 1052 cm−1 peaks are related to the C–C and C–O stretching vibrations, respectively [27,30]. The ATR-IR spectra also shows two bands at 1540 and 1436 cm−1, which correspond to the asymmetric (ⱱas) and symmetric (ⱱs) stretching vibrations of COO-, indicating the interaction between the MNPs and the fatty acid. The Δ (ⱱas−ⱱs) is 104 cm−1, which corresponds to chelating bidentate interaction and indicates that two O atoms of carboxylate group were equivalently bonded to Fe [27]. However, the lack of a stretching vibration of the C=O bond around 1700 cm−1 indicates the nonexistence of physically absorbed stearic acid and the formation of a monolayer coating on the surface of the MNPs [27]. Finally, the peak at 552 cm−1 could be assigned to the Fe–O lattice vibration.
The coating of stearic acid on the CoFe2O4 MNPs induced several changes in their properties. The water contact angle of bare MNPs (<20°) increased to 76° in CoFe2O4@stearic acid MNPs, indicating that the stearic acid coating decreased the wettability of the MNPs, but they remained hydrophilic, which is favorable for facilitating their dispersion into water. In the same line, the z-potential of the MNPs changed from negative (−23 mV) in bare (CoFe2O4) MNPs, to neutral (+2.3 mV) in stearic acid-coated MNPs. As a result, the zero point of charge (ZPC) of the CoFe2O4@stearic acid MNPS was neutral (6.90) (Figure 3a), which facilitates its interaction with non-polar analytes. Finally, the magnetization of the MNPs, examined by VSM (Figure 3b), shows that the saturation magnetization of CoFe2O4@stearic acid MNPs is reduced to 52 Am2/kg (from 58.5 Am2/kg in bare MNPS). They also exhibit smaller coercivity due to the formation of particle agglomerates, as also evidenced in the SEM images [31].

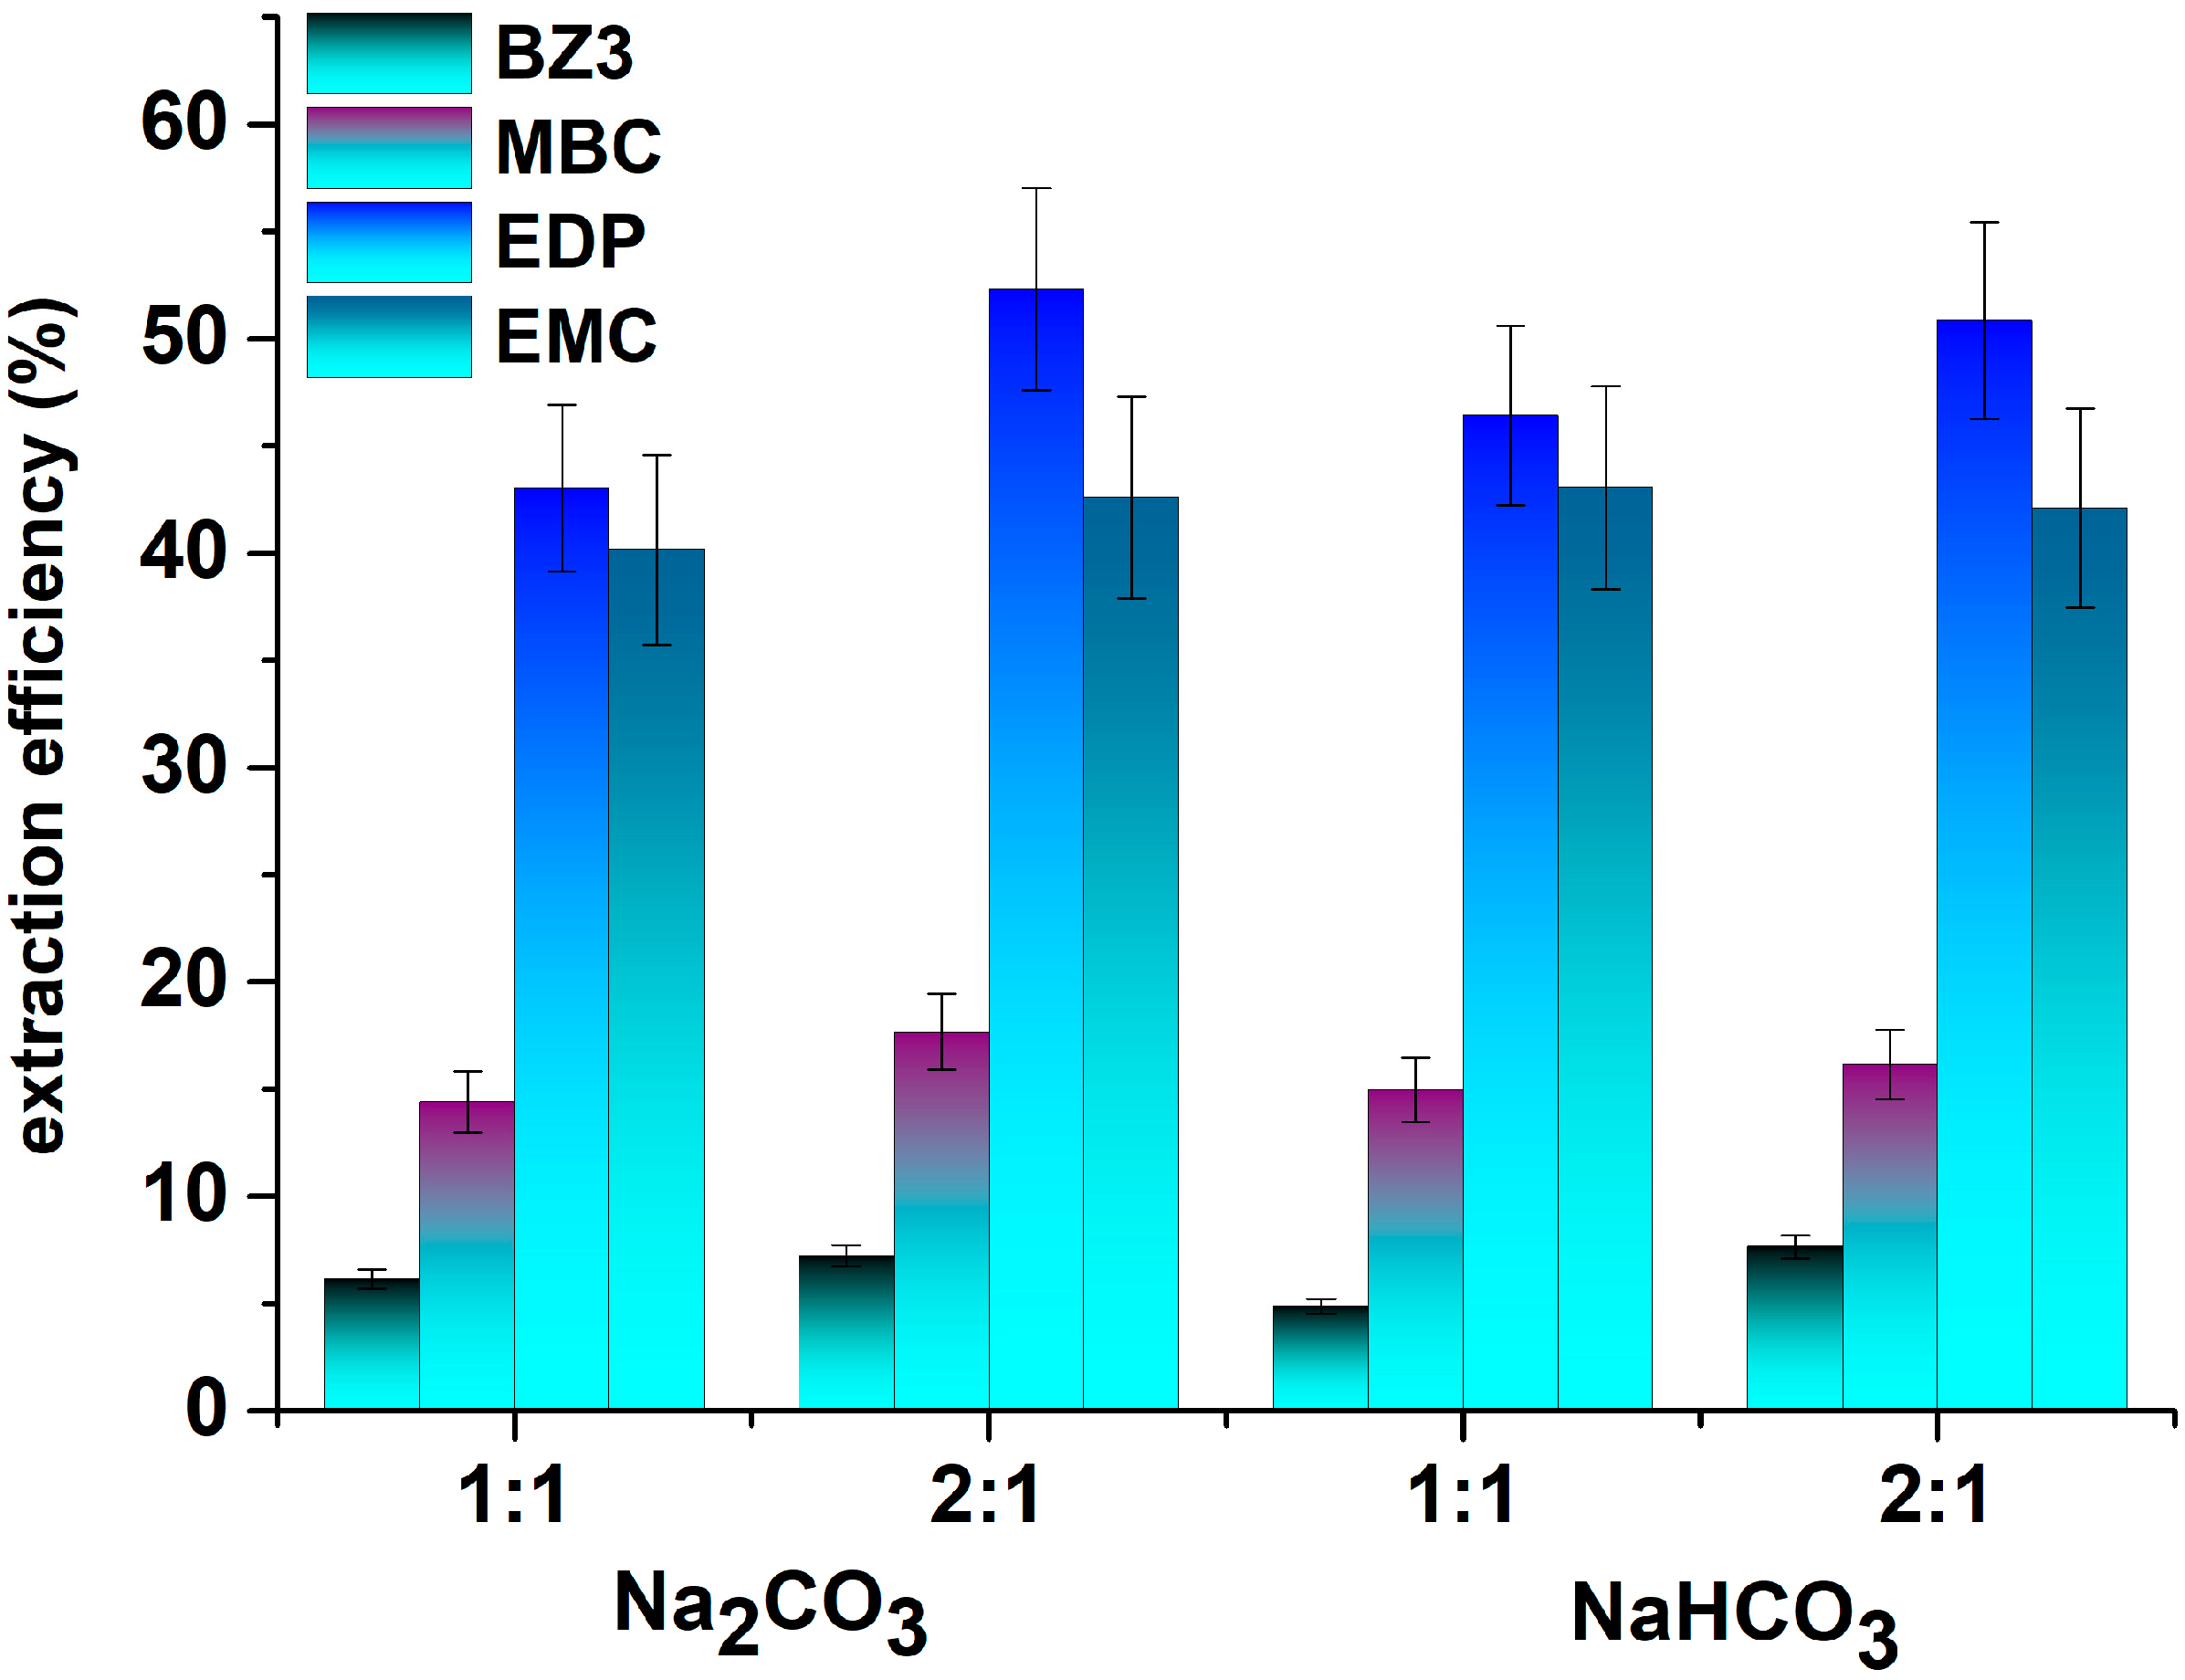
3.2. Effect of Effervescence on the Extraction Efficiency

After adding the tablet to water, the effervescence starts rapidly and is completed in two steps: the first involves the violent formation of CO2 bubbles, and the second is a milder effervescence stage until all reagents have been consumed. During this process, beyond the dispersion of the sorbent, ionic strength gradually increases, and the pH changes until all reagents have been completely dissolved and an equilibrium is established. All these factors, however, are not independent of each other. For example, adding more effervescent precursors generates more bubbles and causes more intense effervescence but it also increases the solution’s ionic strength and substantially affects sample pH. Moreover, on some occasions, intense effervescence may rapidly dissolve the reagents and decrease the overall extraction time. Therefore, the composition of effervescence precursors brings about different effects on all these factors.
To shed light on the factors that affect the efficiency of effervescecent-assisted microextraction, we investigated 12 combinations of acid/base mixtures (six weak acids with two bases) in two acid/base (1:1 and 2:1) ratios (a total of 24 combinations) in the extraction efficiency of four UV filters as model non-polar organic compounds (log Kow = 3.8–6.1). The variability in the pH, effervescence time, and ionic strength of the solution obtained by each combination and gathered in Table 1. The total extraction time for all combinations was set at 300 s to ensure that all effervescence reactions have been completed and that the sorbent remains in contact with the donor solution for the same time, thus avoiding variations in the extraction efficiency attributed to different extraction times for each acid/base combination.
The first observation from the data of Table 1 is that mixtures composed of a 1:1 acid/base ratio exhibit approximately 30% longer effervescent times compared to mixtures consisting of a 2:1 acid/base ratio at the same total mass of effervescent reagents. This can be attributed to the lower amount of acid employed in a 1:1 mixture that causes a less violent reaction. The Pearson correlation matrices of Table 2 and Table 3 show that effervescent time exhibits a positive correlation with extraction efficiency, indicating that increased effervescent time (i.e., slower dissolution of the tablet) has a positive influence on the extraction efficiency because it increases the contact time of the sorbent with the aqueous phase.
The ionic strength of the solutions produced from the tested combinations ranged from 0.15 to 0.8 M in 1:1 acid/base mixtures (average 0.37 M) to 0.1–0.62 M (average 0.286 M) in 2:1 acid/base mixtures. The higher ionic strength of a 1:1 mixture is because weak acids are employed for effervescence. Hence, an increase in the mass of the acid over the mass of the base does not contribute significantly to the ionic strength of the solution because weak acids do not dissociate significantly. From these values, it can also be inferred that effervescence-based extraction is performed under high ionic strength conditions (>0.1 M). The correlation matrices (Table 2 and Table 3) show a negative effect of ionic strength in the extraction efficiencies. This is more evident in mixtures of a 1:1 ratio, which exhibit higher ionic strength, possibly due to the higher viscosity of the solutions. However, the extraction time is positively correlated to the ionic strength of the solution, especially at a 2:1 ratio, which exhibits a statistically significant positive correlation coefficient at a p = 0.05 confidence level. This means that at lower ionic strength, longer extraction times are accomplished. Therefore, lower ionic strength increases the salting-out effect and increases the effervescence (extraction) time; both conditions are favorable to extraction. In contrast, as ionic strength increases, the viscous resistance effect becomes important while effervescence time only increases slightly.
The pH of the solution after the effervescence reactions shows that it is feasible to adjust the pH over a wide range from 2 to 8 by appropriately selecting the acid/base mixture and their ratio. As expected, tablets composed of 2:1 acid-base mixtures produce lower pH (2–7, average ~4.35) than those prepared from 1:1 mixtures (4–8, average 5.53). As revealed in Table 2 and Table 3, improved extraction efficiencies were obtained with decreasing pH, which agrees with our previous studies reporting on the optimum extraction of UV filters at acidic pH values (pH < 4) [32,33,34].
Although the above data provides some evidence of the effect of experimental parameters in the extraction efficiencies of non-polar organic compounds, on most occasions, they did not exhibit statistically significant correlations (at the p = 0.05 confidence level), which means that no general guidelines on how to select the experimental parameter can be derived. In a broader context, the optimum pH should be investigated first since it is determined mainly by the properties of the target analytes and their interactions with the sorbent. The positive correlation between ionic strength and extraction time at lower ionic strength conditions suggests that effervescence reagents that induce an ionic strength of <0.35 M may be used as a basis to find a compromise between ionic strength and effervescence time, provided the pH does not deviate significantly from the optimum range.
In this study, the composition that compromises these factors and affords the highest extraction efficiency is a mixture of fumaric acid as a proton donor and sodium carbonate or bicarbonate as a CO2 donor. According to the results depicted in Figure 4, the extraction efficiencies of UV filters are comparable for all acid-base combinations except for EDP, which is optimally extracted at 2:1 fumaric acid/Na2CO3. Therefore, the tablets were formulated by mixing 0.2 g of fumaric acid and 0.1 g of Na2CO3 for further experiments.

3.3. Effect of Sorbent Mass

The amount of sorbent is an essential parameter in microextraction methods because they are performed under diffusion-controlled conditions since the mass of sorbent is significantly lower than the mass of the aqueous sample [2]. Therefore, the amount of sorbent used per volume of aqueous solution affects the mass transfer rate and the equilibrium of the analytes between the two phases [15]. To study this variable, the mass of MNPs added into the tablets was varied in the range of 10 to 250 mg. Figure 5 shows that the extraction efficiencies increase up to 50 mg of MNPs and reach a plateau afterward. Therefore, the tablets were prepared by mixing 0.2 g of fumaric acid, 0.1 g of Na2CO3, and 50 mg of MNPs as the optimum extraction medium.

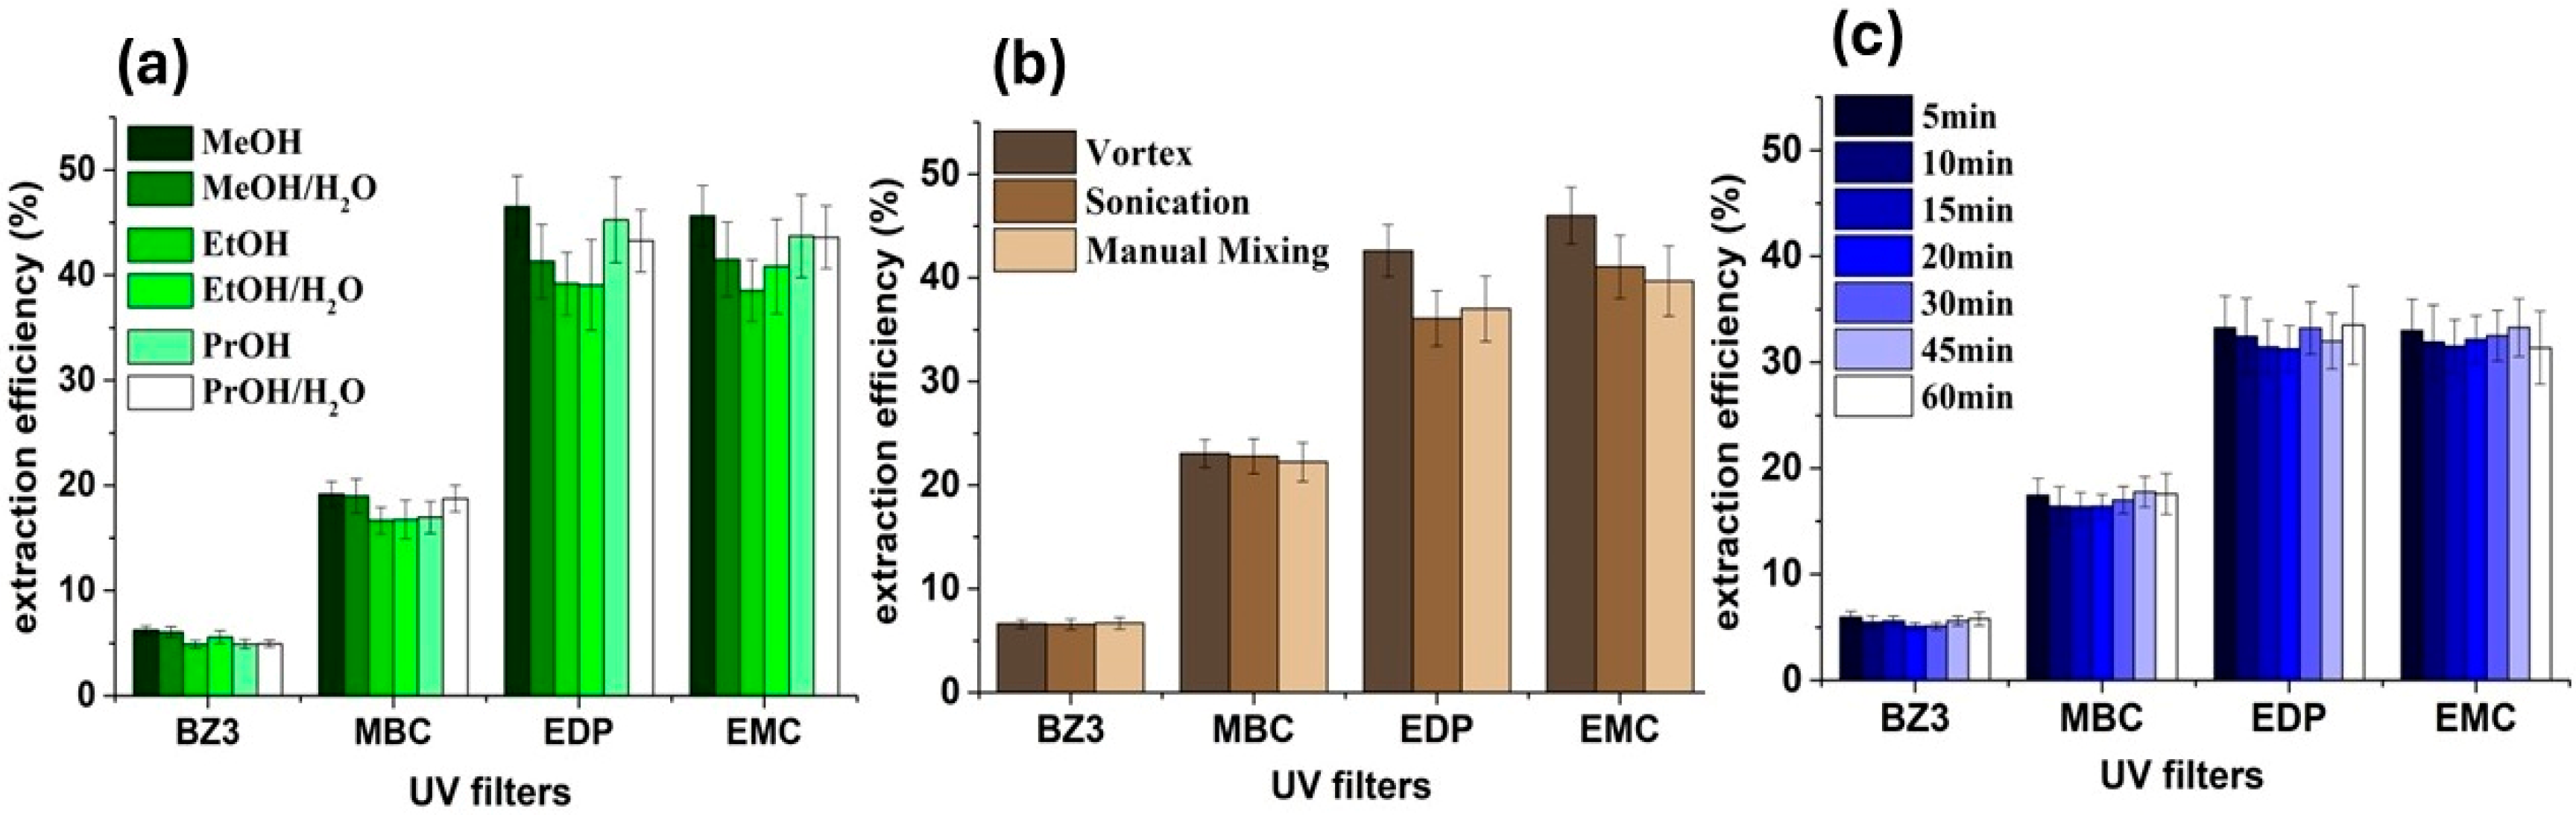
3.4. Optimization of the Desorption Process

An essential step in the performance of microextraction methods is the desorption of the analytes from the surface of the nanosorbent. In that regard, the elution of analytes was tested using various organic solvents of different polarities, under various mixing conditions, and at different elution times. The results in Figure 6a show that methanol was the most efficient elution sorbent, offering higher extraction efficiencies than ethanol, propanol, and their aqueous mixtures. The elution solvent was mixed with the sorbent by manual shaking, vortex agitation, and ultrasound irradiation to improve the extraction efficiency. The agitation of the sorbent in a vortex mixer during desorption was the most efficient method for eluting the analytes (Figure 6b). Finally, 5 min of vortex agitation was adequate to elute the analytes (Figure 6c), while longer vortexing times offered no improvement as evidenced by the results of ANOVA, which showed no significant difference at the p < 0.05 level (F(6.37) = 2.37 > FCalculated = 0.005, p = 0.99).

3.5. Analytical Characteristics of the Method

Under the optimum conditions, the analytical quality parameters of the method, such as linearity, limits of detection (LOD), repeatability, and reproducibility, were evaluated. The results summarized in Table 3 show that a high level of linearity was obtained for all examined UV filters. The employed working range expanded by almost two orders of magnitude and was set from 0.5 to 10 μg mL−1 for BZ3 and from 0.1 to 10 μg mL−1 for the other UV filters with regression coefficients (r2) > 0.995. As can also be seen in Table 2, the LODs (calculated as 3 × Sy/x/a, where Sy/x and a are the residual standard deviation and the slope, respectively, of the calibration curve) were found to be in the low μg mL−1 level ranging from 0.16 to 0.32 μg mL−1 (0.5 μg mL−1 for BZ3). The lower linear range and the higher LOD for BZ3 can be attributed to the lower hydrophobicity of BZ3 compared to the other UV filters. The extraction efficiencies exhibited a statistically significant correlation with the target UV filters’ octanol-to-water partition coefficient (log Kow) (r = 0.75, p = 0.05), indicating that less polar compounds are more effectively extracted. A significant improvement in the LODs of the method may be accomplished by resorting to more sensitive detectors employing mass spectrometric (MS) detection [35,36,37]. Further improvement in sensitivity to meet the demand for even higher sensitivity can conceivably be accomplished by scaling up the method to extract larger sample volumes and/or by preconcentrating the eluate to a lower volume; both approaches can increase the preconcentration ratio and improve the sensitivity of the method.
The repeatability and reproducibility, expressed as relative standard deviation (RSD %), were evaluated by extracting replicate samples (standard aqueous solutions containing the target analytes) on the same day (intra-day) and five consecutive days (inter-day), respectively. Values were between 1.8 and 11%, showing the method’s high precision.

3.6. Application to the Analysis of Genuine Water Samples

The reliability of the method was evaluated by employing recovery experiments. Three natural water samples were fortified with the target analytes at 0.5 μg mL−1 and extracted under the optimum experimental conditions. The calculated recoveries (Table 4) show that satisfactory recoveries are obtained. On many occasions, the extraction efficiencies were higher than 100%, which can be attributed to the presence of matrix components that may be coextracted with the target analytes but cannot be discriminated from the (single wavelength) UV detector. Moreover, natural waters have a buffering capacity (mainly attributed to carbonate and bicarbonate species), which may affect the effervescence process, the pH, and the ionic strength of the solution.

4. Conclusions

In this study, an effervescence-assisted magnetic micro solid phase extraction method was developed to extract UV filters from water samples. Except for its role in dispersing the sorbent, the influence of effervescence on the physicochemical conditions of extraction was examined by testing various acid/base combinations. It was found that the duration of effervescence, the ionic strength, and the pH of the solution, which are essential parameters in extraction, are all affected simultaneously and influence extraction efficiency. Since the properties of the analytes mainly determine the optimum pH, the combination of effervescence reagents should be limited to those that do not alter the pH beyond the optimum range. Once this is established, the ionic strength and effervescence time should be optimized, considering that ionic strength lower than 0.35 M should offer a compromise between the salting out effect and the viscous resistance effect, which has a reversibly proportional influence on the extraction efficiency, and ensure an adequate extraction time. Based on these observations, the extraction of UV filters, as model non-polar organic compounds, was demonstrated with satisfactory analytical features. Overall, the study provides a general pathway for selecting the appropriate experimental conditions for effervescence-assisted microextraction and aids in simplifying and streamlining the method optimization.

Author Contributions

Conceptualization, D.L.G.; Data curation, E.T. and V.G.; Investigation, E.T., V.G. and V.I.K.; Methodology, V.G. and D.L.G.; Supervision, D.L.G.; Validation, E.T., V.G., and V.I.K.; Writing—original draft, D.L.G.; Writing—review and editing, D.L.G. All authors have read and agreed to the published version of the manuscript.

Funding

This research received no external funding.

Data Availability Statement

The raw data supporting the conclusions of this article will be made available by the authors on request.

Conflicts of Interest

The authors declare no conflicts of interest.

References

  1. Lasarte-Aragonés, G.; Lucena, R.; Cárdenas, S.; Valcárcel, M. Effervescence-assisted dispersive micro-solid phase extraction. J. Chromatogr. A 2011, 1218, 9128–9134. [Google Scholar] [CrossRef] [PubMed]
  2. Lasarte-Aragonés, G.; Lucena, R.; Cárdenas, S. Effervescence-Assisted Microextraction—One Decade of Developments. Molecules 2020, 25, 6053. [Google Scholar] [CrossRef] [PubMed]
  3. Lasarte-Aragonés, G.; Lucena, R.; Cárdenas, S.; Valcárcel, M. Effervescence-assisted carbon nanotubes dispersion for the micro-solid-phase extraction of triazine herbicides from environmental waters. Anal. Bioanal. Chem. 2013, 405, 3269–3277. [Google Scholar] [CrossRef] [PubMed]
  4. Liu, X.; Shen, Z.; Wang, P.; Liu, C.; Zhou, Z.; Liu, D. Effervescence assisted on-site liquid phase microextraction for the determination of five triazine herbicides in water. J. Chromatogr. A 2014, 1371, 58–64. [Google Scholar] [CrossRef] [PubMed]
  5. Li, Y.; Hu, J.; Liu, W.; Jin, L.; Zhou, P.; Zhang, Y.; Zhang, B.; Dahlgren, R.A.; Wang, X.; Zhou, Y. Magnetic effervescent tablet-assisted ionic liquid-based dispersive liquid-liquid microextraction of polybrominated diphenyl ethers in liquid matrix samples. Talanta 2019, 195, 785–795. [Google Scholar] [CrossRef]
  6. Zhou, P.; Chen, K.; Gao, M.; Qu, J.; Zhang, Z.; Dahlgren, R.A.; Li, Y.; Liu, W.; Huang, H.; Wang, X. Magnetic effervescent tablets containing ionic liquids as a non-conventional extraction and dispersive agent for determination of pyrethroids in milk. Food Chem. 2018, 268, 468–475. [Google Scholar] [CrossRef]
  7. Zhang, W.; Zhou, P.; Liu, W.; Wang, H.; Wang, X. Enhanced adsorption/extraction of five typical polycyclic aromatic hydrocarbons from meat samples using magnetic effervescent tablets composed of dicationic ionic liquids and NiFe2O4 nanoparticles. J. Mol. Liq. 2020, 315, 113682. [Google Scholar] [CrossRef]
  8. Hu, Y.-H.; Wang, Q.-Y.; Ye, L.-H.; Yang, J.; Dong, X.; Zheng, H.; Zhou, J.; Cao, J. Effervescent salt and crown ether-assisted matrix solid-phase dispersion extraction of coumarins from Cortex fraxini. Ind. Crops Prod. 2019, 141, 111752. [Google Scholar] [CrossRef]
  9. Wang, X.; Xu, G.; Guo, X.; Chen, X.; Duan, J.; Gao, Z.; Zheng, B.; Shen, Q. Effervescent tablets containing magnetic ionic liquids as a non-conventional extraction and dispersive agent for speciation of arsenite and arsenate in vegetable samples. J. Mol. Liq. 2018, 272, 871–877. [Google Scholar] [CrossRef]
  10. Zhao, W.; Jing, X.; Tian, Y.; Feng, C. Magnetic Fe3O4 @ Porous Activated Carbon Effervescent Tablet-Assisted Deep Eutectic Solvent-Based Dispersive Liquid–Liquid Microextraction of Phenolic Endocrine Disrupting Chemicals in Environmental Water. Microchem. J. 2020, 159, 105416. [Google Scholar] [CrossRef]
  11. Yang, X.; Zhang, P.; Li, X.; Hu, L.; Gao, H.; Zhang, S.; Zhou, W.; Lu, R. Effervescence-Assisted β-Cyclodextrin/Attapulgite Composite for the in-Syringe Dispersive Solid-Phase Extraction of Pyrethroids in Environmental Water Samples. Talanta 2016, 153, 353–359. [Google Scholar] [CrossRef] [PubMed]
  12. Yang, M.; Wu, X.; Jia, Y.; Xi, X.; Yang, X.; Lu, R.; Zhang, S.; Gao, H.; Zhou, W. Use of Magnetic Effervescent Tablet-Assisted Ionic Liquid Dispersive Liquid–Liquid Microextraction to Extract Fungicides from Environmental Waters with the Aid of Experimental Design Methodology. Anal. Chim. Acta 2016, 906, 118–127. [Google Scholar] [CrossRef] [PubMed]
  13. Jing, X.; He, J.; Zhao, W.; Huang, X.; Wang, X. Effervescent Tablet-Assisted Switchable Hydrophilicity Solvent-Based Microextraction with Solidification of Floating Organic Droplets for HPLC Determination of Phenolic Endocrine Disrupting Chemicals in Bottled Beverages. Microchem. J. 2020, 155, 104680. [Google Scholar] [CrossRef]
  14. Fahimirad, B.; Rajabi, M.; Elhampour, A. A rapid and simple extraction of anti-depressant drugs by effervescent salt-assisted dispersive magnetic micro solid-phase extraction method using new adsorbent Fe3O4@SiO2@N3. Anal. Chim. Acta 2019, 1047, 275–284. [Google Scholar] [CrossRef]
  15. Cárdenas, S.; Lucena, R. Recent Advances in Extraction and Stirring Integrated Techniques. Separations 2017, 4, 6. [Google Scholar] [CrossRef]
  16. Zhou, P.; Wang, R.; Fan, R.; Yang, X.; Mei, H.; Chen, H.; Wang, H.; Wang, Z.; Wang, X. Magnetic amino-functionalized metal-organic frameworks as a novel solid support in ionic liquids-based effervescent tablets for efficient extraction of polycyclic aromatic hydrocarbons in milks. Ecotoxicol. Environ. Saf. 2021, 222, 112482. [Google Scholar] [CrossRef]
  17. Qu, Y.; Na, Y.; Liang, N.; Zhao, L. Magnetic effervescent tablets containing deep eutectic solvent as a green microextraction for removal of polystyrene nanoplastics from water. Chem. Eng. Res. Des. 2022, 188, 736–745. [Google Scholar] [CrossRef]
  18. Stokes, R.H.; Mills, R.; Armstrong, H.L. Viscosity of Electrolytes and Related Properties. Am. J. Phys. 1966, 34, 280–281. [Google Scholar] [CrossRef]
  19. Pawliszyn, J.; Bayona, J.M.; Dugo, P.; Le, X.C.; Lee, H.K.; Li, X.F.; Lord, H. Comprehensive Sampling and Sample Preparation: Analytical Techniques for Scientists; Elsevier Science: Amsterdam, The Netherlands, 2012; ISBN 9780123813732. [Google Scholar]
  20. Dey, A.; Purkait, M.K. Effect of fatty acid chain length and concentration on the structural properties of the coated CoFe2O4 nanoparticles. J. Ind. Eng. Chem. 2015, 24, 181–187. [Google Scholar] [CrossRef]
  21. Nabeel Rashin, M.; Hemalatha, J. Magnetic and ultrasonic studies on stable cobalt ferrite magnetic nanofluid. Ultrasonics 2014, 54, 834–840. [Google Scholar] [CrossRef]
  22. Pellegrino, F.; Pellutiè, L.; Sordello, F.; Minero, C.; Ortel, E.; Hodoroaba, V.-D.; Maurino, V. Influence of agglomeration and aggregation on the photocatalytic activity of TiO2 nanoparticles. Appl. Catal. B Environ. 2017, 216, 80–87. [Google Scholar] [CrossRef]
  23. Yalcin, B.; Ozcelik, S.; Icin, K.; Senturk, K.; Ozcelik, B.; Arda, L. Structural, optical, magnetic, photocatalytic activity and related biological effects of CoFe2O4 ferrite nanoparticles. J. Mater. Sci. Mater. Electron. 2021, 32, 13068–13080. [Google Scholar] [CrossRef]
  24. Mozaffari, M.; Manouchehri, S.; Yousefi, M.H.; Amighian, J. The effect of solution temperature on crystallite size and magnetic properties of Zn substituted Co ferrite nanoparticles. J. Magn. Magn. Mater. 2010, 322, 383–388. [Google Scholar] [CrossRef]
  25. Wu, N.; Fu, L.; Su, M.; Aslam, M.; Wong, K.C.; Dravid, V.P. Interaction of Fatty Acid Monolayers with Cobalt Nanoparticles. Nano Lett. 2004, 4, 383–386. [Google Scholar] [CrossRef]
  26. Prabhakaran, T.; Mangalaraja, R.V.; Denardin, J.C.; Varaprasad, K. The effect of capping agents on the structural and magnetic properties of cobalt ferrite nanoparticles. J. Mater. Sci. Mater. Electron. 2018, 29, 11774–11782. [Google Scholar] [CrossRef]
  27. Ong, H.T.; Suppiah, D.D.; Muhd Julkapli, N. Fatty acid coated iron oxide nanoparticle: Effect on stability, particle size and magnetic properties. Colloids Surf. A Physicochem. Eng. Asp. 2020, 606, 125371. [Google Scholar] [CrossRef]
  28. Hadjiivanov, K.I.; Panayotov, D.A.; Mihaylov, M.Y.; Ivanova, E.Z.; Chakarova, K.K.; Andonova, S.M.; Drenchev, N.L. Power of Infrared and Raman Spectroscopies to Characterize Metal-Organic Frameworks and Investigate Their Interaction with Guest Molecules. Chem. Rev. 2021, 121, 1286–1424. [Google Scholar] [CrossRef]
  29. Suthar, V.; Pratap, A.; Raval, H. Studies on Poly (Hydroxy Alkanoates)/(Ethylcellulose) Blends. Bull. Mater. Sci. 2000, 23, 215–219. [Google Scholar] [CrossRef]
  30. Larkin, P.J.; Jackson, A. Interpretation of the Infrared Spectra of Metal-Stearate Salts. Appl. Spectrosc. Pract. 2024, 2, 27551857241253834. [Google Scholar] [CrossRef]
  31. Sajjia, M.; Baroutaji, A.; Olabi, A.G. The Introduction of Cobalt Ferrite Nanoparticles as a Solution for Magnetostrictive Applications. In Reference Module in Materials Science and Materials Engineering; Elsevier: Amsterdam, The Netherlands, 2017. [Google Scholar]
  32. Giokas, D.L.; Zhu, Q.; Pan, Q.; Chisvert, A. Cloud point–dispersive μ-solid phase extraction of hydrophobic organic compounds onto highly hydrophobic core–shell Fe2O3 @C magnetic nanoparticles. J. Chromatogr. A 2012, 1251, 33–39. [Google Scholar] [CrossRef]
  33. Gouma, V.; Pournara, A.D.; Manos, M.J.; Giokas, D.L. Fabric phase sorpitive extraction and passive sampling of ultraviolet filters from natural waters using a zirconium metal organic framework-cotton composite. J. Chromatogr. A 2022, 1670, 462945. [Google Scholar] [CrossRef] [PubMed]
  34. Benedé, J.L.; Chisvert, A.; Giokas, D.L.; Salvador, A. Development of stir bar sorptive-dispersive microextraction mediated by magnetic nanoparticles and its analytical application to the determination of hydrophobic organic compounds in aqueous media. J. Chromatogr. A 2014, 1362, 25–33. [Google Scholar] [CrossRef] [PubMed]
  35. Nieddu, M.; Pasciu, V.; Demontis, M.P.; Baralla, E. The Application of Liquid Chromatography for the Analysis of Organic UV Filters in Environmental and Marine Biota Matrices. Separations 2024, 11, 30. [Google Scholar] [CrossRef]
  36. Benedé, J.L.; Chisvert, A.; Salvador, A.; Sánchez-Quiles, D.; Tovar-Sánchez, A. Determination of UV filters in both soluble and particulate fractions of seawaters by dispersive liquid–liquid microextraction followed by gas chromatography–mass spectrometry. Anal. Chim. Acta 2014, 812, 50–58. [Google Scholar] [CrossRef]
  37. Cheng, J.; Kong, X.; Liu, S.; Che, D.; Sun, Z.; Li, G.; Ping, M.; Tang, J.; You, J. Determination of Ultraviolet Filters in Domestic Wastewater by LC–MS Coupled with Polydopamine-Based Magnetic Solid-Phase Extraction and Isotope-Coded Derivatization. Chromatographia 2018, 81, 1673–1684. [Google Scholar] [CrossRef]
Figure 1. XRD pattern of CoFe2O4@stearic acid MNPs (black line) and comparison with Joint Committee on Powder Diffraction Standards (JCPDS) PDF card No. 22–1086 (blue line).
Separations 11 00315 g001
Figure 2. SEM images (a,b), EDS spectra (c), and ATR-IR spectra (d) of CoFe2O4@stearic acid MNPs.
Separations 11 00315 g002
Figure 3. (a) Zero point of charge and (b) magnetization curves of CoFe2O4@stearic acid MNPs.
Separations 11 00315 g003
Figure 4. Extraction efficiency of UV filters using fumaric acid and carbonate/bicarbonate mixtures at 1:1 and 2:1 ratio.
Separations 11 00315 g004
Figure 5. Effect of the mass of CoFe2O4@stearic acid on the extraction efficiency of UV filters.
Separations 11 00315 g005
Figure 6. Optimization of desorption conditions (a) selection of elution solvent (elution time 10 min, manual mixing) (b) examination of mixing method (elution solvent: methanol, elution time: 10 min), (c) effect of elution time (elution solvent: methanol, vortex agitation).
Separations 11 00315 g006
Table 1. Composition of effervescent reagents and their influence on the experimental conditions.
Acid:Base RatioAcidBaseSolution pHDuration of
Effervescence (s)
Ionic Strength (M)
1:1Citric AcidNa2CO35.6400.54
NaHCO35.31200.57
Tartaric acidNa2CO35.8400.42
NaHCO34.6600.18
Oxalic acidNa2CO35.3500.34
NaHCO35.32400.35
Ascorbic acidNa2CO38.0600.25
NaHCO36.5500.18
NaH2PO4Na2CO37.4600.80
NaHCO36.7300.43
Fumaric acidNa2CO34.81800.42
NaHCO34.21800.24
2:1Citric acidNa2CO34.5600.38
NaHCO33.92100.64
Tartaric acidNa2CO34.6600.36
NaHCO33.3600.12
Oxalic acidNa2CO32.6400.22
NaHCO32.4600.34
Ascorbic acidNa2CO36.9900.10
NaHCO35.6400.12
NaH2PO4Na2CO36.8600.62
NaHCO36.41800.41
Fumaric acidNa2CO33.9600.24
NaHCO33.2600.24
Table 2. Pearson correlation analysis among the extraction efficiencies of UV filters and experimental parameters of effervescence-assisted microextraction at 1:1 and 2:1 acid:base mass ratio.
1:1 Acid:Base RatiopHEffervescence
Time
Ionic
Strength
BZ3MBCEDPEMC
pH1.00
Effervescence time−0.54 *1.00
Ionic strength0.120.111.00
BZ3−0.380.28−0.251.00
MBC−0.390.25−0.340.82 *1.00
EDP−0.150.15−0.310.110.421.00
EMC−0.57 *0.48 *−0.210.310.56 *0.281.00
2:1 Acid:Base RatiopHEffervescence
Time
Ionic
Strength
BZ3MBCEDPEMC
pH1.00
Effervescence time0.201.00
Ionic strength0.050.54 *1.00
BZ3−0.210.170.081.00
MBC−0.200.320.230.85 *1.00
EDP0.180.09−0.090.66 *0.77 *1.00
EMC−0.44−0.08−0.160.460.60 *0.441.00
* Statistically significant at the p = 0.05 probability level.
Table 3. Main analytical parameters of the proposed method.
UV
Filter
Slope ± sb
×103 (μg mL−1) a
Regression
Coefficient R2 a
Linearity
(μg mL−1)
LOD b
(μg mL−1)
(%RSD) c
RepeatabilityReproducibility
BZ3105 ± 4.40.9950.5–100.59.210.4
MBC323 ± 4.00.9990.1–100.11.811.1
EDP394 ± 9.00.9980.1–100.18.64.2
EMC101 ± 4.90.9980.1–100.13.410.1
a Number of calibration points: 6 (sb = standard deviation). b LOD: Limit of detection, calculated as 3Sy/x/a criteria, where Sy/x is the residual standard deviation and a is the slope of the calibration curve. c RSD: Relative standard deviation, calculated by analyzing an aqueous standard solution containing 0.5 μg mL−1 of the target analytes at five replicates.
Table 4. Recovery of UV filters from three water samples spiked with 0.5 μg mL−1 (n = 3).
UV FilterTap WaterRiver WaterLake Water
BZ378.4 ± 7.1105.2 ± 5.884.7 ± 6.3
MBC102.1 ± 9.8102.8 ± 7.9127.1 ± 10.4
EDP98.0 ± 8.4105.0 ± 9.0117.3 ± 12.4
EMC101.6 ± 7.3107.5 ± 9.2112.4 ± 8.8
Disclaimer/Publisher’s Note: The statements, opinions and data contained in all publications are solely those of the individual author(s) and contributor(s) and not of MDPI and/or the editor(s). MDPI and/or the editor(s) disclaim responsibility for any injury to people or property resulting from any ideas, methods, instructions or products referred to in the content.

