Abstract
Idebenone (IDB) (2,3-dimethoxy-5-methyl-6-(10-hydroxydecyl)-1,4-benzoquinone) is a compound synthesized in the early 1980s. Initially developed for the treatment of cognitive disturbances and Alzheimer’s disease, IDB is now studied for Friedreich’s ataxia, Leber’s hereditary optic neuropathy (LHON), or Duchenne muscular dystrophy. The greatest disadvantage of IDB is its low solubility in water, resulting in low bioavailability. Galenic preparations of IDB in customized doses are common for pediatric patients, which can often prove to be the only option for access to therapy. As an antioxidant, the chemical stability of IDB is an essential guarantee for exerting the desired antioxidant action. Stability studies are essential to know the effect of storage conditions of a galenic product. For the first time, a stability-indicating LC-MS method has been developed to define the stability of IDB suspensions in SyrSpend® Sugar-Free Unflavored (Fagron), a carrier phase formulated for setting up suspensions of active pharmaceutical ingredients (APIs) insoluble or poorly insoluble in water and compatible with it. The proposed method was validated for linearity, accuracy, specificity, robustness, matrix effect and recovery, limit of detection (LOD), limit of quantification (LOQ), and repeatability.
1. Introduction
Idebenone (IDB) (2,3-dimethoxy-5-methyl-6-(10-hydroxydecyl)-1,4-benzoquinone) is a compound developed in the early 1980s by Takeda Pharmaceuticals against cognitive decline/dementia [1]. It is a synthetic analogue of CoQ10 (ubiquinone), with the same 1,4-benzoquinone ring and a hydroxydecyl chain (Figure 1) [2].

Figure 1.
Chemicals structures of ubiquinone (A) and idebenone (B).
From a structural point of view, CoQ10 and IDB share the same substituted 1,4-benzoquinone ring but have a different side chain than carbon 2. In fact, IDB is less lipophilic than CoQ10 due to its hydroxydecyl side chain. Compared to CoQ10, the hydroxydecyl side chain seems to be the ideal length for mitochondrial membrane insertion and better blood–brain barrier permeation.
The detection of idebenone and its unconjugated metabolites in plasma has been made possible by the recent development of advanced analytical techniques. IDB undergoes first-pass metabolism rapidly after absorption [3]. In clinical trials, IDB has been reported to be safe and well tolerated at doses of up to 2250 mg per day, with dose-proportional pharmacokinetics in healthy subjects.
IDB works as a CoQ10-like compound exhibiting similar antioxidant and electron chain transport (ETC) properties involved in the generation of ATP [4]. IDB acts by transferring electrons directly to complex III of the ETC chain, bypassing the cofactor chain of complex I, restoring the generation of cellular energy (ATP) [5]. It belongs to the group of medicines with psychostimulant and nootropic activity, i.e., substances that increase brain abilities and functions; indeed, IDB is indicated for treatment of brain activities disorders [6]. Initially developed for the treatment of cognitive disturbances and Alzheimer’s disease, IDB is now studied for Friedreich’s ataxia, Leber’s hereditary optic neuropathy (LHON), or Duchenne muscular dystrophy [7,8].
LHON is maternally inherited and was the first disease associated with mitochondrial DNA (mtDNA) point mutations. In LHON, mitochondrial mutations affect genes for the complex I subunit of the respiratory chain, leading to selective degeneration of retinal ganglion cells (RGCs) and optic atrophy within one year of disease onset. LHON is estimated to be the most common mitochondrial disease, with a prevalence ranging from 1 in 27,000 in the north-east of England to 1 in 45,000 in a meta-analysis of reports in the European population. IDB is the APIs (active pharmaceutical ingredients) of the medicinal specialty Raxone®, approved by the European Medicines Agency and the Agenzia Italiana del Farmaco for LHON disease in adults and adolescents 12 years of age and older [9].
Commercially available medicines often do not fully meet the many therapeutic needs, especially for pediatric patients with difficulties swallowing solid pharmaceutical forms and with a body weight requiring personalized dosages. Indeed, in the pediatric setting, also for IDB, the use of extemporaneous galenic preparations in a customized dose is common, which can often prove to be the only option for access to therapy. SyrSpend® Sugar-Free Unflavored (SyrSpend SF) is often used for this purpose.
SyrSpend SFUnflavored is a carrier phase formulated for setting up suspensions of APIs insoluble or poorly soluble in water and compatible with it. Based on modified food starch, SyrSpend SF has shown beneficial suspending properties and good compatibility with a broad range of active pharmaceutical ingredients [10,11]. Furthermore, SyrSpend SF provides a reliable solution to reduce the exposure of children, especially newborns, to potentially harmful preservatives, such as parabens [12]. Indeed, a problem common to the compounded preparations described in the literature is that they include potentially harmful excipients (PHEs). Exposure of infants to PHEs is a safety issue as they are associated with toxicity problems, allergic reactions, and intolerance. On the other hand, parabens are suspected of being endocrine disruptors. Developmental exposure to endocrine-disrupting chemicals during early life is associated with a wide range of disorders and may increase the risk of disease later in life [13].
Stability studies are essential to know the effect of storage conditions of a galenic product to determine the appropriate shelf life and storage conditions [14]. The International Conference on Harmonization (ICH) [15] suggests that analytical test procedures for stability samples should be fully validated [16]. There are reported methods for the determination of ubiquinones by HPLC-UV–vis [4,17,18], colorimetric methods [19], HPTLC [16], and, finally, GC-MS or LC-MS [3,16,20]. LC-MS appears to be the gold standard for stability studies of pharmaceutical preparations thanks to the ability to quantify analytes in solution, and to the high sensitivity and reproducibility inherent of MS. A fully validated HPLC-MS/MS method has been applied but for pharmacokinetic study [3] in plasma and urine samples to detect IDB and metabolites as reported above.
Studies have reported IDB degraded by 60% and lost antioxidant activity by 30% exposed to a relative humidity of 75% and at 40 °C for 45 days [21,22]. Indeed, several investigators designed formulations to protect the chemical stability, e.g., IDB encapsulation with polyethyl-2cyanoacrylate nanocapsules [22] or the preparation of the polymer nanoparticles based on chitosan loaded with IDB [21].
So far, no stability studies have been reported for the suspension of IDB in SyrSpend SF. Furthermore, the previously cited methods for IDB stability did not report a suitable extraction protocol for this API in other carrier phases or similar preparations, but only for tablets [5]. Considering the above, it is necessary to develop and validate a method to accurately assess the kinetic degradation of IDB in SyrSpend SF by testing recovery, accuracy, and selectivity, taking into account potential interferences from the matrix and degradation products.
Hence, the objective of the present study was to develop a stability-indicating LC-MS method to define the stability of IDB suspensions in in SyrSpend SF. The suspension currently used for pediatric patients with LHON is at the concentration of 100 mg/mL with a validity of 30 days [23]. However, there are no data available in the literature regarding the stability of IDB suspensions obtained using the carrier SyrSpend SF. Since these are custom preparations for pediatric patients and it is often necessary to proceed with dosage adjustment, the analysis was expanded to include concentrations not in therapeutic use to date to obtain preliminary information inherent to their stability. The proposed method was validated for linearity, accuracy, specificity, robustness, matrix effect and recovery, LOD (limit of detection), LOQ (limit of quantitation), and repeatability according to the ICH guidelines [15]. The specificity of the developed method was evaluated by forced degradation studies using photolytic, thermal, oxidation, and hydrolysis (acid and base) stress conditions. In addition, 90-day old samples, and stressed samples using alkaline and oxidative protocol were used to perform a peak homogeneity study of the IDB and IS (internal standard) with a tentative characterization of degradation products.
2. Materials and Methods
2.1. Study Design
The study was carried out at the Sant’Orsola Hospital in Bologna, Italy. The hospital is a referral center for LHON diagnosis and treatment. Since a pediatric IDB-based formulation is not commercially available, the Hospital Pharmacy Unit was involved in the preparation of galenic formulations to enable therapies for hospitalized pediatric patients and ensure territorial continuity of care for discharged patients. To define the IDB stability in SyrSpend SF, three different concentrations (50 mg/mL, 100 mg/mL, and 150 mg/mL) were chosen in two different storage temperatures, room temperature (25 °C) in a dry place, and under refrigerated conditions (5 ± 3 °C), protected from light. The time window considered is 90 days. Samples were taken at time 0 of preparation (t0) and after 7, 14, 21, 30, 45, 60, and 90 days.
2.2. Chemicals
Methanol (CH3OH) was purchased from Merck Millipore (LiChrosolv® Reag Ph. Eur, Merck, Italy). Water of HPLC-MS grade (Millipore) was produced using the depurative system Milli-Q Synthesis A 10 (Molsheim, France). Formic acid and Menadione (2-Methyl-1,4-naphthoquinone) were purchased from Sigma-Aldrich (Milan, Italy).
For suspension preparation, IDB (powder) of pharmaceutical grade and SyrSpend® Sugar-Free (SF) Unflavored were supplied by the firm Fagron Italia s.r.l. SyrSpend® (Quarto Inferiore, Italy) is a ready-to-use liquid vehicle, buffered to pH 4, containing benzoic acid (<1%) as an oral preservative, sucralose as a sweetener, simethicone as an antifoaming agent, and citric acid, sodium citrate, and malic acid as buffering agents.
2.3. Setup of Idebenone Suspension in SyrSpend SF
In the Galenical Laboratory of the S. Orsola Hospital Pharmacy, IDB galenical formulations in oral suspension were prepared according to the F.U.I. XII Ed. [23], using raw materials that meet the assays of the Pharmacopoeia, as documented by the certificates of analysis of the manufacturers. The powdered drug was weighed in order to gain the targeted concentrations (50 mg/mL, 100 mg/mL, 150 mg/mL) and introduced into a dedicated mortar to obtain fine and homogeneous powder. The vehicle was added with geometric dilution and mixed with a pestle until a homogeneous preparation was obtained. Finally, the suspension was poured into a wide-mouthed amber glass bottle.
2.4. Standard Solutions
Stock solution (1 mg/mL) of IDB was prepared in CH3OH, aliquoted, and stored at −80 °C. Stock solution (1 mg/mL) of Menadione, used as internal standard (IS), was prepared in CH3OH and stored at −20 °C. Fortified SyrSpend SF samples were used as quality controls (QC).
QC and analyte standard solutions used for the development of the analytical method were prepared fresh each day of analysis to prevent the results from being affected by the IDB stability.
2.5. Instrumental Conditions
The instrument UHPLC 1290 Infinity II (Agilent Technologies, Inc., Milan, Italy) coupled to a triple quadruple mass spectrometer 6495 LC/TQ (Agilent Technologies, Inc.) was used for the method development and analysis. The ion production was achieved with an ESI source working in multiple reaction monitoring (MRM) acquisition mode. The chromatographic column was a C18 Zorbax Eclipse Plus (1,8 μm, 2.1 I:D. × 50 mm, Agilent Technologies, Inc.). The mobile phase was composed of 0.1% formic acid in water (A) and 0.1% formic acid in CH3OH (B) was used for an isocratic elution (25% A/75% B) with a total run of 3.5 min. The flow rate, column temperature, and the injection volume were 0.5 mL/min, 30 °C, and 2 μL, respectively.
The mass spectrometer parameters were tuned in positive ionization by direct infusion of IDB and Menadione (1 μg/mL in mobile phase). Ion source block and desolvation temperatures were set at 200 °C and 350 °C, respectively. The collision gas was argon, while nitrogen was selected as nebulizer and heater gas. The flow rates of nebulizer gas and desolvation gas were 14 L/min and 11 L/m, respectively. Capillary and cone voltages were 4 kV and 1500 V, respectively.
2.6. Sample Preparation: Extraction Procedure
At predetermined times (see paragraph 2.1) after preparation, 5 g aliquots of the suspensions maintained at a temperature between 3 °C and 5 °C were prepared. The same procedure was adopted for suspensions kept at room temperature. In about 0.5 g of weighed suspension, in triplicate, were added 6 aliquots of 0.5 mL of CH3OH (total volume = 3 mL) to extract the API from the vehicle. IS (16 mg/mL) was introduced with the first aliquot of CH3OH. After each aliquot, the samples were vortexed for 1 min and then centrifuged at 4000 rpm with a rotofix 32 A 1206 fixed rotor benchtop centrifuge, HETTICH (Germany) for 5 min. The extracts thus produced were pooled and then diluted with CH3OH to 1:100,000 to allow quantification within the linearity range of the method. The last dilution was done in mobile phase. The final concentration of IS at the end of the extraction process was 25 ng/mL.
2.7. Method Validation
The method was validated following the ICH guidelines [24]. Method performance was evaluated by the determination of selectivity, transition ion ratios, recovery, accuracy (bias %), precision (CV%, expressed as the intra- and inter-day repeatability), linearity, and LODs and LOQs.
Selectivity was evaluated by comparing the chromatograms obtained from standards, extracted samples, and blank spiked matrix. In order to provide specificity of the developed method, forced degradation studies were performed on IDB formulation in SyrSpend SF (100 mg/mL). For the stability study of IDB, photolytic, thermal, oxidation, and hydrolysis under acid and base stress conditions were used as reported in a previously published paper [25]. The photolytic stress studies were for a period of 11 days. Thermal stress was at 50 °C for 10 days. The acid stress was carried out at 0.5 N HCl at ambient temperature (25 ± 2 °C) for 10 days. The alkaline stress was carried out at 0.025 N NaOH for a period of 24 h at ambient temperature. Oxidative stress was performed at 3% hydrogen peroxide for 7 days at ambient temperature. All stressed samples were quantified for IDB and a tentative identification of degradation products was made by LC-MS. Peak homogeneity was tested for IDB and IS.
Five-point calibration curves in mobile phase (10–500 ng/mL) containing IS (fix concentration 25 ng/mL) were used to linearity test and for sample quantifications. Menadione was used as IS considering its quinone structure in order to mimic the chemical–physical behavior of the IDB during the ionization and the extraction step. Indeed, according with our availability and with the relative high lipophiles of IDB (LogP 4.4) [26], Menadione as nasphthalquinone was a useful candidate considering the higher lipophilia (LogP 2.2) compare to other quinones such as 1,4 -benzquinones (LogP 0.2).
The LOD and LOQ were determined in standard solutions (n = 3) by serial dilution. LOD and LOQ are considered as the minimum detectable amount of analyte with signal-to noise ratio (S/N) of 3 and 10, respectively.
Accuracy and precision of the whole method were calculated intra (n = 3) and inter-day (n = 9) from three repeated injections of QC at three different concentrations (10 ng/mL, 50 ng/mL, 500 ng/mL).
Since the deuterated IDB was not available, matrix effect was evaluated by using the standard additions method. A comparison of the slopes (b) of the calibration line obtained in matrix and in mobile phase was performed using the following equation:
ME (%) = 100 × (bmatrix calibration/bmobile phase calibration − 1)
Extracted samples from the stability studies (90-day samples) and from both the oxidative and alkaline degradation protocol were spiked with analytical standards in the same range of the calibration curves. This was done to completely exclude interference from potential degradation products during the analysis.
Recovery experiments were performed in triplicate at three concentration levels by comparing the ratio between the analyte area to the IS area of blank samples fortified before (IDB concentrations: 50 mg/mL, 100 mg/mL, and 150 mg/mL) and after the extraction. In these conditions, the matrix effect was not taken into account, in order to evaluate exclusively the efficiency of the extraction. The different samples were analyzed, and percentage absolute recoveries were calculated.
2.8. Statistical Analysis
Statistical analyses were performed using GraphPad Prism 8·0·2 software. Friedman’s test was used to compare the results at different time points. Dunn’s multiple comparison test was used to compare the mean rank of each time to t0. Significance level was set at 95% (α = 0.05).
3. Results and Discussion
3.1. Method Validation
The best ionization conditions were determined by direct infusion of IDB and IS (1.0 μg/mL, mobile phase). Table 1 summarizes the MS/MS parameters used.

Table 1.
MS/MS parameters for IDB and Menadione.
After optimization of the MS/MS conditions, IDB shows an intense signal at 197.2 m/z and a lower one at 321.2 m/z, while the highest transition for the IS was at 105.1 m/z and a less intense one at 97.1 m/z. The MRM transitions [339.2 > 197.2] and [339.2 > 321.2] were used for the IDB as quantifier and qualifier, respectively. Indeed, the MRM transitions [173.1 > 105.1] and [173.1 > 97.1] were used as quantifier and qualifier, respectively.
The optimal separation condition in terms of chromatographic resolution, peak shapes, and analysis times was achieved by using a C18 Zorbax Eclipse Plus column (1.8 μm, 2.1 I:D. × 50 mm, Agilent Technologies, Inc.) employing 0.1% formic acid in water (Figure 2A) and 0.1% formic acid in CH3OH (Figure 2B) as mobile phases. The separation was achieved in 3.5 min. Figure 2 shows the chromatograms for IDB and IS.
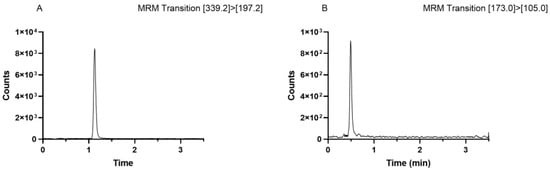
Figure 2.
(A) IDB chromatogram (50 ng/mL); (B) IS chromatogram (25 ng/mL).
Selectivity was evaluated by analysis of mobile phase standards and extracted samples fortified with IDB. No interferences were found in either of the solutions of the mobile-phase standard and the fortified extracts with an optimal chromatographic peak resolution at baseline.
As already reported in the literature for IDB standards, and for our samples, degradation was not observed in stressed conditions when the analyte was subjected to photolytic, thermal, and acid hydrolysis (Supplementary Material Table S1). The alkaline degradation protocol and oxidative degradation protocol led to a decrease in API concentration of up to 75.2% and 90.3%, respectively. Full scan acquisition mode (from m/z 75 to m/z 400) was not able to identify any degradation products investigating the forced degradation samples and the 90-day old samples (room temperature and refrigerated condition) (Figure S1 on Supplementary Materials). On the other hand, peak homogeneity study by LC-MS confirmed that the IDB and IS peaks are homogeneous and pure in all the stress extracted samples. The LOD and LOQ were determined by preparing a series of standard solutions at increasing concentrations. The LOD was found to be 5 ng/mL and the LOQ 10 ng/mL.
Accuracy and precision were determined intra- and inter- day at three different concentration levels (low, medium, high). Bias (%) and CV (%)ranged between 1.7% and 5.2%. This demonstrates the repeatability and reproducibility of the method and, therefore, its effectiveness for quantification purposes. Table S2 in Supplementary information summarizes the results.
Matrix effect is one of the most important parameters to investigate when developing an LC/MS method due to its influence on the analysis results. Here, matrix effect was evaluated by comparing the slopes of the calibration curve obtained in the mobile phase (range 10–500 ng/mL) and calibration curve obtained by fortifying the matrix extracts (Figure S1 in Supplementary information). The ME (%) value was less than 0.3%, so the matrix effect was considered not significative, and the calibration curve was made in mobile phase.
As made for the matrix effect in Syrspend SF extract, a new matrix effect in degraded extracted samples was evaluated. The matrix effect was also negligible in this case (ME < 0.3%).
Calibration curve parameters for IDB were obtained by plotting the peak area ratio between IDB and IS in the mobile phase against its theoretical concentration through a linear least-square regression analysis. Five-point calibration curves were prepared in mobile phase since the matrix effect was established as non-significant. Linearity was assessed using the F-test for the range of the calibration curve. The calibration curve equations were reported as Y = a (±δa)X + b (±δb). Calibration curve determination coefficients (r2) were ≥0.995 in the linearity ranges (10–500 ng/mL).
Quantification of the quality control samples in the presence or absence of the IS was not significantly different (α = 0.05). This is reasonable considering the performances of the extraction procedure with different washing step and the absence of matrix effect. On the other hand, the usefulness of the IS was confirmed when the last washing step of the extraction procedure (applied to QC samples, n = 3, 100 mg/mL) was analyzed separately. The ratio between the areas of IDB and IS in the last wash supernatant was not significantly different (α = 0.05) when compared with the other combined supernatants. Furthermore, we strongly recommend the use of an IS to check for errors during the 1:100,000 dilution step.
Recoveries were determined by comparing the area ratio of IDB to the IS of sample fortified before and after extraction. The IDB concentration in the fortified matrix sample and the reference value obtained by adding the same amount of standard to the extract (blank) were then compared before relative LC-MS analysis. Recovery was ≥97% at three concentration levels, thanks to the high IDB solubility in CH3OH, the solvent used for extraction in the suspension samples. Table 2 summarizes the results.
Table 2.
Recovery and standard deviation for IDB at three concentrations levels.
3.2. Sample Results
Samples for analysis were extracted from the suspension at three different concentrations at the predetermined times (see Section 2.2). Table 3 and Table 4 show the data obtained for room temperature and under refrigerated condition, respectively.
Table 3.
Results for IDB samples stored at room temperature at three different concentrations. The stability results are expressed as relative percent of recovery (time 0 = 100%).
Table 4.
Results for IDB samples stored under refrigerated condition at three different concentrations. The stability results are expressed as relative percent of recovery (time 0 = 100%).
Figure 3 shows the differences in IDB content (%) over time for suspensions stored at room temperature and refrigerated considering t0 as 100%.
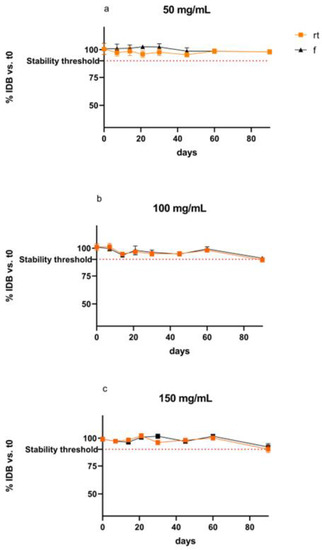
Figure 3.
Differences (%) in IDB content over time for suspensions stored at room temperature and refrigerated ((a): 50 mg/mL, (b): 100 mg/mL, (c): 150 mg/mL).
The values of IDB content show a slight reduction in the API content over the time considered. The p-values for the comparison between the suspension at different time points were not significative (p-value Friedman’s test > 0.05). Moreover, the p-values for Dunn’s multiple comparison test between t0 and each time points (i.e., 7, 14, 30, 45, 60, 90) were not significative (p > 0.05).
The mean concentration after 90 days for IDB 100 mg/mL and 150 mg/mL at both controlled room temperature and refrigerated was not significantly different from the cut-off value of 90%, but when considering their standard deviations, the % recovered fell below the cut-off value. Therefore, a use-by date of 60 days is recommended for both temperatures. In accordance with the criteria set in the F.U.I. XII Ed [23], the preparations at 50 mg/mL can be considered stable over the timeframe considered, i.e., 90 days. In addition, for the three different concentrations, no color change was observed, and no precipitates were retained during storage according to the physical stability study. Similar results have been reported for other oral pediatric IDB suspensions. Specifically, IDB 100 mg/mL is determined stable for 90 days when stored at 5 or 25 °C [5].
4. Conclusions
With the aim to contribute to the lack of IDB stability data in the literature employing SyrSpend SF as a carrier phase, a new highly sensitive and robust method UHPLC-ESI-MS/MS method was developed for the quantification of IDB at different time points. The method was validated for linearity, accuracy, specificity, robustness, matrix effect and recovery, limit of detection (LOD), limit of quantification (LOQ), and repeatability. A forced degradation study was carried out to test the selectivity and analytical performances of the analytical method. We performed a stability study of these formulations, analyzing three different concentrations (50 mg/mL, 100 mg/mL, 150 mg/mL) at time 0 and after 7, 15, 21, 30, 45, 60, and 90 days, stored at room and refrigerated temperature. The suspensions have similar profiles (regardless of initial concentration), and they are in compliance with the requirements of the F.U.I. XII ed. In terms of stability for 60 days. Future studies on the occurrence of any degradation products could provide information on the chemical stability of IDB.
Supplementary Materials
The following supporting information can be downloaded at: https://www.mdpi.com/article/10.3390/separations10090517/s1, Figure S1: Calibration curve in Mobile phase (A) and in matrix (B); Table S1: Idebenone mean concentration value expressed as relative percent of recovery after forced degradation.; Table S2: Accuracy (bias%) and precision (CV%) intra- (n = 3) and inter-day (n = 9) repeatability at three concentrations (low, medium, high).
Author Contributions
Conceptualization, E.P.; methodology, E.P., A.S. and F.P.; validation, E.P. and A.M.; formal analysis, A.M. and R.C.; software, R.C.; data curation, E.P., R.C. and A.M.; visualization, E.P.; writing—original draft preparation, R.C.; writing—review and editing, E.P., F.P., E.M., M.C., A.M. and F.S.V.; supervision, E.P. and F.S.V. All authors have read and agreed to the published version of the manuscript.
Funding
This research received no external funding.
Data Availability Statement
The data underlying this article will be shared on reasonable request by contacting the corresponding author.
Conflicts of Interest
The authors declare no conflict of interest.
References
- Gueven, N.; Ravishankar, P.; Eri, R.; Rybalka, E. Idebenone: When an Antioxidant Is Not an Antioxidant. Redox Biol. 2021, 38, 101812. [Google Scholar] [CrossRef]
- Montenegro, L.; Turnaturi, R.; Parenti, C.; Pasquinucci, L. Idebenone: Novel Strategies to Improve Its Systemic and Local Efficacy. Nanomaterials 2018, 8, 87. [Google Scholar] [CrossRef]
- Bodmer, M.; Vankan, P.; Dreier, M.; Kutz, K.W.; Drewe, J. Pharmacokinetics and Metabolism of Idebenone in Healthy Male Subjects. Eur. J. Clin. Pharmacol. 2009, 65, 493–501. [Google Scholar] [CrossRef]
- Kombath, S.; Balde, I.-B.; Carret, S.; Kabiche, S.; Cisternino, S.; Fontan, J.-E.; Schlatter, J. Stability-Indicating HPLC Assay for Determination of Idebenone in Pharmaceutical Forms. J. Anal. Methods Chem. 2015, 2015, 835986. [Google Scholar] [CrossRef][Green Version]
- Schlatter, J.; Bourguignon, E.; Majoul, E.; Kabiche, S.; Balde, I.-B.; Cisternino, S.; Fontan, J.-E. Stability Study of Oral Pediatric Idebenone Suspensions. Pharm. Dev. Technol. 2017, 22, 296–299. [Google Scholar] [CrossRef]
- Agenzia Italiana Del Farmaco Riassunto Delle Caratteristiche Del Prodotto 2023.
- Gonzaga, E.R. Role of UV Light in Photodamage, Skin Aging, and Skin Cancer: Importance of Photoprotection. Am. J. Clin. Dermatol. 2009, 10, 19–24. [Google Scholar] [CrossRef]
- Nakashima, Y.; Ohta, S.; Wolf, A.M. Blue Light-Induced Oxidative Stress in Live Skin. Free Radic. Biol. Med. 2017, 108, 300–310. [Google Scholar] [CrossRef]
- Raxone. European Medicines Agency. Available online: https://www.ema.europa.eu/en/medicines/human/EPAR/raxone (accessed on 9 June 2023).
- Uriel, M.; Gómez-Rincón, C.; Marro, D. Stability of Regularly Prescribed Oral Liquids Formulated with SyrSpend® SF. Pharm. Int. J. Pharm. Sci. 2018, 73, 196–201. [Google Scholar] [CrossRef]
- Ferreira, A.O.; Polonini, H.; da Silva, S.L.; Aglio, N.C.B.; Abreu, J.; Fernandes, B.M.A. Stability of Acetazolamide, Baclofen, Dipyridamole, Mebeverine Hydrochloride, Propylthiouracil, Quinidine Sulfate, and Topiramate Oral Suspensions in SyrSpend SF PH4. Int. J. Pharm. Compd. 2017, 21, 339–346. [Google Scholar]
- Binson, G.; Beuzit, K.; Migeot, V.; Marco, L.; Troussier, B.; Venisse, N.; Dupuis, A. Preparation and Physicochemical Stability of Liquid Oral Dosage Forms Free of Potentially Harmful Excipient Designed for Pediatric Patients. Pharmaceutics 2019, 11, 190. [Google Scholar] [CrossRef]
- Barouki, R.; Gluckman, P.D.; Grandjean, P.; Hanson, M.; Heindel, J.J. Developmental Origins of Non-Communicable Disease: Implications for Research and Public Health. Environ. Health 2012, 11, 42. [Google Scholar] [CrossRef] [PubMed]
- Bajaj, S.; Singla, D.; Sakhuja, N. Stability Testing of Pharmaceutical Products. J. Appl. Pharm. Sci. 2021, 2, 129–138. [Google Scholar] [CrossRef]
- European Medicines Agency ICH Topic. Q1A (R2) Stability Testing of New Drug Substances and Products. In International Conference on Harmonization; International Conference on Harmonization: Geneva, Switzerland, 2003. [Google Scholar]
- Rathi, A.A.; Dhamecha, D.L.; Dehghan, M.H.G.; Saifee, M.; Wakte, P.S.; Shelke, S.D.; Dongre, S.H. Development and Validation of a Stability-Indicating HPTLC Assay Method for Idebenone. Acta Chromatogr. 2011, 23, 281–294. [Google Scholar] [CrossRef]
- Podda, M.; Weber, C.; Traber, M.G.; Packer, L. Simultaneous Determination of Tissue Tocopherols, Tocotrienols, Ubiquinols, and Ubiquinones. J. Lipid Res. 1996, 37, 893–901. [Google Scholar] [CrossRef] [PubMed]
- Lang, J.K.; Packer, L. Quantitative Determination of Vitamin E and Oxidized and Reduced Coenzyme Q by High-Performance Liquid Chromatography with in-Line Ultraviolet and Electrochemical Detection. J. Chromatogr. A 1987, 385, 109–117. [Google Scholar] [CrossRef]
- Francis, M.; Sane, R.T.; Khatri, A.; Pathak, A.R. UV-Spectrophotometric and Colorimetric Methods for Determination of Idebenone from Bulk Drug and Its Pharmaceutical Formulation. Indian Drugs 2001, 38, 642–645. [Google Scholar]
- Hu, P.; Jiang, J.; Xie, H.H. Determination of Idebenone in Plasma by HPLC/MS. Acta Pharmacol. Sin. 2000, 21, 306–308. [Google Scholar]
- Amorim, C.D.M.; Couto, A.G.; Netz, D.J.A.; de Freitas, R.A.; Bresolin, T.M.B. Antioxidant Idebenone-Loaded Nanoparticles Based on Chitosan and N-Carboxymethylchitosan. Nanomedicine Nanotechnol. Biol. Med. 2010, 6, 745–752. [Google Scholar] [CrossRef]
- Palumbo, M.; Russo, A.; Cardile, V.; Renis, M.; Paolino, D.; Puglisi, G.; Fresta, M. Improved Antioxidant Effect of Idebenone-Loaded Polyethyl-2-Cyanoacrylate Nanocapsules Tested on Human Fibroblasts. Pharm. Res. 2002, 19, 71–78. [Google Scholar] [CrossRef]
- Istituto Poligrafico e Zecca dello Stato. Farmacopea Ufficiale, 12th ed.; Istituto Poligrafico e Zecca dello Stato: Roma, Italy, 2008. [Google Scholar]
- ICH Harmonised Tripartite Guideline. Validation of Analytical Procedures Q2(R2); International Council for Harmonisation of Technical Requirements for Pharmaceuticals for Human Use: Geneva, Switzerland, 2022. [Google Scholar]
- Thiyagarajan, T.; Kmv, N.R.; Pappureddy, S.B.; Nasser A, J.A.; K, B. Development and Validation of Stability Indicating Method for the Quantification of Idebenone and Its Impurities. J. Chem. Pharm. Res. 2010, 3, 356–367. [Google Scholar]
- Martin, Y.C. Exploring QSAR: Hydrophobic, Electronic, and Steric Constants C. Hansch, A. Leo, and D. Hoekman. American Chemical Society, Washington, DC. 1995. Xix + 348 Pp. 22 × 28.5 cm. Exploring QSAR: Fundamentals and Applications in Chemistry and Biology. C. Hansch and A. Leo. American Chemical Society, Washington, DC. 1995. Xvii + 557 Pp. 18.5 × 26 cm. ISBN 0-8412-2993-7 (Set). $99.95 (Set). J. Med. Chem. 1996, 39, 1189–1190. [Google Scholar] [CrossRef]
Disclaimer/Publisher’s Note: The statements, opinions and data contained in all publications are solely those of the individual author(s) and contributor(s) and not of MDPI and/or the editor(s). MDPI and/or the editor(s) disclaim responsibility for any injury to people or property resulting from any ideas, methods, instructions or products referred to in the content. |
© 2023 by the authors. Licensee MDPI, Basel, Switzerland. This article is an open access article distributed under the terms and conditions of the Creative Commons Attribution (CC BY) license (https://creativecommons.org/licenses/by/4.0/).