Abstract
The present investigation delves into the potential of vertical zone refining as an effective purification technique for achieving high-purity tin (Sn) metal. The utilization of vertical zone refining offers distinct advantages over traditional horizontal zone refining, as it allows for enhanced control over the molten zone and solid–liquid interface, ultimately leading to superior impurity separation efficiency. The present study reveals that the solute partition coefficients (k0) of various impurity elements, such as Zn, Ag, Al, Mg, Ca, Ni, In, Co, Cu, As, Pb, Fe, and Bi, during the vertical zone refining process consistently demonstrate values below one. Notably, the partition coefficient of Sb deviates slightly from the others, being greater than one but approaching one. The authors achieve exceptional levels of purity in both the bottom and middle regions of the rod by subjecting the Sn melt to nine passes of vertical zone refining at a heating temperature of 405 °C and a downward pulling rate of 10 µm/s, resulting in purities exceeding 6N4. Furthermore, by evaluating the effective partition coefficients (keff), it was determined that impurity elements, such as Cu and Bi, closely approach their equilibrium partition coefficients, reaching values of approximately 0.492 and 0.327, respectively. To further enhance the purity of Sn metal and maximize product yield, we propose the utilization of electrolytic refining and vacuum distillation, with particular emphasis on the efficient separation of five specific elements, including Cu, Fe, As, Pb, and Sb. By elucidating these findings, this study not only contributes valuable insights into the efficacy of vertical zone refining as a purification technique for high-purity tin metal, but also offers important recommendations for refining strategies and impurity element separation.
1. Introduction
High-purity tin (Sn) metal holds a critical role in the fabrication of indium tin oxide (ITO) films, owing to their exceptional properties that confer value in diverse applications. ITO thin films exhibit efficient electrical conductivity, characterized by a resistivity of 7 × 10⁻⁵ Ω·cm. Notably, these films possess high visible light transmittance, typically surpassing 90%, ensuring optimal light transmission through the material. Furthermore, ITO films exhibit excellent infrared reflectance, effectively reflecting infrared radiation. Their chemical stability guarantees durability across various environmental conditions [1]. The versatility of ITO thin films has spurred their extensive utilization in the production of solar cells, where they serve as transparent conductive coatings, allowing for efficient light absorption and electrical conduction. ITO films also play a crucial role in gas sensors, capitalizing on their high conductivity and transparency to accurately detect and quantify the presence of gases. In the realm of transistors (TFTs), ITO thin films contribute to the effective operation and overall performance of these electronic devices. Additionally, flat-panel displays greatly benefit from the incorporation of ITO films, as they provide transparent electrodes that facilitate the transmission of light, resulting in vivid and visually captivating images [2].
High-purity Sn metal assumes an indispensable role in the advancement of next-generation semiconductor devices that necessitate smaller feature sizes and shorter exposure wavelengths [3,4]. These technological strides are paramount in pushing the boundaries of progress. Notably, ASML’s NXE:3400B extreme ultraviolet (EUV) scanner serves as a noteworthy example of cutting-edge technology employed in semiconductor manufacturing. This scanner relies on a CO2 laser-produced plasma (LPP) light source system to generate extreme ultraviolet light through Sn droplets. The reflective coating of the scanner’s collector mirrors, coated with Mo/Si multilayers, faces the risk of contamination from high-energy ions and undesirable small Sn particles during the process. Such contamination poses a threat to reflectivity reduction and compromises the lifetime of the collector mirrors. Consequently, the utilization of 99.9999 wt.% (6N) or higher purity Sn metal becomes imperative to mitigate this issue and ensure optimal performance [5].
In response to the escalating significance of ecological considerations, the industrial sector has reoriented its focus towards the advancement of environmentally conscious physical approaches for the production of high-purity metals. These approaches serve as alternatives to conventional chemical methods, thereby minimizing the environmental ramifications associated with metal manufacturing. Physical methods such as zone refining [6,7,8,9], vacuum distillation [10,11], and Cz single-crystal growth [12,13] have gained considerable prominence over chemical methods such as extraction–crystallization [14], chlorination [15], and electrolysis [16]. Researchers have increasingly devoted their attention to investigating the efficacy and applicability of these physical methods in achieving elevated levels of metal purity. For instance, Zhang et al. achieved a remarkable purity of 99.99906 wt.% (5N) for tin (Sn) through the utilization of the horizontal zone refining method. Their study elucidated that impurity elements including silver (Ag), aluminum (Al), arsenic (As), bismuth (Bi), calcium (Ca), copper (Cu), iron (Fe), nickel (Ni), lead (Pb), gold (Au), cobalt (Co), and zinc (Zn) exhibited partition coefficients below one, indicating their efficient removal during the refining process. Nonetheless, the yield of the 5N-grade product fell below 45%, emphasizing the need for further advancements [17]. Li et al. employed the vertical zone refining method to produce indium (In) with a purity of 7N, achieving an impressive product yield of up to 85%. Additionally, they developed a machine-learning-assisted multiobjective model to optimize the processing parameters, thereby enhancing the efficiency of the refining process [18,19].
Vertical zone refining has emerged as a favorable technique for the purification of low-melting substances such as gallium (Ga), tellurium (Te), Sn, cadmium (Cd), and phosphorus (P). In continuation of our ongoing investigation, the present study aimed to enhance the efficiency of achieving higher purity levels in Sn through the utilization of vertical zone refining. The raw material employed was a commercially available 5 N purity Sn metal, which underwent the vertical zone refining process to augment its purity. The objective was to attain a superior level of purity in Sn while simultaneously optimizing the yield of the refined product. This research aligns with the industry’s pursuit for the highly efficient production of high-purity metals.
2. Experimental Procedure
In order to enhance the purity of commercial 5 N purity Sn and attain higher levels of purity, a self-designed vertical zone refining apparatus was employed (Figure 1a). Initially, the raw Sn rod underwent a comprehensive cleansing procedure involving the use of a hydrochloric acid solution to eliminate any surface contaminants. Subsequently, the purified rod was positioned inside a quartz tube, where controlled heating and vertical pulling were employed to establish a stable molten zone. To maintain a constant temperature gradient during the refining process, a noncontact cooling trap was specifically devised and integrated into the apparatus. To ensure a controlled atmosphere and prevent contamination, the chamber was evacuated to eliminate any impurities and subsequently filled with argon gas (>99.99 wt.% purity). This inert gas atmosphere minimized the potential for undesired reactions or impurity introduction throughout the purification process. During the vertical zone refining experiments, the temperature of the heating coil, the pulling rate of the quartz tube, and the temperature of the cooling trap system can be precisely controlled. Further details concerning the experimental procedure can be found elsewhere [18], and Table 1 presents the initial content of the 15 main impurities in the Sn raw material.
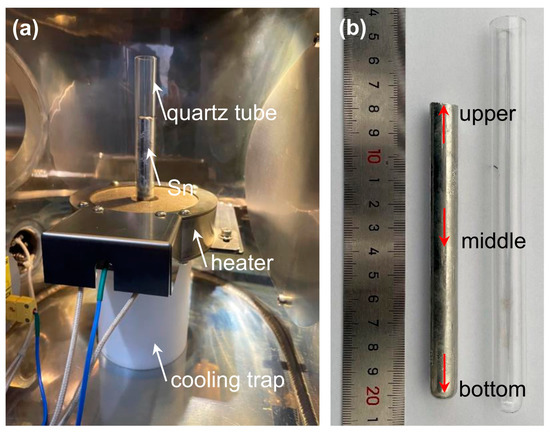
Figure 1.
The vertical zone refining set-up (a) and the vertically zone-refined Sn rod (b), with arrows indicating the GDMS detection position.

Table 1.
Initial contents of 15 main impurities in 5 N purity Sn raw material and the GDMS detection results after zone refining under different heating temperatures (unit: ppm).
Upon the completion of the vertical zone refining process, precise samples were extracted from various sections of the zone-refined rod. As indicated by the red arrows in Figure 1b, three samples were acquired from the bottom, middle, and upper regions of the rod, respectively. These samples were obtained in the form of rectangular strip-like structures, measuring 2 mm × 2 mm × 20 mm. This sampling approach facilitated an accurate evaluation of the purification efficacy and distribution of impurities along the zone-refined rod. To analyze the trace impurities present in the zone-refined Sn samples, a glow discharge mass spectrometer (GDMS) was employed. The GDMS system, depicted in Figure 2, utilizes sputtering and ionization processes to characterize and quantify the impurity content in the samples. To maintain optimal analysis conditions, the sample within the glow charge cell was cooled using liquid nitrogen, ensuring precise measurements of the impurity concentrations.
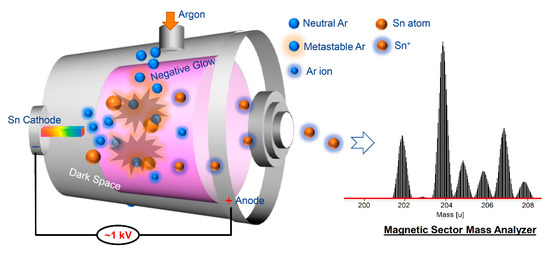
Figure 2.
Schematic diagram of the GDMS detection process.
3. Results and Discussion
3.1. Effect of Heating Temperature on the Migration of Impurities
To investigate the impact of varying heating temperatures on impurity separation, two samples were prepared through the vertical zone refining process. The first sample, denoted as VZR-410-10-9, underwent heating at 410 °C, while the second sample, referred to as VZR-405-10-9, experienced a slightly lower temperature of 405 °C. Both samples were subjected to a constant downward pulling rate of 10 μm/s, spanning a total of nine zone passes. A comprehensive analysis of impurities in distinct regions of the zone-refined samples is presented in Table 1. Notably, Au was not detected in either the raw Sn material or the two zone-refined samples, indicating its absence or exceptionally low concentration within the analyzed samples. Similarly, the element In was also undetectable in the zone-refined samples, likely due to the instrument’s limited detection capabilities. Although the initial contents of Zn, Ag, Ca, and magnesium (Mg) impurities in the raw Sn material fell below the detection limit of the GDMS instrument, minute quantities of these elements accumulated at the upper region of the zone-refined samples. This phenomenon suggests a propensity for these impurities to concentrate towards the upper region during the refinement process. In the case of Co and Al, which exhibited lower initial contents in the raw material, these elements migrated towards the upper region of the zone-refined samples. This upward migration indicates the affinity of Co and Al towards the upper region during the purification process. In contrast, elements such as Ni, Fe, Bi, Cu, Pb, As, and antimony (Sb) consistently displayed a tendency to shift towards the upper region of the zone-refined samples. However, Sb exhibited higher enrichment in the bottom region compared to the other elements, suggesting distinct behavior. These observations lead to the inference that the partition coefficients (k0) of Zn, Ag, Ca, Mg, Ni, Fe, Cu, Pb, and As are less than one, while the k0 value of Sb is greater than one.
We conducted a detailed analysis of the relative distribution of the six main impurity elements, namely Cu, Pb, Fe, Bi, Sb, and As, along the axial direction of the zone-refined rod. The results of this analysis are presented in Figure 3. By comparing Figure 3a,b, it can be seen that the whole distribution trends of the relative contents of these elements along the axial direction were similar as the heating temperature decreased from 410 °C to 405 °C. However, the axial distribution slopes of the corresponding elements slightly increased, resulting in steeper curves. This variation in distribution behavior can be attributed to the thermodynamics of the zone refining process.
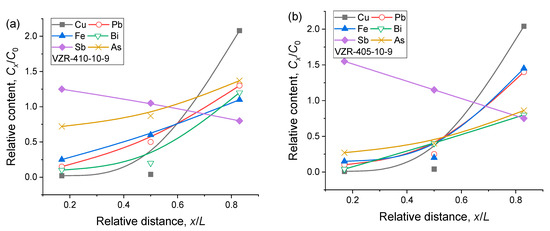
Figure 3.
Axial distribution of Cu, Pb, Fe, Bi, Sb, and As along the direction from the bottom of the zone-refined rods obtained under different conditions: (a) 410 °C, 10 µm/s, nine passes; and (b) 405 °C, 10 µm/s, nine passes.
The Pfann equation, a widely used equation in zone refining, describes the relationship between the axial distribution coefficient and the temperature gradient along the solidification front [20]. Researchers can utilize the Pfann equation, as expressed below, to estimate the efficiency of zone refining and predict the distribution behavior of impurities:
where Cx/C0 is the axial relative content of the impurity element after vertical zone refining, and x/L is the relative distance from the bottom of the rod. The effective partition coefficients (keff) of Cu, Fe, Bi, Pb, As, and Sb were calculated and listed in Table 2.

Table 2.
Effective partition coefficients of different impurity elements obtained under different vertical zone refining conditions.
The analysis of the impurity elements revealed that the effective partition coefficients were significantly influenced by the heating temperature during the vertical zone refining process [21]. As the heating temperature decreased from 410 °C to 405 °C, the keff values of all impurity elements, except for Sb, generally exhibited a decrease. Among these elements, As demonstrated the most substantial reduction in its keff value. A smaller partition coefficient implies a stronger impurity separation effect when it is less than one, indicating that the impurity has a higher tendency to concentrate in a specific region.
Conversely, a larger partition coefficient suggests a stronger impurity separation effect when it is greater than one, indicating a higher affinity for a particular region. When the partition coefficient approaches one, it signifies that the impurity element is challenging to separate effectively. In the specific process conditions employed in this study, the effective partition coefficient of Cu was found to be 0.492, while that of Bi was 0.327 after undergoing nine zone passes. These values were observed to be very close to their respective equilibrium partition coefficients (k0 = 0.47 for Cu and 0.30 for Bi). This proximity between the effective partition coefficients and equilibrium values suggests that the process conditions used in this study achieved a high level of impurity separation, resulting in successful purification outcomes.
3.2. Effect of Zone Pass on the Migration of Impurities
To further explore the effects of the zone pass, a series of experiments were conducted using a constant downward pulling rate of 10 µm/s and a heating temperature of 405 °C. Three samples, labeled as VZR-405-10-3, VZR-405-10-6, and VZR-405-10-9, were obtained to represent different numbers of zone passes. The GDMS detection results are presented in Table 3. The axial relative distribution along the zone-refined rod is depicted in Figure 4. One can see that, after three zone passes under the given process conditions, minimal changes were observed in the contents of Co, Al, Bi, Sb, and Ni elements. This indicates that these elements did not undergo significant separation during this stage of the process. The contents of Cu, Pb, and Fe elements in the bottom and middle regions were slightly lower than their initial contents, suggesting that while these impurities did exhibit some migration, it was not substantial at this point. On the other hand, the behavior of the As element was more distinct compared to the other elements. Its content in the three different regions was 0.47 ppm, 0.51 ppm, and 0.65 ppm, respectively, indicating a clear separation effect for As.

Table 3.
GDMS detection results of zone-refined samples obtained with different passes (unit: ppm).
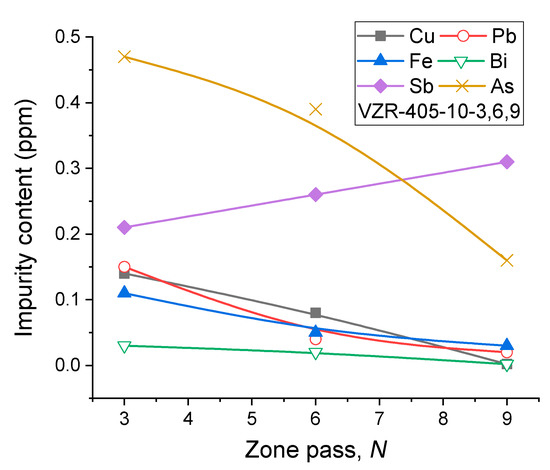
Figure 4.
Contents of Cu, Pb, Fe, Bi, Sb, and As at the bottom of the zone-refined rods obtained with different zone passes (N = 3, 6, 9).
When the number of zone passes was increased to six, no significant changes were observed for Co and Al due to their initial low concentrations. However, the content of Bi in the bottom and middle regions experienced a decrease compared to its initial content, suggesting the migration of Bi. The contents of Cu, Pb, and Fe elements in the raw material exhibited a significant decrease compared to their initial levels. Specifically, in the upper region of the sample, the contents of Cu, Pb, and Fe were measured at 0.27 ppm, 0.35 ppm, and 0.26 ppm, respectively, indicating a substantial accumulation of these impurities in the upper region. Similarly, the content of As increased from 0.39 ppm and 0.43 ppm in the bottom and middle regions to 0.63 ppm in the upper region, demonstrating significant migration of As during this stage. The Sb element displayed a similar pattern, with a higher content in the bottom region and a lower content in the upper region, consistent with its partition coefficient in the Sn melt being greater than one, as discussed in Section 3.1. The results regarding the impurity distribution after nine vertical zone refining passes are not further discussed.
The increase in the number of zone passes may enhance the separation efficiency of Cu, Pb, Fe, and Bi, although the improvement is not considered significant. However, for the impurity element As, which initially possesses a higher content, increasing the number of zone passes can significantly reduce its content in the bottom and middle regions of the zone-refined sample, thus achieving the desired purification effect. Conversely, due to its partition coefficient being greater than one, the trend of Sb element content variation is opposite to that of other elements, gradually increasing from 0.21 ppm to 0.31 ppm in the bottom region with an increase in the number of zone passes from three to nine.
To investigate the relationship between the effective partition coefficient and the number of zone passes for each impurity element, the axial relative content distribution of the six impurity elements was plotted (Figure 5). The effective partition coefficients, determined using the Pfann equation, are presented in Table 4. It can be observed that, as the number of zone passes increases, the keff values of impurity elements Cu, Fe, Bi, Pb, and As gradually decrease, while that of Sb slightly increases. All of these coefficients gradually approach their corresponding k0 values after undergoing vertical zone refining for nine passes.
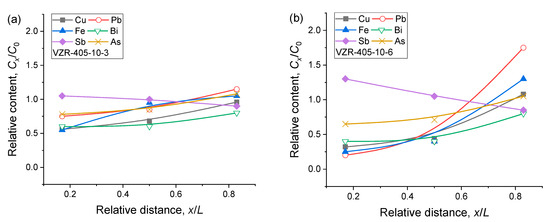
Figure 5.
Axial distribution of Cu, Pb, Fe, Bi, Sb, and As along the direction from the bottom of the zone-refined rods obtained under different conditions: (a) 405 °C, 10 µm/s, three passes; and (b) 405 °C, 10 µm/s, six passes.

Table 4.
Effective partition coefficients of different impurity elements with different zone passes N.
3.3. Purification Strategy for Higher Purity Sn
The findings of our study regarding the solute migration behavior of various impurity elements in the Sn melt are consistent with the results reported by Zhang et al. [17]. We quantitatively calculated the effective solute segregation coefficients for impurity elements such as Cu, Fe, Bi, Pb, As, and Sb during the vertical zone refining process using the Pfann equation. In our experiments, we achieved optimal impurity separation for 5N purity Sn raw material after nine passes at a heating temperature of 405 °C and a downward pulling rate of 10 µm/s. Figure 6 illustrates the changes in the content of different impurities before and after vertical zone refining. The purity of the Sn metal is primarily determined by the concentrations of seven elements: Cu, Fe, Sb, Pb, As, In, and Bi. On the other hand, the contents of Co, Zn, Ag, Ca, Al, Ni, Mg, and Au are relatively low.
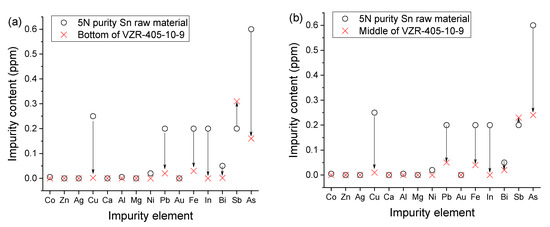
Figure 6.
Changes in content of different impurities at the bottom (a) and middle (b) of the Sn rod after refining for nine passes under 405 °C and 10 µm/s conditions.
Our results revealed significant decreases in the contents of Cu, Fe, Pb, As, In, and Bi, indicating effective separation of these impurities during the vertical zone refining process. However, the Sb content in the bottom and middle regions of the zone-refined sample exhibited an increase. Nevertheless, the total impurity contents in these regions decreased considerably, leading to a Sn purity level exceeding 99.99994% (6N4). Furthermore, the product yield, comprising both the bottom and middle regions, reached approximately 70%, surpassing the yield obtained through conventional horizontal zone refining methods.
To further enhance the purity and maximize the yield of the desired product, we propose a comprehensive approach that combines electrolytic refining, vacuum distillation, and vertical zone refining. By employing these techniques in conjunction, we can effectively eliminate impurities and achieve a higher level of purity. One of the primary concerns in refining raw materials, such as 5 N purity Sn, is the presence of impurity elements like Cu, Fe, As, and Pb, which are found in relatively higher concentrations. Electrolytic refining serves as a valuable method for separating impurities based on their standard electrode potentials. The differences in these potentials allow for the deposition of impurities with lower electrode potentials onto the anode, while those with higher electrode potentials remain in the electrolyte. This process enables the purification of the material [22]. Table 5 presents the standard electrode potentials and their corresponding values for various impurity elements in metal Sn [23]. Consequently, the separation of Cu, As, Bi, and Sb from Sn through electrolytic refining is feasible, with the exception of Pb. Moreover, considering the boiling points of Sn and its impurity elements, as shown in Table 6 [24], it becomes evident that the boiling points of As, Zn, Mg, Ca, Bi, Pb, Sb, and In are lower than that of Sn. This indicates that these elements are more likely to evaporate into the gas phase during high-temperature vacuum distillation, while the main metal Sn remains relatively stable. In other words, we can effectively remove As, Pb, and Sb, further enhancing the purity of the final product by subjecting the material to vacuum distillation at elevated temperatures. Therefore, by combining electrolytic refining, vacuum distillation, and vertical zone refining, a comprehensive and effective purification process can be achieved. This multistep approach ensures the separation and removal of impurities, particularly Cu, Fe, As, and Pb, from the raw material, resulting in a significantly enhanced purity and maximized product yield.

Table 5.
Standard electrode potential for impurities in Sn (unit: V) [23].

Table 6.
Boiling point for impurities in Sn (unit: °C) [24].
4. Conclusions
This study focuses on the purification of Sn metal using the vertical zone refining method, aiming to investigate the influence of two variables, namely heating temperature and zone passes, on the migration behavior of impurity elements. Through our research, we aim to provide a comprehensive understanding of the fundamental purification mechanisms involved. The primary findings derived from our investigation are summarized as follows:
(1) During the vertical zone refining process of Sn metal, the solute partition coefficients of various impurity elements, including Zn, Ag, Al, Mg, Ca, Ni, In, Co, Cu, As, Pb, Fe, and Bi, are all observed to be less than one. However, the partition coefficient of Sb is slightly greater than one but still close to one.
(2) In the process of vertical zone refining of Sn melt, reducing the heating temperature from 410 °C to 405 °C proves to be more favorable for impurity removal. After nine passes, based on the initial 5N purity Sn raw material, both the bottom and middle regions of the zone-refined bar material exhibit purification levels exceeding 6N4.
(3) Under the process conditions involving a heating temperature of 405 °C and a pulling rate of 10 µm/s, the effective partition coefficients of major impurity elements, such as Cu, Fe, Bi, Pb, As, and Sb, progressively approach the equilibrium solute partition coefficient as the number of zone passes increases from three to nine.
(4) The combination of vertical zone refining with electrolytic refining and vacuum distillation presents a promising approach for further purifying Sn metal and maximizing the product yield. Special attention should be given to the separation of elements such as Cu, Fe, As, Pb, and Sb, which have a higher content in the 5 N purity Sn raw material.
By elucidating these findings, our study contributes to the advancement of purification techniques for Sn metal, offering insights into potential strategies for enhancing the purity and yield of this important material.
Author Contributions
J.W.: data curation; formal analysis; investigation; methodology; validation; writing—original draft. M.W.: formal analysis; investigation; validation; writing—original draft. J.P.: formal analysis; writing—review and editing. H.Z.: conceptualization; formal analysis; funding acquisition; project administration; resources; supervision; writing—review and editing. All authors have read and agreed to the published version of the manuscript.
Funding
This work was supported by the National Natural Science Foundation of China (Grant No. 52074180), and the Science and Technology Major Project of Yunnan Province (Grant No. 202002AB080001-2).
Data Availability Statement
Data will be made available on request.
Conflicts of Interest
The authors declare no conflict of interest.
References
- Fan, Y.Y.; Liu, Y.; Niu, L.P.; Zhang, W.G.; Zhang, T.A. Efficient extraction and separation of indium from waste indium-tin oxide (ITO) targets by enhanced ammonium bisulfate leaching. Sep. Purif. Technol. 2021, 269, 118766. [Google Scholar] [CrossRef]
- Wang, K.Z.; Jiao, P.W.; Cheng, Y.Y.; Xu, H.R.; Zhu, G.S.; Zhao, Y.Y.; Jiang, K.P.; Zhang, X.Y.; Su, Y.G. ITO films with different preferred orientations prepared by DC magnetron sputtering. Opt. Mater. 2022, 134, 113040. [Google Scholar] [CrossRef]
- van Herpen, M.M.J.W.; Klunder, D.J.W.; Soer, W.A.; Moors, R.; Banine, V. Sn etching with hydrogen radicals to clean EUV optics. Chem. Phys. Lett. 2010, 484, 197–199. [Google Scholar] [CrossRef]
- Sasaki, A.; Sunahara, A.; Nishihara, K.; Nishikawa, T.; Fujima, K.; Kagawa, T.; Koike, F.; Tanuma, H. Atomic modeling of the plasma EUV sources. High Energ. Dens. Phys. 2009, 5, 147–151. [Google Scholar] [CrossRef]
- Yang, D.K.; Wang, D.; Huang, Q.S.; Song, Y.; Wu, J.; Li, W.X.; Wang, Z.S.; Tang, X.H.; Xu, H.X.; Liu, S.; et al. The development of laser-produced plasma EUV light source. Chip 2022, 1, 50–60. [Google Scholar] [CrossRef]
- Wang, S.; Fang, H.S.; Jin, Z.L.; Zhao, C.J.; Zheng, L.L. Integrated analysis and design optimization of germanium purification process using zone-refining technique. J. Cryst. Growth 2014, 408, 42–48. [Google Scholar] [CrossRef]
- Ezheiyan, M.; Sadeghi, H. Simulation for purification process of high pure germanium by zone refining method. J. Cryst. Growth 2017, 462, 1–5. [Google Scholar] [CrossRef]
- Zaiour, A.; Zahraman, K.; Roumie, M.; Charara, J.; Fawaz, A.; Lmai, F.; Hage-Ali, M. Purification of tellurium to nearly 7N purity. Mat. Sci. Eng. B 2006, 131, 54–61. [Google Scholar] [CrossRef]
- Zhang, X.; Friedrich, S.; Friedrich, B. Production of high purity metals: A review on zone refining process. J. Cryst. Process Technol. 2018, 8, 33–55. [Google Scholar] [CrossRef]
- Zhang, L.; Zhang, X.W.; Li, Z.A.; Chen, D.H.; Wang, Z.Q.; Pang, S.M.; Zhou, L.; Wu, D.G.; Ke, L.S.; Nan, C.B. Distribution model of lowly volatile impurity in rare earth metal purified by vacuum distillation. Sep. Purif. Technol. 2021, 262, 118314. [Google Scholar] [CrossRef]
- Zheng, L.; Zhang, L.; Nan, C.B.; Sun, Y.R.; Zhou, X.P.; Shi, H.F.; Wang, G.; Xu, B.Q.; Yang, B.; Pan, J.G.; et al. A novel model of bismuth and lead impurities removal behavior in purification of antimony metal by vacuum distillation. Vacuum 2023, 211, 111910. [Google Scholar] [CrossRef]
- Abrosimov, N.; Czupalla, M.; Dropka, N.; Fischer, J.; Gybin, A.; Irmscher, K.; Janicskó-Csáthy, J.; Juda, U.; Kayser, S.; Miller, W.; et al. Technology development of high purity germanium crystals for radiation detectors. J. Cryst. Growth 2020, 532, 125396. [Google Scholar] [CrossRef]
- Wang, G.J.; Mei, H.; Mei, D.M.; Guan, Y.T.; Yang, G. High purity germanium crystal growth at the University of South Dakota. J. Phys. Conf. Ser. 2015, 606, 012012. [Google Scholar] [CrossRef]
- Liu, Z.S.; Sheng, M.L.; He, Y.; Zhou, H.P.; Huang, J.; Luo, X.P.; Zhang, Y.M. Coordination mechanism of aluminum with oxalate and fluoride in aluminum crystallization from vanadium extraction wastewater. J. Mol. Liq. 2022, 347, 117992. [Google Scholar] [CrossRef]
- Zhu, F.X.; Ma, S.R.; Ma, Z.S.; Qi, L.H.; Peng, W.X.; Li, K.H.; Qiu, K.H. Preparation of TiCl4 from Panzhihua ilmenite concentrate by boiling chlorination. J. Mater. Res. Technol. 2023, 23, 2703–2718. [Google Scholar] [CrossRef]
- Li, M.; Liu, C.Y.; Ding, A.T.; Xiao, C.L. A review on the extraction and recovery of critical metals using molten salt electrolysis. J. Environ. Chem. Eng. 2023, 11, 109746. [Google Scholar] [CrossRef]
- Zhang, H.; Zhao, J.Y.; Xu, J.J.; Li, Y.F.; Pu, Z.H.; Xu, B.Q.; Yang, B. Preparation of high-purity tin by zone melting. Russ. J. Non-Ferr. Met. 2020, 61, 9–20. [Google Scholar] [CrossRef]
- Li, M.X.; Tian, Q.L.; Wu, M.Z.; Peng, J.B.; Zhang, J.T.; Chen, L.S.; Lu, X.W.; Xu, Z.S.; Zheng, H.X. Numerical simulation analysis on solute redistribution of In–1 wt% Sn alloy during multipass vertical zone refining process. J. Cryst. Growth 2021, 565, 126156. [Google Scholar] [CrossRef]
- Shang, Z.W.; Lian, Z.H.; Li, M.J.; Han, K.; Zheng, H.X. Machine-learning-assisted multi-objective optimization in vertical zone refining of ultra-high purity indium. Sep. Purif. Technol. 2023, 305, 122430. [Google Scholar] [CrossRef]
- Pfann, W.G. Zone Melting; John Wiley: New York, NY, USA, 1966; pp. 197–241. [Google Scholar]
- Zaiour, A.; Hamdoun, B.; Charara, J.; Roumié, M.; Zahraman, K.; Hage-Ali, M. A new theoretical formulation of temperature effect on impurities diffusion coefficients in molten tellurium. Phys. Scr. 2015, 71, 414–418. [Google Scholar] [CrossRef]
- Schlesinger, M.E.; Sole, K.C.; Davenport, W.G.; Alvear Flores, G.R.F. Chapter 13—Electrolytic refining. In Extractive Metallurgy of Copper, 6th ed.; Schlesinger, M.E., Sole, K.C., Davenport, W.G., Alvear Flores, G.R.F., Eds.; Elsevier: Amsterdam, The Netherlands, 2022; pp. 331–359. [Google Scholar]
- Schweitzer, P.E. Corrosion Engineering Handbook, Second Edition—3 Volume Set (Corrosion Technology); CRC Press: Boca Raton, FL, USA, 1996. [Google Scholar]
- Samuel, R. Handbook of the Elements; Open Court: Chicago, IL, USA, 1999. [Google Scholar]
Disclaimer/Publisher’s Note: The statements, opinions and data contained in all publications are solely those of the individual author(s) and contributor(s) and not of MDPI and/or the editor(s). MDPI and/or the editor(s) disclaim responsibility for any injury to people or property resulting from any ideas, methods, instructions or products referred to in the content. |
© 2023 by the authors. Licensee MDPI, Basel, Switzerland. This article is an open access article distributed under the terms and conditions of the Creative Commons Attribution (CC BY) license (https://creativecommons.org/licenses/by/4.0/).