Communication

Detection of Periodontal Pathogens Based on an Integrated Continuous Flow PCR and Capillary Electrophoresis Microfluidic Chip

1
Engineering Research Center of Optical Instrument and System, Shanghai Environmental Biosafety Instruments and Equipment Engineering Technology Research Center, School of Optoelectronic Information and Computer Engineering, University of Shanghai for Science and Technology, Shanghai 200093, China
2
Key Lab of Optical Instruments and Equipment for Medical Engineering, School of Optoelectronic Information and Computer Engineering, University of Shanghai for Science and Technology, Shanghai 200093, China
3
Shanghai Key Lab of Modern Optical System, School of Optoelectronic Information and Computer Engineering, University of Shanghai for Science and Technology, Shanghai 200093, China
4
Graduate School of Engineering, Osaka University, Osaka 565-0871, Japan
*
Authors to whom correspondence should be addressed.
These authors contributed equally to this work.
Separations 2023, 10(4), 271; https://doi.org/10.3390/separations10040271
Submission received: 8 March 2023 / Revised: 6 April 2023 / Accepted: 17 April 2023 / Published: 21 April 2023

Abstract

:
Continuous-flow PCR (CF-PCR) can realize rapid DNA amplification because of the high temperature variation rate. However, off-line detection methods for PCR may induce cross contamination. To overcome this problem, we herein fabricated an integrated CF-PCR and electrophoresis microfluidic chip. The optimal voltage applied in the electrophoresis part of the microfluidic chip was achieved by simulation in COMSOL. Coating the inside wall of the microchannel can inhibit electroosmotic flow and improve the resolution for DNA fragments. The temperature distribution of the serpentine part can meet the PCR and has no obvious suppressive effect on sample separation. Finally, we have performed the amplification of target genes for Porphyromonas gingivalis, Tannerella forsythia, and Treponema denticola and detected the corresponding PCR products in the microfluidic chip within 11 min. Such work provides a new method for the rapid detection of bacteria.

1. Introduction

Polymerase chain reaction (PCR) is a biotechnology used for the amplification of nucleic acid in vitro. It has been widely employed in the rapid detection of pathogenic microorganisms since its invention [1]. However, the temperature variation rate of the traditional PCR thermal cycles has been about 4–6 °C/s, and thus the low temperature variation rate has greatly restricted its efficiency.
So far, many technologies based on microfluidic chip have been proposed for the rapid PCR. Among those methods, continuous-flow PCR (CF-PCR) can realize rapid temperature variations by continuously moving the sample throughout the serpentine microchannel placed on the surface of relevant heating blocks, which maintain a static temperature throughout the PCR process [2,3]. CF-PCR has attracted much research interest since it was first proposed by Manz’s group [4]. To reduce the cost of the fabrication process, Qi et al. fabricated a PMMA substrate microfluidic chip using a low-power CO2 laser ablation technique and finished the amplification of Pseudomonas [5]. Lee et al. fabricated a glass–polytetrafluoroethylene (PTFE) –glass sandwich CF-PCR for the detection of foodborne pathogens [6]. They folded the PFTE tube into a serpentine form, sandwiched it between two glass slides, and then performed the on-site detection of PCR products using the fluorescence from the SYBR Green I and DNA mixture. Our lab also performed series research about CF-PCR. We have developed an automated sample injection system to replace the syringe pump. Such work is helpful for the development of compact CF-PCR systems [7]. To make the CF-PCR more efficient, we have performed the multiplex amplification of DNA in the CF-PCR microfluidic chip [8]. We have also developed a CF-PCR array microfluidic chip to increase its throughput [9]. Moreover, we have developed droplets CF-PCR in order to reduce the evaporation from the polydimethylsiloxane (PDMS) and to ensure that the PCR products can be determined by the fluorescence [10]. However, the fluorescence can also be induced via false positive PCR products; hence, it is not reliable if one only determines the PCR products based on fluorescence. Sui’s group also developed the CF-PCR microfluidic chip integrated with DNA hybridization [11], but the cost of the probe was high and the target–probe hybridization took a long time, having been completed in about 1 h at 55 °C.
Microfluidic chip electrophoresis (MCE) is a versatile tool for the discrimination of DNA [12] because it is based on the separation of nucleic acid by its molecular weight [13]. Herein, we develop an integrated microchip that consists of CF-PCR and MCE and which can realize amplification of DNA and on-site detection of PCR products within a short period of time. Finally, we validate the system via the detection of the typical periodontal pathogens, which are harmful for people’s health.

2. Materials and Methods

2.1. Reagents

Bovine serum albumin (BSA) and polyvinyl pyrrolidone (PVP) were bought from Aladdin (Shanghai, China). SpeedSTAR HS DNA Polymerase was obtained from Takara (Dalian, China) and 10× TBE and 10,000× SYBR Green I were bought from Solarbio (Beijing, China). Polydimethylsiloxane (PDMS) was purchased from The Dow Chemical Company (Midland, MI, USA). The glass slides were obtained from Shitai Equipment (Nantong, China). A 100 bp DNA ladder was purchased from RuichuBio (Shanghai, China). A quantity of NaOH powder dissolved in ultrapure water to a final concentration of 40 g/L. 3-methacryloxypropyltrimethoxysilane (LS-3380) was obtained from Shin-Etsu Chemical (Tokyo, Japan). Ammonium persulphate (APS) was purchased from Sangon (Shanghai, China). The N, N, N′, N′-Tetramethyl ethylenediamine (TEMED) was purchased from Sinopharm Chemical Reagent (Shanghai, China). Acrylamide was obtained from Wako Pure Chemical (Osaka, Japan). The primers listed in Table 1 were synthesized by Sangon (Shanghai, China).

2.2. Preparation of the PCR Solution

To reduce the absorption of Taq polymerase, BSA was added into the PCR solution. The 50 μL PCR reagent consisted of 2.0 μL DNA template, 4.0 μL dNTP mixture (2.5 mM), 5.0 μL 10× Fast Buffer I, 1.0 μL forward and backward primer (10 μM), 4.0 μL PVP (0.085 mM), 0.25 μL SpeedSTAR HS DNA Polymerase (5 U μL−1) (Takara, Dalian, China), 10.0 μL BSA solution with a final concentration of 0.2 μg/μL, and 20.25 μL of ultrapure water.

2.3. Fabrication of CF-PCR-MCE Microfluidic Chip

Briefly, the replica was fabricated using lithography (MJB4, SUSS MicroTec, Sternenfels, Germany) after SU-8 photoresist was spin-deposited on a silicon wafer. Next, the PDMS prepolymer and curing agent were mixed evenly at a ratio of 10:1, and the PDMS was subsequently molded onto the replica mold. The inlet and outlet of the microchannel was drilled using a 0.9 mm diameter needle. Finally, the microfluidic chip was bonded on a slide after they were both activated by plasma cleaner. The CF-PCR-MCE chip (Figure 1A) consisted of two parts of PDMS. In the PDMS block containing the PCR channel, a 1 mm diameter hole was punched at the reserved position. The PCR solution was able to flow into the microchannel from this hole. The PDMS block was then bonded to a glass substrate and the PDMS block containing the MCE part was bonded on top of the PDMS surface. This ensured that there was a through-hole between the upper and lower PDMS blocks.

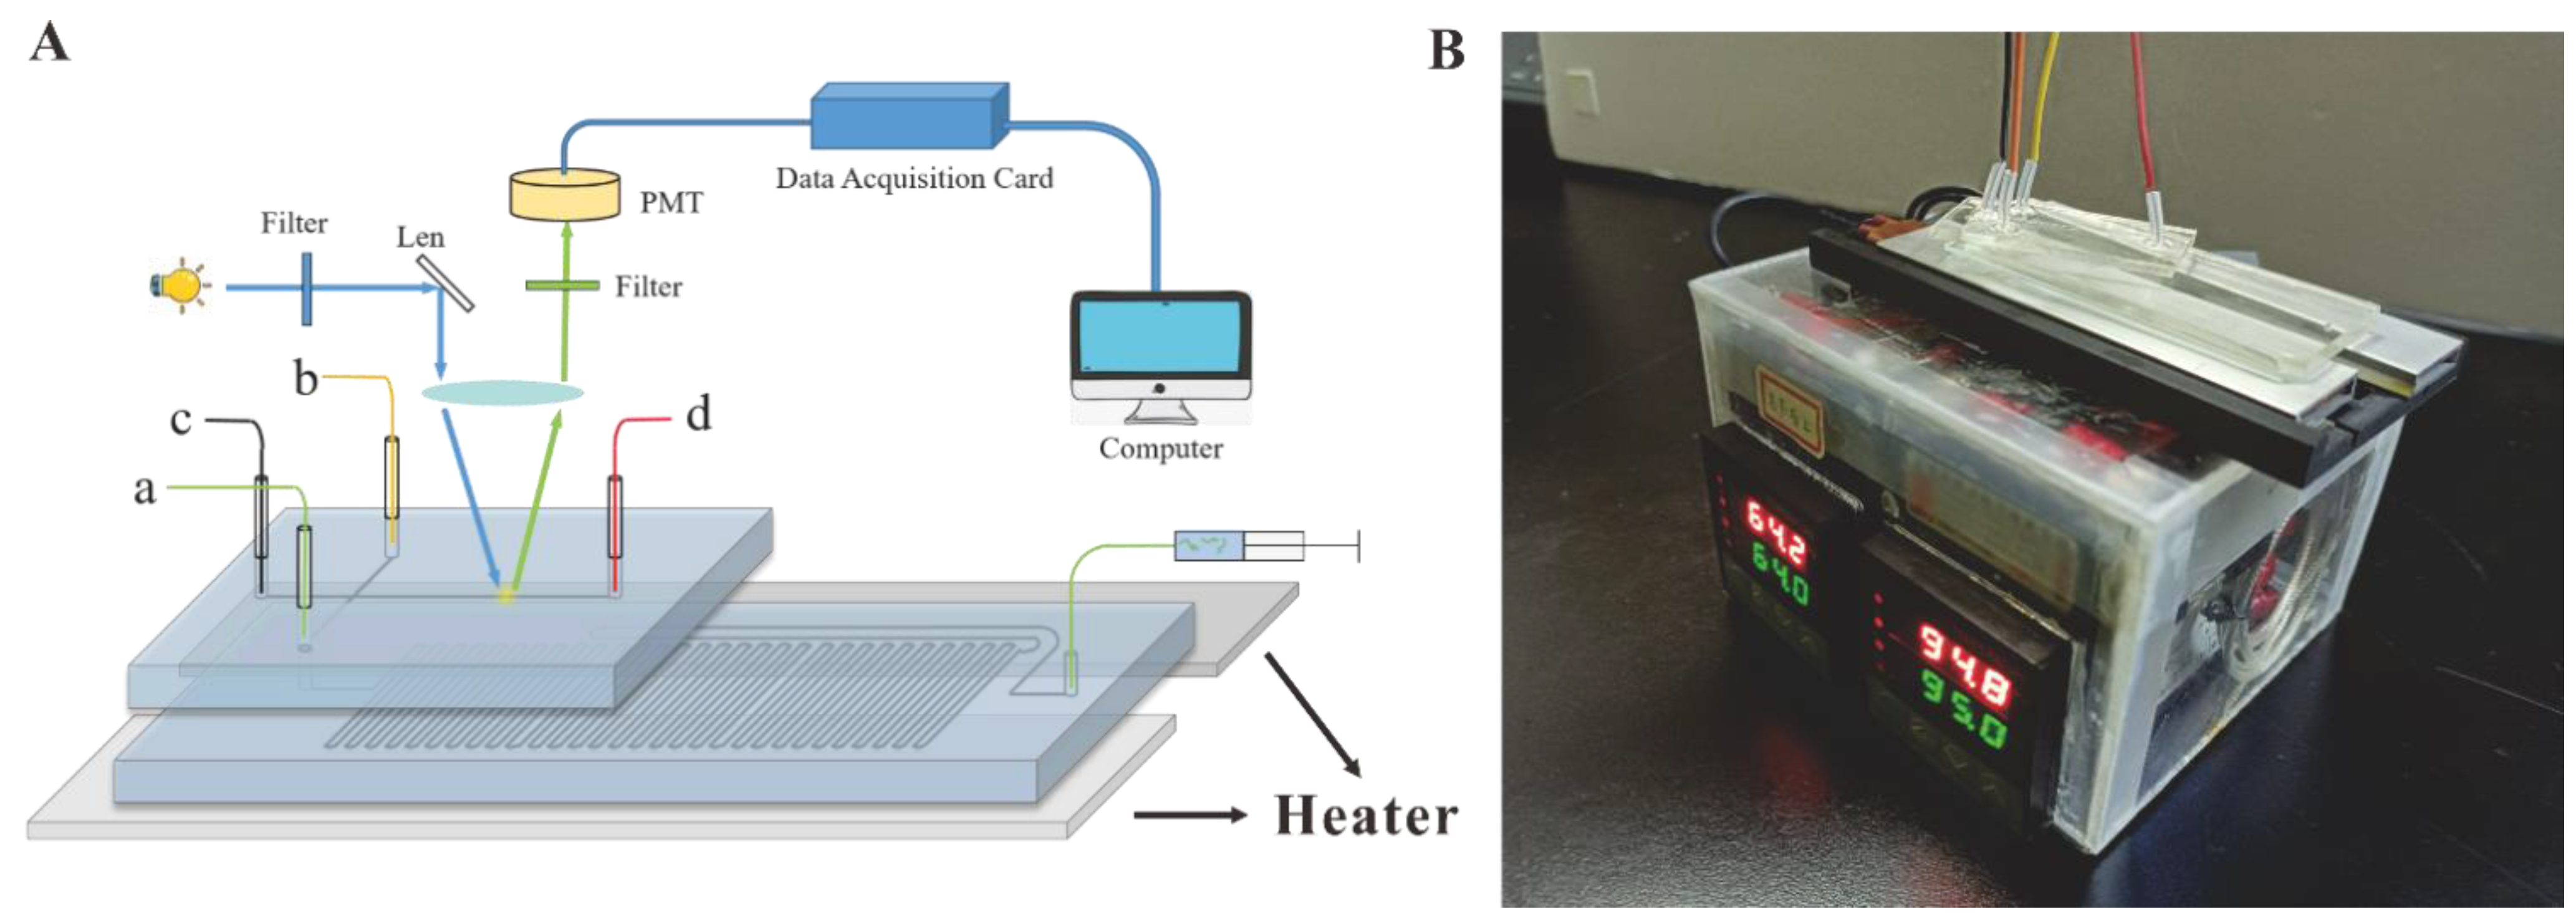
2.4. Construction of the CF-PCR-MCE System

The CF-PCR-MCE system (Figure 1B) consists of a microfluidic pump (PHD2000, Harvard Apparatus), a temperature control unit, a high-voltage linear adjustable power supply, and a CF-PCR-MCE chip. The microfluidic pump drives the liquid into the microchannel through silicone tube of the chip. It consists of two heating modules, temperature sensors, and a PID controller. The temperature control unit can output a constant temperature of 96 °C and 65 °C, with a sensitivity of 0.1 °C. The high-voltage linear adjustable power supply includes two power modules (Koso Electronics, Shanghai, China). Each one can output voltages ranging from 0 V to 2000 V. The PCR microchannel in the chip contains 40 serpentine cycles, with a length of 1.46 m and a rectangular cross-section of 100 μm. The injection channel and the separation channel of the cross-shaped CE structure have a length of ab: 10 mm and cd: 35 mm, respectively. The intersection of the injection channel and the separation channel is 0.5 cm away from the negative electrode end c, and the detection window is located 0.5 cm away from the positive electrode end d. The CF-PCR-MCE chip is placed on the temperature control unit, with a distance of 12 mm between the two heating blocks.

2.5. The Self-Built Capillary Electrophoresis System

All the PCR products were validated in a self-built CE system. In brief, it was composed of a confocal optical system, a MODEL 610E high voltage power supply (TREK, Chapel Hill, NC, USA), and a photomultiplier (PMT) (R928, Hamamatsu photonics, Tokyo, Japan). The confocal optical system was based on a BX51 epi-illumination microscope (Olympus, Tokyo, Japan). The light centered at 490 nm was achieved using a mercury lamp. Then, it passed through the mixture of DNA and SYBR Green I in the capillary. The fluorescence from the mixture was collected by the PMT. NI-USB-6212 card (National Instrument, Austin, TX, USA) and a self-built LabVIEW software were used for signal processing. All the separations were performed in the dark and at room temperature.

2.6. Experimental Protocol for Coating the Microchannels

First, the silicone tubes at both ends a and b of the injection channel were sealed with clamps. Then, a vacuum pump was used to pump the coating solution slowly into the separation channel. The separation channel was successively exposed to NaOH, ultrapure water, and methanol for a duration of 15 min. Subsequently, a mixed solution of 100 μL methanol, 8 μL LS-3380, 1 μL acetic acid, and 1891 μL water was prepared. The separation channels were flushed with the mixed solution for 2 h. The channel was rinsed with methanol for 15 min. Then, 20 mg of APS and 0.7 g of acrylamide (AM) were diluted in 20 mL water. The solution was degassed and 20 μL TEMED was added to it. The channel was coated with the solution for 2 h. Finally, the microchannel was rinsed with ultrapure water.

3. Results and Discussion

3.1. Simulation of Sample Flow State

The flow characteristics of DNA molecules in the microchannel affected by the applied voltage were analyzed using COMSOL Multiphysics software [17]. Current, diluted matter transfer, and peristaltic flow were chosen in the physical field tree. The diluted matter transfer technique was employed to resolve the NernstPlanck equation [18]. The model presumed that the charged sample’s concentration was significantly lower in comparison to the other ions that were dissolved in the solution, signifying that the sample concentration did not impact the solvability of the solution [19,20]. Through the simulation of the voltage profiles during injection and separation phases, the voltage distribution at each point during injection and separation were determined. For the sample injection, the voltage value applied to point b was 500 V, while the voltage values of a, c, and d were 0 V. During separation, the applied voltages on a, b, c, and d were 300 V, 300 V, 0 V, and 800 V, respectively.
The simulation results are presented in Figure 2, where the samples are represented as red and yellow regions, and the green region in the surrounding area represents the background buffer. The initial step observed in Figure 2A involves sample injection, whereby the application of an electric field propels the sample from the orifice to the cross-sectional area of the channel, concomitant with simultaneous “squeezing” from the adjacent side channel. The sample can flow stably from a to b without spillover to c and d ports. Figure 2B shows the sample flow state in the cross area at the initial stage of the separation phase. The sample in the cross area begins to flow to the outlet d, and the remaining sample flows back to the inlet a and outlet b, without affecting the separation channel. Figure 2C,D shows how the samples moved toward the outlet d with different separation times. As the separation time increased, the DNA samples began to spread, which may be caused by different molecular weight. Thus, the microfluidic chip and voltages can be employed for DNA separation.

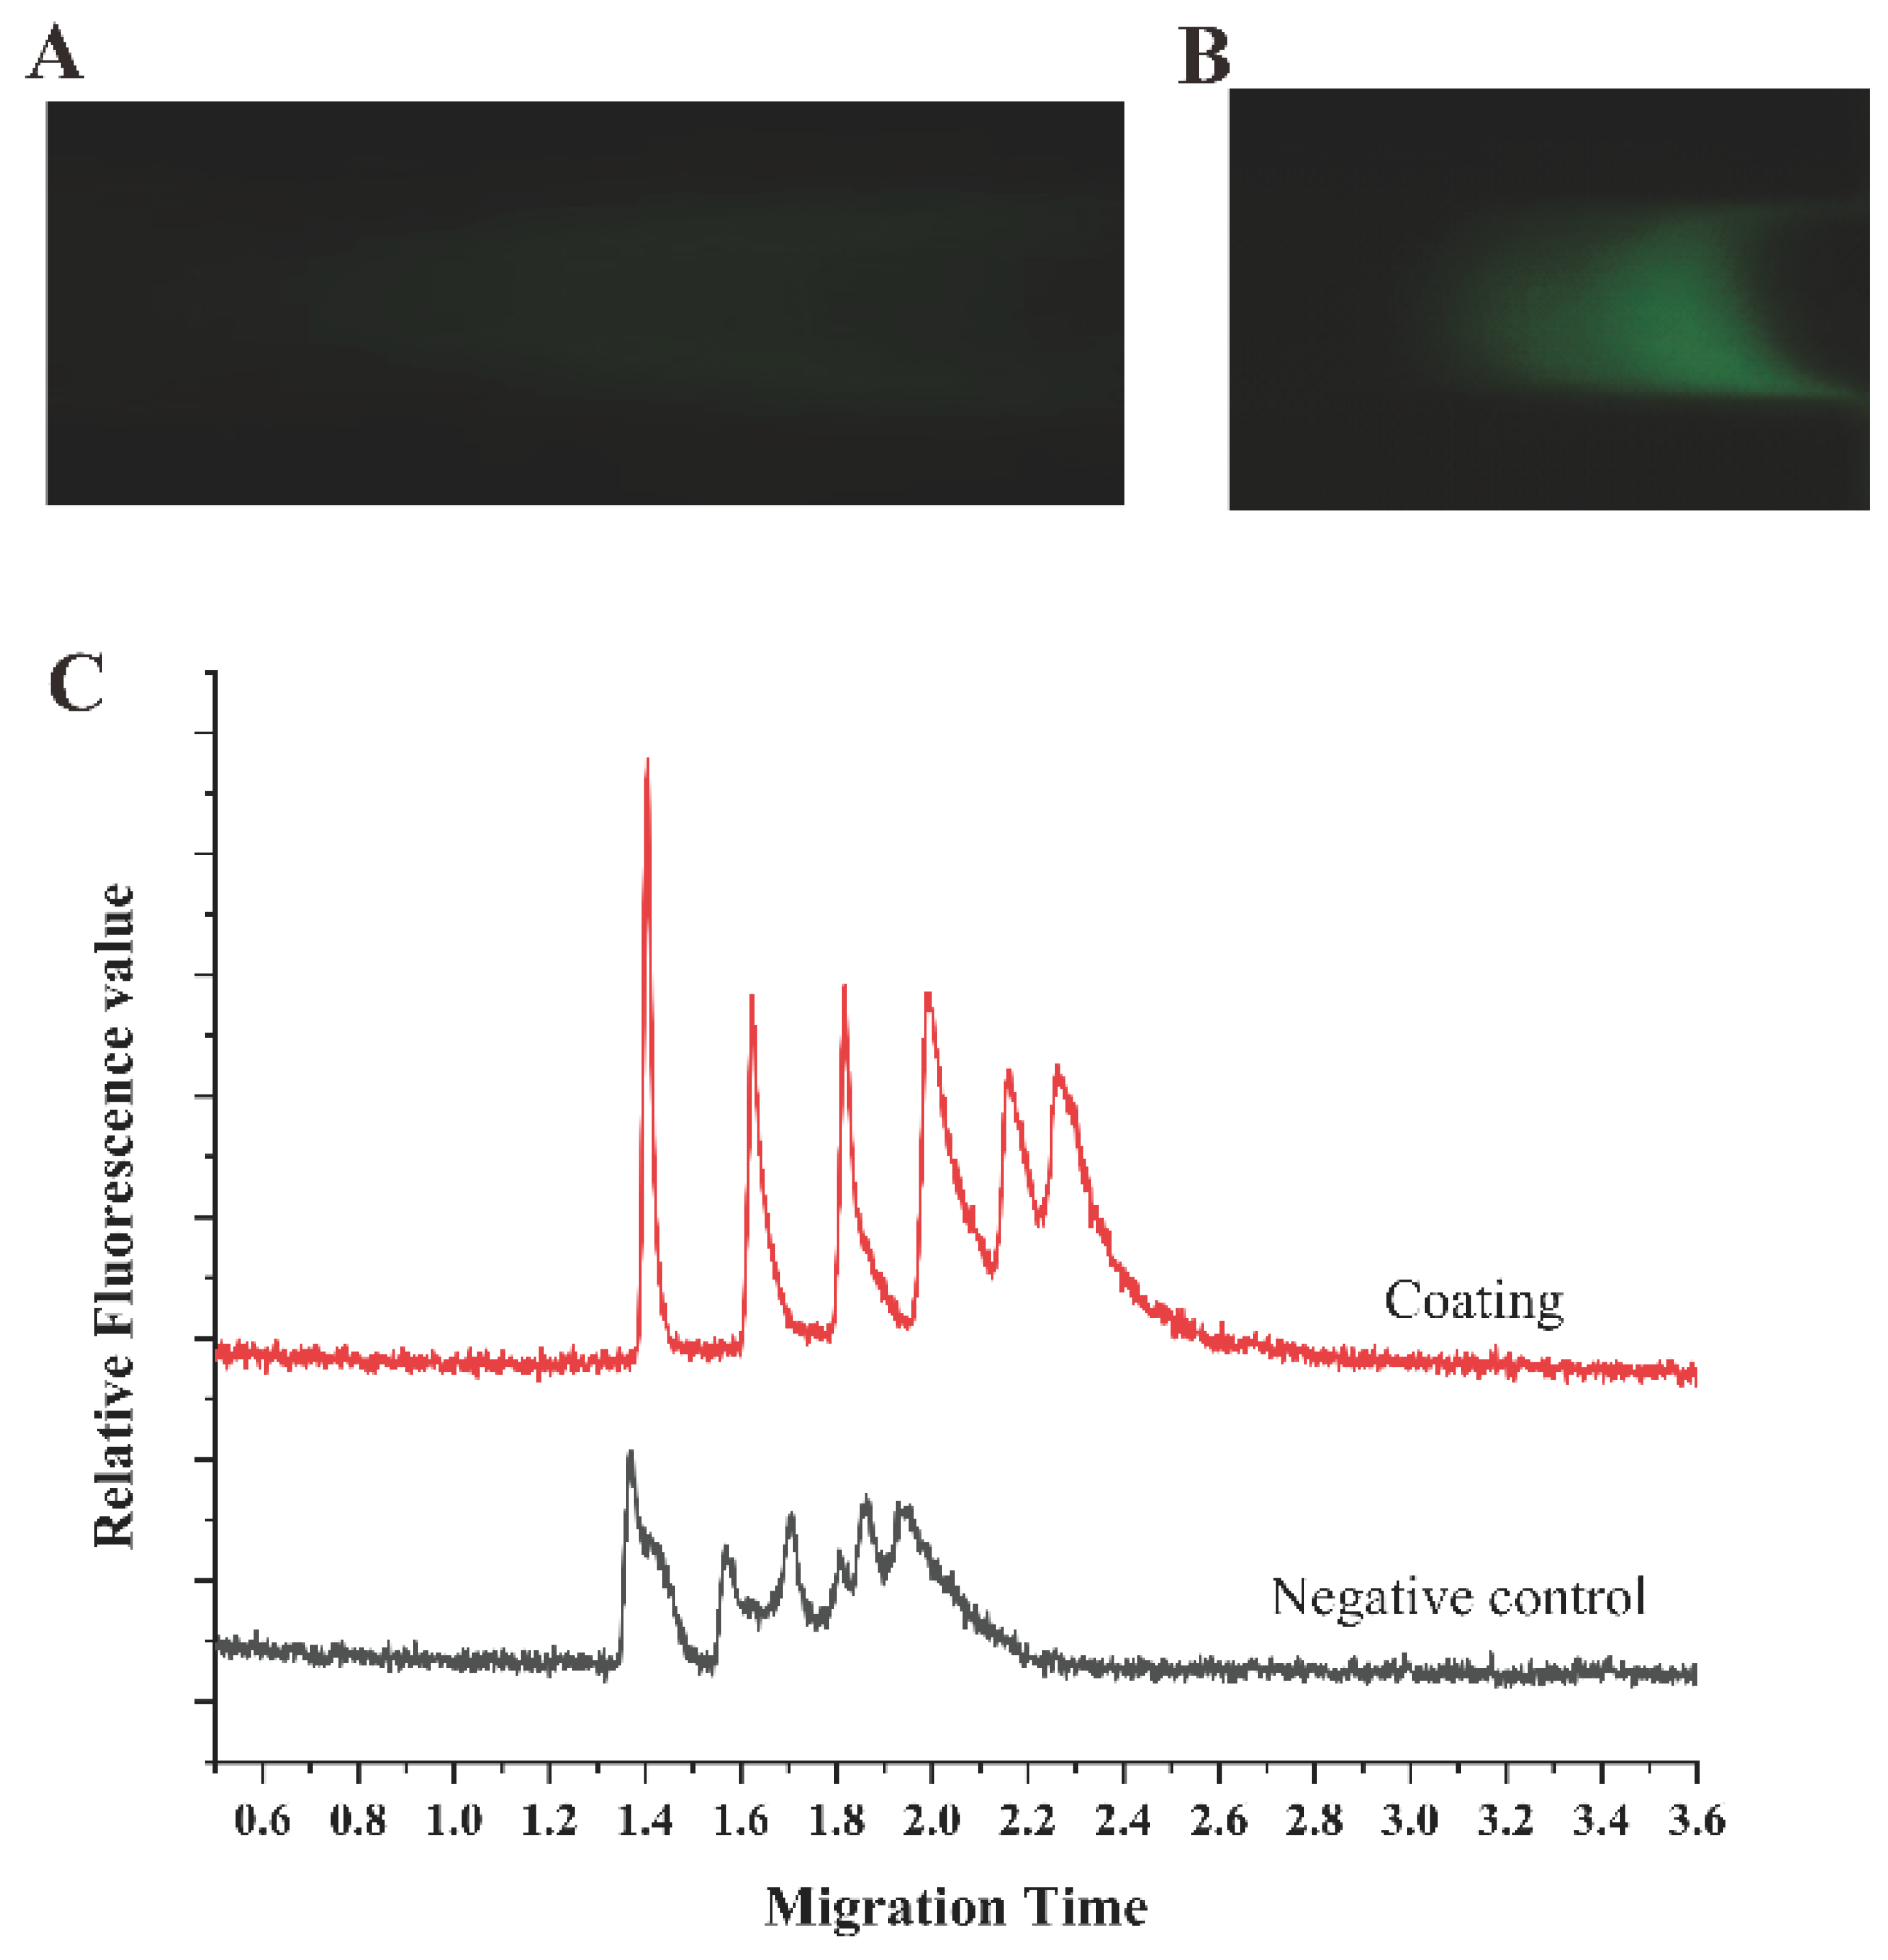
3.2. The Impact of Coating on Electrophoresis

The separation performance of CE can be notably impacted by the occurrence of electroosmotic flow (EOF) [21,22]. To reduce the adverse effects of EOF, a promising strategy involves the chemical modification of microchannel surfaces through coating techniques [23]. We investigated the effect of the coating on the electrophoretic separation performance of DNA. DNA Ladders with different molecular weights (100 bp, 200 bp, 300 bp, 400 bp, 500 bp, 600 bp) were analyzed using coated electrophoresis chips and uncoated chips under the same electrophoretic conditions. Figure 3A,B shows the DNA passing through the detection window in the process of electrophoresis in the uncoated chip and the coated chip, respectively. These images show that the fluorescence intensity of DNA in the uncoated chip is low, and there is a comet trailing phenomenon, which may be due to the EOF decreasing the migration velocity of DNA. Figure 3C shows the electrophoresis results of the coated and uncoated chips. The results showed that although all six peaks of the DNA ladder were separated in the uncoated chip, the fluorescence signal was relatively low. The separation performance can be evaluated using resolution (R), which is defined as:
R = 2 t R B t R A W A + W B
where (tR)A and (tR)B are the migration times of samples A and B, where (tR)B > (tR)A, and WA and WB are the corresponding peak widths of samples A and B. Through Figure 3C, we can see that R between 100 bp and 200 bp was approximately 1.212 and 1.614 for uncoated and coated microchannel, respectively. Thus, coating the chip is effective for DNA isolation.

3.3. Temprerature Distribution in the CF-PCR-MCE Chip

As shown in Figure 1B, we used two XH-W2023 PID temperature controllers to precisely control the temperature of the aluminum block. Temperatures of 65 °C and 95 °C were set according to the temperature needed for denaturing, annealing, and extension. The temperature control instrument can automatically adjust the heating current to make the aluminum heating block connected to it reach the corresponding temperature. After 1.5 min, the two aluminum heating blocks reach their respective temperatures and then maintain a constant temperature. We evaluated the temperature distribution of the aluminum block (Figure 4A), CF-PCR chip (Figure 4B), and CF-PCR-MCE chip (Figure 4C,D) using an IR camera (Testo 865, Testo, Inc., and Germany). Results showed that the isothermal region matched well with the temperature required for the PCR process. In addition, although the temperature of the electrophoresis part of the chip increased slightly, the entire PCR process remained below 50 °C within 505 s, indicating that although the PDMS material has a certain thermal conductivity, the heat required for the PCR process does not have a suppressive effect on the electrophoresis [24].

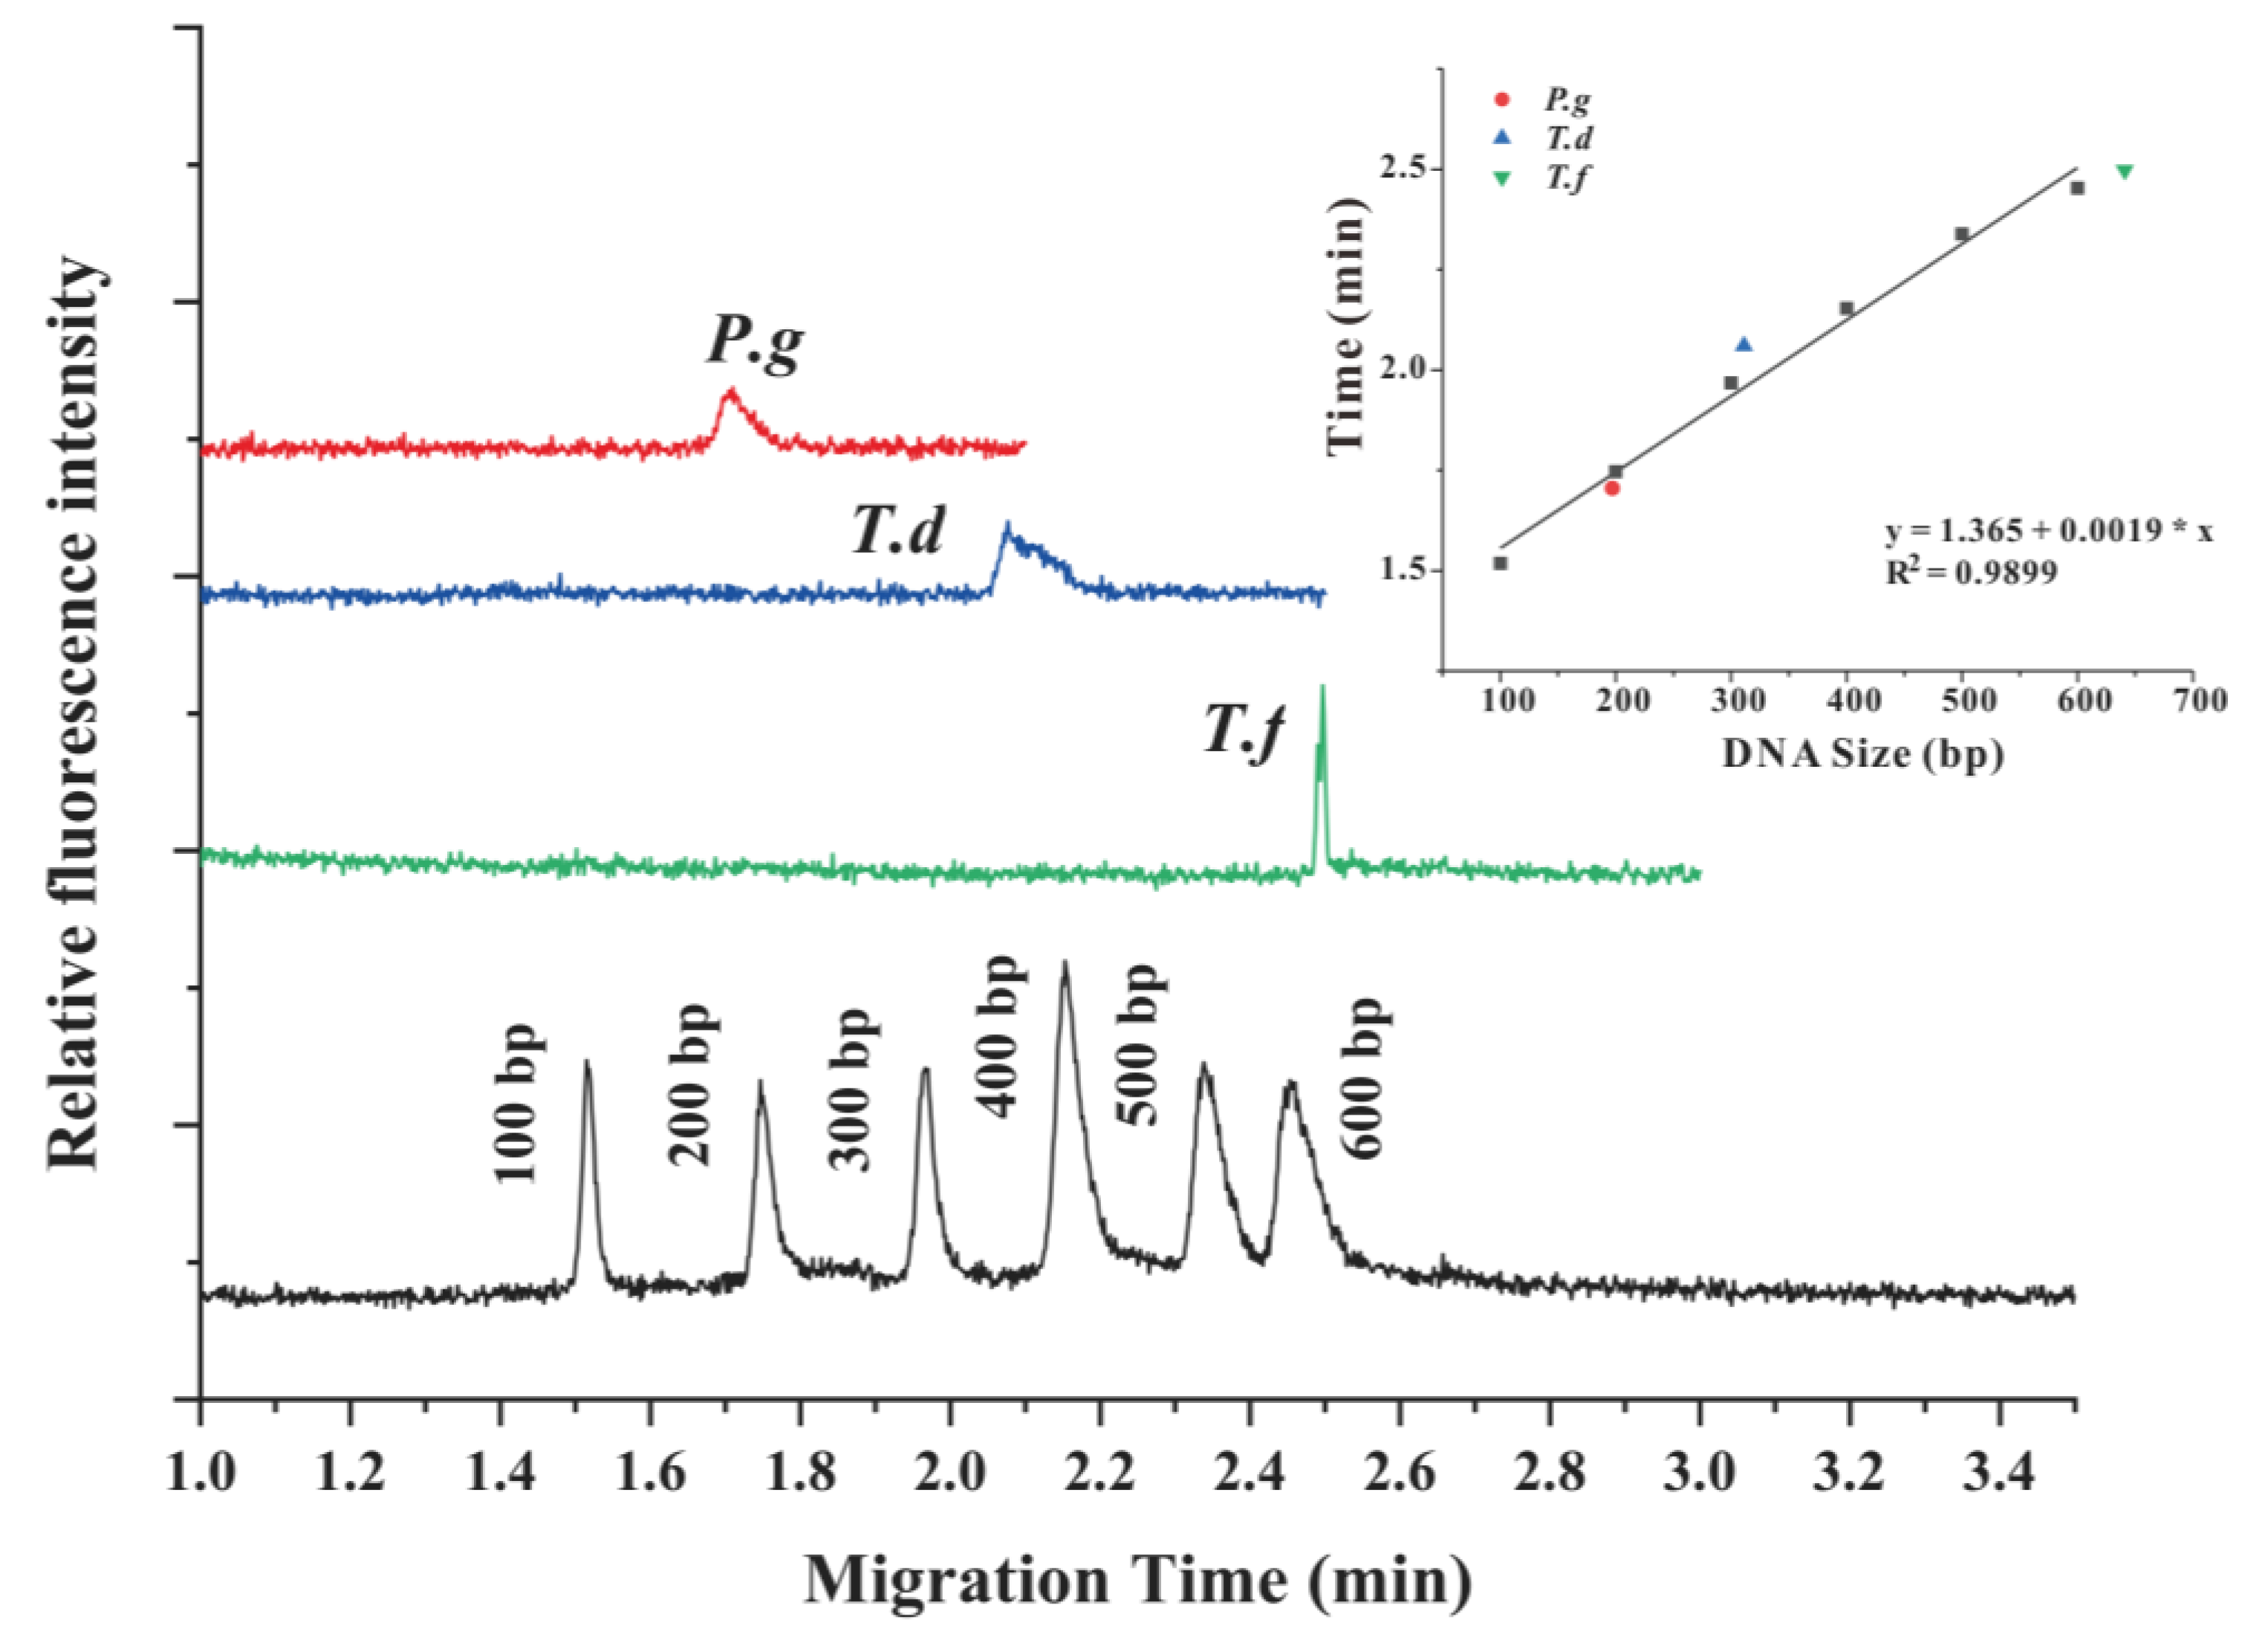
3.4. Amplification of P.g, T.d, and T.f in the CF-PCR-MCE System

Finally, we performed the detection of P.g, Td, and Tf in the CF-PCR-MCE system. First, we connected an injector containing the PCR solution to the inlet of the PCR section of the chip. Next, a 1% HEC buffer solution was injected into the outlet end (d-end) of the MCE section until it filled the entire MCE section. During this process, the inlet and outlet of the PCR section were sealed due to the connection of the injector, which created a seal. As a result, only a small amount of HEC buffer appeared at the outlet of the PCR section due to the pressure effect of the channel during the injection of the HEC buffer solution. Then, the points b, c, and d in the MCE section were sealed, and the temperature control module was activated to reach the PCR temperature. The PCR solution was pumped into the serpentine part and the flow time from the inlet to the outlet of the channels in the PCR section was approximately 505 s. The PCR products finally flowed from the outlet to the point a in the MCE section. By adjusting the voltages at the points a, b, c, and d, we achieved the sample injection and separation of the PCR products in the MCE section. The electrophoretic results of the PCR products were compared with the 100 bp DNA Ladder (Figure 5), and we found that only one clear peak appeared in each of the electropherograms. Furthermore, the migration times of the three product peaks corresponded to the migration times of the 100, 200, 300, 400, 500, and 600 bp bands in the 100 bp DNA ladder (R2 ≈ 0.9899). The present findings demonstrate the successful amplification and expeditious detection of P.g, T.d, and T.f, thereby attesting to the efficacy of the chip utilized in this study.

4. Conclusions

In summary, we have designed an integrated CF-PCR-MCE microfluidic chip that can transport PCR products to the electrophoresis microchannel inside the chip. We have built a system for amplification and detection of periodontal pathogens, simulated the injection and separation conditions, analyzed the effect of coating the microchannel on the resolution during electrophoresis, and analyzed the thermal distribution of the chip on the heating module. Finally, we have successfully amplified and detected P.g, T.d, and T.f in the CF-PCR-MCE system using the integrated chip. The results showed that the amplification of P.g, T.d, and T.f took 505 s, while its detection can be completed within 2′40′’, with the entire experimental time being approximately 11 min. Therefore, CF-PCR-MCE has a significant advantage in speed, and the design of the integrated structure is more convenient. The outcomes of this study can serve as a valuable point of reference towards realizing the goal of integrated point-of-care testing diagnostic platforms.

Author Contributions

Z.L. and Y.Y. designed the research. J.H. and B.Y. finished the data collection. J.H. and B.Y. drafted the manuscript. D.Z., C.T. and Z.L. helped with writing and with analyzing the results. Y.Y. and Z.L. revised the draft and contributed new reagents and analytic tools. All authors have read and agreed to the published version of the manuscript.

Funding

This work was supported by Science and Technology Commission of Shanghai Municipality, China (No. 19ZR1477500), the National Natural Science Foundation of China (No. 81830052), and the Construction Project of Shanghai Key Laboratory of Molecular Imaging (18DZ2260400). We also gratefully acknowledge financial support from University of Shanghai for Science and Technology (No. 2017KJFZ049).

Institutional Review Board Statement

Not applicable.

Informed Consent Statement

Not applicable.

Data Availability Statement

Not applicable.

Conflicts of Interest

The authors declare no conflict of interest.

References

  1. Mullis, K.; Faloona, F.; Scharf, S.; Saiki, R.; Horn, G.; Erlich, H. Specific enzymatic amplification of DNA in vitro: The polymerase chain reaction. Cold Spring Harb. Symp. Quant. Biol. 1986, 51, 263–273. [Google Scholar] [CrossRef] [PubMed]
  2. Kim, H.; Hong, H.; Yoon, S.H. Diagnostic Performance of CT and Reverse Transcriptase Polymerase Chain Reaction for Coronavirus Disease 2019: A Meta-Analysis. Radiology 2020, 296, E145–E155. [Google Scholar] [CrossRef] [PubMed]
  3. Jaafar, R.; Aherfi, S.; Wurtz, N.; Grimaldier, C.; Van Hoang, T.; Colson, P.; Raoult, D.; La Scola, B. Correlation between 3790 quantitative polymerase chain reaction–positives samples and positive cell cultures, including 1941 severe acute respiratory syndrome coronavirus 2 isolates. Clin. Infect. Dis. 2021, 72, e921. [Google Scholar] [CrossRef] [PubMed]
  4. Kopp, M.U.; de Mello, A.J.; Manz, A. Chemical Amplification: Continuous-Flow PCR on a Chip. Science 1998, 280, 1046–1048. [Google Scholar] [CrossRef]
  5. Qi, H.; Wang, X.; Chen, T.; Ma, X.; Zuo, T. Fabrication and characterization of a polymethyl methacrylate continuous-flow PCR microfluidic chip using CO2 laser ablation. Microsyst. Technol. 2009, 15, 1027–1030. [Google Scholar] [CrossRef]
  6. Trinh, K.T.L.; Lee, N.Y. Glass-polytetrafluoroethylene-glass based sandwich microdevice for continuous-flow polymerase chain reaction and its application for fast identification of foodborne pathogens. Talanta 2018, 176, 544–550. [Google Scholar] [CrossRef]
  7. Li, Z.; Ju, R.; Sekine, S.; Zhang, D.; Zhuang, S.; Yamaguchi, Y. All-in-one microfluidic device for on-site diagnosis of pathogens based on an integrated continuous flow PCR and electrophoresis biochip. Lab Chip 2019, 19, 2663–2668. [Google Scholar] [CrossRef]
  8. Li, Z.; Liu, J.; Wang, P.; Tao, C.; Zheng, L.; Sekine, S.; Zhuang, S.; Zhang, D.; Yamaguchi, Y. Multiplex amplification of target genes of periodontal pathogens in continuous flow PCR microfluidic chip. Lab Chip 2021, 21, 3159–3164. [Google Scholar] [CrossRef]
  9. Yang, B.; Wang, P.; Li, Z.; Tao, C.; You, Q.; Sekine, S.; Zhuang, S.; Zhang, D.; Yamaguchi, Y. A continuous flow PCR array microfluidic chip applied for simultaneous amplification of target genes of periodontal pathogens. Lab Chip 2021, 22, 733–737. [Google Scholar] [CrossRef]
  10. Li, Z.; Wang, Y.; Gao, Z.; Sekine, S.; You, Q.; Zhuang, S.; Zhang, D.; Feng, S.; Yamaguchi, Y. Lower fluidic resistance of double-layer droplet continuous flow PCR microfluidic chip for rapid detection of bacteria. Anal. Chim. Acta 2023, 1251, 340995. [Google Scholar] [CrossRef]
  11. Jiang, X.; Shao, N.; Jing, W.; Tao, S.; Liu, S.; Sui, G. Microfluidic chip integrating high throughput continuous-flow PCR and DNA hybridization for bacteria analysis. Talanta 2014, 122, 246–250. [Google Scholar] [CrossRef] [PubMed]
  12. Ou, X.; Chen, P.; Huang, X.; Li, S.; Liu, B. Microfluidic chip electrophoresis for biochemical analysis. J. Sep. Sci. 2019, 43, 258–270. [Google Scholar] [CrossRef] [PubMed]
  13. Alkahtani, S.A.; Alshabi, A.M.; Shaikh, I.A.; Orabi, M.A.A.; Abdel-Wahab, B.A.; Walbi, I.A.; Habeeb, M.S.; Khateeb, M.M.; Shettar, A.K.; Hoskeri, J.H. In Vitro Cytotoxicity and Spectral Analysis-Based Phytochemical Profiling of Methanol Extract of Barleria hochstetteri, and Molecular Mechanisms Underlying Its Apoptosis-Inducing Effect on Breast and Lung Cancer Cell Lines. Separations 2022, 9, 298. [Google Scholar] [CrossRef]
  14. Shimomura-Kuroki, J.; Yamashita, K.; Shimooka, S. Tannerella forsythia and the HLA-DQB1 allele are associated with susceptibility to periodontal disease in Japanese adolescents. Odontology 2009, 97, 32–37. [Google Scholar] [CrossRef]
  15. Zhuang, L.-F.; Watt, R.M.; Mattheos, N.; Si, M.-S.; Lai, H.-C.; Lang, N.P. Periodontal and peri-implant microbiota in patients with healthy and inflamed periodontal and peri-implant tissues. Clin. Oral Implants Res. 2014, 27, 13–21. [Google Scholar] [CrossRef]
  16. Sánchez, M.C.; Llama-Palacios, A.; Fernández, E.; Figuero, E.; Marín, M.J. An in vitro biofilm model associated to dental implants: Structural and quantitative analysis of in vitro biofilm formation on different dental implant surfaces. Dent. Mater. 2014, 30, 1161–1171. [Google Scholar] [CrossRef]
  17. Singh, S. Triple-layer electrodes Dielectrophoretic chip design by Comsol Multiphysics 4.0. J. Integr. Sci. Technol. 2013, 1, 28–29. [Google Scholar]
  18. Barman, U.; Sen, A.K.; Mishra, S.C. Theoretical and numerical investigations of an electroosmotic flow micropump with interdigitated electrodes. Microsyst. Technol. 2013, 20, 157–168. [Google Scholar] [CrossRef]
  19. Baños, R.D.; Arcos, J.C.; Bautista, O.; Méndez, F.; Merchán-Cruz, E.A. Mass transport by an oscillatory electroosmotic flow of power-law fluids in hydrophobic slit microchannels. J. Braz. Soc. Mech. Sci. Eng. 2021, 43, 9. [Google Scholar] [CrossRef]
  20. Farahinia, A.; Jamaati, J.; Niazmand, H. Investigation of slip effects on electroosmotic mixing in heterogeneous microchannels based on entropy index. SN Appl. Sci. 2019, 1, 728. [Google Scholar] [CrossRef]
  21. Kawamata, T.; Yamada, M.; Yasuda, M.; Seki, M. Continuous and precise particle separation by electroosmotic flow control in microfluidic devices. Electrophoresis 2008, 29, 1423–1430. [Google Scholar] [CrossRef] [PubMed]
  22. Cong, Y.; Zhang, L.; Tao, D.; Liang, Y.; Zhang, W.; Zhang, Y. Miniaturized two-dimensional capillary electrophoresis on a microchip for analysis of the tryptic digest of proteins. J. Sep. Sci. 2008, 31, 588–594. [Google Scholar] [CrossRef] [PubMed]
  23. Acunha, T.; Reguera, M.I.; Navarro, R.; Redondo, J.A.; Reinecke, H.; Gallardo, A.; Cifuentes, A. Potential of pro-dendronic polyamines with modulated segmental charge density as novel coating for fast and efficient analysis of peptides and basic proteins by capillary electrophoresis and capillary electrophoresis-mass spectrometry. Electrophoresis 2015, 36, 1564–1571. [Google Scholar] [CrossRef] [PubMed]
  24. Liang, Z.; Lee, H.K.; Lin, B.; Yeung, E.S. Spatial temperature gradient capillary electrophoresis for DNA mutation detection. Electrophoresis 2015, 22, 3683–3687. [Google Scholar]
Figure 1. (A) Schematic and (B) protype showing the CF-PCR-MCE chip and the principle of electrophoresis chip for fluorescence detection; (B) shows the CF-PCR-MCE system.
Separations 10 00271 g001
Figure 2. (A): the stage of sample injection; (BD): the flow state of the sample in the stage of separation.
Separations 10 00271 g002
Figure 3. The fluorescence of DNA banding during electrophoresis in (A) uncoated microchannels and (B) coated microchannels. (C) The electropherogram of 100 bp DNA ladder in the coated and uncoated microchannel.
Separations 10 00271 g003
Figure 4. (A) The temperature distribution of the heating aluminum block; (B) the temperature distribution of the CF-PCR chip after heating on the aluminum block; (C) the temperature distribution of the CF-PCR-MCE chip after heating on the aluminum block for 1 min; (D) the temperature distribution of the CF-PCR-MCE chip after heating on the aluminum block to reach a steady state.
Separations 10 00271 g004
Figure 5. The electropherogram of periodontal pathogens after they were amplified in the CF-PCR-MCE system.
Separations 10 00271 g005
Table 1. The primers of Porphyromonas gingivalis, Treponema denticola, and Tannerela forsythia [14,15,16].
PrimersThe Nucleotide Sequence (5′---3′)AmpliconsBacteria
PG197-FTGTAGATGACTGATGGTGAAAACC197 bpPorphyromonas gingivali
PG197-RACGTCATCCCCACCTTCCTC
TD311-FAAGGCGGTAGAGCCGCTCA311 bpTreponema denticola
TD311-RAGCCGCTGTCGAAAAGCCCA
TF641-FGCGTATGTAACCTGCCCGCA641 bpTannerela forsythia
TF641-RTGCTTCAGTGTCAGTTATACCT
Disclaimer/Publisher’s Note: The statements, opinions and data contained in all publications are solely those of the individual author(s) and contributor(s) and not of MDPI and/or the editor(s). MDPI and/or the editor(s) disclaim responsibility for any injury to people or property resulting from any ideas, methods, instructions or products referred to in the content.

