Article

Zero Liquid Discharge and Resource Treatment of Low-Salinity Mineralized Wastewater Based on Combing Selectrodialysis with Bipolar Membrane Electrodialysis

1
College of Chemical Engineering, Zhejiang University of Technology, Hangzhou 310014, China
2
State Key Laboratory of Water Resource Protection and Utilization in Coal Mining, Beijing 100049, China
3
Department of Chemistry and Chemical Engineering, Yulin University, Yulin 719000, China
*
Author to whom correspondence should be addressed.
Separations 2023, 10(4), 269; https://doi.org/10.3390/separations10040269
Submission received: 17 March 2023 / Revised: 17 April 2023 / Accepted: 17 April 2023 / Published: 21 April 2023
(This article belongs to the Section Materials in Separation Science)

Abstract

:
A large amount of mine water is generated during coal production, which not only damages the surface environment and ecology but also wastes groundwater resources in the mining area, exacerbating regional water scarcity. In this work, a novel zero liquid discharge technology combining selectrodialysis (SED) and bipolar membrane electrodialysis (BMED) was developed for the resourceful treatment of low-salinity mineralized wastewater. The SED stack had demonstrated to be workable for the elimination of multivalent ions. The BMED stack converts brine into acid and base. After SED, a high pure crude salt (~98%) was attained. Furthermore, under the conditions of a current density of 20 mA/cm2, a flow velocity of 20 L/h, and an initial acid/base concentration of 0.10 mol/L, the maximum concentrations of acid and base were found to be 0.75 mol/L and 0.765 mol/L, respectively, for a feed conductivity of 55 mS/cm. The cost of the entire electrodialysis stage was evaluated to be USD 1.38/kg of NaOH. Therefore, this combined UF-RO-SED-BMED process may be an effective strategy for the sustainable treatment of low-salinity mineralized wastewater.

Graphical Abstract

1. Introduction

Nowadays, water scarcity is becoming increasingly serious due to the rapid development of the global population and economy [1]. The western region of China is rich in coal resources but lacks water resources. Most of the mining areas in this region are located in arid and semi-arid regions due to the prevailing climatic conditions, and the available freshwater resources are relatively scarce. However, a significant amount of mine water is generated and discharged during the coal production process to ensure safe mining. This mine water generally contains chloride ions, sulfate ions, calcium and magnesium ions, etc. The direct discharge of mine water not only causes the waste of groundwater resources in the mine area and aggravates the tension of water for living in the area but also pollutes the surface environment and ecology around the mine area. According to statistics, the total water resources of Chinese coal mines were about 6.89 billion m3 in 2018, but the average utilization rate was only 35% [2]. Especially for the northwest region (Xinjiang, Qinghai, Gansu, Ningxia, Inner Mongolia, and Shaanxi), the water resources account for only 5.84% of the total national water resources. Moreover, turbid mine water occupies 60% of the water gushing from key state-owned coal mines in northern China, and highly mineralized mine water accounts for about 30% [3]. Therefore, desalination of mineralized mine water is crucial in solving freshwater shortage and water pollution problems.
To date, most of the miscellaneous mineralized brine and miscellaneous brine concentrated water involved in the industrial wastewater treatment process are treated by evaporation, and some of them are chemically dosed and then resourced. This method requires the consumption of a large number of pharmaceuticals, which is complicated and cumbersome, with great difficulty in controlling the number of pharmaceuticals added, high impact of residual pharmaceuticals on the subsequent treatment, low efficiency of equipment treatment, as well as great difficulty in further separation due to the addition of pharmaceuticals. In recent years, more and more research has been conducted on impurity removal of miscellaneous salt concentrated water and resource treatment of mixed salt solution after impurity removal, but there are still many issues to be solved in the process of brine treatment, such as low impurity removal efficiency, high chemical consumption, poor precision separation of miscellaneous salt and low utilization rate of separated salt. Thus, from the perspective of ecological, environmental protection and resource recovery, the resourceization of mineralized brine is imperative.
ED is typically recognized as a mature membrane separation technology with low energy consumption, low cost, and low pollution, which has been widely used to treat brackish water [4]. Moreover, with the development of membrane technology, some specific functional membranes are gradually matured and commercialized, such as monovalent selective exchange membranes and bipolar membranes. Based on these functional membranes, a series of electrodialysis technologies for specific separation targets have been derived, such as selective electrodialysis and bipolar membrane electrodialysis. Moreover, electromembrane processes have been extensively applied to the separation of waste salts, seawater desalination, and organic acid/base production [5]. Selectrodialysis (SED) applies alternating stacks of monovalent ion exchange membranes (monovalent cation exchange membranes and monovalent anion exchange membranes), which are typically built by separated spacers to form multiple compartments. Driven by electric potential, the ions in the dilution chamber could move via the monovalent ion exchange membrane to the concentration chamber to achieve the separation of divalent ions [6]. Zhang et al. [7] have studied the separation efficiency of monovalent/multivalent anions from RO concentrate by using SED. Moreover, they found that reducing the current density has a positive effect on the separation efficiency of monovalent/polyvalent anions. Nie et al. [8] demonstrated that selectrodialysis (SED) is technically and financially achievable to isolate lithium from salt lake brine with a high Mg/Li ratio. In summary, these investigations have proven that selectrodialysis (SED) is workable and useful for isolating multivalent ions.
Bipolar membrane electrodialysis (BMED) is also often used for the treatment of salt water. It combines traditional electrodialysis with a bipolar membrane and can separate salt water into corresponding acids and bases without adding any chemicals [9]. Water molecules in the bipolar membrane (BM) are dissociated into H+ and OH at both poles of the bipolar membrane. Then, H+ and OH migrate across the bipolar membrane by electric field forces to form the corresponding acid and base solutions [10,11]. Hence, BMED can be used for acid-base production as well as for resource regeneration from the waste stream, thereby reducing or even completely eliminating waste emissions. There are a number of reports on the sustainable production of chemicals based on BMED. For example, Chen et al. [12] reported the production of high-purity LiOH (99.75%) from high-purity Li2SO4 solution by using BMED. Liu et al. [13] achieved the isolation of phenol as well as Na2SO4 from industrial effluents by BMED and transformed inorganic salts to NaOH as well as Na2SO4. Melnikov et al. [14] used a two-stage scheme of bipolar membrane electrodialysis and electrodialysis to prepare concentrated sulfuric acid, achieving a high electrolyte concentration at low energy consumption. There are also reports on the application of BMED for the production of acids and bases from NaCl-rich brines. Du et al. [15] evaluated the economics of HCl and NaOH production from reverse osmosis effluent (brackish reverse osmosis brine) using the BMED process. Sanhita et al. [16] covered the utilization of nano-filtered SWRO brine for BMED to minimize the interaction of divalent cations to produce pure HCl and NaOH. Nevertheless, almost all research has concentrated on synthetic solutions and seawater reverse osmosis saline water, and there is no organized research for resource treatment of low-salinity mineralized brine or wastewater through the BMED process.
Therefore, in this study, a combined technology consisting of UF, RO, SED, and BMED is proposed for the concentration and purification of low-salinity mineralized wastewater, as well as for the production of acids and bases. The UF + RO filters and concentrates the wastewater, while SED achieves the separation of single and multivalent cations in the concentrated wastewater. Finally, bipolar membrane electrodialysis converts the purified brine into the corresponding acids and bases, with the aim of achieving zero liquid discharge and resourceful treatment. The optimum operating parameters for the entire process, including initial salt content, current density, flow rate, and initial HCl and NaOH content, were systematically studied. As seen in Figure 1, the low-salinity mineralized wastewater was primarily pretreated through ultrafiltration (UF) to remove insoluble impurities such as colloids and suspended particles from the water. Next, the UF output water was enriched by reverse osmosis (RO) procedure, and a large amount of purified water obtained can be used for operation water in the electrodialysis process and cleaning of membrane stack. In order to remove Mg2+ and Ca2+ from the wastewater to obtain a high-purity salt-containing solution, a selective electrodialysis (SED) process was used to treat the solution. The SED concentrate solution with enriched Na2SO4/NaCl was utilized in the BMED procedure to recover NaOH as well as H2SO4/HCl. In addition, the SED dilution was treated by the RO process again, and the concentrated solution enriched with Mg2+ and Ca2+ can be precipitated by recovered NaOH. The recovered acid can be used for cleaning coal in the mining area. Subsequently, the effect of initial salt content, current density, flow rate, and initial acid and alkali content in the BMED process were studied. A small amount of alkali and mixed acid were also used to adjust the pH and cleaning ultrafiltration device, RO device.

2. Experimental

2.1. Materials

Hollow fiber ultrafiltration membrane was purchased from ZUANXIN, Guangdong, China. The RO membrane for the RO unit was purchased from Vontron Technology Co., Ltd., Guizhou, China. Cation exchange membrane (membrane type: CAM) and anion exchange membrane (membrane type: AAM) were purchased from LANRAN, Hangzhou, China. Monovalent-selective ion-exchange membrane (membrane type: CSO) and bipolar membrane (membrane type: BPM) were from ASTOM (Tokyo, Japan). The main properties of the commercial membranes are given in Table 1. All reagents utilized for the experiment (such as HCl, KCl, Na2SO4, MgSO4, NaCl, CaCl2, NaOH, and Na2SO4) were of analytical grade. The low-salinity mineralized wastewater was collected from a coal mine in western China (conductivity, 3 mS/cm; total dissolved solids (TDS), 20.27 mg/L). The composition of the mineralized wastewater is presented in Table 2.

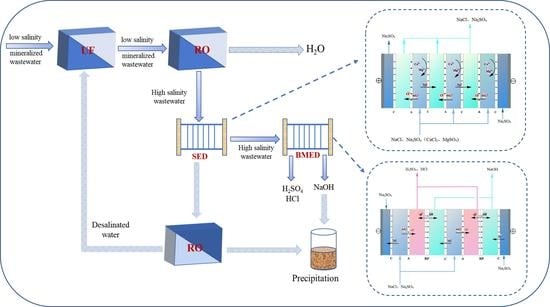
2.2. Pretreatment of Low-Salinity Mineralized Wastewater through UF + RO and UF + ED

To prevent membrane fouling from insoluble particles and potential damage to the experimental device in subsequent experiments, the raw low-salinity mineralized wastewater underwent ultrafiltration to remove impurities such as colloids and suspended particles. To further concentrate the low-salinity mineralized wastewater after ultrafiltration, two different concentration processes, electrodialysis (ED) and reverse osmosis (RO) were utilized. The RO process was operated at a pressure of 2.10 MPa, with a raw material liquid volume of 16.1 L, and was able to concentrate the solution to 36.34 mS/cm after 36.34 min. Three-stage ED was used to concentrate the raw material solution to three different concentrations (35 ± 2 mS/cm, 55 ± 2 mS/cm, 75 ± 2 mS/cm). The study investigated the effects of concentration factor, energy consumption, and water transport and compared the applicability of RO and ED based on concentration factor and energy consumption. The large amount of purified water produced in this process can be used for the electrodialysis process and for cleaning or transporting the membrane stack. Table 3 shows the composition of the concentrated solutions obtained from the different processes.

2.3. Apparatus and Experimental Procedures

To prevent the occurrence of membrane fouling induced by insoluble impurities such as colloids and suspended particles in the feed solution, a pretreatment process of UF was carried out in this study. Polyvinylidene fluoride ultrafiltration membrane with a filtration pore size of 10–100 nm was used for ultrafiltration. The brackish water, after ultrafiltration, was introduced into the reverse osmosis device. The RO device was cycled with 3% hydrochloric acid for 20 min prior to the start of the experiment, then cycled with deionized water. The mixed brine was enriched into the concentration cell under a pressure of 30 bar. The clean water of the reverse osmosis process can be applied to the electrodialysis procedure as well as to the membrane stack cleaning.
The diagram of the BMED and SED stack is shown in Figure 2. The SED stack contained mainly three replicated cells, each consisting of an anion exchange membrane and a monovalent cation exchange membrane in series (effective area of 187.2 cm2). Furthermore, Adjacent membranes are divided by a 0.7 mm spacer. Every unit was separated into an electrode chamber, a dilution chamber, and a concentration chamber. Electrode chamber was fed with 3% Na2SO4 solution, and dilution chambers and concentration chambers were fed with reverse osmosis concentrate and deionized water. Similarly, the BMED stack contained mainly four replicated cells, each consisting of a BPM, AEM, and a CEM connected in series (effective area of 187.2 cm2). Formation of feed chamber, acid chamber, and base chamber are between two adjacent membranes. A 3% Na2SO4 solution was used for the electrode chamber, brine solution from the concentration chamber of the SED was used for the feed chamber, and deionized water was used for the base and acid chambers. These membranes are divided by a 0.7 mm spacer. The volume of each compartment is 1 L. In addition, the solution rate in all chambers is set to 20 L/h. Before the experiment, the liquid in every chamber was cycled for roughly 20 min to get rid of bubbles on the membrane surface. In particular, the ED stack and BMED stack were both operated by adopting batch mode.

2.4. Analytical Methods

The solution conductivity was analyzed by a conductivity meter. The concentrations of Na+, K+, Ca2+, Mg2+, SO42−, and Cl were measured by ICP-MS, respectively. The content of major cations during the experiment was determined by ion chromatography. The concentration of OH- was measured by titration with methyl orange as an indicator. The concentration of H+ was measured by titration utilizing phenolphthalein as an indicator.

2.5. Data Analysis

The current efficiency η (%) was defined as Equation (1) [17].
η = Z ( C t V t C 0 V 0 ) N I t × 100 %
Here, C0 and Ct (mol/L) are the concentration of Na2SO4 or NaOH at time 0 and t, respectively; V0 and Vt (L) are the solution volume in the concentrate tank or base tank at time 0 and t, respectively; F = 96,485 C/mol; N is the number of cell pairs (SED, N = 3, BMED, N = 4); I (A) is the current applied.
The energy consumption E (kWh/m3) can be defined as Equation (2).
E = 0 t U t I d t C t V t M
where Ut (V) is the membrane stack voltage at time t; Ct (mol/L) and Vt (L) express the NaOH content and the solution volume at time t in the base chamber, respectively; M is the molar mass of NaOH (40 g/mol).
The water transport (WT, %) and water recovery rate R (%) were defined as Equations (3) and (4) [18].
W T = V 0 V t V 0
R = 1 W T
where V0 and Vt (L) represent the solution volume in the dilute chamber at time 0 and t, respectively.
The separation effects of Na+/Mg2+ and Na+/Ca2+ were evaluated by “separation coefficient” (SNa/i) of Nie et al. [19].
S N a / i = C ( N a + ) c C ( i ) D . 0 C ( N a + ) D . 0 C ( i ) c
where C(Na+)C (mg/L) means the eventual content of Na+ in the concentrate compartment; C(Na+)D,0 (mg/L) represents the initial concentration of Na+ in the dilute compartment; C(i)C (mg/L) is the final content of i ions (Mg2+ as well as Ca2+) in the concentrate chamber; C(i)D,0 (mg/L) is the initial concentration of i ions in the dilute compartment.

3. Results and Discussion

3.1. Three-Stage ED Process for Salt Concentration

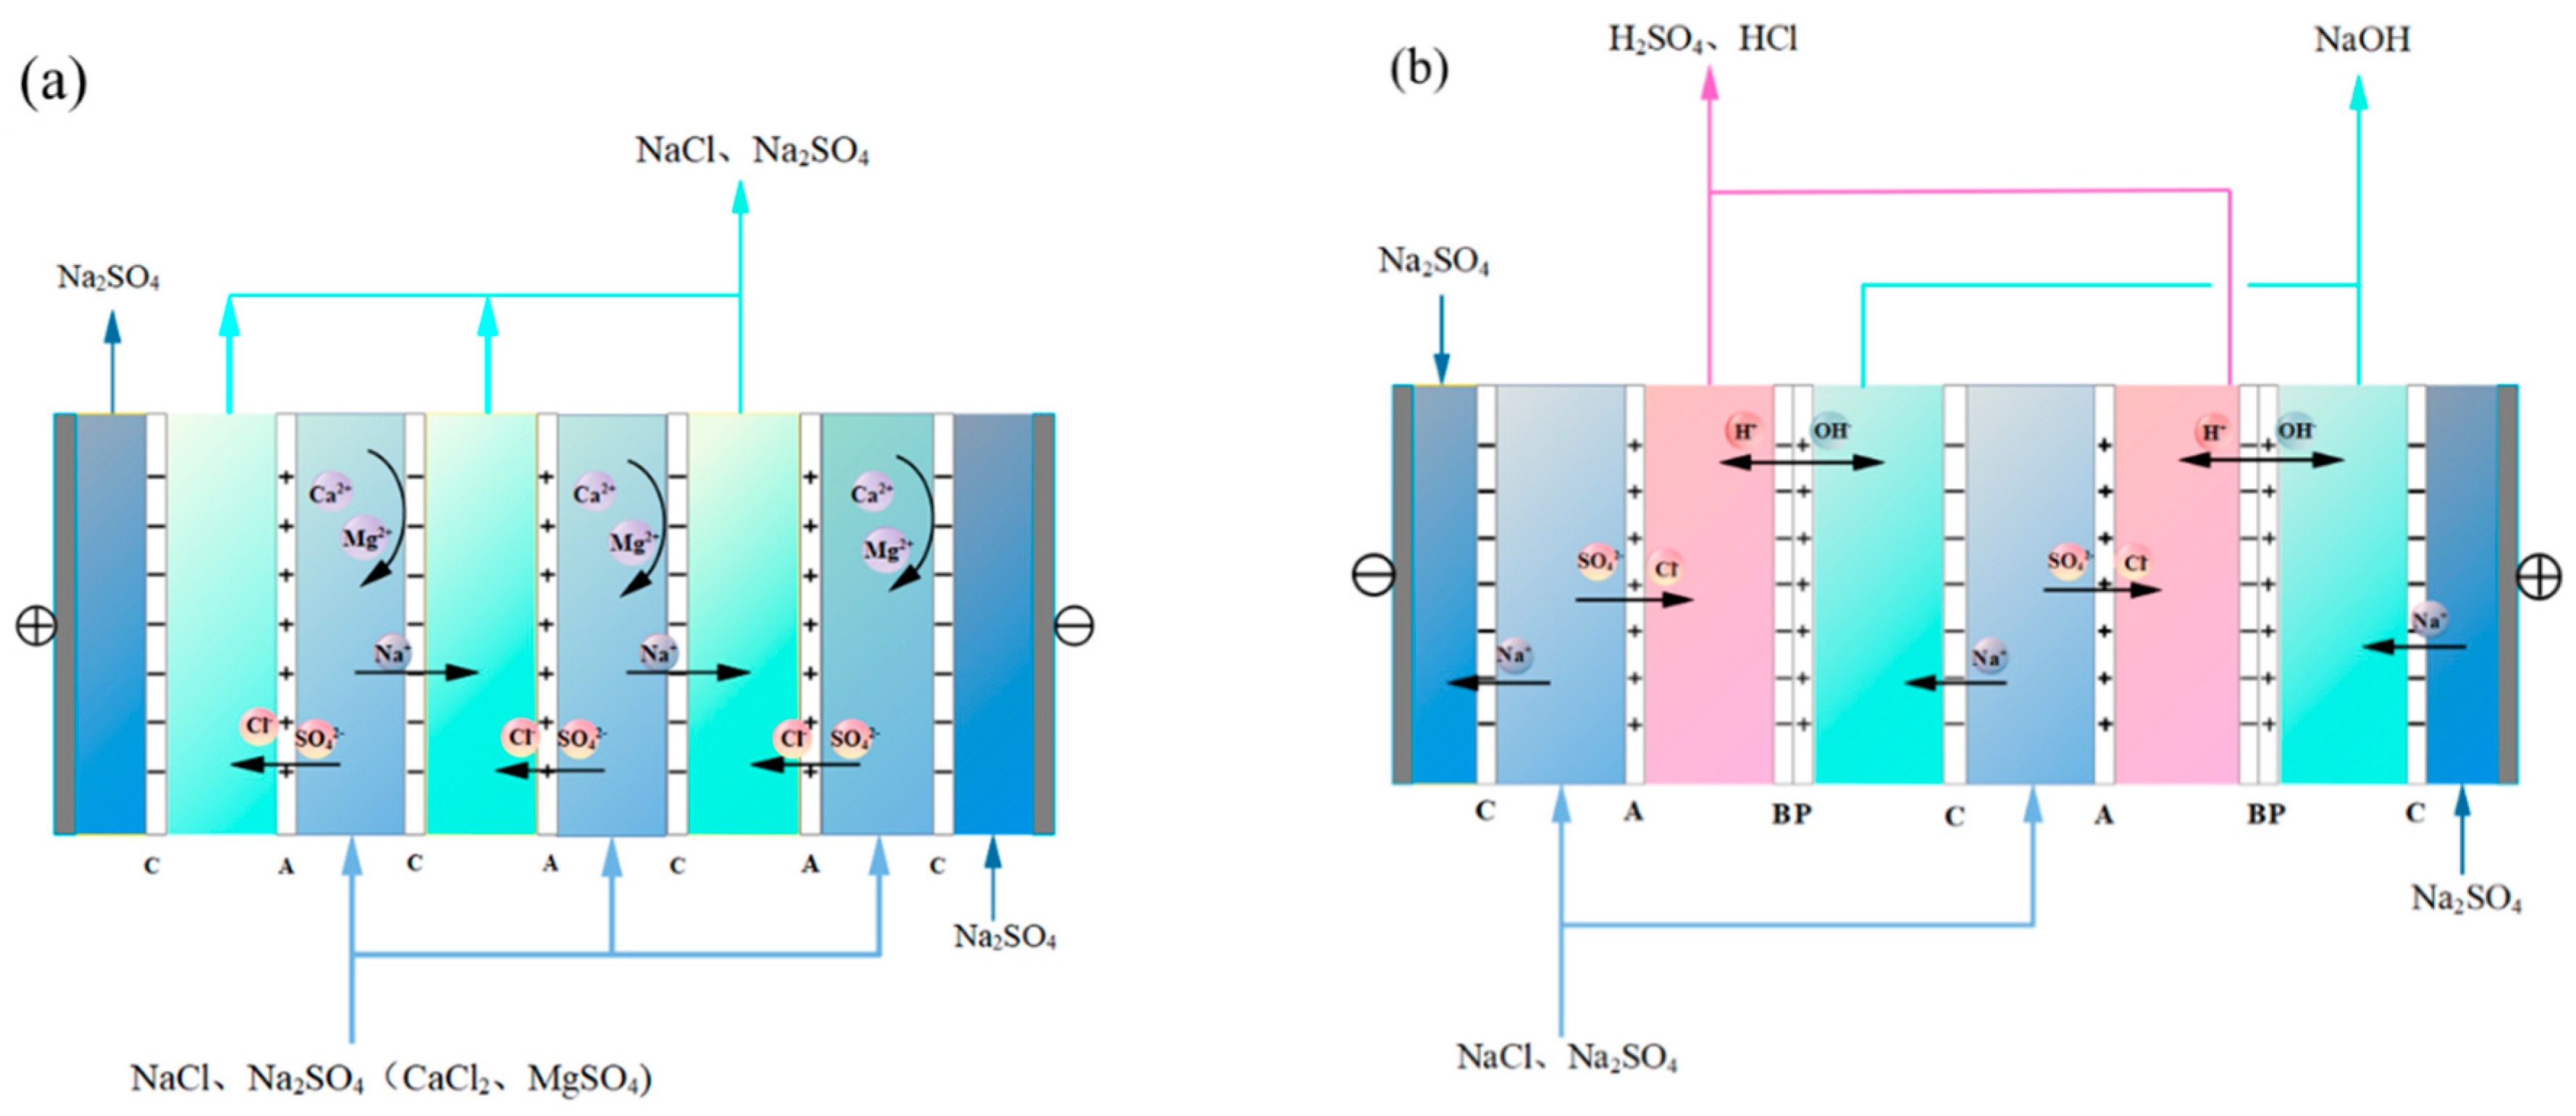
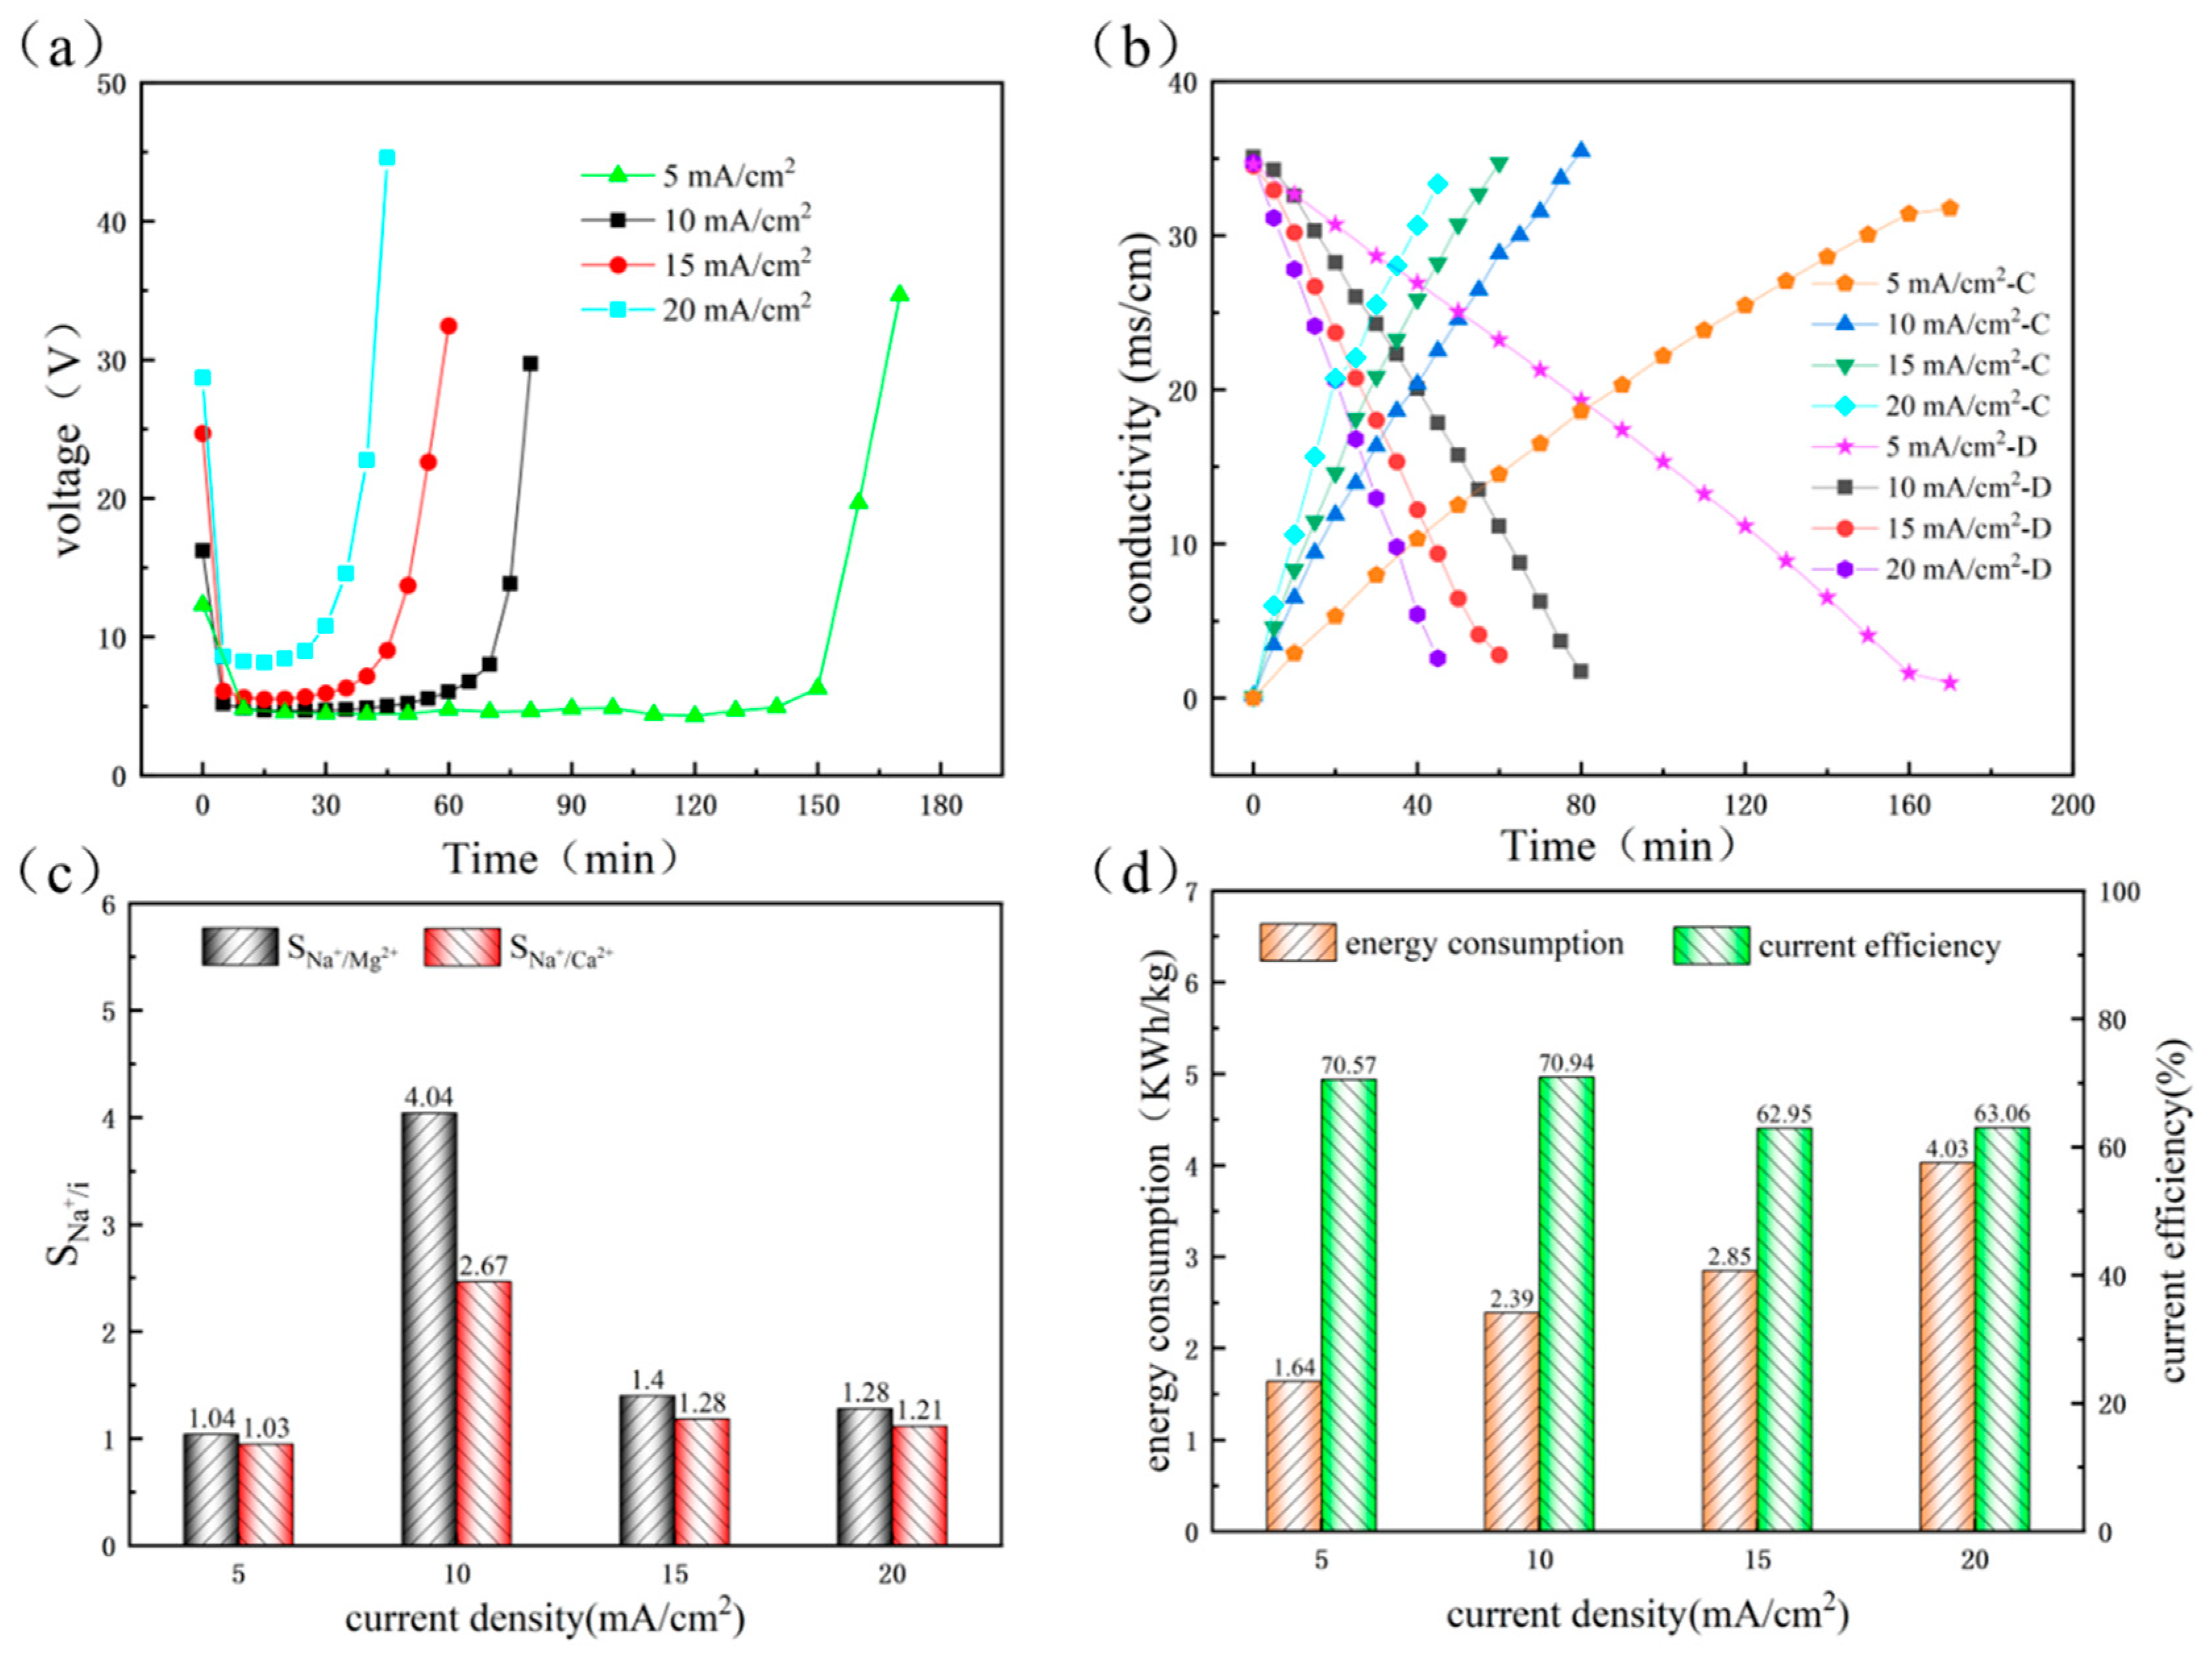
3.1.1. The Influence of Current Density in First-Stage ED Process

In this section, The ED concentration process was carried out at different current densities (5, 10, and 15 mA/cm2), and 10 L of wastewater was added to the dilution chamber. Then, 400 mL of deionized water was added to the concentration chamber. When the conductivity of the dilute solution was reduced to 1 mS/cm, the experiment terminated. The conductivity of the concentrated solution would reach 35 mS/cm (TDS, 32.13 g/L). Figure 3a demonstrates the time evolution of stack voltage during ED at different current densities. It could be observed that the voltage drop increased with the increase of current density during the whole experiment, which conformed to Ohm’s law. At the same time, the desalination time decreased with the increase of current density during the whole experiment. Because the driving force for ion migration during electrodialysis was the electric field force, the higher the voltage, the faster the ion migration rate. Additionally, the concentrate conductivity curves considerably rose as the current density raised, as can be seen in Figure 3b. As the experiment proceeded, the voltage of the membrane stack increased rapidly, which was attributed to the migration of the massive ions from the dilute chamber to the neighboring chamber, and the resistance of the dilute chamber increased.
Figure 3c illustrates the influence of current density on the concentration factor and water transport. It could be noticed that the concentration factor remained consistent at various current densities. However, it is worth noting that water transport was influenced remarkably. Water transfer decreased with an increment of the current density. This occurrence is caused by the electro-osmosis and duration of the experiment. Because high current density can reduce the operation time, thereby reducing the transport of water [18]. As shown in Figure 3d, energy consumption increased with the increment of current density. This phenomenon suggested that more energy will be spent to enhance ion migration with higher current density [20].

3.1.2. The Influence of Current Density in Second-Stage and Third-Stage ED Process

Owing to the restriction of the first-stage ED mode, the second and third-stage ED processes were added to improve the concentration further. In this section, the initial volume of the second-stage ED concentrated solution was chosen to be 200 mL (the same as the third-stage ED), and the volume of the dilute solution changed from 10 L to 600 mL. The initial volume of the third-stage ED dilute solution was 400 mL. Figure 4a shows the effect of different current densities on the voltage drop of the membrane stack during the secondary ED concentration. The voltage drop remained stable for a period of time and finally increased. Furthermore, the concentration conductivity curve increased significantly with increasing current density, as shown in Figure 4b. Meanwhile, due to the high concentration gradient between adjacent chambers, the conductivity of the concentrate solution rises slowly in the later stage of the experiment. Finally, the conductivity of the concentrated solution in the second stage ED process reaches 55.23 mS/cm (TDS, 51.77 g/L).
Figure 4c shows the changes in concentration factor and water transport at different current densities. Maximum water transport of 83.6% was found at 15 mA/cm2 and above 10 mA/cm2. Higher current densities led to higher voltages. A serious electro-osmosis was observed at a higher voltage drop. Nevertheless, the water transport exhibited a lesser figure of 79.5% when the current density rose to 20 mA/cm2. This phenomenon can be interpreted as increasing the voltage shortening and the permeation manipulation time in the latter phase of the experiment [21]. As shown in Figure 4d, the current efficiency values were similar at different current densities; the same trend was observed for energy consumption as in Section 3.1.1.
The performance of the three-stage ED is shown in Table 4. Compared with the conductivity of the concentrated solution process of 55.23 mS/cm in the second stage ED, the third stage ED process reached higher conductivity of 74.63 mS/cm (TDS, 75.58 g/L). Furthermore, the concentration factors and water transport changes in the third stage also exhibited the same trends as the first-stage and the second-stage ED. The concentration factor value was lower than the previous ED processes due to the reduced solution volume in the dilution chamber. Meanwhile, the current efficiency values were similar for different current densities, but the energy consumption in this section was significantly higher than in the two previous stages (including first-stage and second-stage ED). One potential explanation was that the processing time became longer under a higher saline concentration and thus increased the energy consumption. Meanwhile, water transfer and back diffusion not only limited the final concentration but also increased the energy consumption of the whole process.

3.1.3. Performance of RO and ED

In order to compare the concentration of RO and ED, RO was introduced to concentrate brackish water. In the whole experiment, the pressure of the RO device was set to 2.2 MPa, and the feed flow rate was set to 120 L/h. Considering the operating pressure of the RO device and the limitation of water tank capacity, the feed was concentrated to a conductivity value similar to that of the first-stage electrodialysis. The energy consumption and concentration factor of RO and the first-stage ED concentration process are listed in Table 5. The findings indicated that the total energy consumption of the RO process was much lower than that of the ED process. In addition, Qiu et al. [22] concentrated brine from 17.87 mS/cm to 50 mS/cm (similar to the conductivity of second-stage ED), consuming only 7.81 kWh/m3. Christian D. et al. [23] used osmosis-assisted reverse osmosis to recover 72% and 44% of freshwater from feed solutions with salinity of 35 g/L and 70 g/L, respectively. Both cases resulted in the same final brine concentration of 125 g/L with an average energy consumption of about 4 kWh/m3 and 6.37 kWh/m3. Fane et al. [24] mentioned that the overall energy consumption of modern SWRO desalination plants lies in the range of 3.0 kWh/m3 to 3.5 kWh/m3. Although the actual energy consumption was much higher than the minimum energy consumption in the actual process [25] (at least twice as much), both were much lower than the energy consumption in the ED process in this experiment.
It is certain that RO can be a more effective isolation method than traditional ED for the preconcentration of wastewater in terms of specific energy consumption. Meanwhile, it is reported that ED is a major advantage for achieving high salt water concentration (total dissolved solids, TDS, 150–200 g/L). Therefore, the appropriate single or coupled process can be selected according to the actual needs of practical operation. In this experiment, the RO process was selected as the preconcentration of wastewater.

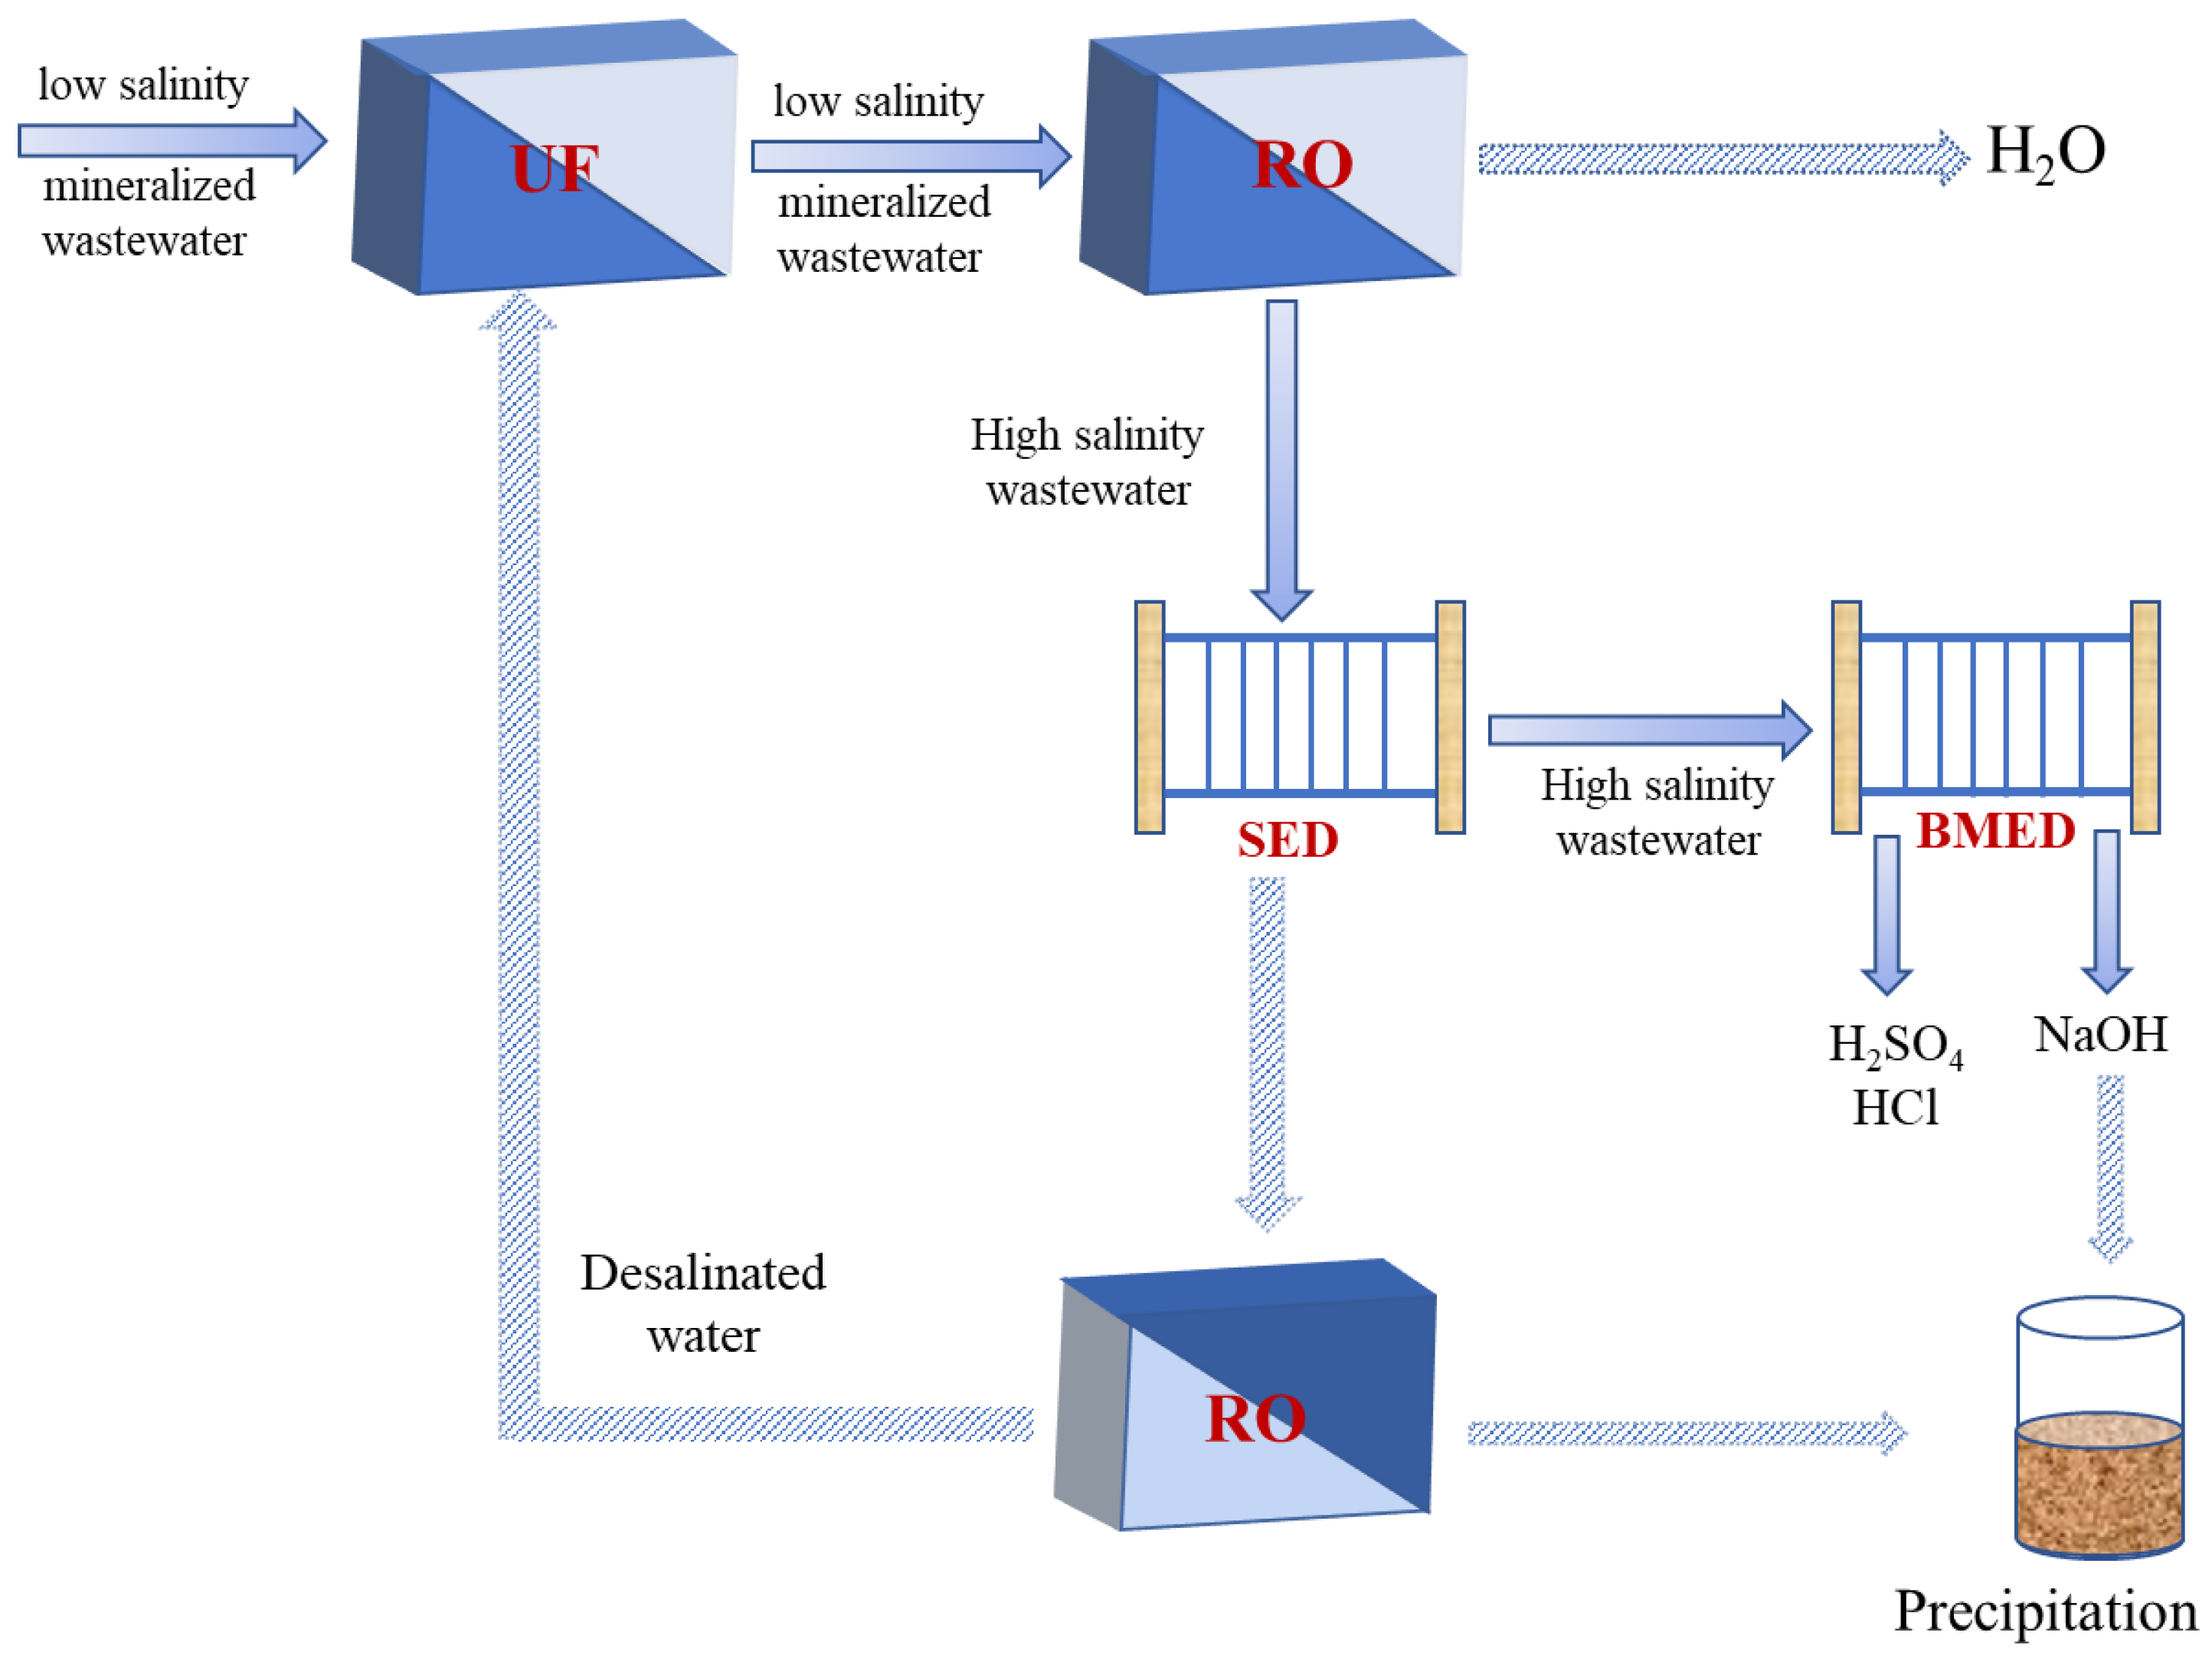
3.2. Purification of Concentrate Wastewater through SED Process

Selective electrodialysis experiments were performed on the feed solution at different current densities. The components of the concentrated solution after SED are shown in Table 6. Figure 5a demonstrates the effect of current density on the SED stack, where the voltage drops first, then is kept steady, and rises as time passes. This is in accordance with Ohm’s Law. After the experiment began, the ions entered the concentration chamber through the membrane, resulting in a decrease in voltage. Later on, the voltage of the SED stack reached a stable phase during the middle stage, and this presented that the resistance of the device remained essentially the same. However, as plenty of ions in the feed chamber migrated to the neighboring chamber, the resistance of the feed chamber became a major factor in the resistance of the stack; as a result, there was a rapid increase in the resistance of the feed chamber. The ion migration rate increased with increasing current density, which was attributed to the high electric field driving force at high current density, resulting in a rapid decrease in salt concentration in the diluent chamber [26] (Figure 5b).
Figure 5c illustrates a comprehensive comparison of separation efficiency by the permselectivity index SNa/i. The separation effect shows a trend of increasing and then decreasing. The voltage drop across the membrane stack increases with the increase of current density. High voltage will change the permeability of the monovalent ion exchange membrane and decrease the selectivity of the monovalent ion exchange membrane, while low voltage will prolong the experiment time and increase the permeation of multivalent ions. Thus, when the current density was 10 mA/cm2, the highest SNa/Mg and SNa/Ca were observed to be 4.04 and 2.67, respectively. This indicated that the lower current density could effectively isolate Mg2+ and Ca2+. Meanwhile, Na+/Ca2+ exhibited a higher separation coefficient than Na+/Mg2+, which was due to the higher hydrated ionic radius of Mg2+. Figure 5d shows the energy consumption and current efficiency of the SED membrane stack for different current densities. The current efficiency results showed an apparent maximum when the current density of the ED stack was 10 mA/cm2. It may be observed that the energy consumption improves as higher current density and more energy are available to overcome the stack resistance [8].

3.3. Production of High Purity Acid and Alkali with BMED

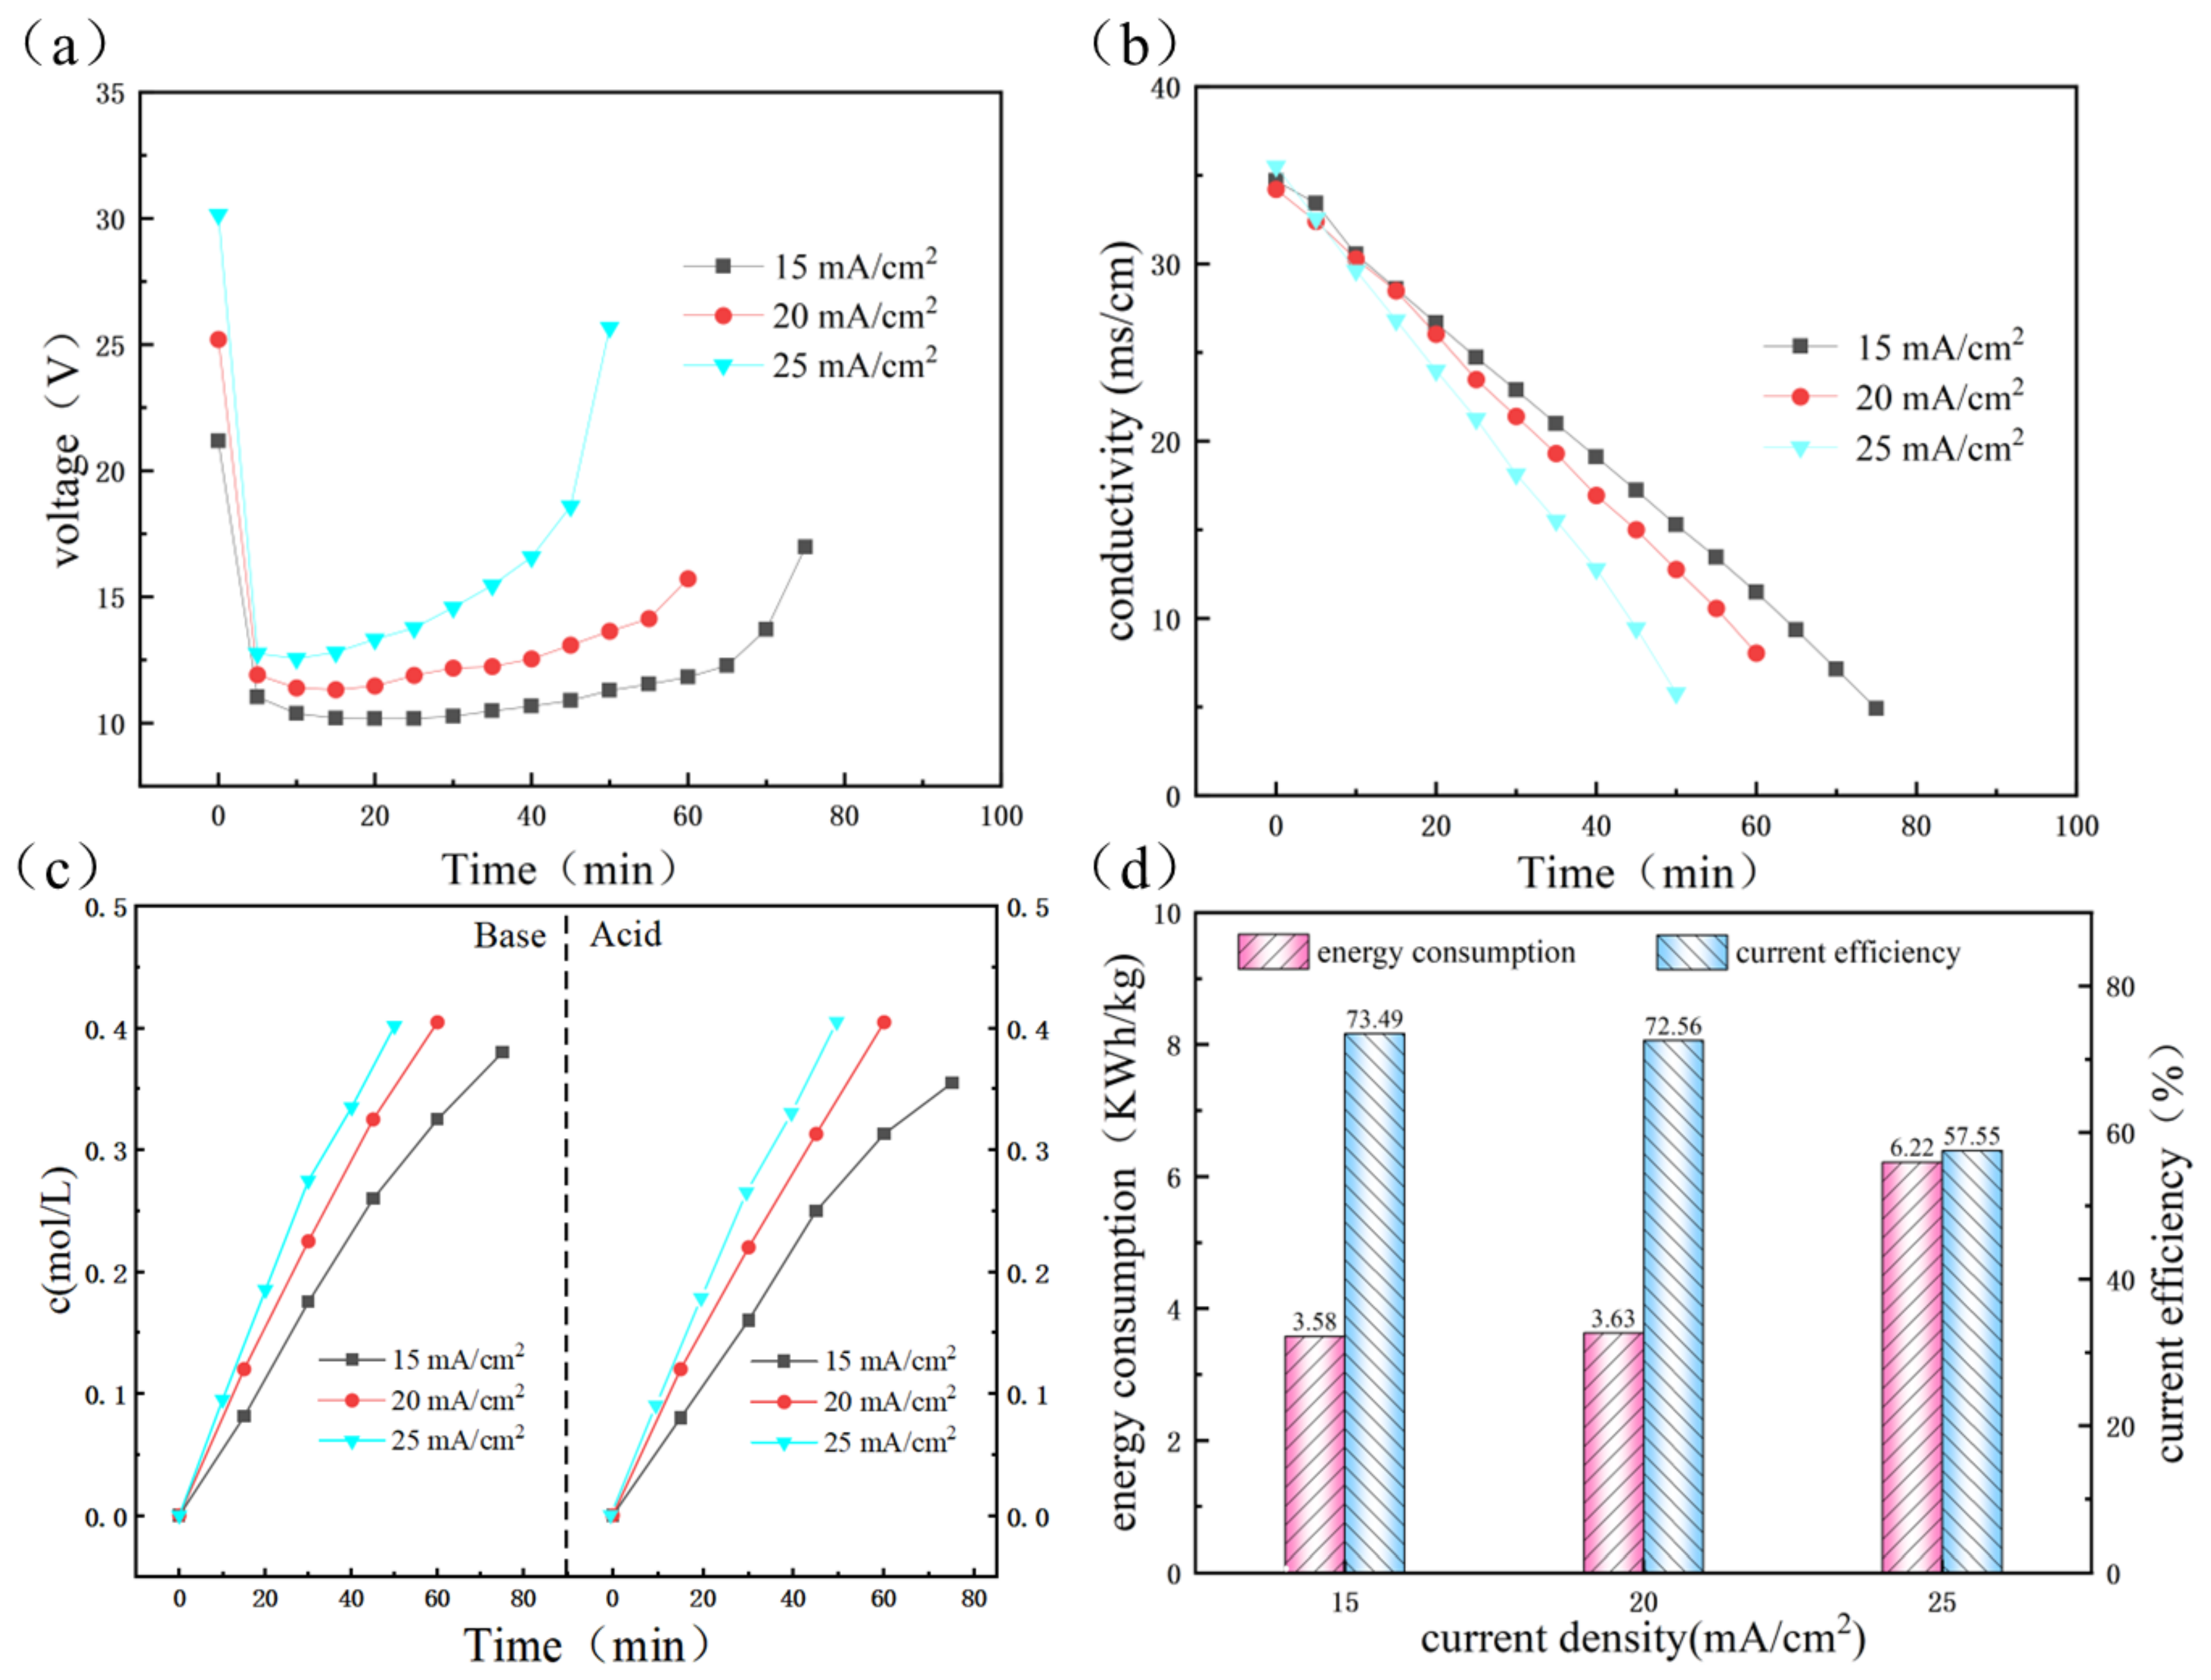
3.3.1. The Effect of Current Density

Current density is the main factor affecting the performance of BMED. Many researches have shown that the formation rates of H+ and OH at the interface of BPM are strongly reliant on the current density acting on these membranes. The influence of current density on stack voltage over time is shown in Figure 6a. The membrane stack voltage increased with the increase of current density. Additionally, desalting time reduced as current density increased (see Figure 6b). Since the BMED process was driven by the electric field, when the voltage applied on both sides of the membrane stack was higher, the migration rate of ions was faster under a high driving force [26]. Additionally, as time passed, the voltage dropped, steadied, and finally rose. The ions migrated from the liquid chamber to the alkali chamber and the acid chamber under electric field force. Meanwhile, the generation of acid and alkali led to the reduction of BMED stacking resistance, which led to a decrease in voltage. However, the voltage of BMED stack rose rapidly in the later stages of the experiment due to the migration of plenty of ions. Excessive voltage could lead to overheating of the membrane stack, thermal energy, and high temperature could destroy the device. Therefore, it is necessary to reasonably control the desalination endpoint [27]. In this experiment, when the conductivity in the feed chamber decreased lower than 6 mS/cm, the desalination was ended.
The final concentrations of acid and base increased slightly with increasing current density, as displayed in Figure 6c. This is due to the second Wien effect so that the water dissociation is speeded up at the BPM interface with high membrane stack voltage [28,29]. In addition, although high current density increased the driving force and the rate of water splitting, more severe ions leakage also caused lower current efficiency in the BMED process [30] (see Figure 6d). On the contrary, energy consumption is inversely proportional to current efficiency because more energy is consumed to convert to Joule heating at high current densities. In this experiment, 20 mA/cm2 was considered an appropriate condition for the BMED process.

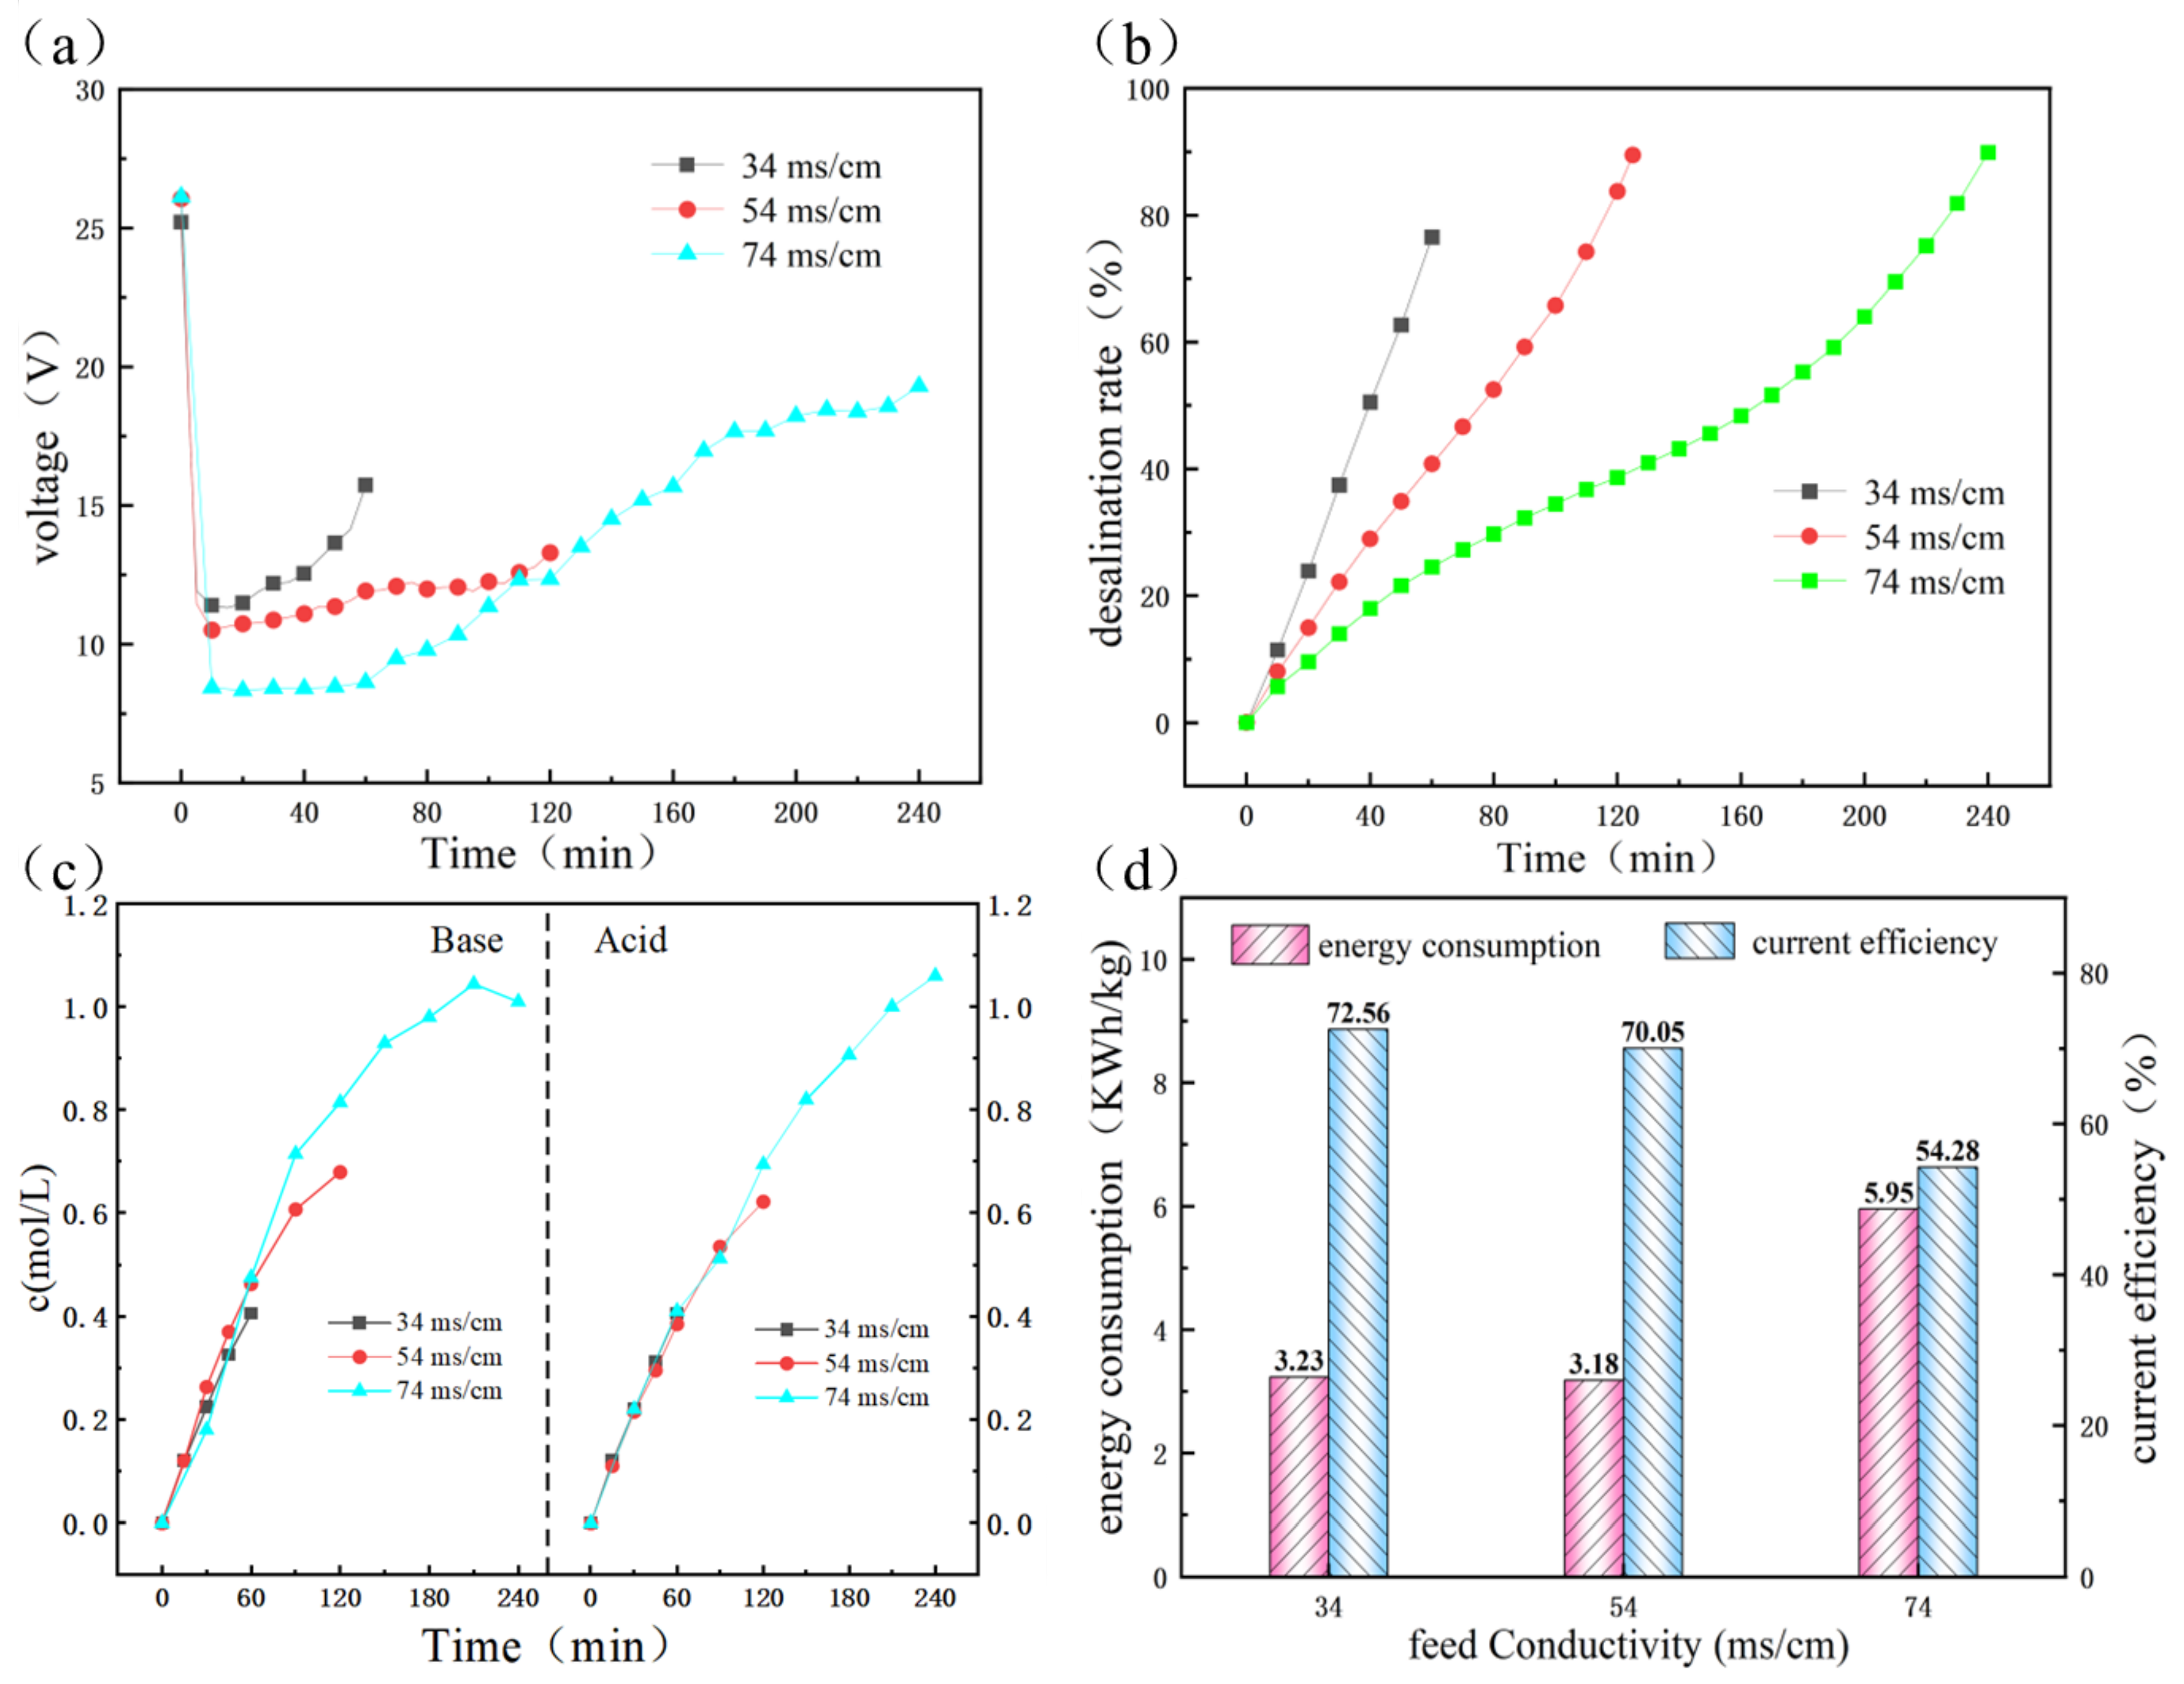
3.3.2. Effect of Initial Salt Concentration

Figure 7 presents the influence of the feed conductivity on the BMED system. The membrane stack voltage showed the same trend as in the previous section. The membrane stack voltage decreased with increasing initial feed conductivity (see Figure 7a). The high ion content led to the lower resistance of the membrane stack. Longer operating time was also required (see Figure 7b). In addition, a steady current density implies a constant velocity of water dissociation, and this results in a steady velocity of H+ and OH generation [31]. Furthermore, as shown in Figure 7c, the growth of acid and alkaline concentrations slowed down in the final stage. This is explained by the fact that the concentration gradient hinders the migration behavior of ions, thus weakening the mass transfer process during bipolar membrane electrodialysis [32], as well as the migration of a minimal amount of ions returned to the feed chamber from acid and base chambers. This was also the reason why the final concentration of alkali decreased slightly in the later stages.
As shown in Figure 7d, it can be observed that the current efficiency declined with an increase in initial salt content. The high ion content prolonged the operation time. The reverse migration of ions caused by the diffusion of concentration gradients also accumulates constantly as time extends. At the same time, the high osmotic pressure on the bipolar membrane restricted the decomposition of water into H+ and OH [32]. Figure 7d indicates that the energy consumption decreased when the feed conductivity increased from 34 mS/cm to 54 mS/cm, resulting from the decrease of membrane stack resistance. When the feed conductivity continued to increase to 74 mS/cm, The large number of salt ions prolonged the duration of the experiment; thus, more electrical energy was spent on Joule heating of the BMED stack.

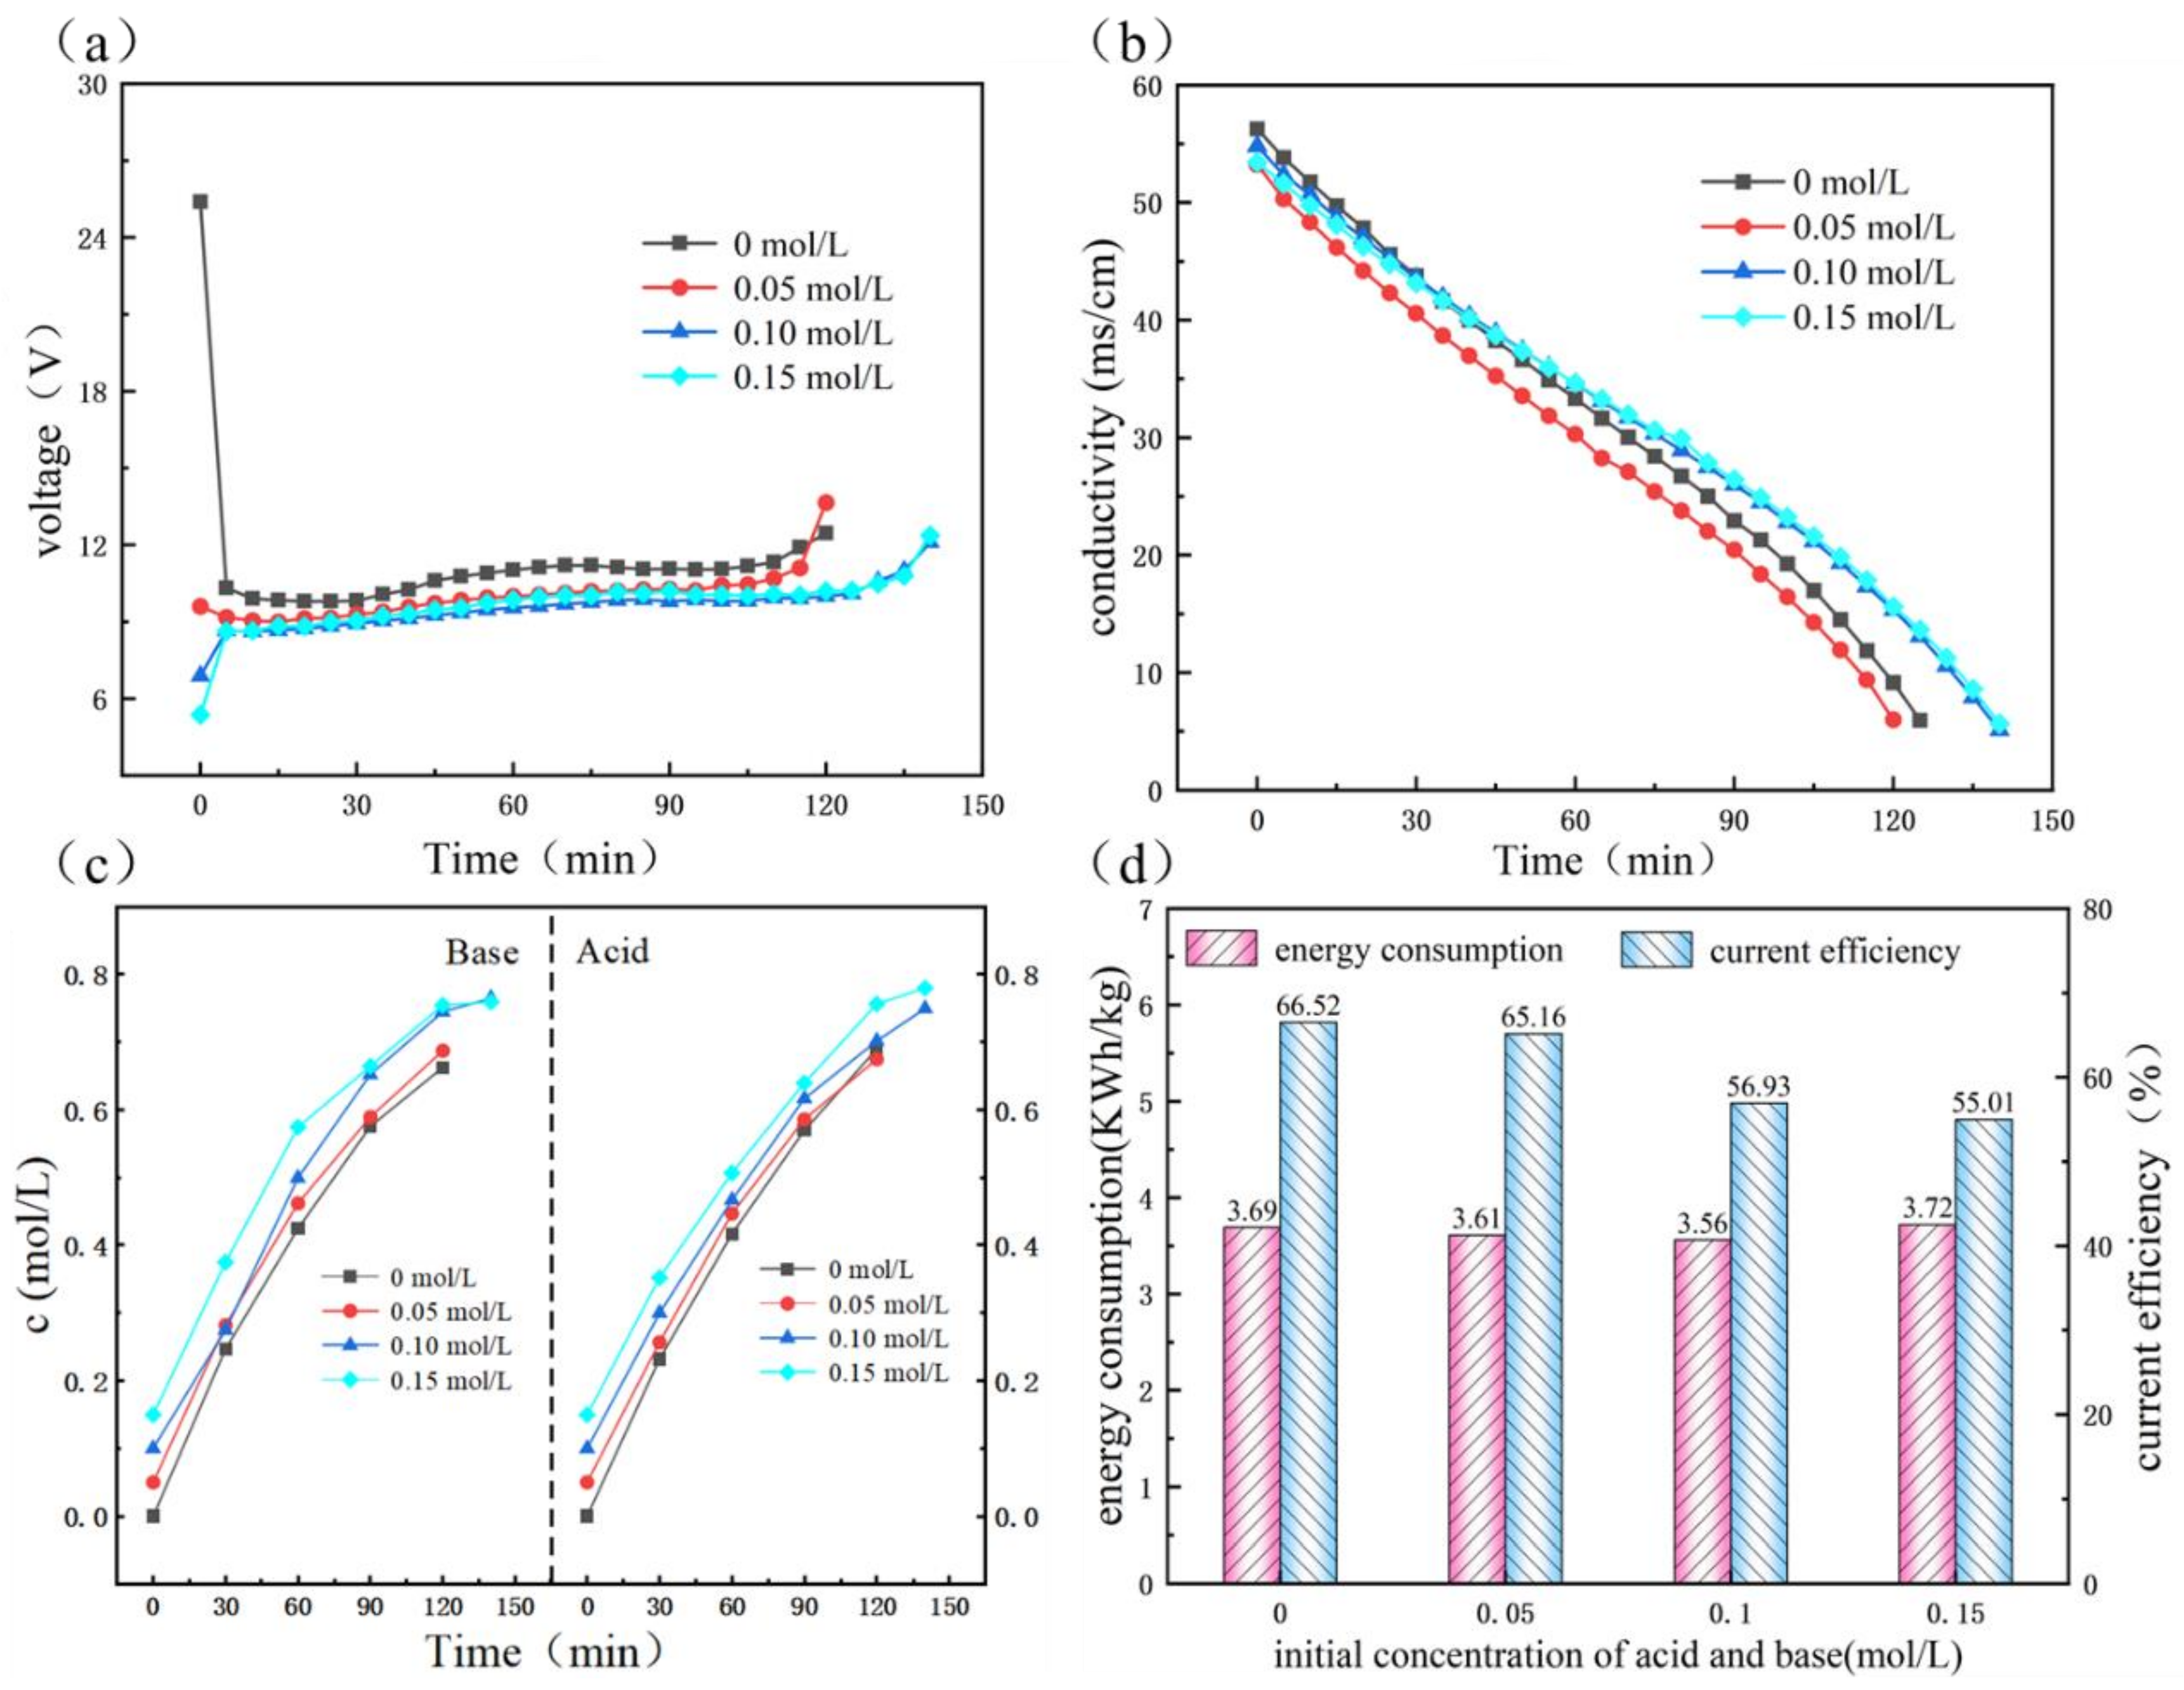
3.3.3. Effect of Initial HCl and NaOH Contents

Figure 8a presents the variation of voltage drop with time for different initial HCl and NaOH contents. As shown in Figure 8a, the higher the initial HCl and NaOH contents, the lower the BMED stack voltage. It can be explained that the higher solution concentrations introduced a larger number of ions as well as reduced the initial resistance of the membrane stack. Then, the membrane stack voltage gradually increased because of ion migration in the feed solutions. As presented in Figure 8b, due to the concentration gradient between adjacent compartments, higher initial HCl and NaOH concentrations could slightly decelerate the desalination rate as well as lead to prolonging the duration of the experiment. Figure 8c reflected that larger initial HCl and NaOH contents contributed to larger concentrations of eventual acid and base.
Figure 8d shows the changes in current efficiency and energy consumption during BMED. The higher the initial HCl and NaOH contents, the lower the current efficiency; the leakage of H+ ions increased with the initial HCl concentration increase, which resulted in the decrease of current efficiency. Moreover, the high osmotic pressure inhibited the migration of water molecules to the interfacial layer of the BPM as well as reduced the production of H+ and OH [33]. The energy consumption was marginally decreased when the initial concentrations of acid or base increased due to a decline in the resistance of the membrane stack. It could be observed that lower initial contents of HCl and NaOH contributed to lower energy consumption, as well as higher current efficiency. The findings indicated that the HCl/NaOH contents of 0.10 mol/L could be regarded as suitable content for the bipolar membrane electrodialysis process during the present experiment.

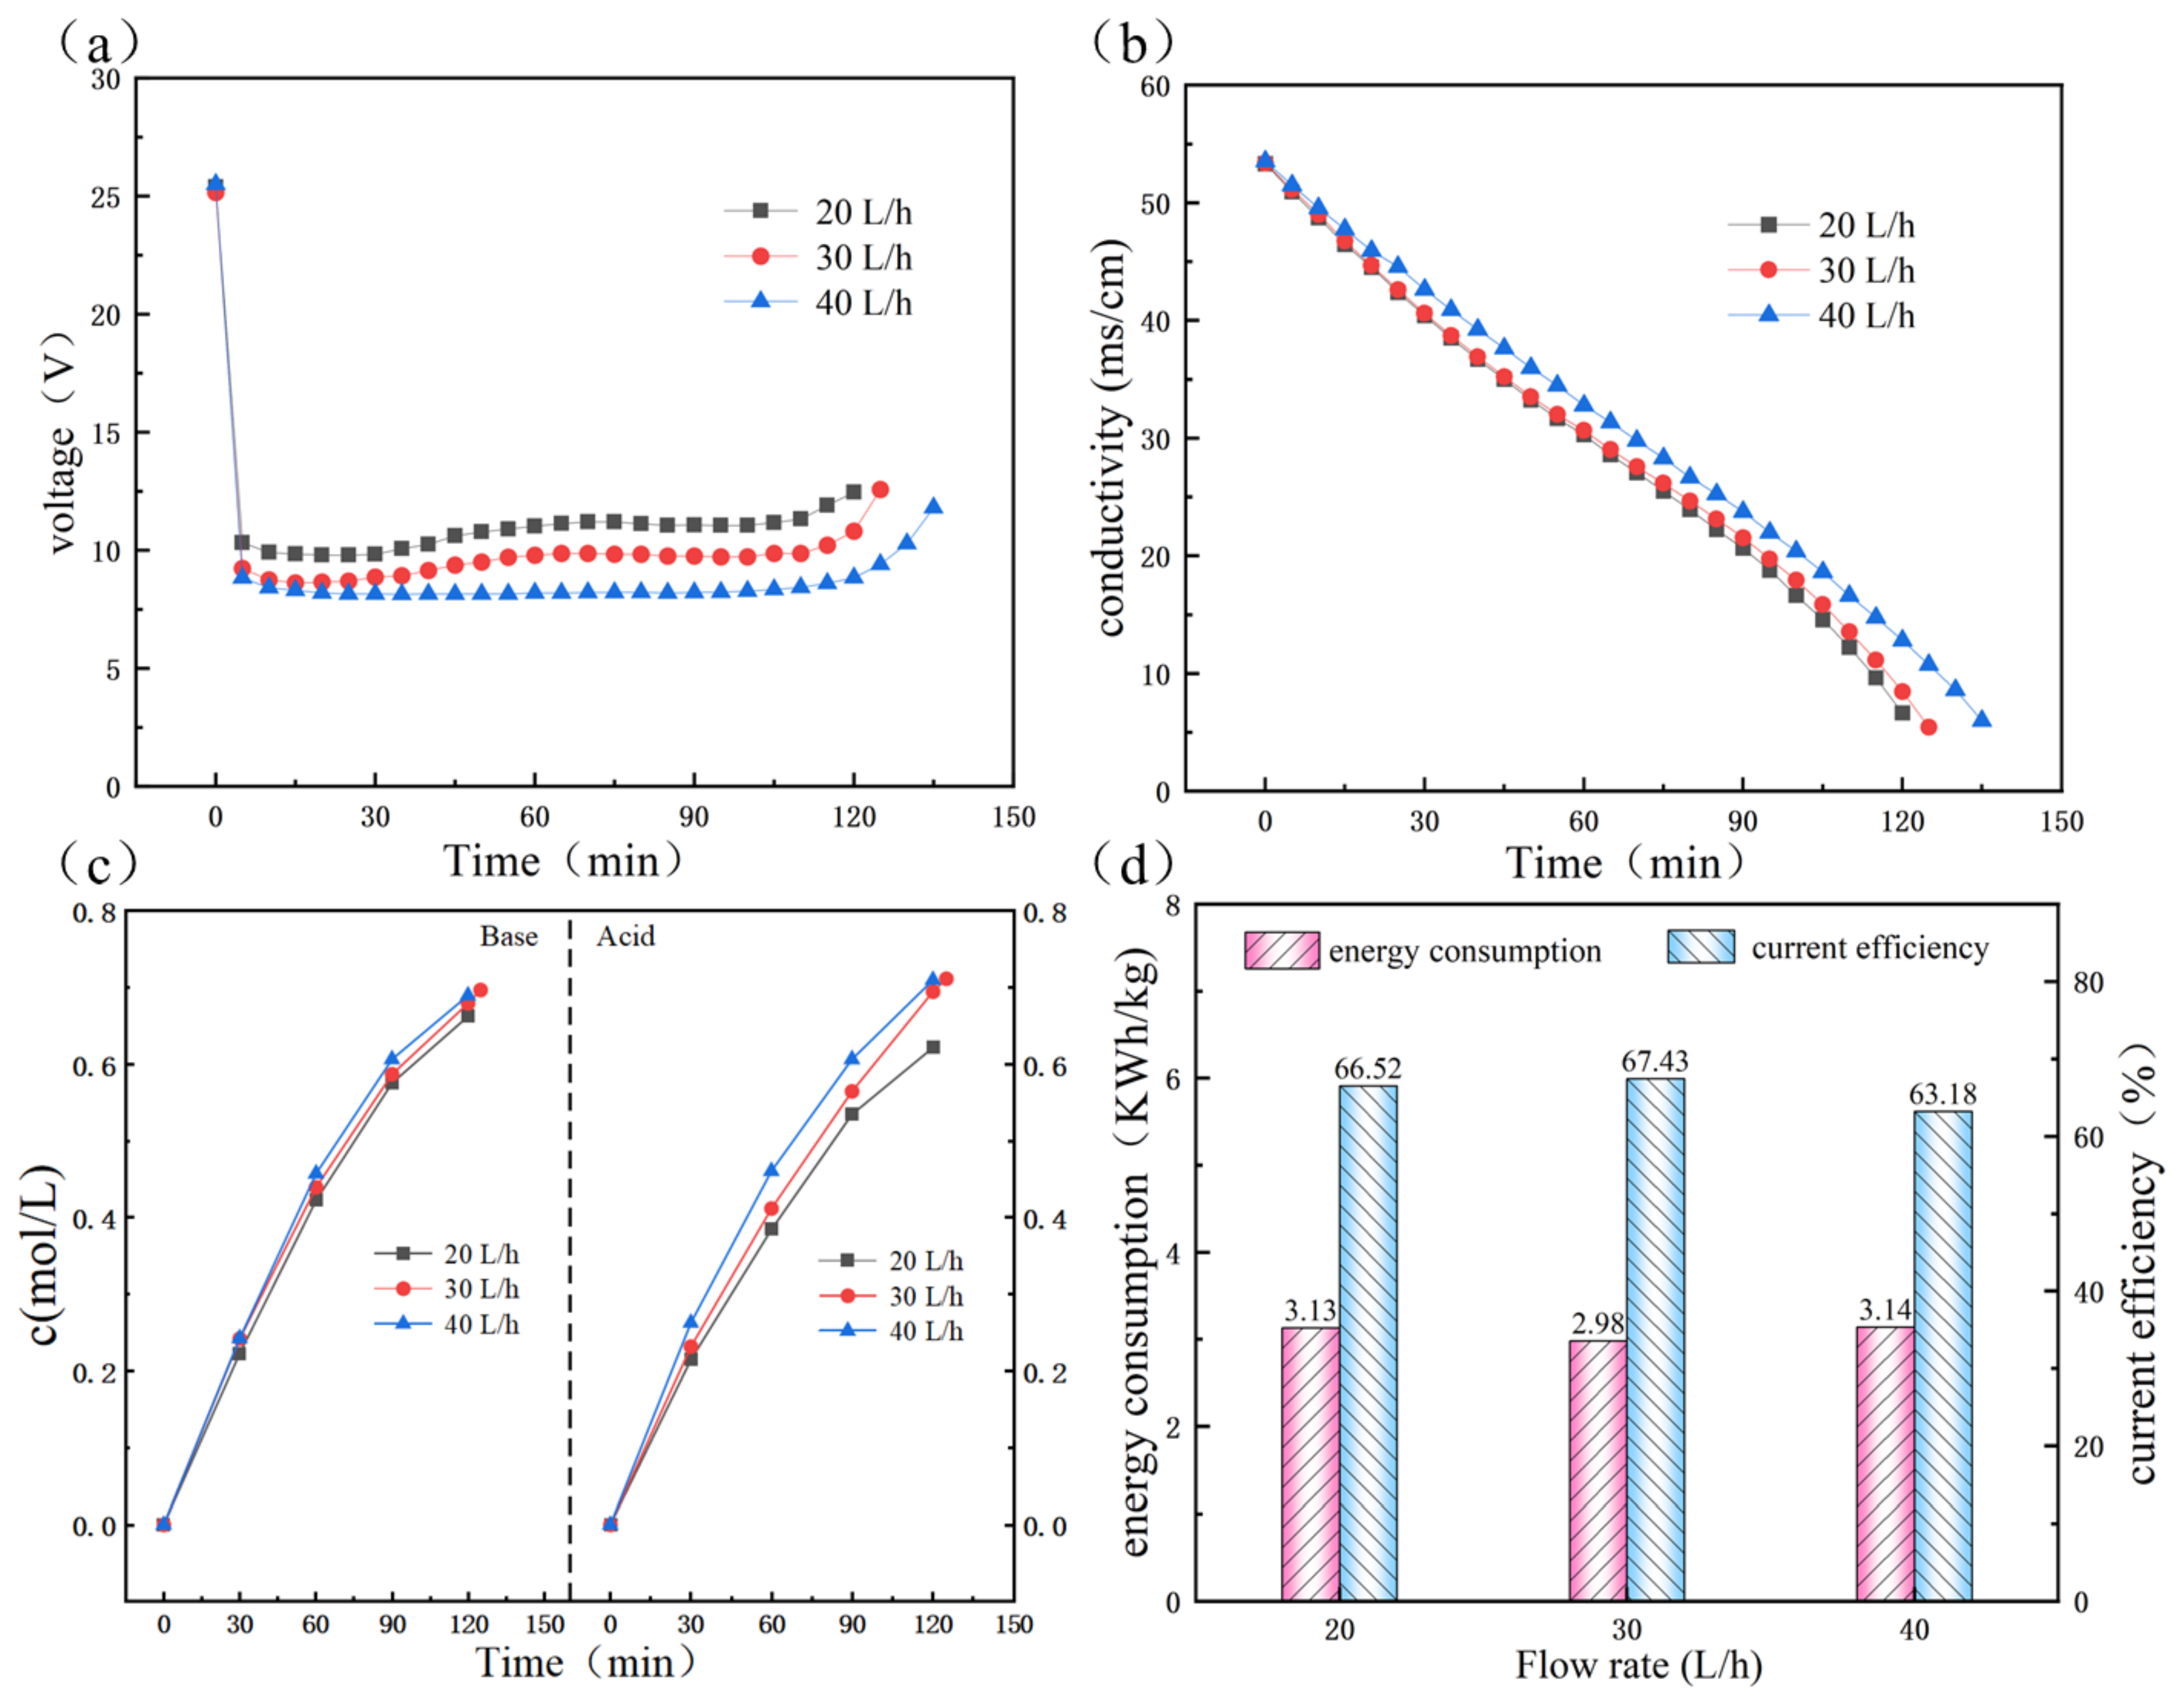
3.3.4. Effect of Flow Velocity

As shown in Figure 9a, the membrane stack has a lower stacking voltage under higher flow rates. A possible reason for this is due to the enhanced turbulence in the various chambers [34], and the diffusion boundary layers were compressed as the flow velocity increased, which resulted in a reduction of electrical resistance in the membrane stack [35]. At the same time, it can be observed from Figure 9b,c that the experimental time increased with an increase in flow rate, and the flow rate showed a positive effect on the acid and base production. The reason could be attributed to the concentration polarization caused by the low flow rate that inhibited the diffusion and migration of anions and cations [36]. The acid and base formation is mainly positively correlated with the desalination rate. It could also be observed that the final NaOH contents were higher than the acid concentration because the migration rate of Na+ was higher than Cl and SO42− due to the higher hydration number and smaller ionic radius of Na+. Another important reason was that H+ is easier to diffuse back to the liquid chamber through BPM.
The variation of current efficiency and energy consumption under various flow velocities are presented in Figure 9d. In the process of BMED, the energy consumption increased with the increase in flow rate, and the current efficiency decreased gradually. As the flow rate increased, the level of turbulence for every chamber grew dramatically, as well as the residence time of ions in the boundary layer was reduced. This indicates that not adequate time is available for ions to migrate through the AEM and CEM. Some of the ions fail to finish the migration behavior, thereby reducing current efficiency as well as improving total energy consumption. Additionally, overly flow rate aggravated energy consumption as well as high pressure over membranes, and this will reduce the lifetime of the membrane. Overall, it is crucial to maintain the flow rates at a suitable margin in the electrodialysis procedure.
Table 7 shows the main composition of acid and base produced. It can be seen that the concentration of divalent cations in the alkali chamber is much lower than that of monovalent cations, which can be ignored. The purity grade of NaOH by-products calculated according to the Na+ concentration of the alkali solution was close to 98.66%. This finding indicates that the single-selective membrane successfully prevents multivalent ions from passing through the cation exchange membrane, and the single ion (Na+) is selectively transported to the alkali chamber.

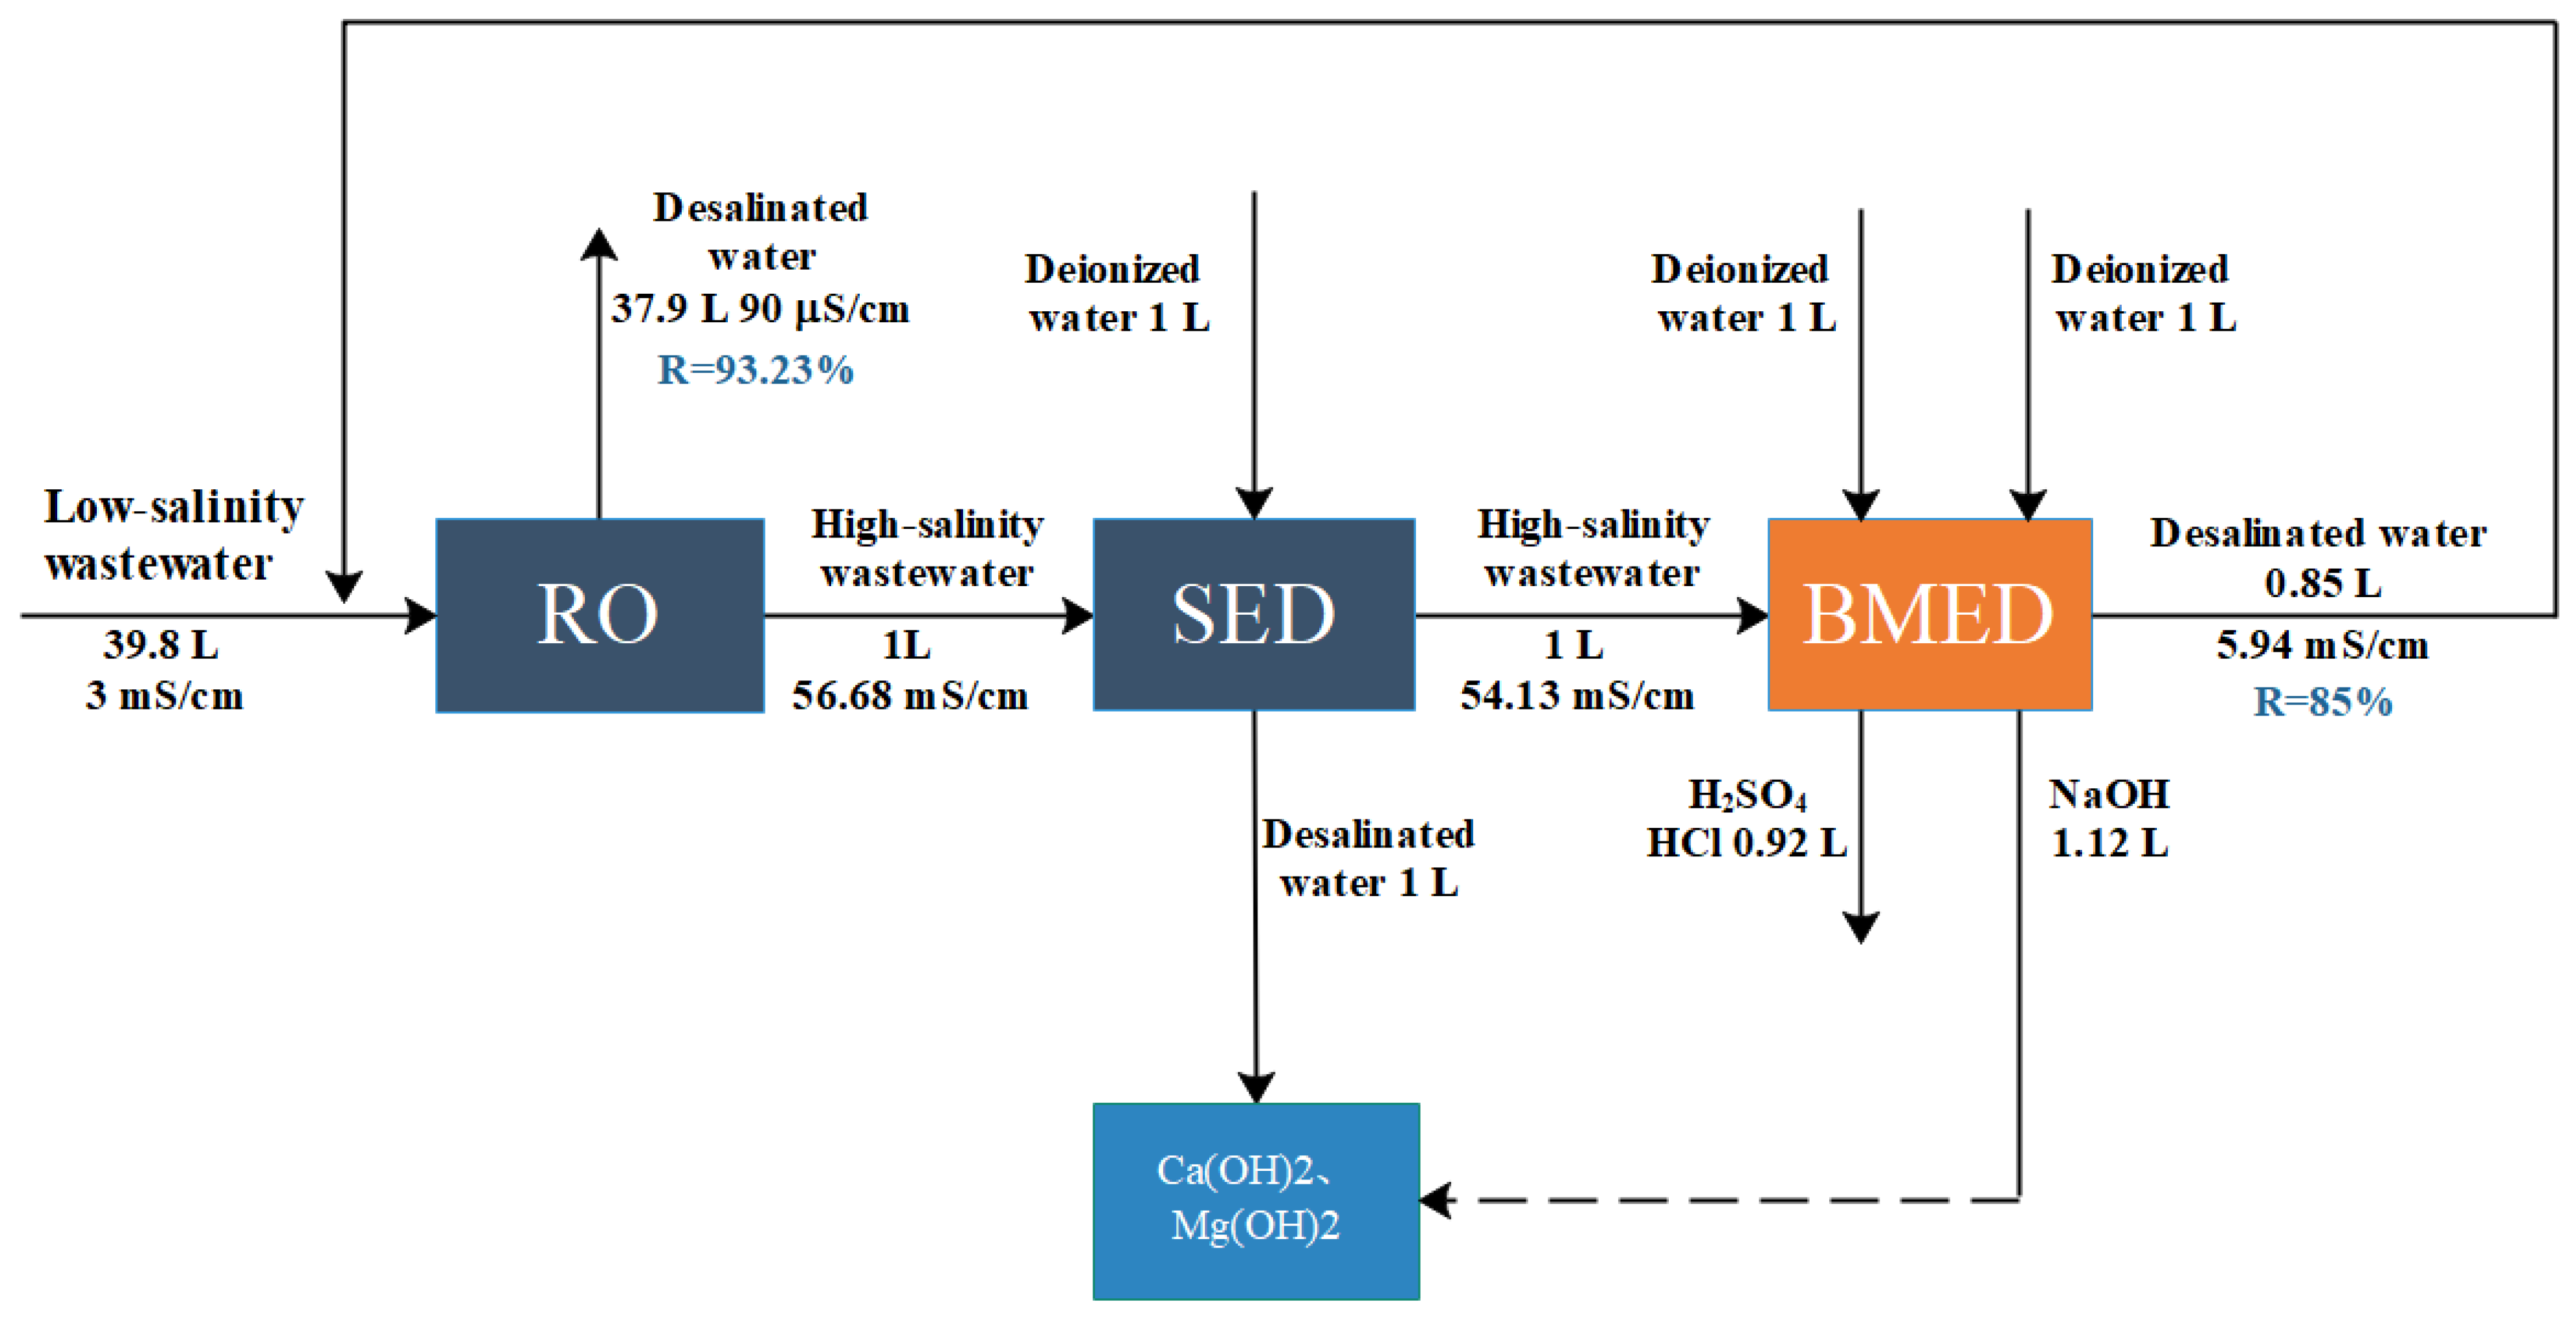
3.4. The Water Recovery Evaluation

In order to evaluate the feasibility of zero discharge of low-salinity mineralized wastewater by mixed membrane process, the water recovery rate of the SED process (constant current 10 mA/cm2, volume ratio 1:1) and BMED process (constant current 20 mA/cm2, 55 ± 2 mS/cm, 0.10 mol/L NaOH, HCl, 20 L/h) was analyzed. Obviously, the overall process has a large water recovery rate, as shown in Figure 10. RO process was 93.23%, and that of BMED was 85%. The recovered water can be recycled. Thus, it can be concluded that the membrane-hybrid process was suitable for Zero liquid discharge of low-salinity mineralized wastewater. Further work will be carried out to precipitate Ca2+ and Mg2+ from the SED concentrated solution by adding NaOH produced by BMED.

3.5. Economic Evaluation

The total cost of the total process under optimal operating conditions (55 ± 2 mS/cm, 20 mA/cm2, 0.10 mol/L NaOH, HCl, 20 L/h) was estimated, as shown in Table 8. The ED and BMED process cost consists mainly of ED and BMED using monovalent selective membranes (see Figure 2). The life of the membrane and membrane stack was calculated as 3 years. The total process cost of the SED and BMED processes is estimated at USD 1.38/kg NaOH. It can be observed from Table 7 that the high price of membrane occupies the main position in the total process. Therefore, reducing the cost of the membrane or expanding the processing scale can significantly reduce the total cost of the entire process. In addition, the delivery and preservation of acid and alkali are actual problems for the desalination of wastewater in remote areas, so it is appropriate and competitive to produce high-purity acid/alkali by BMED process.

4. Conclusions

In this work, we proposed an integrated UF-RO-SED-BMED process for the environmentally-friendly treatment of low-salinity mineralized brine. The process includes salt concentration, alkali/acid recovery, and freshwater regeneration. The RO device achieved nearly 11 times the preconcentration of salt in wastewater, effectively removing divalent ions such as Ca2+ and Mg2+ after SED at 10 mA/cm2.
We concluded that a high current could increase the desalination rate of the membrane stack and acid-base production rate, but it is necessary to consider the damage of high voltage to the equipment and ion exchange membrane. Suitable initial saline concentrations resulted in less energy consumption. Additionally, high initial HCl and NaOH contents and flow velocity can affect operation time, energy consumption, and current efficiency. Under the optimal conditions, with a current density of 20 mA/cm2 and feed conductivity of 54 mS/cm, the acid and alkali concentrations were 0.75 mol/L and 0.765 mol/L, respectively. The total process cost under optimal conditions was calculated to be USD 1.38/kg for the electrodialysis stage. The combined UF-RO-SED-BMED process proved to be technically feasible for resource treatment of low-salinity mineralized wastewater via a membrane-hybrid process.

Author Contributions

Formal analysis, J.L.; investigation, J.S., J.L., Z.L. and Y.W.; resources, Y.W.; data curation, X.C.; writing—original draft, X.C.; writing—review and editing, X.Z., X.C. and J.P.; supervision, X.Z., Z.L. and J.P.; project administration, X.C. and J.P.; funding acquisition, J.P. All authors have read and agreed to the published version of the manuscript.

Funding

This work was supported by the Open Fund of State Key Laboratory of Water Resource Protection and Utilization in Coal Mining (No. GJNY-21-41-10), the National Natural Science Foundation of China (No. 22178312), Zhejiang Provincial Natural Science Foundation of China (Grant No. LY22B060008), Social development projects of Shaanxi Science and Technology Department (No. 2021SF-449).

Data Availability Statement

Data is contained within the article.

Conflicts of Interest

The authors declare that they have no conflicts of interest.

References

  1. Yang, Y.; Gao, X.; Fan, A.; Fu, L.; Gao, C. An innovative beneficial reuse of seawater concentrate using bipolar membrane electrodialysis. J. Membr. Sci. 2014, 449, 119–126. [Google Scholar] [CrossRef]
  2. Gu, D.; Li, T.; Li, J.; Guo, Q.; Jiang, B.; Bian, W.; Yixiang, B. Current status and prospects of coal mine water treatment technology in China. Coal Sci. Technol. 2021, 49, 11–18. [Google Scholar]
  3. Jin, D.; Ge, G.; Zhang, Q.; Guo, Y.D. New energy-saving desalination technology of highly-mineralized mine water. Coal Sci. Technol. 2018, 46, 12–18. [Google Scholar]
  4. Chen, J.; Gu, M.; Zhou, Y.; Wan, D.; He, Q.; Shi, Y.; Liu, Y. Efficient nitrate and perchlorate removal from aqueous solution via a novel electro-dialysis ion-exchange membrane bioreactor. Chem. Eng. J. 2022, 430, 132952. [Google Scholar] [CrossRef]
  5. Jiang, S.; Sun, H.; Wang, H.; Ladewig, B.P.; Yao, Z. A comprehensive review on the synthesis and applications of ion exchange membranes. Chemosphere 2021, 282, 130817. [Google Scholar] [CrossRef] [PubMed]
  6. Melnikov, S.S.; Nosova, E.N.; Melnikova, E.D.; Zabolotsky, V.I. Reactive separation of inorganic and organic ions in electrodialysis with bilayer membranes. Sep. Purif. Technol. 2021, 268, 118561. [Google Scholar] [CrossRef]
  7. Zhang, Y.; Van der Bruggen, B.; Pinoy, L.; Meesschaert, B. Separation of nutrient ions and organic compounds from salts in RO concentrates by standard and monovalent selective ion-exchange membranes used in electrodialysis. J. Membr. Sci. 2009, 332, 104–112. [Google Scholar] [CrossRef]
  8. Qiu, Y.; Yao, L.; Tang, C.; Zhao, Y.; Zhu, J.; Shen, J. Integration of selectrodialysis and selectrodialysis with bipolar membrane to salt lake treatment for the production of lithium hydroxide. Desalination 2019, 465, 1–12. [Google Scholar] [CrossRef]
  9. Badruzzaman, M.; Oppenheimer, J.; Adham, S.; Kumar, M. Innovative beneficial reuse of reverse osmosis concentrate using bipolar membrane electrodialysis and electrochlorination processes. J. Membr. Sci. 2009, 326, 392–399. [Google Scholar] [CrossRef]
  10. Tongwen, X.; Weihua, Y. Citric acid production by electrodialysis with bipolar membranes. Chem. Eng. Process. Process Intensif. 2002, 41, 519–524. [Google Scholar] [CrossRef]
  11. Nosova, E.; Achoh, A.; Zabolotsky, V.; Melnikov, S. Electrodialysis Desalination with Simultaneous pH Adjustment Using Bilayer and Bipolar Membranes, Modeling and Experiment. Membranes 2022, 12, 1102. [Google Scholar] [CrossRef] [PubMed]
  12. Chen, X.; Ruan, X.; Kentish, S.E.; Li, G.; Xu, T.; Chen, G.Q. Production of lithium hydroxide by electrodialysis with bipolar membranes. Sep. Purif. Technol. 2021, 274, 119026. [Google Scholar] [CrossRef]
  13. Liu, Y.; Sun, Y.; Peng, Z. Evaluation of bipolar membrane electrodialysis for desalination of simulated salicylic acid wastewater. Desalination 2022, 537, 115866. [Google Scholar] [CrossRef]
  14. Melnikov, S.S.; Mugtamov, O.A.; Zabolotsky, V.I. Study of electrodialysis concentration process of inorganic acids and salts for the two-stage conversion of salts into acids utilizing bipolar electrodialysis. Sep. Purif. Technol. 2020, 235, 116198. [Google Scholar] [CrossRef]
  15. Du, C.; Du, J.R.; Zhao, X.; Cheng, F.; Ali, M.E.A.; Feng, X. Treatment of Brackish Water RO Brine via Bipolar Membrane Electrodialysis. Ind. Eng. Chem. Res. 2021, 60, 3115–3129. [Google Scholar] [CrossRef]
  16. Chaudhury, S.; Harlev, N.; Haim, O.; Lahav, O.; Nir, O. Decreasing Seawater Desalination Footprint by Integrating Bipolar-Membrane Electrodialysis in a Single-Pass Reverse Osmosis Scheme. ACS Sustain. Chem. Eng. 2021, 9, 16232–16240. [Google Scholar] [CrossRef]
  17. Miao, M.; Qiu, Y.; Yao, L.; Wu, Q.; Ruan, H.; Van der Bruggen, B.; Shen, J. Preparation of N,N,N-trimethyl-1-adamantylammonium hydroxide with high purity via bipolar membrane electrodialysis. Sep. Purif. Technol. 2018, 205, 241–250. [Google Scholar] [CrossRef]
  18. Yan, H.; Xu, C.; Li, W.; Wang, Y.; Xu, T. Electrodialysis To Concentrate Waste Ionic Liquids: Optimization of Operating Parameters. Ind. Eng. Chem. Res. 2016, 55, 2144–2152. [Google Scholar] [CrossRef]
  19. Nie, X.-Y.; Sun, S.-Y.; Sun, Z.; Song, X.; Yu, J.-G. Ion-fractionation of lithium ions from magnesium ions by electrodialysis using monovalent selective ion-exchange membranes. Desalination 2017, 403, 128–135. [Google Scholar] [CrossRef]
  20. Jiang, G.; Li, H.; Xu, M.; Ruan, H. Sustainable reverse osmosis, electrodialysis and bipolar membrane electrodialysis application for cold-rolling wastewater treatment in the steel industry. J. Water Process Eng. 2021, 40, 101968. [Google Scholar] [CrossRef]
  21. Qiu, Y.; Lv, Y.; Tang, C.; Liao, J.; Ruan, H.; Sotto, A.; Shen, J. Sustainable recovery of high-saline papermaking wastewater: Optimized separation for salts and organics via membrane-hybrid process. Desalination 2021, 507, 114938. [Google Scholar] [CrossRef]
  22. Qiu, Y.; Ruan, H.; Tang, C.; Yao, L.; Shen, J.; Sotto, A. Study on Recovering High-Concentration Lithium Salt from Lithium-Containing Wastewater Using a Hybrid Reverse Osmosis (RO)–Electrodialysis (ED) Process. ACS Sustain. Chem. Eng. 2019, 7, 13481–13490. [Google Scholar] [CrossRef]
  23. Peters, C.D.; Hankins, N.P. Osmotically assisted reverse osmosis (OARO): Five approaches to dewatering saline brines using pressure-driven membrane processes. Desalination 2019, 458, 1–13. [Google Scholar] [CrossRef]
  24. Fane, A.G. A grand challenge for membrane desalination: More water, less carbon. Desalination 2018, 426, 155–163. [Google Scholar] [CrossRef]
  25. Panagopoulos, A. A comparative study on minimum and actual energy consumption for the treatment of desalination brine. Energy 2020, 212, 118733. [Google Scholar] [CrossRef]
  26. Masigol, M.A.; Moheb, A.; Mehrabani-Zeinabad, A. An experimental investigation into batch electrodialysis process for removal of sodium sulfate from magnesium stearate aqueous slurry. Desalination 2012, 300, 12–18. [Google Scholar] [CrossRef]
  27. Peng, Z.; Sun, Y. Leakage circuit characteristics of a bipolar membrane electrodialyzer with 5 BP-A-C units. J. Membr. Sci. 2020, 597, 117762. [Google Scholar] [CrossRef]
  28. Jiang, C.; Wang, Y.; Wang, Q.; Feng, H.; Xu, T. Production of Lithium Hydroxide from Lake Brines through Electro–Electrodialysis with Bipolar Membranes (EEDBM). Ind. Eng. Chem. Res. 2014, 53, 6103–6112. [Google Scholar] [CrossRef]
  29. Wang, X.; Wang, Y.; Zhang, X.; Feng, H.; Xu, T. In-situ combination of fermentation and electrodialysis with bipolar membranes for the production of lactic acid: Continuous operation. Bioresour. Technol. 2013, 147, 442–448. [Google Scholar] [CrossRef]
  30. Zhang, W.; Miao, M.; Pan, J.; Sotto, A.; Shen, J.; Gao, C.; Van der Bruggen, B. Process Economic Evaluation of Resource Valorization of Seawater Concentrate by Membrane Technology. ACS Sustain. Chem. Eng. 2017, 5, 5820–5830. [Google Scholar] [CrossRef]
  31. Strathmann, H.; Krol, J.J.; Rapp, H.-J.; Eigenberger, G. Limiting current density and water dissociation in bipolar membranes. J. Membr. Sci. 1997, 125, 123–142. [Google Scholar] [CrossRef]
  32. Sun, Y.; Wang, Y.; Peng, Z.; Liu, Y. Treatment of high salinity sulfanilic acid wastewater by bipolar membrane electrodialysis. Sep. Purif. Technol. 2022, 281, 119842. [Google Scholar] [CrossRef]
  33. Wei, Y.; Wang, Y.; Zhang, X.; Xu, T. Treatment of simulated brominated butyl rubber wastewater by bipolar membrane electrodialysis. Sep. Purif. Technol. 2011, 80, 196–201. [Google Scholar] [CrossRef]
  34. Wright, N.C.; Shah, S.R.; Amrose, S.E.; Winter, A.G. A robust model of brackish water electrodialysis desalination with experimental comparison at different size scales. Desalination 2018, 443, 27–43. [Google Scholar] [CrossRef]
  35. Walker, W.S.; Kim, Y.; Lawler, D.F. Treatment of model inland brackish groundwater reverse osmosis concentrate with electrodialysis—Part I: Sensitivity to superficial velocity. Desalination 2014, 344, 152–162. [Google Scholar] [CrossRef]
  36. Tanaka, Y. Concentration polarization in ion-exchange membrane electrodialysis—The events arising in a flowing solution in a desalting cell. J. Membr. Sci. 2003, 216, 149–164. [Google Scholar] [CrossRef]
Figure 1. Schematic diagram for zero liquid discharge and resource treatment of low-salinity mineralized wastewater.
Separations 10 00269 g001
Figure 2. Experimental setup diagram of (a) SED and (b) BMED.
Separations 10 00269 g002
Figure 3. Effect of current density in first-stage ED process: (a) voltage drop, (b) desalination rate in the dilute and concentrate compartment, (c) concentration factor and water transport, and (d) energy consumption and current efficiency.
Separations 10 00269 g003
Figure 4. Effect of current density in second-stage ED process: (a) voltage drop, (b) desalination rate in dilute and concentrate compartment, (c) concentration factor and water transport, and (d) energy consumption and current efficiency.
Separations 10 00269 g004
Figure 5. Effect of current density in SED process: (a) voltage drop, (b) desalination rate in dilute and concentrate compartment, (c) separation coefficient of Na+/Mg2+ and Na+/Ca2+, and (d) energy consumption and current efficiency.
Separations 10 00269 g005
Figure 6. Effect of current density on (a) membrane stack voltage; (b) conductivity of feed compartment; (c) the concentrations of acid and base; (d) current efficiency and energy consumption. The feed conductivity: 35 mS/cm. Initial HCl and NaOH contents: 0 mol/L. flow velocity: 20 L/h.
Separations 10 00269 g006
Figure 7. Effect of initial salt concentration on (a) membrane stack voltage; (b) desalination rate; (c) the concentrations of acid and base; (d) current efficiency and energy consumption. Current density: 20 mA/cm2; initial HCl and NaOH contents: 0 mol/L. flow velocity: 20 L/h.
Separations 10 00269 g007
Figure 8. Effect of the initial HCl and NaOH contents on (a) membrane stack voltage; (b) conductivity of feed compartment; (c) the concentrations of acid and base; (d) current efficiency and energy consumption. The feed conductivity: 55 mS/cm; current density: 20 mA/cm2; flow velocity: 20 L/h.
Separations 10 00269 g008
Figure 9. Effect of flow velocity on (a) membrane stack voltage; (b) conductivity of feed compartment; (c) the concentrations of acid and base; (d) current efficiency and energy consumption. The feed conductivity: 55 mS/cm; current density: 20 mA/cm2; initial HCl and NaOH contents: 0.10 mol/L.
Separations 10 00269 g009
Figure 10. Schematic diagram of the water recovery for the entire process.
Separations 10 00269 g010
Table 1. Main properties of the membranes.
Membrane TypeThickness (mm)Burst Strength (MPa)Area Resistance (Ω cm2)Transport Number
(%)
Temp (°C)
CAM0.20–0.340.66–8--25–40
AAM0.34–0.38>0.65–7--25–40
BPM0.28>1.0----25–40
CSO0.10.152.397--
Table 2. Main components of mineralized wastewater.
Na+
(µg/L)
Mg2+
(µg/L)
K+
(µg/L)
Ca2+
(µg/L)
Cl
(µg/L)
SO42−
(µg/L)
Feed7829.7570.274.0191.013.967.82
Table 3. The main components for different solution concentrations.
Conductivity (mS/cm)Na+
(mg/L)
K+
(mg/L)
Mg2+
(mg/L)
Ca2+
(mg/L)
Cl
(mg/L)
SO42−
(mg/L)
RO34.3410,794.2133.5113.6131.27011.413,885.3
ED3510,807.1136.5108.7128.27063.113,953.1
55.2317,380.8181177234.910,890.223,018.1
74.6325,458.1284.6264331.916,61432,830.6
Table 4. Concentration factor, water transport, energy consumption, and current efficiency of the third-stage ED concentration.
Operation ModeCurrent Density (mA/cm2)CFEDWT (%)E (kWh/m3)CE (%)
Third-stage ED151.485681.9520.41
201.4658.587.5219.83
251.515099.7920.69
Table 5. Energy consumption and concentration factor of RO and first-stage ED process.
Concentrate FactorEnergy Consumption (kWh/m3)
RO10.93.52
5 mA/cm29.238.23
10 mA/cm29.8213.05
15 mA/cm29.4720.17
Table 6. The main components of the feed solution and the concentrated solution after SED at different current densities.
Na+ (mg/L)K+ (mg/L)Mg2+ (mg/L)Ca2+ (mg/L)
a Feed10,807.87136.51108.70128.23
5 mA/cm28567.7884.4181.1997.23
10 mA/cm28306.2068.9220.3136.96
15 mA/cm29839.8985.7469.4590.65
20 mA/cm29032.80100.9169.5588.53
a The initial feed conductivity is 35 mS/cm.
Table 7. Main ions in the base and acid solution.
IonAcid (mg/L)Base (mg/L)
Na+320.317,320
Mg2+00
Ca2+08.95
Cl10,550.1195.3
SO42−22,68030.2
The flow rate is 20 L/h.
Table 8. The estimation procedure of BMED and SED process cost.
SEDBMED
operating conditions
repeat unit3.004
current density (mA/cm2)10.0020
flow rate (L/h)20.0020
working time (h/year)72007200
effective membrane area (cm2) 187.20187.20
practical membrane area (cm2) 297.00297.00
feed conductivity (mS/cm) 34.0055.00
energy
energy consumption (kWh/kg) 1.003.51
process capacity (kg/year) 172.80104.75
electricity charge (USD/kWh)0.1000.100
energy consumption for acid/base production (USD/kg)0.1000.351
energy consumption for peripheral equipment (USD/kg)0.0520.18
total energy cost (USD/kg)0.1520.53
capital cost
membrane life (year)33
bipolar membrane price (USD/m2)376.00376
ion-exchange membran165.00165
monoselective membrane price (USD/m2)260.00260
membrane cost (USD)50.4985.24
membrane stack cost (USD) 75.74127.86
peripheral cost (USD) 113.60191.79
total investment cost (USD)189.34319.65
total fixed cost (USD/year) 63.11106.55
total fixed cost (USD/kg)0.3651.02
total process cost (USD/kg) 1.38
Disclaimer/Publisher’s Note: The statements, opinions and data contained in all publications are solely those of the individual author(s) and contributor(s) and not of MDPI and/or the editor(s). MDPI and/or the editor(s) disclaim responsibility for any injury to people or property resulting from any ideas, methods, instructions or products referred to in the content.

