Article

Green and Fast Extraction of Chitin from Waste Shrimp Shells: Characterization and Application in the Removal of Congo Red Dye

1
Department of Process Engineering, Faculty of Technology, University of 20 August 1955, Skikda 21000, Algeria
2
Laboratory LRPCSI, University of 20 August 1955, Skikda 21000, Algeria
3
Department of Petrochemical, Faculty of Technology, University of 20 August 1955, Skikda 21000, Algeria
4
Laboratory of Catalysis, Bioprocess and Environment, Department of Process Engineering, Faculty of Technology, University of 20 August 1955, Skikda 21000, Algeria
5
Institute of Nanotechnology, Karlsruhe Institute of Technology, 76344 Karlsruhe, Germany
6
Department of Chemistry, College of Science and Arts At Ar-Rass, Qassim University, Saudi Arabia
7
Research Unit of Environmental Chemistry and Molecular Structural (CHEMS), University of Constantine 1, Constantine 25000, Algeria
8
Université Paris Cité, CNRS, ITODYS, F-75013 Paris, France
*
Author to whom correspondence should be addressed.
Separations 2023, 10(12), 599; https://doi.org/10.3390/separations10120599
Submission received: 26 October 2023 / Revised: 8 December 2023 / Accepted: 11 December 2023 / Published: 13 December 2023

Abstract

:
Due to their detrimental and carcinogenic effects, synthetic organic dyes pose significant environmental and health risks. Consequently, addressing the bioremediation of industrial wastewater containing these organic dyes has become an urgent environmental concern. The adsorption using low-cost and green materials is one of the best alternative techniques for the removal of dyes. This study aims to investigate the use of chitin to eliminate Congo red (CR), an anionic dye, from wastewater. The chitin was produced from shrimp shell in a quick and environmentally friendly manner by utilizing a co-solvent (glycerol/citric acid (GLC)). The resulting adsorbent was characterized through various techniques, including X-ray diffraction (XRD), scanning electron microscopy (SEM), and FT-IR spectroscopy. The effectiveness of CR removal with chitin was studied with respect to contact time, adsorbent dose, initial pH, equilibrium isotherms, and kinetic and thermodynamic parameters. It was observed that variations in the dye concentration and pH significantly influenced the removal of CR with chitin. Under optimal operating conditions (pH = 7, contact time = 130 min, temperature = 50 °C), the adsorption capacity reached 29.69 ± 0.2 mg/g. The experimental data revealed that CR adsorption onto a chitin adsorbent is better represented by a Langmuir isotherm.

1. Introduction

Environmental pollution remediation has become a pressing problem and a major global concern. Worldwide, over 100,000 dyes are commercially accessible, with an annual manufacturing capacity of around 700,000 tons [1]. The use of dyes and colors in various fields such as textiles, cosmetics, paper, plastics, food, pharmaceuticals, and so on makes it the second-largest source of pollution due to the huge amounts of wastewater exposed to the environment without sufficient treatment [2].
Synthetic dyes such as methylene blue [3], malachite green [4], methyl orange [5] and Congo red [6] find diverse industrial applications, but they also are detrimental to ecosystems. The predominant dye groups categorized with a chemical classification include azo/azomethine, anthraquinone, polymerthine, phthalocyanine, formazan, nitro, nitroso, etc. [7]. Among them, the class of azo dyes, which are extensively used and discharged into the environment, constitute toxic, mutagenic, and carcinogenic pollutants. Additionally, they are difficult to remove from wastewater because they do not readily undergo degradation using conventional methods [8].
Congo red is an aromatic heterocyclic chemical compound with the molecular formula C32H22N6Na2O6S2. Its chemical name is benzidinediazo-bis-1-naphthylamine-4-sulfonic acid sodium salt. This compound is classified as a secondary diazo dye and is assigned the color index number 22,120 [9]. Congo red is used as a pH indicator due to its color transition from blue to red within the pH range of 3.0–5.0. It exhibits a strong affinity for cellulose fibers. However, the use of Congo red in cellulose-related industries such as cotton textiles, pulp, and paper has been discontinued for several reasons, including toxicity and environmental pollution. The elimination of dyes from wastewater has been achieved through various processes, including membrane separation, advanced oxidation, flocculation/coagulation, electrochemical methods, and aerobic or anaerobic treatment, amongst others. Consequently, there is an immediate need to develop procedures that are both cutting-edge and cost-effective for the removal of dyes [10]. Among various methods, adsorption has proven to be particularly efficient in treating wastewater by effectively reducing hazardous inorganic and organic pollutants found in effluents, as it operates without generating sludge. Moreover, the adsorption process has the capability to completely eliminate colors even in highly dilute solutions, providing a competitive advantage over alternative methods [11].
A suitable adsorbent should demonstrate effective regeneration and a significant level of reusability while maintaining consistent performance [12].
Regenerating adsorptive materials encompasses a range of techniques, such as chemical, biological, and thermal processes. As reported by Osamah J. Al-sareji et al. (2023), the removal efficiency using the adsorption technique alone declined after the sixth cycle. Furthermore, over three cycles, regeneration may no longer be economically viable due to a significant decrease in removal [13].
For over three decades, the “philosophy of green chemistry” has piqued the interest of scientists worldwide. Economical and green adsorbents [14,15] that are both cost-effective and sustainable have garnered significant attention, aiming to replace conventional adsorbents derived from fossil fuels. Green adsorbents align more closely with the objective of a future circular economy that minimizes waste [16].
Chitin, as a natural adsorbent, possesses unique properties such as biocompatibility, biodegradability, and antimicrobial and antioxidant activities [17]. Chitin is an abundant natural biopolymer found in the exoskeletons of crustaceans, insects, and fungi, and is composed of N-acetylglucosamine [18]. The traditional methods for extracting biopolymers from crustacean waste have raised significant environmental and economic concerns over time. To overcome the difficulties caused by generating extensive acidic wastewater and complicated multistep separation processes, chitin can be extracted rapidly and environmentally friendly from shrimp shells using a co-solvent method [19]. Glycerol, as a high boiling point (290 °C) solvent, offers a number of desirable characteristics, including being nonvolatile, readily recyclable, very inert, and stable. Moreover, it has demonstrated its eco-friendly nature as a reaction medium [20]. Many studies have employed glycerol as a reaction solvent for chitin extraction and showed that acidic conditions can deproteinize crustacean waste during chitin extraction [21,22]. Hong et al. found that the utilization of a co-solvent composed of glycerol and hydrochloric acid was effective in the extraction of low-molecular-weight chitin from lobster shells [17]. While this process still involves the use of a hazardous acid (HCl), the quantity of acid employed was significantly reduced compared to conventional procedures [23,24,25].
This study aimed to utilize a green co-solvent, consisting of glycerol and citric acid, for a one-step extraction of chitin from shrimp shells under mild reaction conditions. Furthermore, the resulting chitin samples were characterized by Fourier transform infrared spectroscopy (FT-IR), X-ray diffractometry (XRD), and scanning electron microscopy (SEM). The originality of our research work stems from the adoption of an environmentally friendly approach, using a green co-solvent for extracting chitin from shrimp shell waste. In contrast to conventional methods involving commercial or traditional chemical acids and bases, our methodology focuses on a sustainable and eco-friendly extraction process.
The enhancement in the adsorption capacity of chitin was assessed by conducting Congo red adsorption experiments. This study also examined the effects of pH, adsorbent dosage, contact time, and temperature. Additionally, equilibrium isotherms, kinetic behavior, and thermodynamic data were evaluated.

2. Materials and Methods

2.1. Materials and Reagents

The Congo red dye (CR) was employed as adsorbate (color index 22120, molar mass 696.67 g/mol, percentage purity 97%, pKa 5.5, molecular formula C32H22N6Na2O6S2, BIOCHEM Chemopharma, Cosne-Cours-sur-Loire, France). Initially, a 100 mg/L stock solution of adsorbate was prepared and stored in an amber bottle. Working solutions were prepared from sequential dilutions of stock solutions in distilled water. Shrimp shells collected from restaurant waste (Skikda, Algeria) were washed thoroughly with tap water and dried at room temperature. The shell waste was then ground into a fine powder using a household grinder with an average particle size of 50 µm. The reagents used for the preparation of the chitin were sodium hydroxide, hydrogen peroxide solution 30%, LiCl (Biochem Chemopharma, Cosne-Cours-sur-Loire, France), citric acid (molar mass 210.14 g/mol, glycerol 99% (Chem-Lab, Zedelgem, Belgium), hydrochloric acid (37%, HCl), N, N-dimethylacetamide (DMAc) 99.5% (Loba Chemie Pvt. Ltd., Mumbai, India), and Bradford reagent (Sigma-Aldrich, London, UK). All reagents were used without further purification.

2.2. Synthesis and Characterization of Chitin

Following the principles of green chemistry, the one-step extraction of chitin from shrimp shells was carried out using the method proposed by Huang et al., with slight modifications [26]. Shrimp shell powder was directly dissolved in a glycerol and citric acid mixture at a 1:10 mass ratio, with concentrations ranging from 5% to 9% at 120 °C for 2 h. The extracted chitin was subsequently subjected to a decolorization process using 10% H2O2 at 80 °C for 90 min, with a weight ratio of solid to solution of 1:30. After each stage, the samples were collected after centrifugation at 4000 rpm for 10 min, washed with distilled water until reaching a moderate pH, and subsequently dried in a drying oven at 100 °C.
The water and ash content were determined by initially heating the samples in a drying oven for 24 h at 105 °C and then in a muffle furnace for 5 h at 700 °C. The protein content of the samples was evaluated using a qualitative chemical test (Biuret test), as reported in a previous work of Devi and Dhamodharan [19], and a quantitative test with the Bradford method [27].
Viscosity measurements were performed at 25 °C using an Ubbelohde capillary viscometer. The viscosity average molecular weight (M) was computed using the intrinsic viscosity. The resulting viscosity data were employed in the Mark–Houwink–Sakurada equation, which was suitable for obtaining the molecular weight of chitin ranging from 80 to 710 KDa.
[ ŋ ] = K M α
The utilized parameters were α = 0.95 and K = 7.6 × 10⁻⁵ dL/g for the chitin solution prepared in 5% LiCl/DMAc [28,29].
All samples were analyzed through an X–ray diffractometer (Model Rigaku) with a scanning rate of 5°/min, ranging from 5° to 80°. Results from XRD were obtained with a rotational step of 0.02° and an angular step of 0.05° (t = 2 s). The crystalline index (CrI; %) was calculated according to Equation (2).
C r I   110 = I 110 I a m I 110 100
where I110 represents the maximum intensity at 2θ ≅ 19.2° and Iam represents the intensity corresponding to the amorphous diffraction at 2θ ≅ 16° [30]. The functional groups present on the surfaces of the samples were studied using a JASCO 4600 FT-IR spectrometer (JASCO, Tokyo, Japan). All spectra were recorded in the range of 4000–400 cm−1 with a resolution of 0.7 cm−1. The surface morphologies of the chitin samples were examined with SELQUANTA FEI 650 (FEI, Hillsboro, OR, USA). SEM images were acquired at different acceleration voltages.
The determination of the pH at the point of zero charge (pHpzc) was conducted by adjusting the pH of the 25 mL/0.01 mol/L NaCl solutions to values between 2 and 12. After adding 0.0375 g of chitin and stirring for 24 h, the final pH was tested. The intersection along the initial pH axis, where pHf − pHi = 0, is defined as the pHpzc.

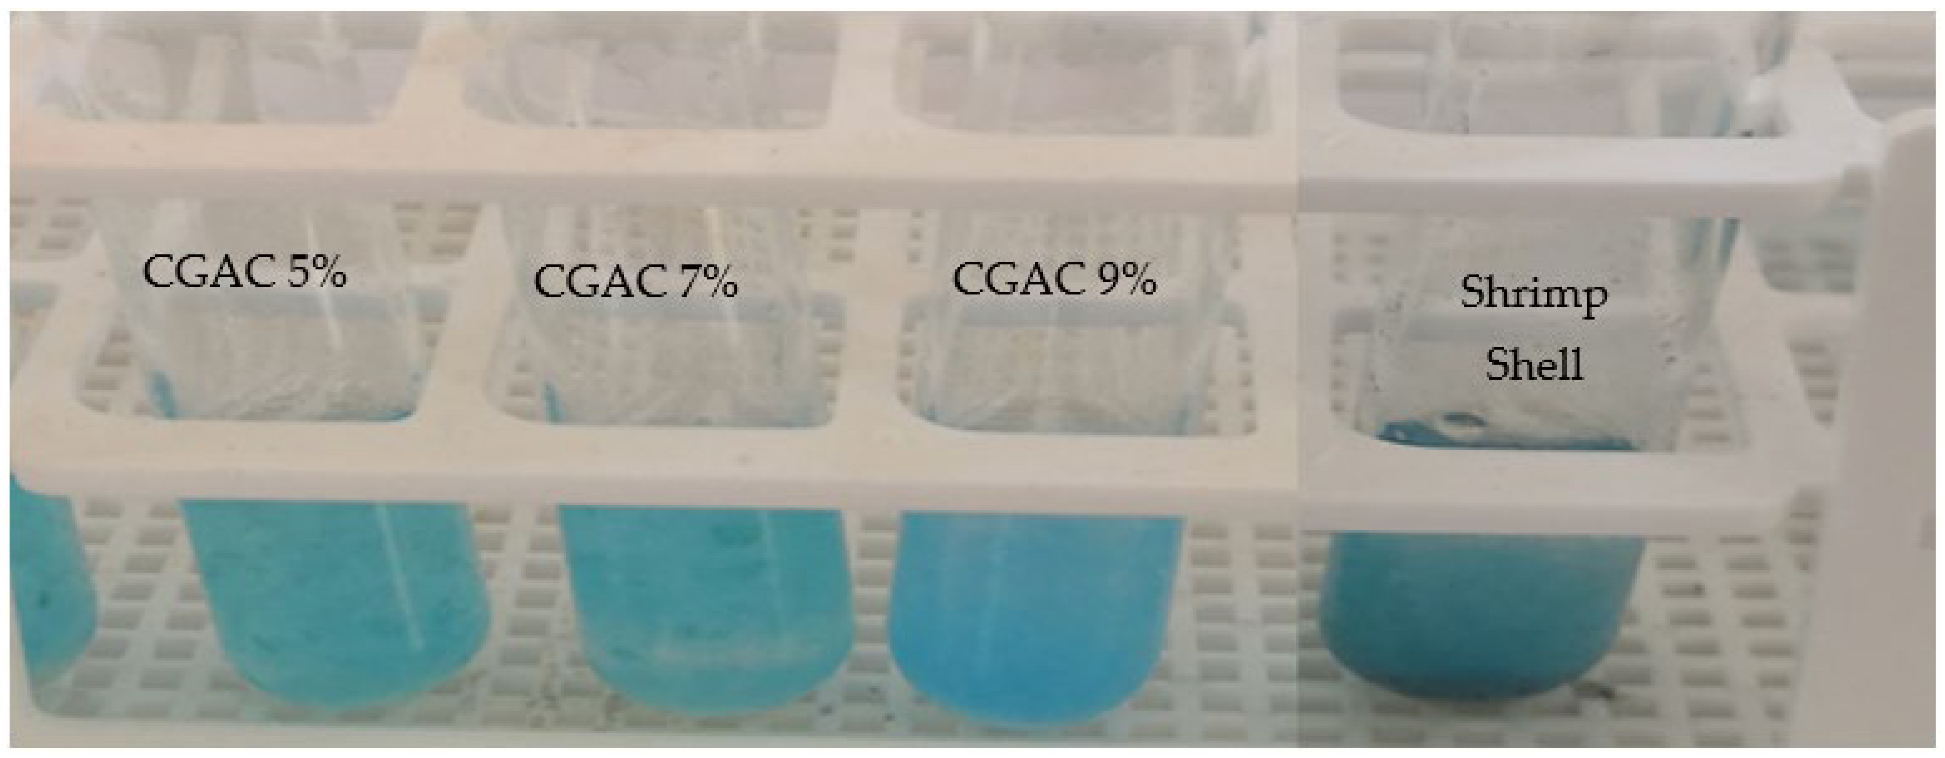
2.3. Congo Red Adsorption

The adsorption of CR onto the previously extracted chitin samples (CGAC 5%, CGAC 7%, and CGAC 9%) was studied in a batch system with a fixed volume of 50 mL of dye solution and stirring at 250 rpm. After each experiment, the adsorbent particles were separated from the solution via centrifugation. The CR dye concentration was measured using a UV-visible spectrophotometer (UV-1900i, Shimadzu, Japan) at λmax = 498.0 nm (Figures S1 and S2 in the Supplementary Materials). The following readings were interpolated at a rate of the Congo red curve from 0 to 80 mg/L. To maximize equipment sensitivity, absorbance measurements were consistently recorded at their respective maximum values. Subsequently, we employed a global mass balance to assess the adsorption efficiency at different time intervals (qt, mg/g), equilibrium adsorption capacities (qe, mg/g), and removal percentages (RE %) as given by Equations (3) and (4), respectively:
q e = C i C e m V
R E   % = C i C e 100 100
where Ci and Ce denote the initial and equilibrium concentrations of CR (mg/L), respectively. m and V represent the weight of the chitin samples (g) and the volume of CR (L), respectively [31]. The effects of adsorbent dose, temperature, and pH were examined.

2.4. Adsorption Isotherms

Multiple isotherm models are available for characterizing the equilibrium of the adsorption process. The Langmuir and Freundlich isotherm models [32,33] were used to evaluate and model the adsorption equilibrium. The coefficient of determination (R2) was used to statistically analyze the experimental data. The Langmuir equation is expressed as Equation (5):
q e = q m K L C e 1 + K L C e
where qm (mg/g) and KL (L/mg) represent the Langmuir constants associated with the maximum adsorption capacity of adsorbents and the affinity between the adsorbate and adsorbents, respectively. On the other hand, qe (mg/g) and Ce (mg/L) denote the amount of adsorbed dye per unit weight of adsorbent and the unadsorbed dye concentration in the solution at equilibrium, respectively. Furthermore, using the Langmuir isotherm, the constant known as the separation factor (RL) described by Equation (6) was calculated [34,35] as follows:
R L = 1 1 + K L   C i
where Ci (mg/L) designates the initial dye concentration, while KL (L/mg) represents the Langmuir constant associated with the adsorption energy. The Freundlich isotherm is depicted according to Equation (7):
q e = K F   C e 1 / n
where KF denotes the Freundlich constant and n (g/L) is a characteristic empirical parameter reflecting the affinity between the adsorbent and the adsorbate molecules.

2.5. Kinetics and Thermodynamic Parameters of the Adsorption Process

The CR adsorption onto chitin was studied using kinetics and thermodynamic concepts [36]. To explore the adsorption mechanism, the pseudo-first-order, pseudo-second-order, and intraparticle diffusion equations were employed [34,37,38].
Thermodynamic parameters were determined through the equilibrium constant and the Van ’t Hoff plot. To comprehend the adsorption nature of CR onto various chitin samples, the fundamental thermodynamic characteristics, including entropy change (ΔS), enthalpy change (ΔE), and Gibbs free energy change (ΔG), were calculated during the adsorption using Equations (8)–(10) as follows:
R L = Δ G R T
Δ G = Δ H T Δ s
ln ( K c ) = Δ H R T + Δ S R
where R stands for the gas constant (8.314 J/mol/K) while T denotes the temperature in Kelvin. Kc represents the ratio of CAe (concentration of CR adsorbed on the adsorbent) to Ce (equilibrium concentration of CR in solution). [39].

2.6. Desorption Studies

To conduct the reusability test, 0.075 g of CR loaded on the chitin adsorbent was placed into 50 mL of ethanol, with 0.01 M aqueous solutions of H2SO4 and NaOH mixed for 45 min to find the best desorbing agent. The regenerated adsorbent was then removed and properly cleaned with deionized water in order to be neutralized before being dried at 80 °C for a subsequent cycle.

3. Result and Discussion

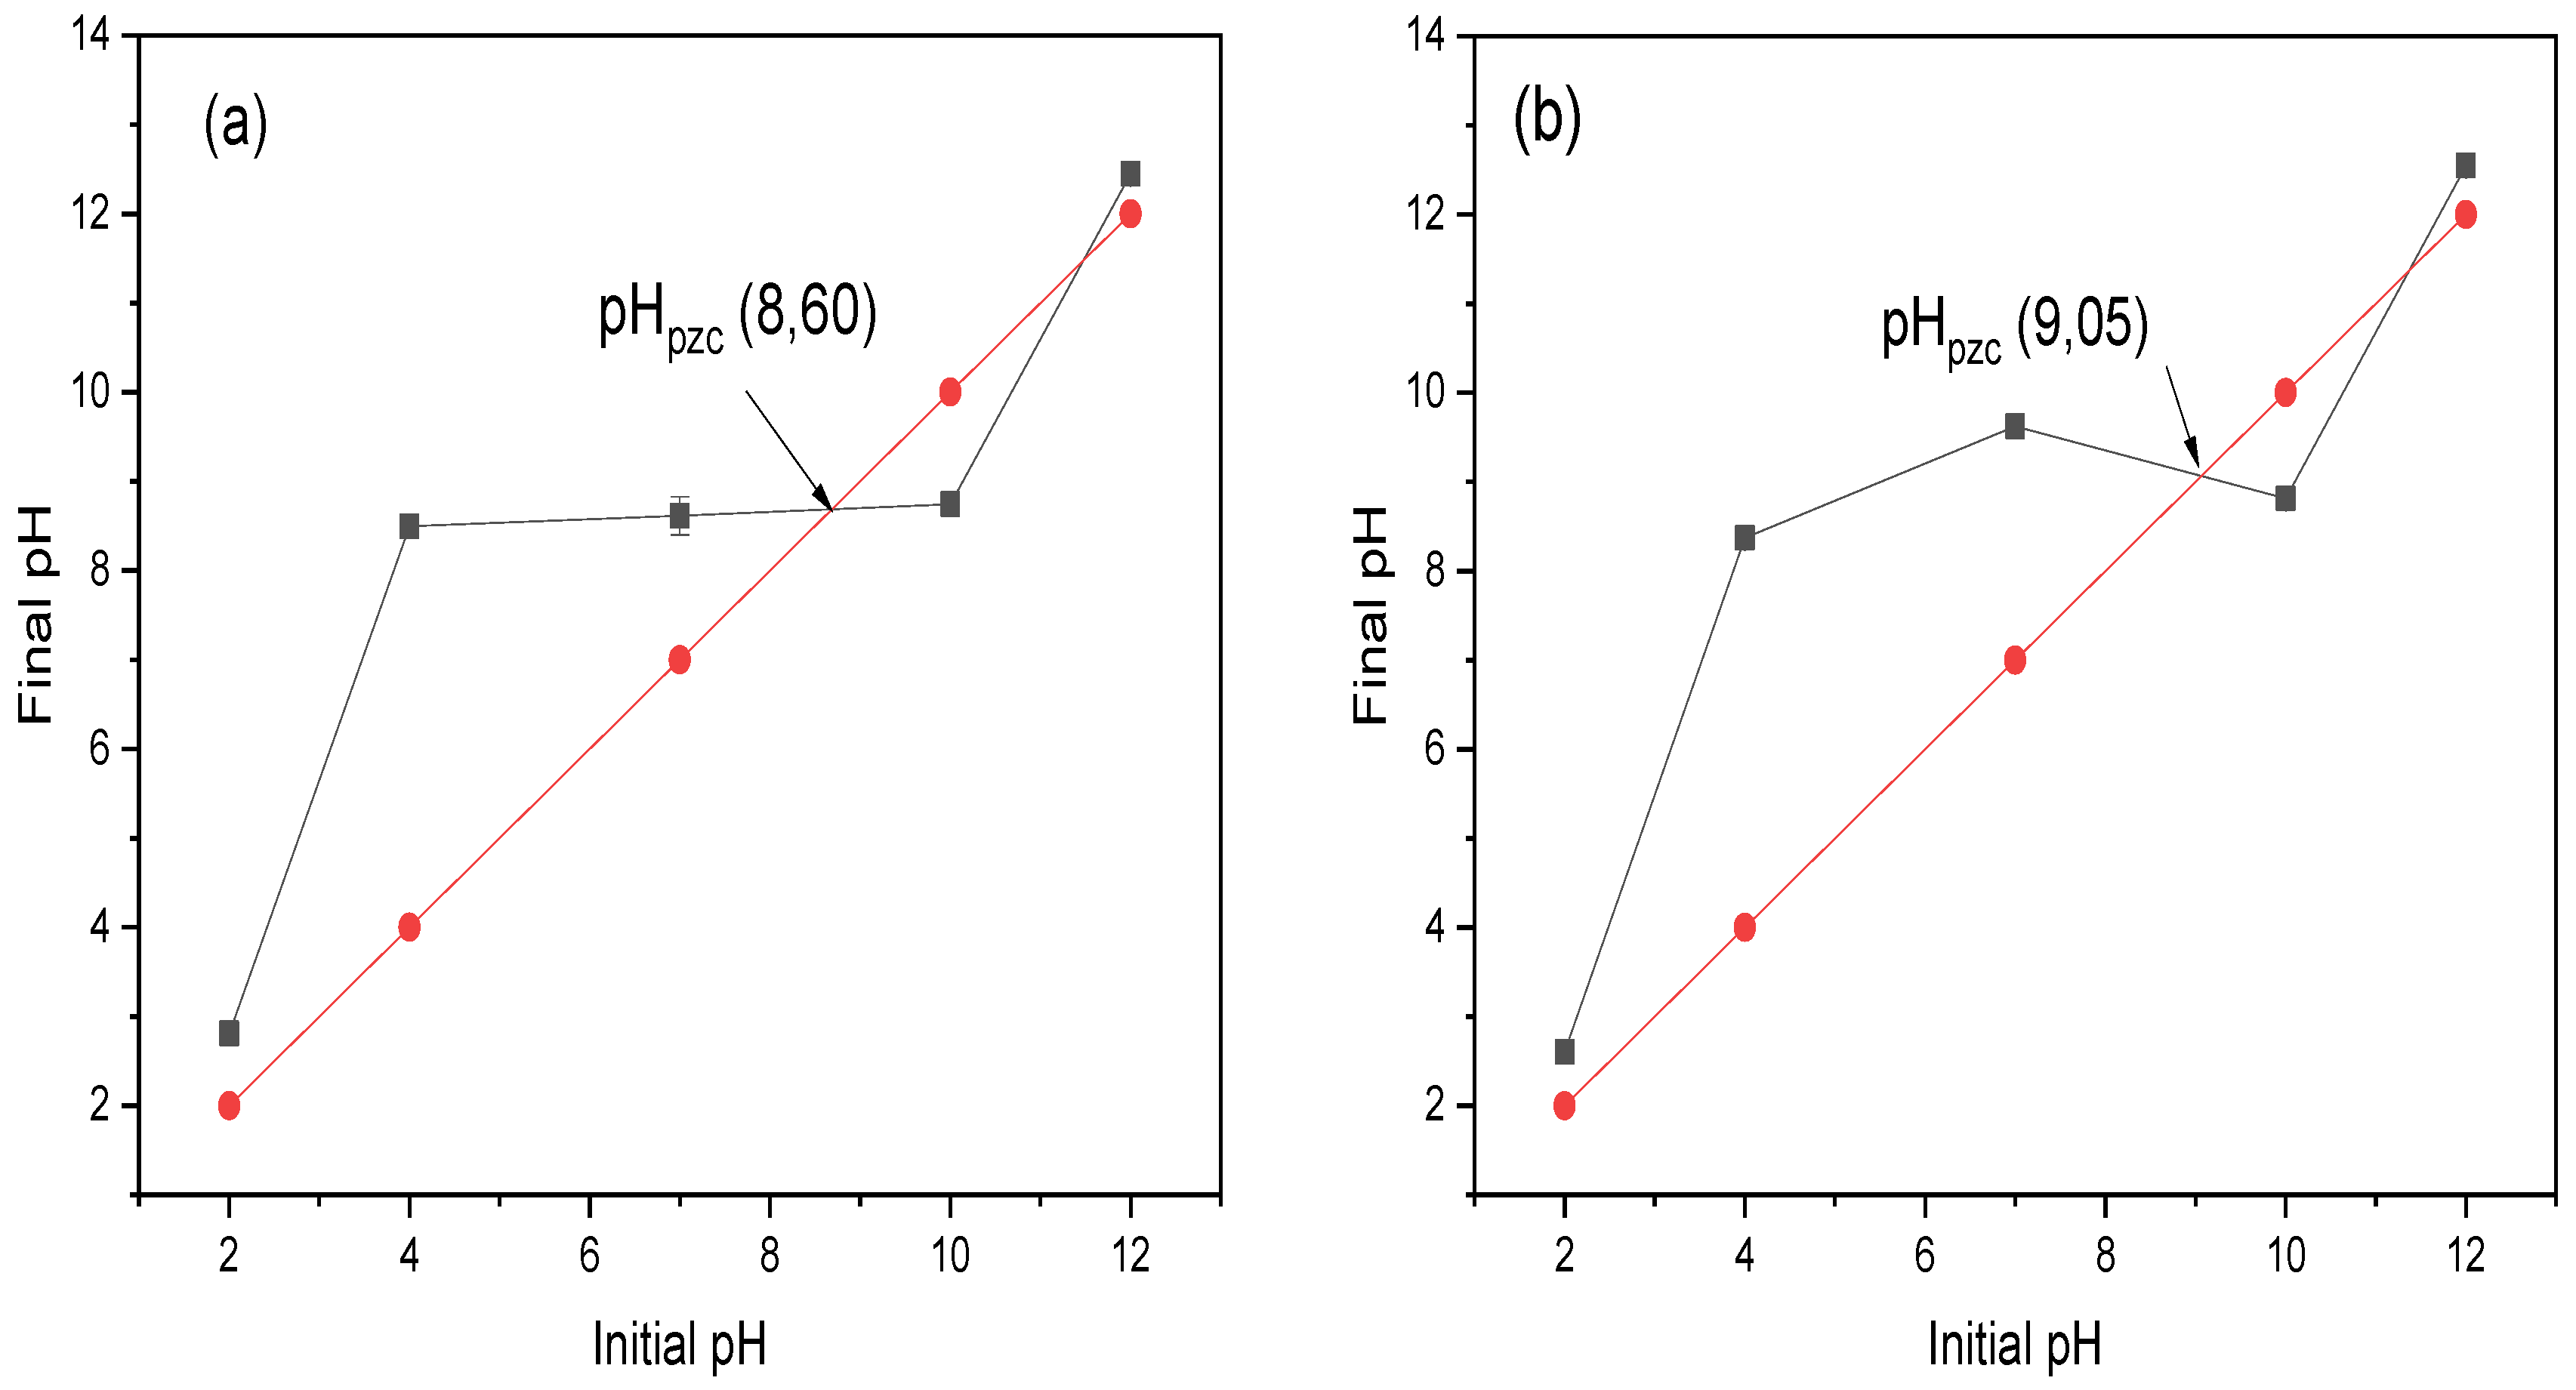
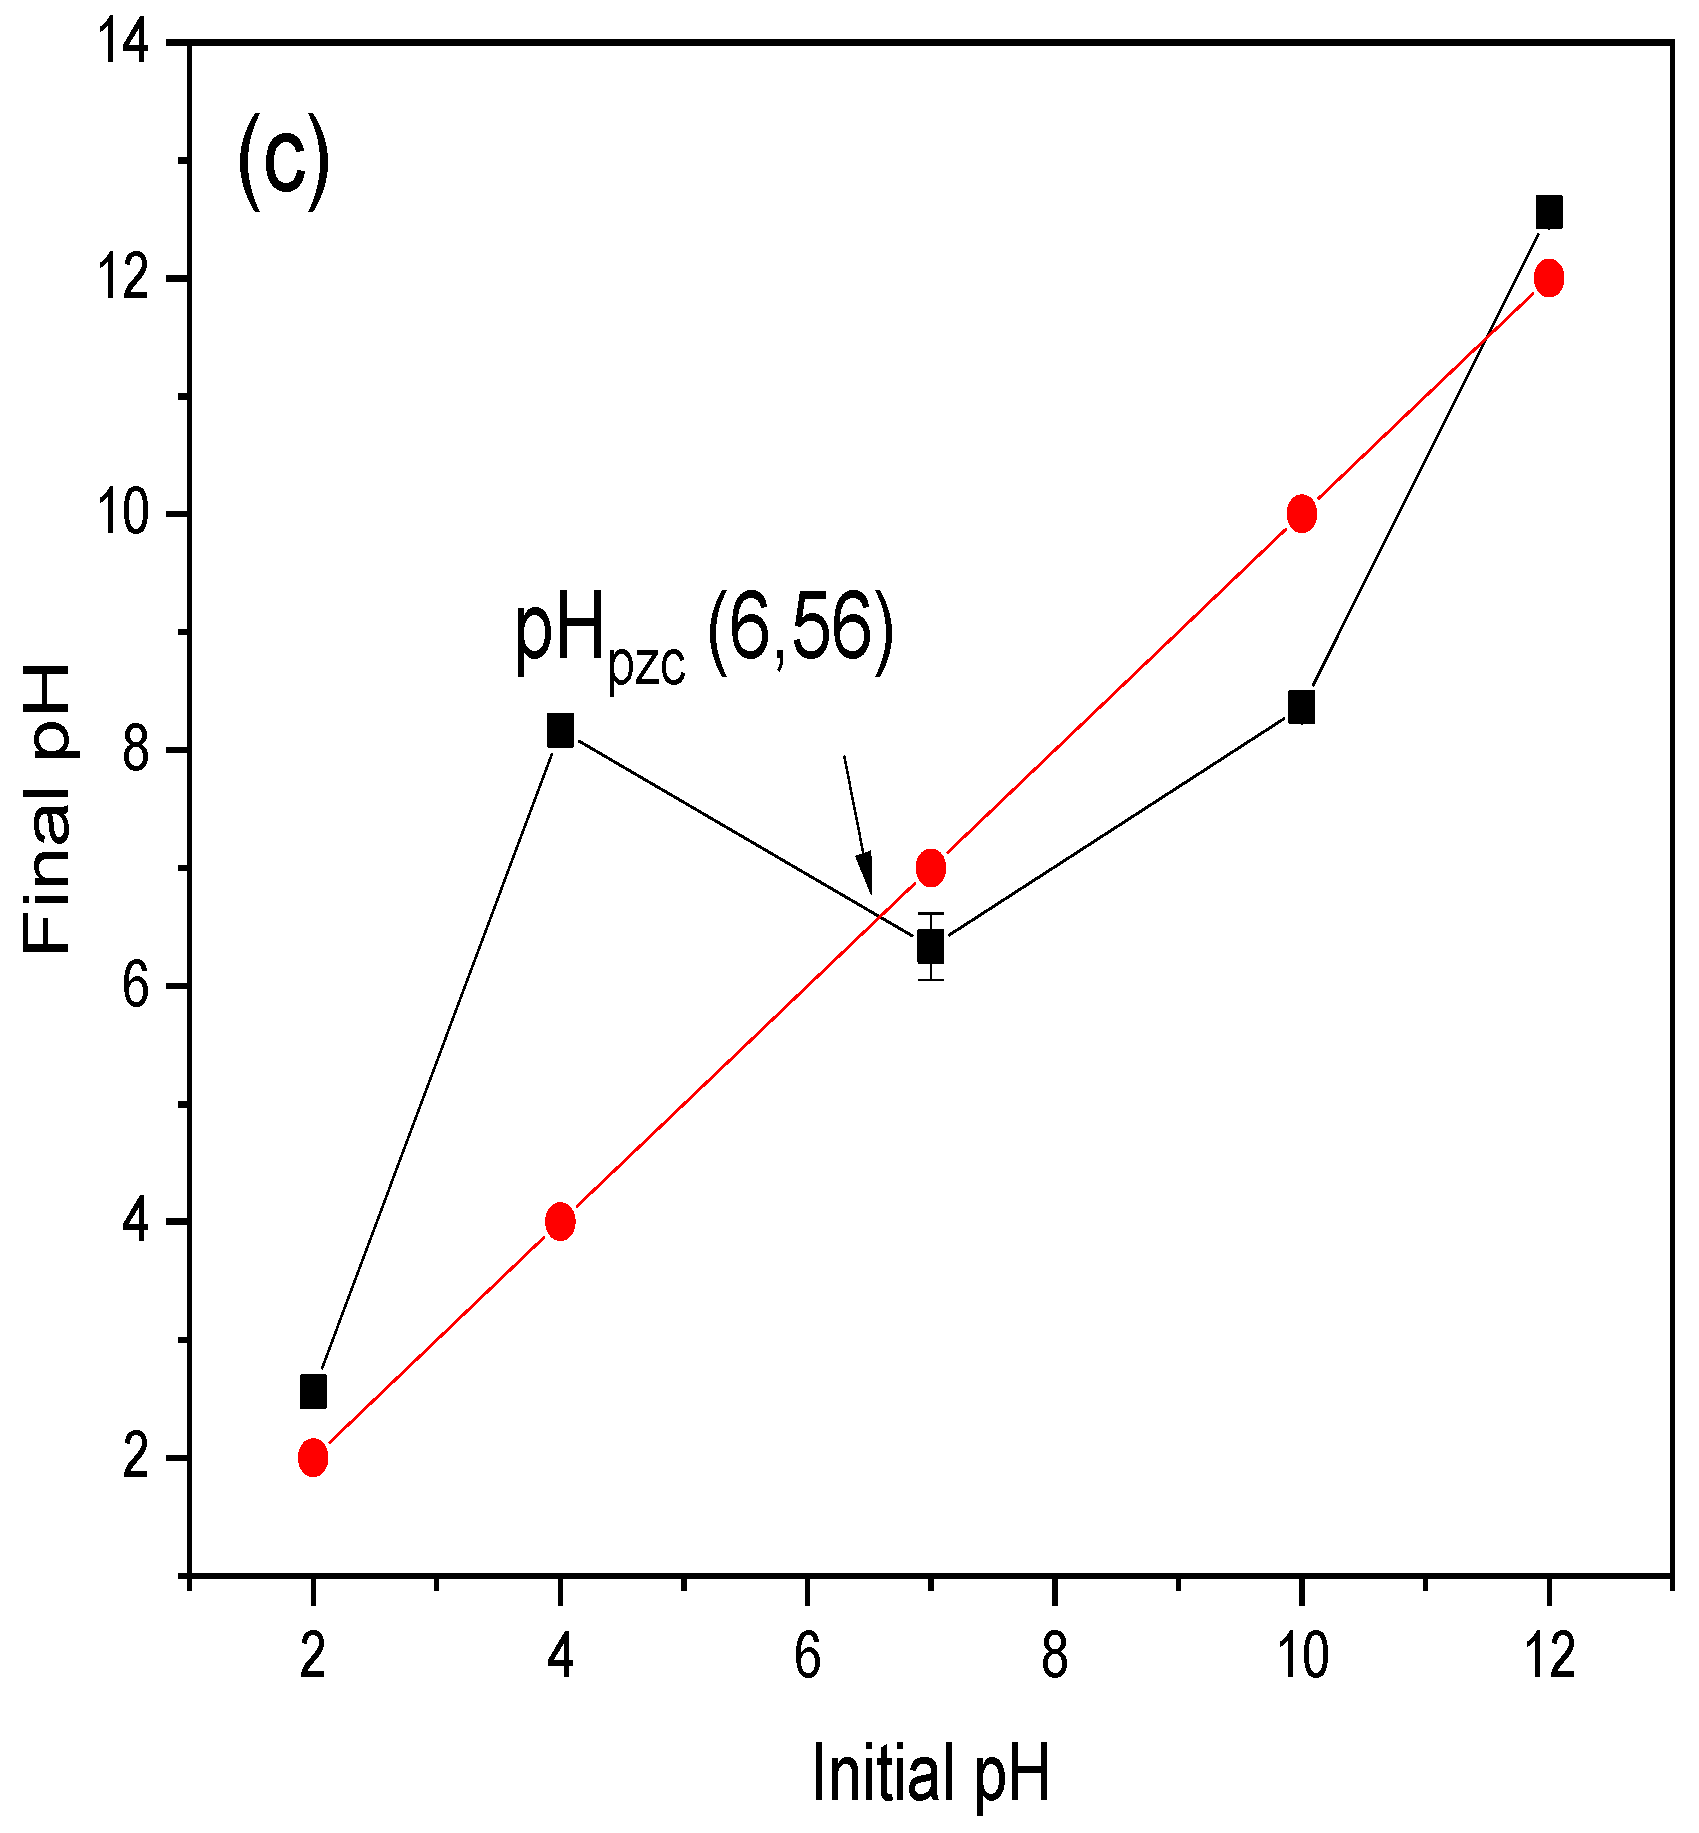
3.1. Characterization of Materials Adsorbents

3.1.1. Chitin Extraction and Composition

Different acid concentrations of 5%, 7%, and 9% were investigated for the extraction of chitin from shrimp shells using a glycero/citric acid co-solvent. When glycerol was employed as a deproteinization agent, the reaction temperature was set at 200 °C to ensure the effectiveness of deproteinization, while preventing the scission of peptide linkages [19]. To enhance the control over the process, blending was conducted at room temperature rather than at a high temperature. As illustrated in Figure 1, the chitin samples obtained using a co-solvent showed an absence of proteins when compared to shrimp shells. This suggests that the use of 5% citric acid was sufficient for deproteinization.
Table 1 displays the detailed chemical composition of the obtained chitins. The ash content in the three chitin samples ranged from 0.17 ± 0.34% to 0.35 ± 0.19%, while the protein content varied from 0.65 ± 0.41% to 1.79 ± 0.54%. This variation can be ascribed to the consumption of citric acid during the demineralization and deproteinization processes. These findings support the conclusion that the utilization of citric acid and glycerol in the chitin extraction process significantly impacts the molecular weight of the resulting chitin.
It can be observed that the yield of chitin decreased from 41 ± 0.23% to 28 ± 0.03% as the citric acid concentration increased. The high yield of CGAC 5% was attributed to the presence of the remaining CaCO3, water, and protein, as indicated in Table 1.
The chitin extracted using a citric acid/glycerol co-solvent exhibits low intrinsic viscosity, indicating a low molecular weight [40]. The concentration of acid significantly influences the molecular weight of chitin. As the acid concentration increased from 5% to 9%, the molecular weight of chitin decreased from 167 KDa to 113 KDa [22,41]. This reduction may be attributed to the partial hydrolysis of chitin under acidic conditions at higher concentrations.

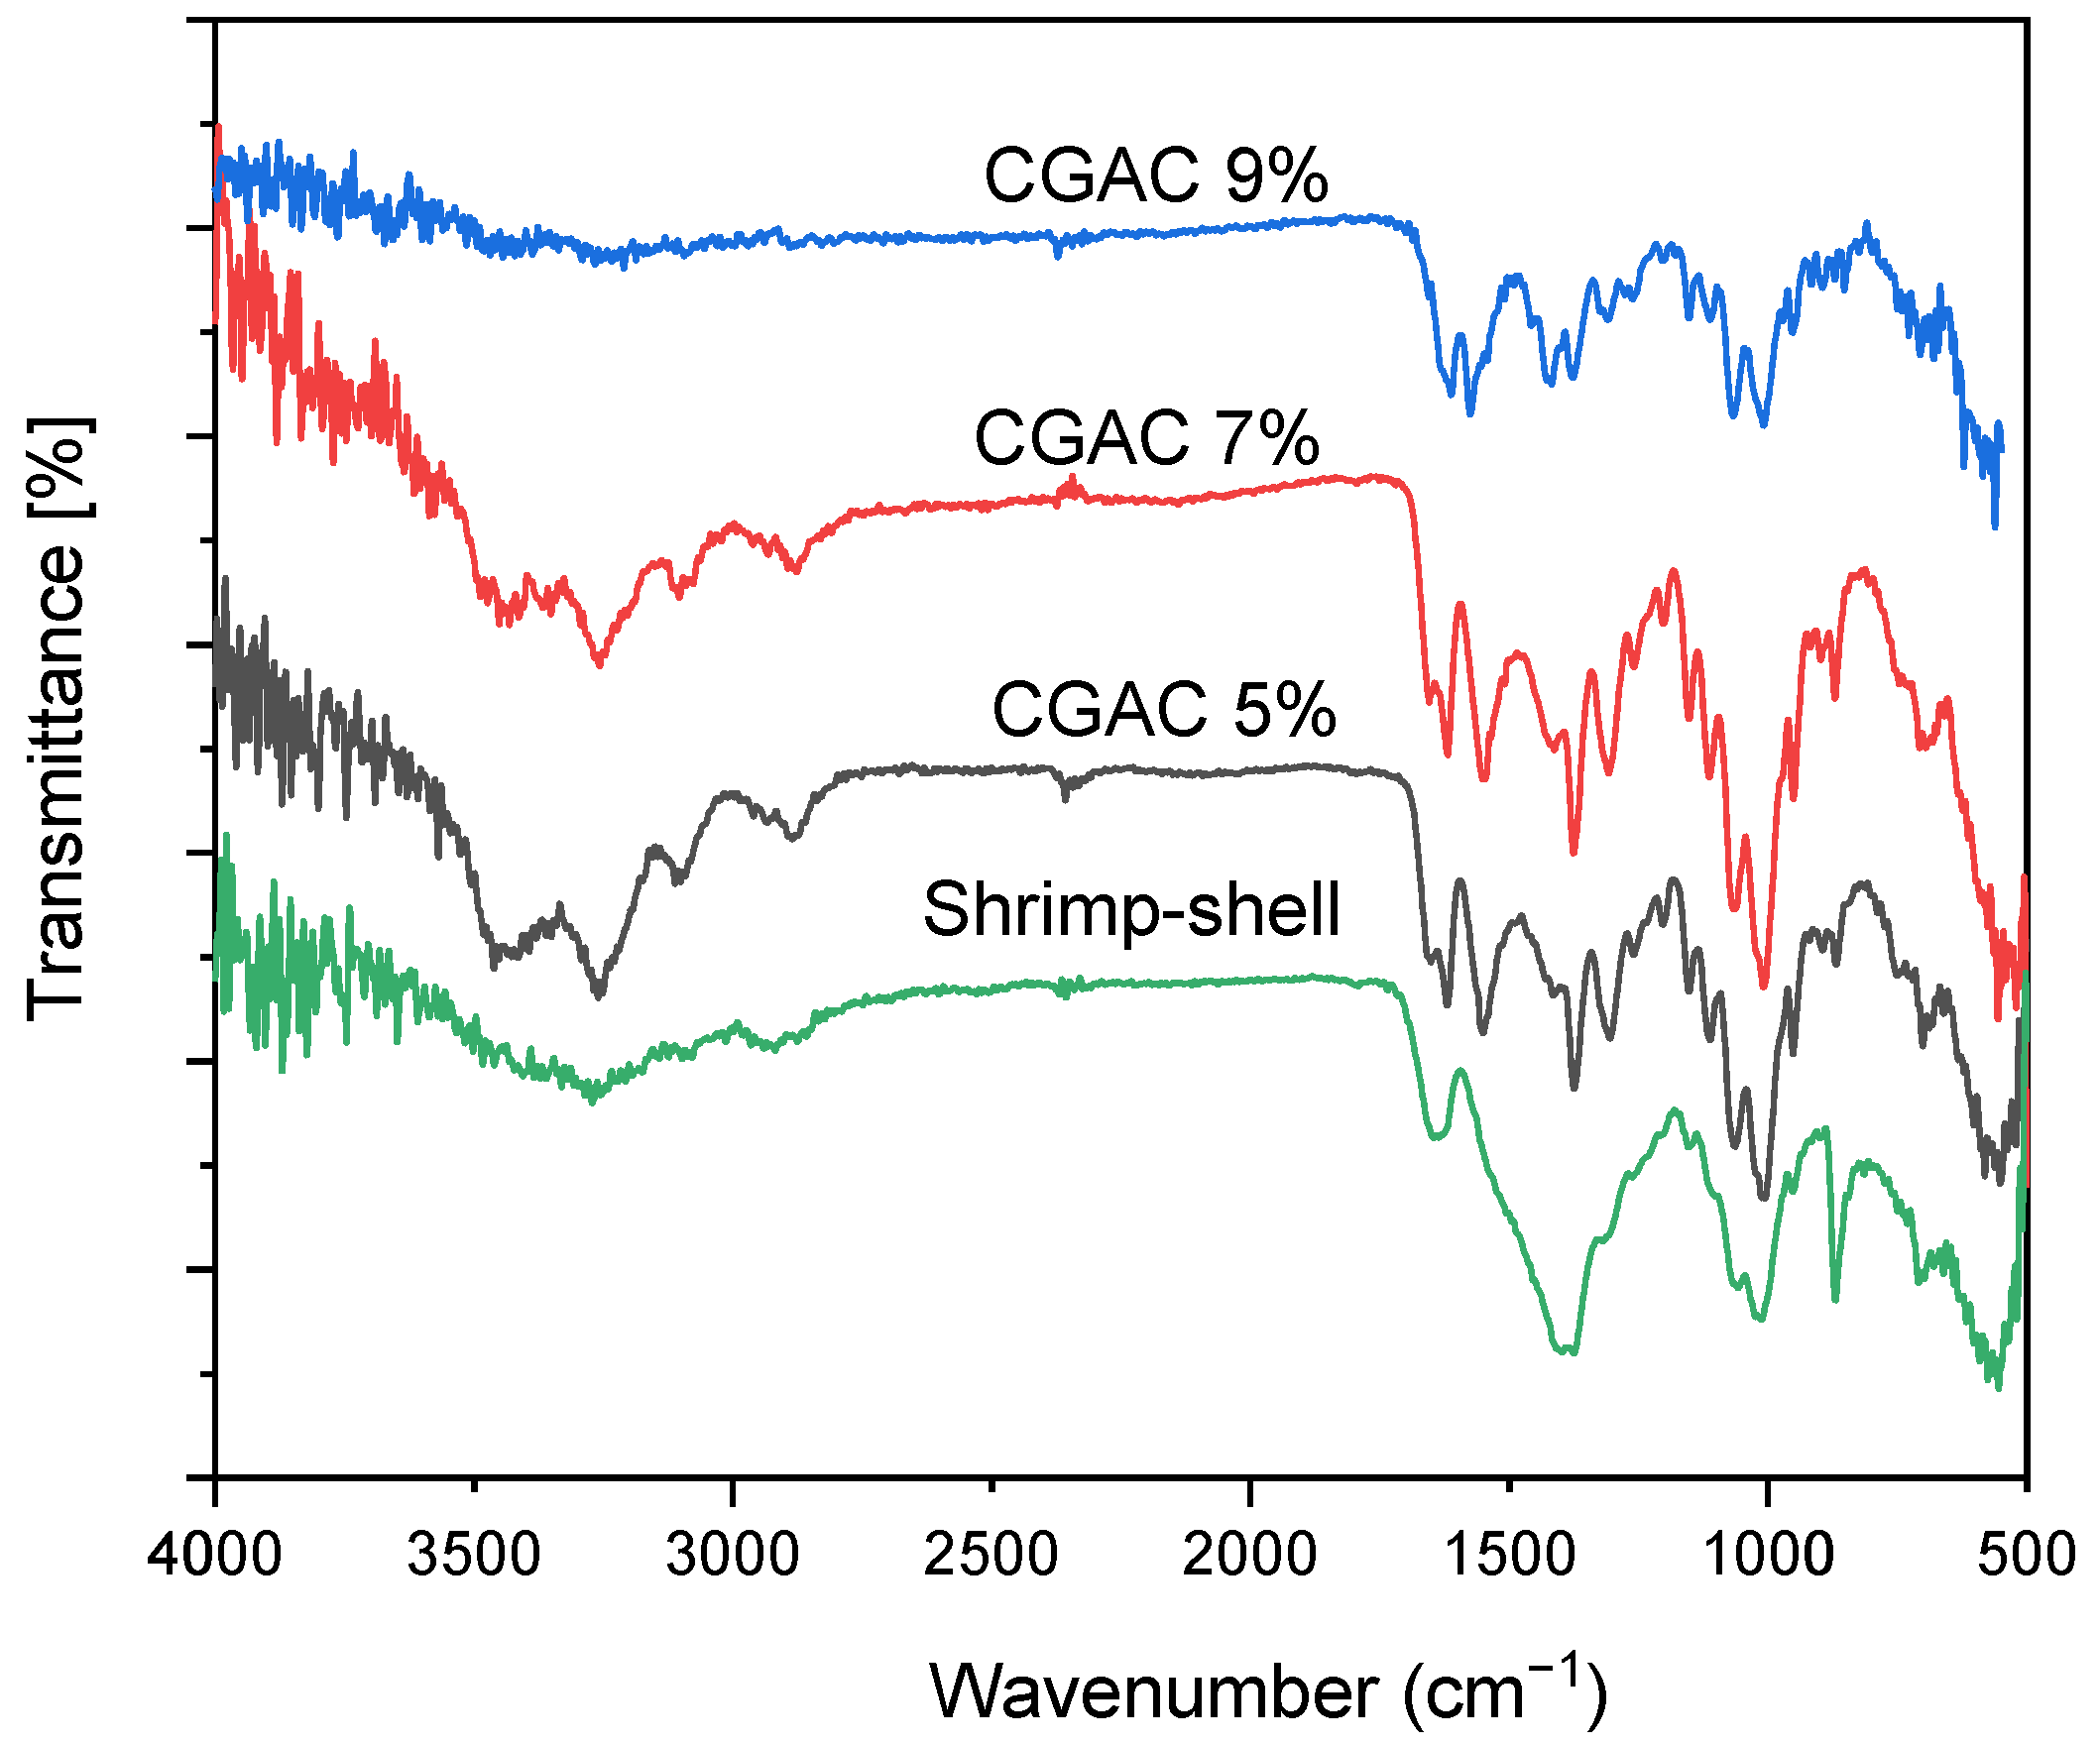
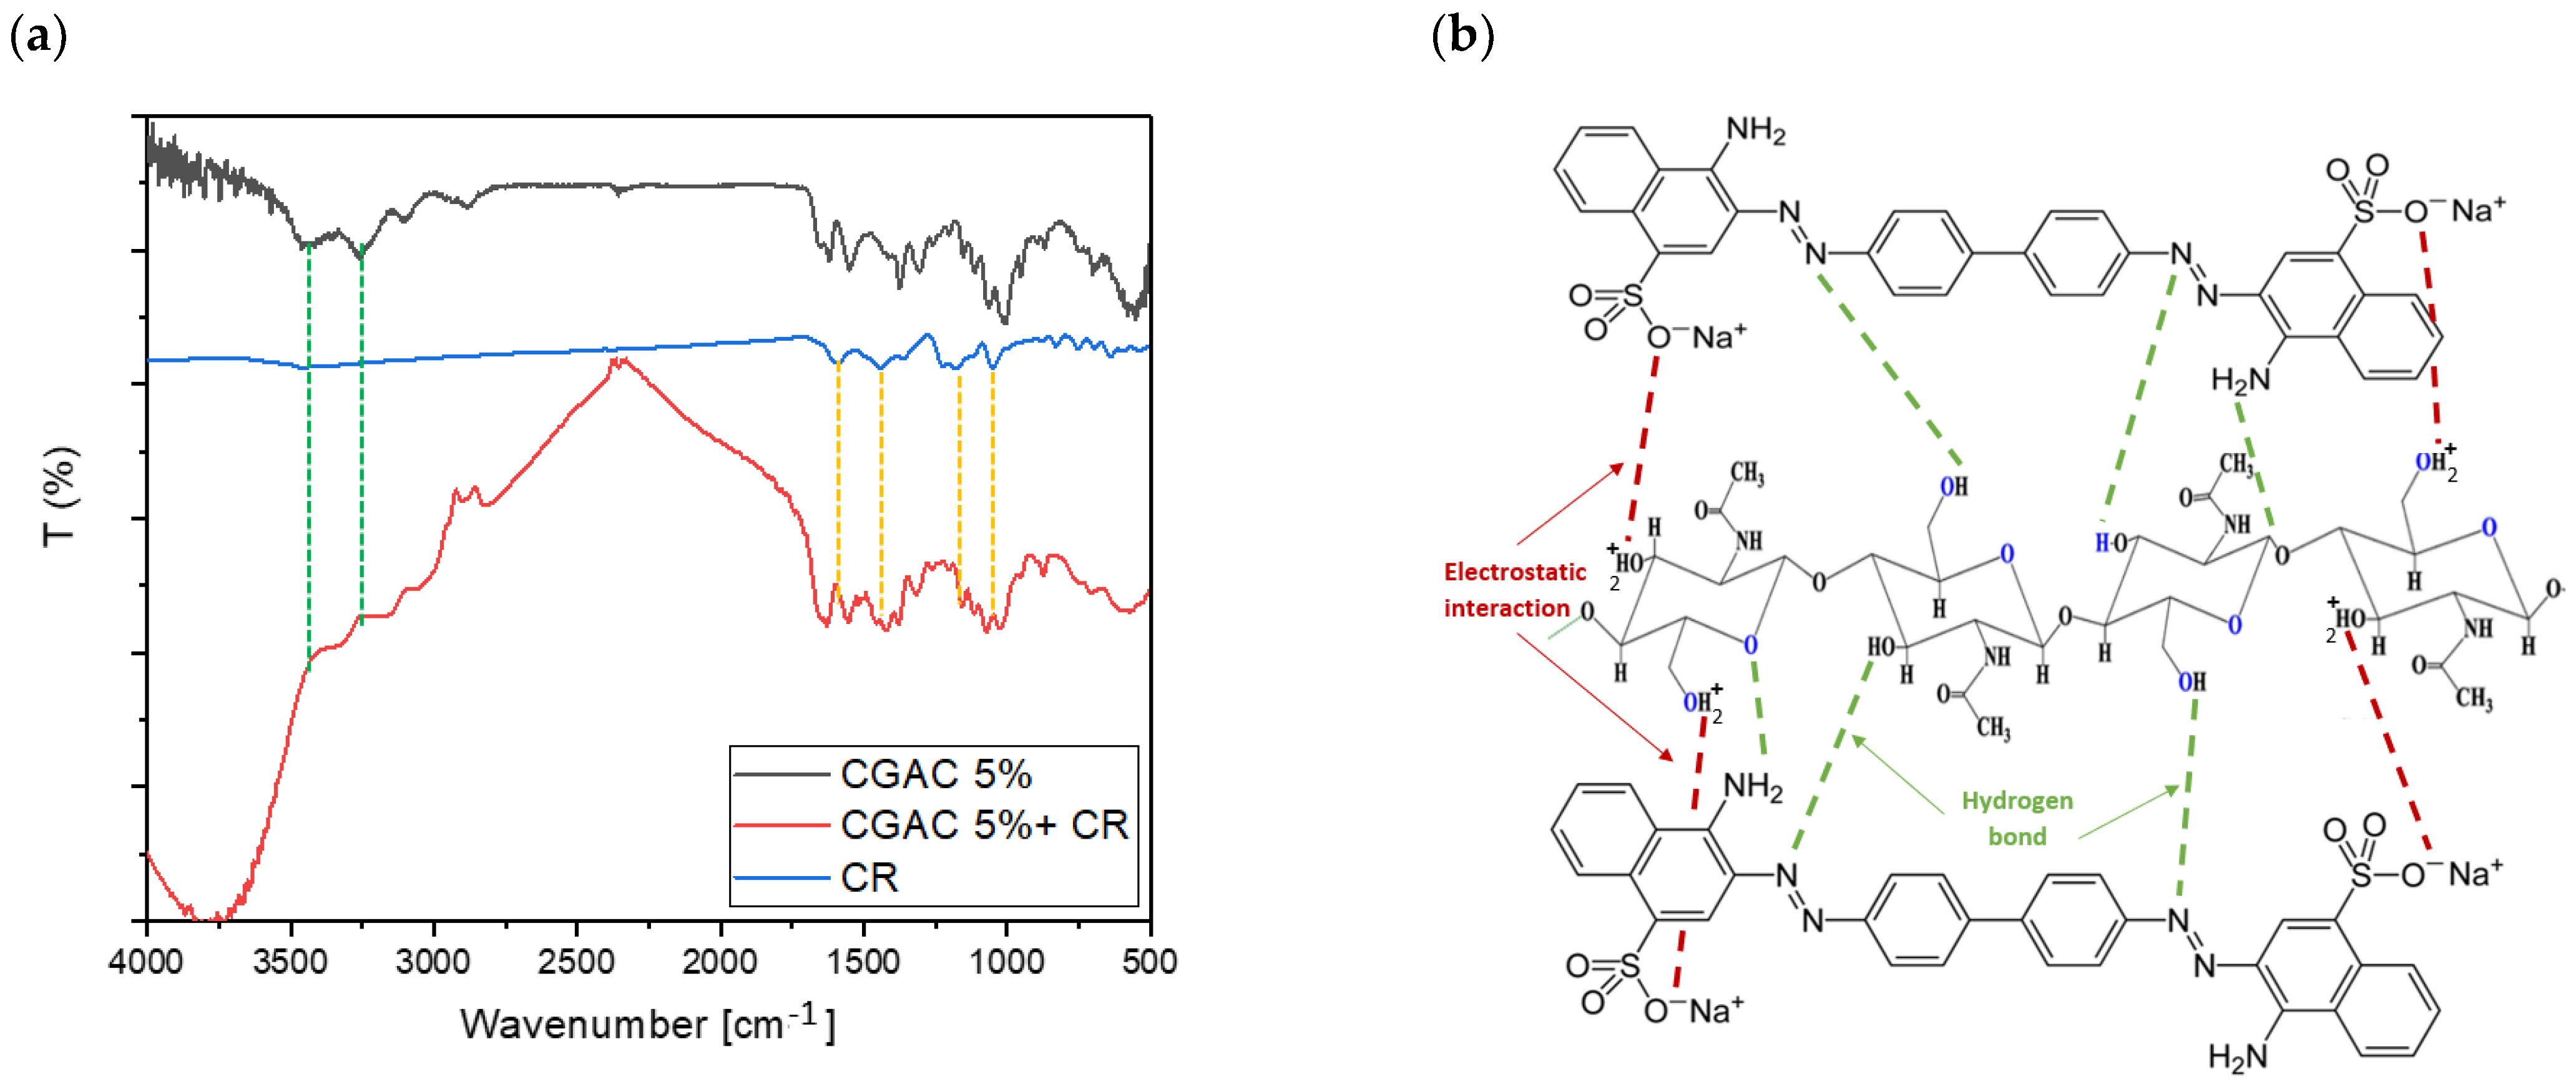
3.1.2. FT-IR Analysis

The FT-IR spectra of the extracted chitin samples and shrimp shells are depicted in Figure 2. The FT-IR analysis revealed the presence of characteristic bands of α-chitin at 1650 cm−1 and 1621 cm−1 due to the intermolecular (CO…HN–) and the intramolecular hydrogen bonds (–CO··HOCH2–), respectively [42]. Moreover, an amide II band was found at 1552 cm−1. The sharper peak at 3456 cm−1 is attributed to the O–H stretching vibration (C6-OH…O=C) [43].
Two adsorption bands at 3265 cm−1 and 3104 cm−1 are, respectively, attributed to the intermolecular hydrogen bond –C=O…H–N and the intramolecular NH groups [44,45]. An absorption peak at 2882 cm⁻1 corresponding to CH stretching was also observed.
In contrast, the spectrum of shrimp shells is significantly different from the co-solvent extracted chitin spectra. In the spectrum of shrimp shells, the amide I band remains unsplit due to the overlapping of the chitin amide I band with the amide peaks of proteins within the shrimp shells, showing the efficiency of glycerol/citric acid co-solvent in protein removal from the shrimp shells [26]. Furthermore, the band observed around 1420 cm−1 also confirms the successful removal of proteins from the structure and the completion of the deproteinization process [46].

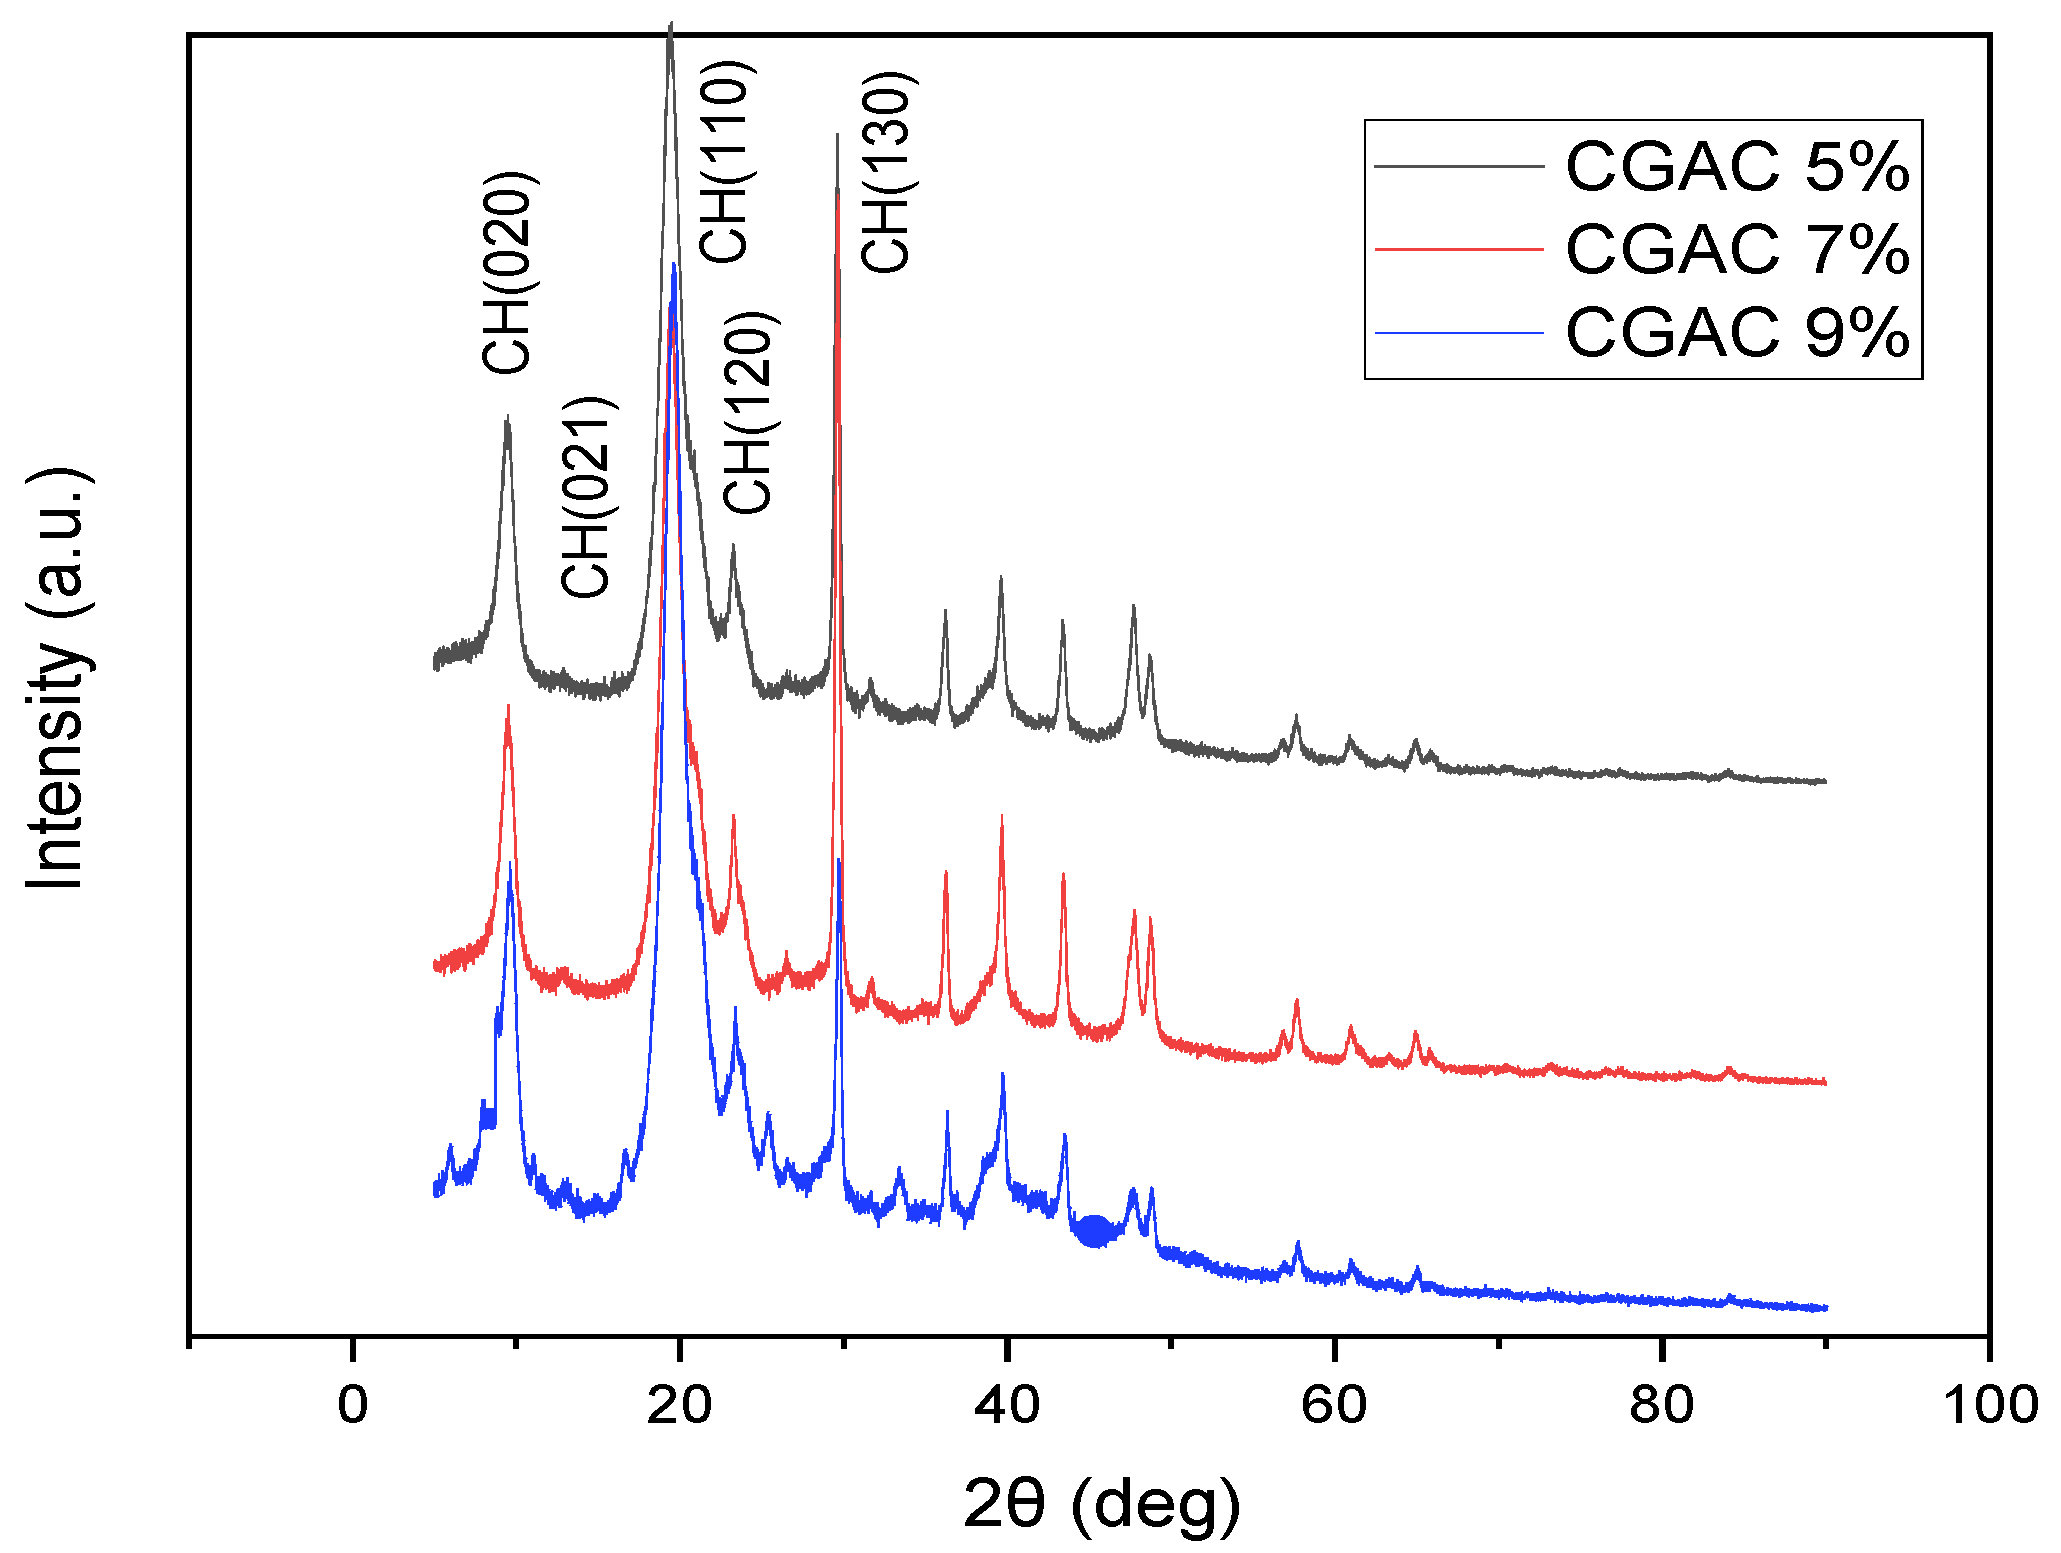
3.1.3. X-ray Diffraction Analysis of Chitin

The X-ray diffraction (XRD) data of the chitin samples are illustrated in Figure 3. The notable crystalline peaks related to chitin at 2θ values of 9.2° (020), 12.6° (021), 19.2° (110), 20.6° (120), 23.3° (130), and 26.3° (013) are ascribed to chitin (JCPDS card no: 39-1894) [47,48,49]. The absence of peaks associated with calcite suggests that the chitin is essentially pure within the limitations of the XRD analysis and is free from mineral phases. Moreover, the CrI values of chitins are 97.97% for CGAC 5%, 97.67% for CGAC 7%, and 96.96% for CGAC 9% [17].

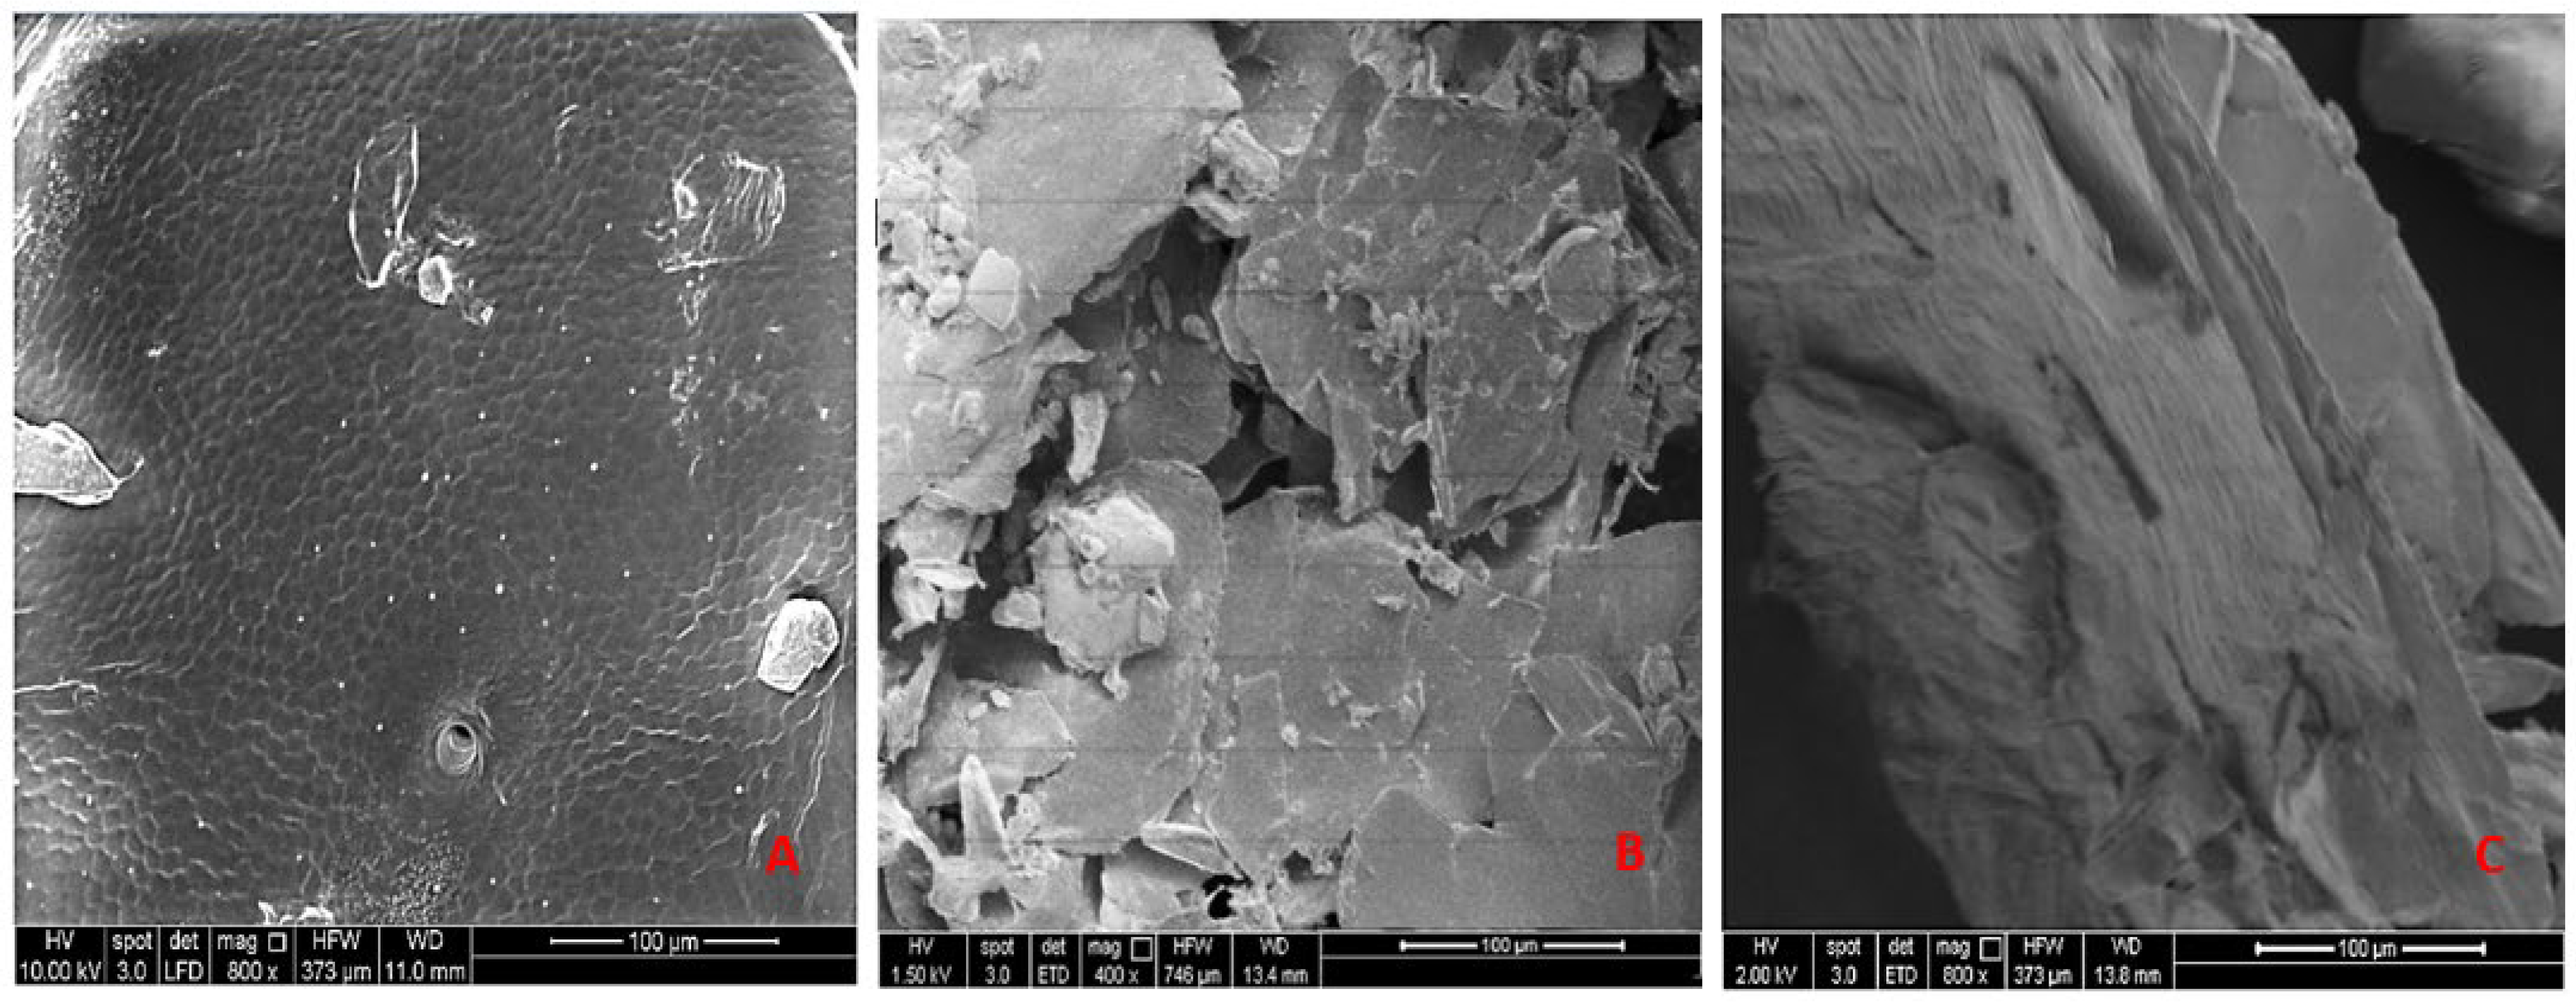
3.1.4. Scanning Electron Microscopy (SEM)

Surface morphology is an essential factor that greatly influences the optimal utilization of chitin and its derivatives. Chitin can be categorized into five primary types based on its surface morphology [50].
As shown in Figure 4A, CGAC 5% exhibited a hard, flat, and homogeneous surface with no visible pores. In contrast, CGAC 7% displayed a rough and uneven surface. Furthermore, for CGAC 9%, a combination of nanofibers and pores was observed. The morphology of CGAC 9% contributed to the high efficiency in removing CR, which is in agreement with the previous reports indicating that chitin with a fibrous surface structure is suitable for use in textile applications [51,52].

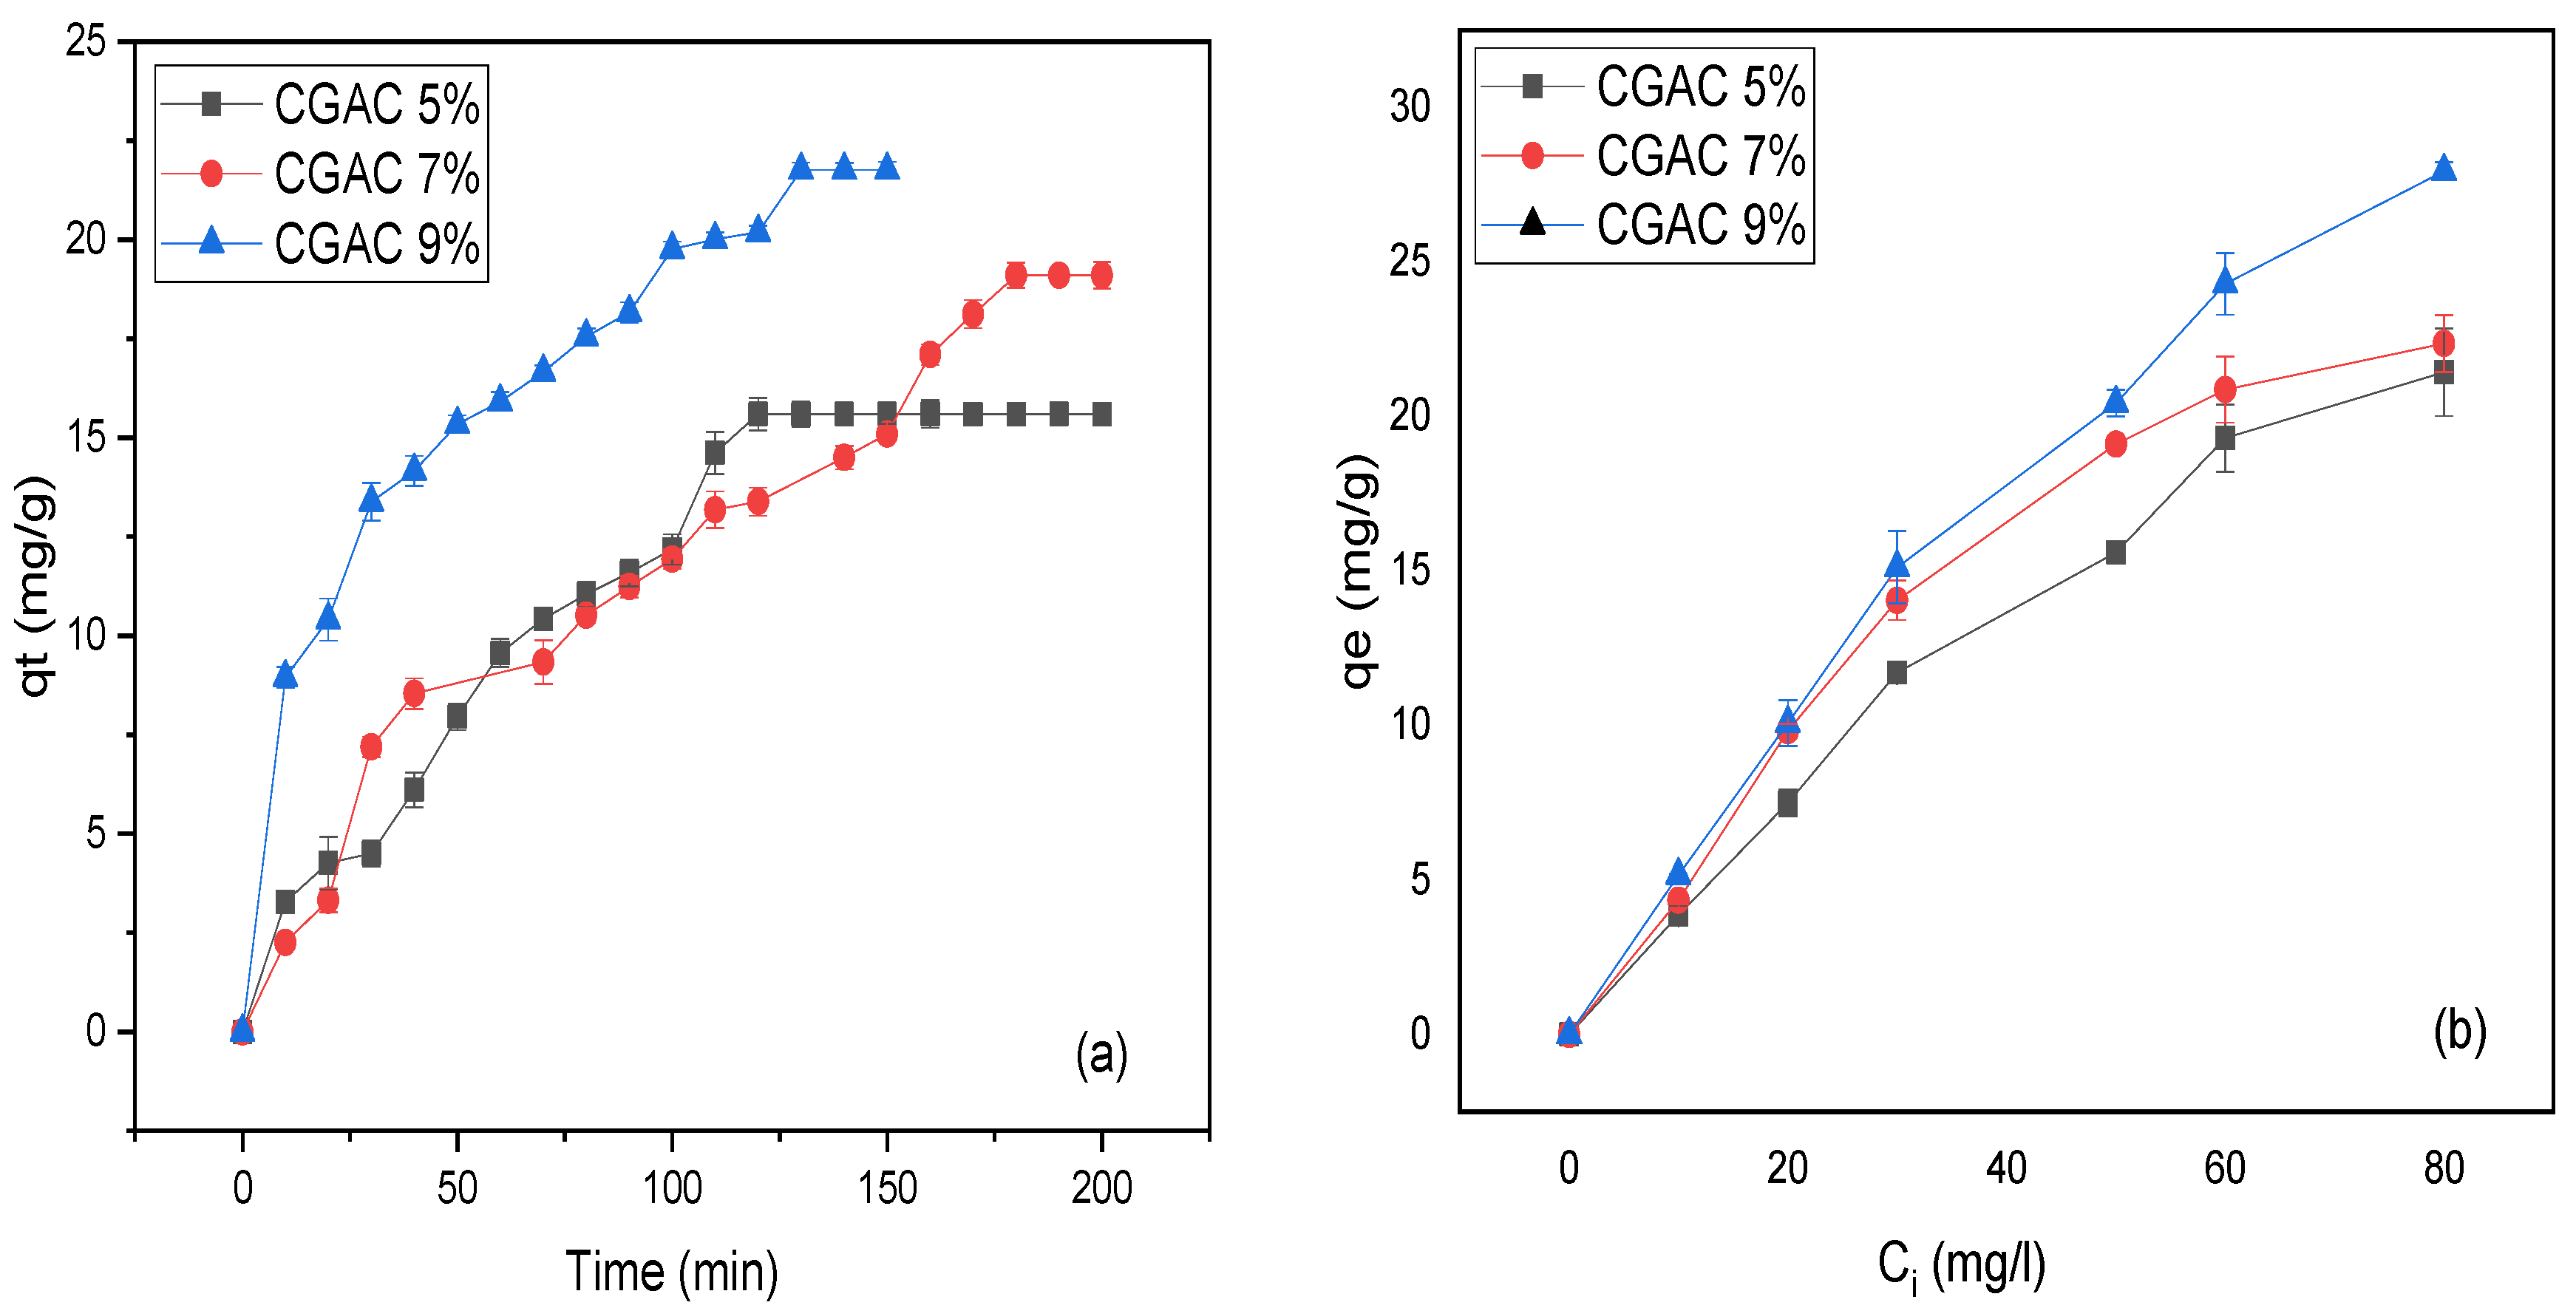
3.2. Effect of Initial Concentration, pH, and Temperature in CR Dye Adsorption

The impact of contact time on the adsorption of CR dye on chitin samples is presented in Figure 5a. The results showed that the adsorption efficiency increased with increasing contact time and the equilibrium reached with 120 min as the best value for CGAC 5%. The effect of the initial concentration of CR on the adsorption process using different chitin samples is depicted in Figure 5b. As the CR concentration increased from 10 to 80 mg/L, the qe (equilibrium adsorption capacity) for various chitin samples showed an ascending trend. This is attributed to the higher CR concentrations, providing more opportunities for adsorption on the chitin surface area before reaching a saturation of the active sites [53]. By overcoming mass transfer resistance and increasing the driving force between the soluble phase and the adsorbent, the adsorption process is enhanced. Additionally, the greater number of collisions between CR and the adsorbent further enhances the adsorption process [54].
Notably, CGAC9% exhibits a higher adsorption capacity compared to CGAC7% and CGAC5%, indicating that the chitin extracted with a higher acid concentration generates more active sites. This can be attributed to the increased number of amino groups present in the chitin samples, which serve as excellent sites for cation adsorption. Additionally, the presence of an amorphous region within the chitin structure contributes to an increase in the number and size of pores on the specific surface area of chitin, thus promoting CR adsorption [55,56].
The adsorption of anionic dyes is significantly influenced by the pH of an aqueous solution, affecting both the binding sites on the adsorbent surface and the ionization of the dye molecules. When the solution pH is below pHpzc (pH < pHpzc), the surface of the adsorbent becomes positively charged, whereas at pH > pHpzc, it becomes negatively charged [57]. The results for the determination of pHpzc of the chitin samples are shown in Figure 6.
The pH effect on the adsorption of CR with different chitin samples is presented in Figure 7a. The equilibrium CR quantities were determined at various pH solution values ranging from 2 to 12. The most effective dye removal occurred in acidic conditions, with the highest removal rates observed at pH 2 for CGAC 5% and CGAC 7%.
For CGAC 9%, the adsorption capacity decreased from 25.22 ± 0.29 mg/g (75.67% removal efficiency) to 19.73 ± 0.94 mg/g (59.22% removal efficiency) as the pH increased from 2 to 12. The maximum adsorption capacity was observed at pH 4. The effect of pH can be explained by the different interactions between CR and CGAC 9%, which are related to surface charge [58]. The acidic environment enhanced the dye absorption on chitin. This was achieved by not only splitting CR into polar groups (R-SO3−) but also due to the presence of a positive charge on the chitin surface, leading to an electrostatic interaction between protons and (R-SO3). However, at high pH values, the chitin surface became negatively charged, and this resulted in an electrostatic repulsion between the negative charged surface and the anionic dye. Similar findings have been reported for the adsorption of CR on activated carbon [59,60,61] and pine bark [62]. Figure 7b shows that the highest adsorption capacity for the chitin samples was achieved at 50 °C. The response surface analysis indicated that the optimal conditions for removing Congo red were found to be 50 °C, pH 7, and a contact time of 130 min.

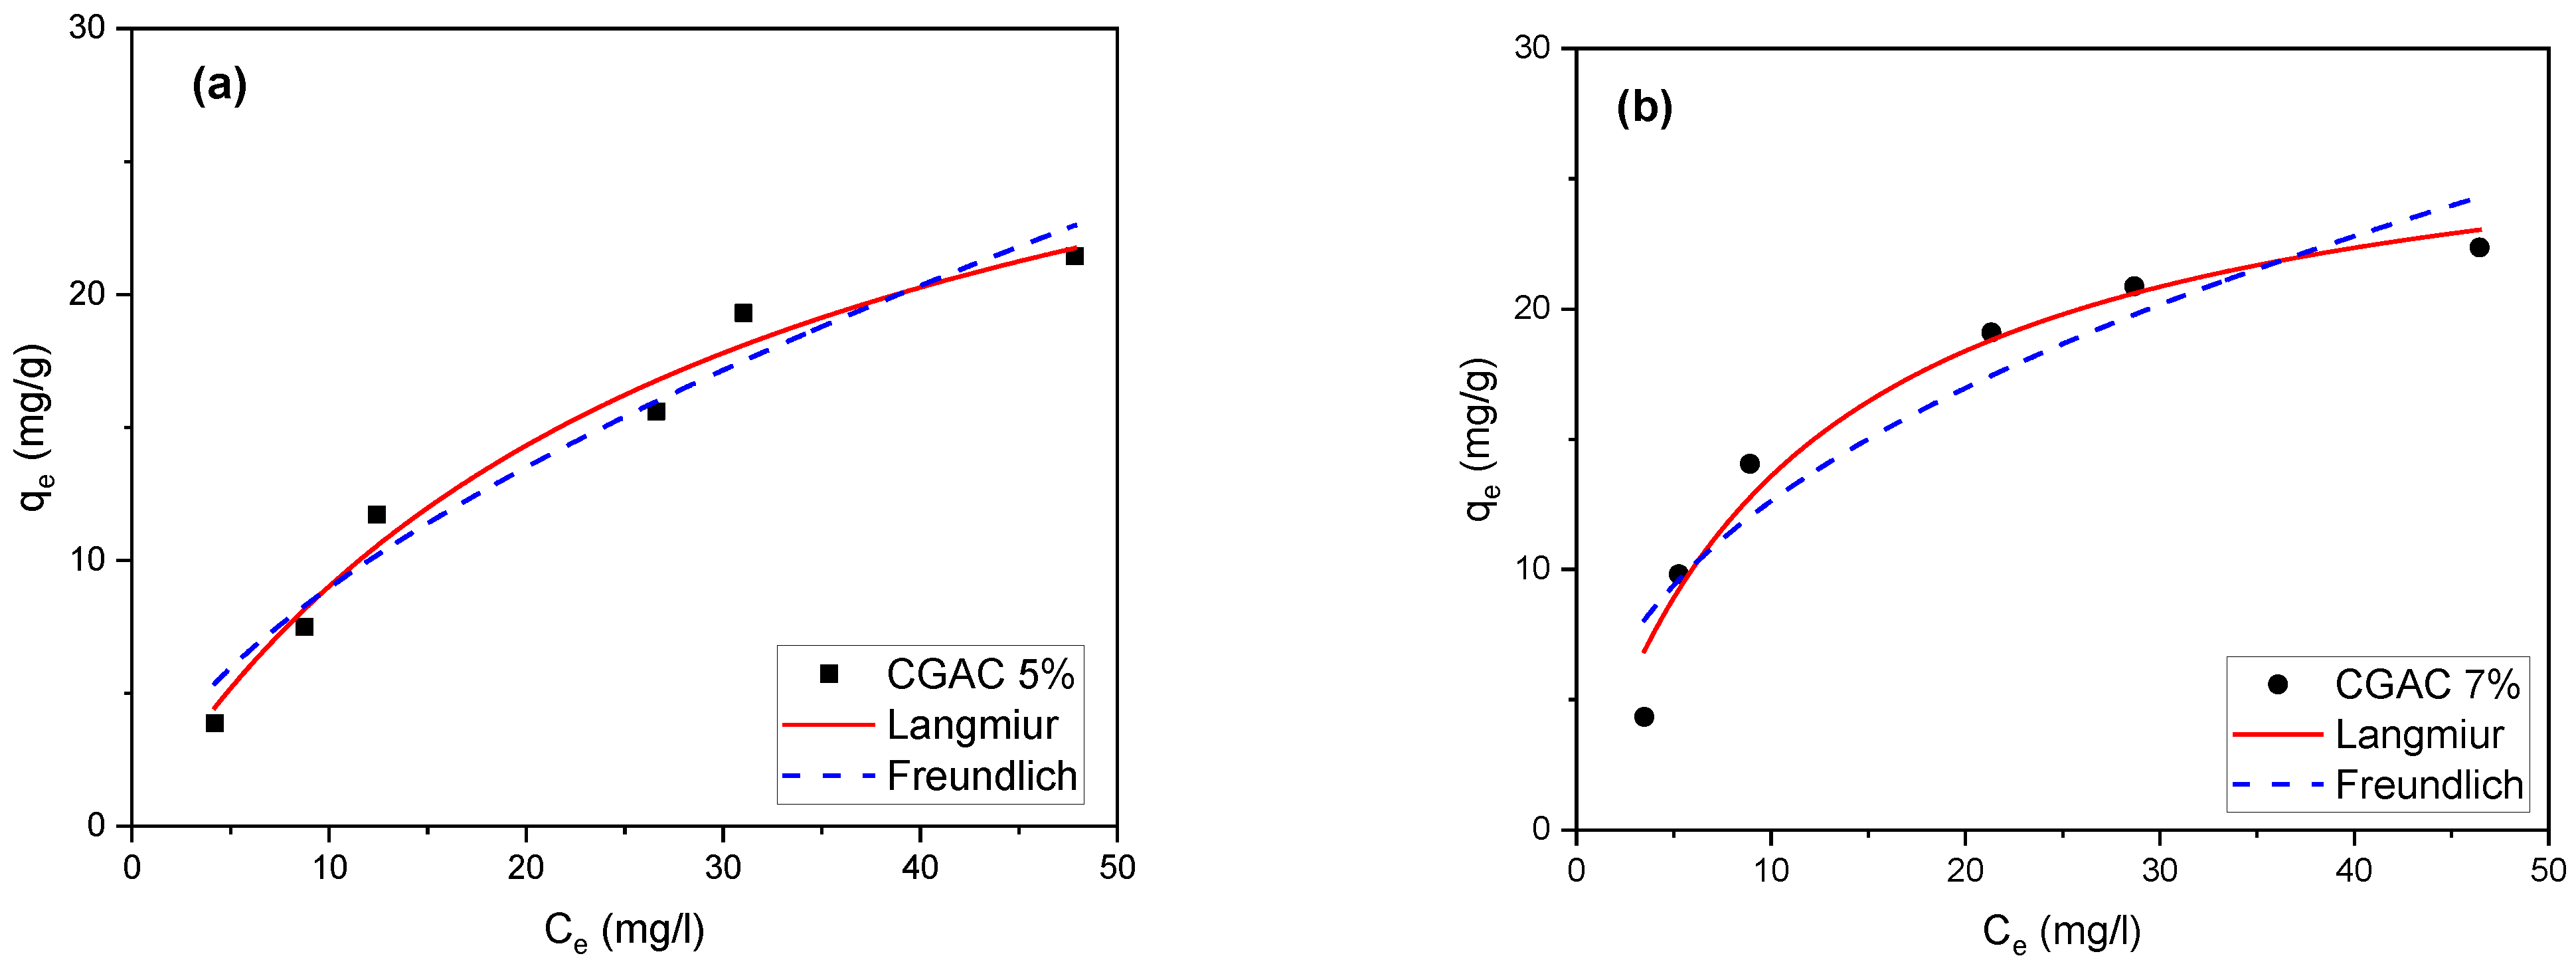
3.3. Adsorption Isotherms Studies

The adsorption process was investigated through isotherm analysis to elucidate the equilibrium interactions between the adsorbent and the adsorbate. Figure 8 illustrates the equilibrium adsorption of CR onto a chitin substrate, represented as qe versus Ce. The plots of qe versus Ce were generated using both the non-linear forms of the Langmuir and Freundlich isotherm models.
The model parameters were determined through non-linear regression analysis of the respective isotherms, and their values are reported in Table 2.
The coefficient of determination (R2) was significant for both models. However, the Langmuir isotherm provided a superior fit to the experimental data, indicating a better overall agreement. The Langmuir maximum monolayer adsorption capacities were 28.483 mg/g, 34.674 mg/g, and 36.123 mg/g for CGAC7%, CGAC5%, and CGAC9%, respectively. In addition, the values of RL and 1/nf fell within the range of 0–1, indicating that the adsorption of CR onto the chitin samples was favorable according to both the Langmuir and Freundlich models [63,64].
Both the Langmuir and Freundlich models clearly show that the maximum adsorption capacity of CGAC 9% exceeded that of CGAC 5% and CGAC 7%, highlighting its superior potential for CR dye adsorption (Table 2).

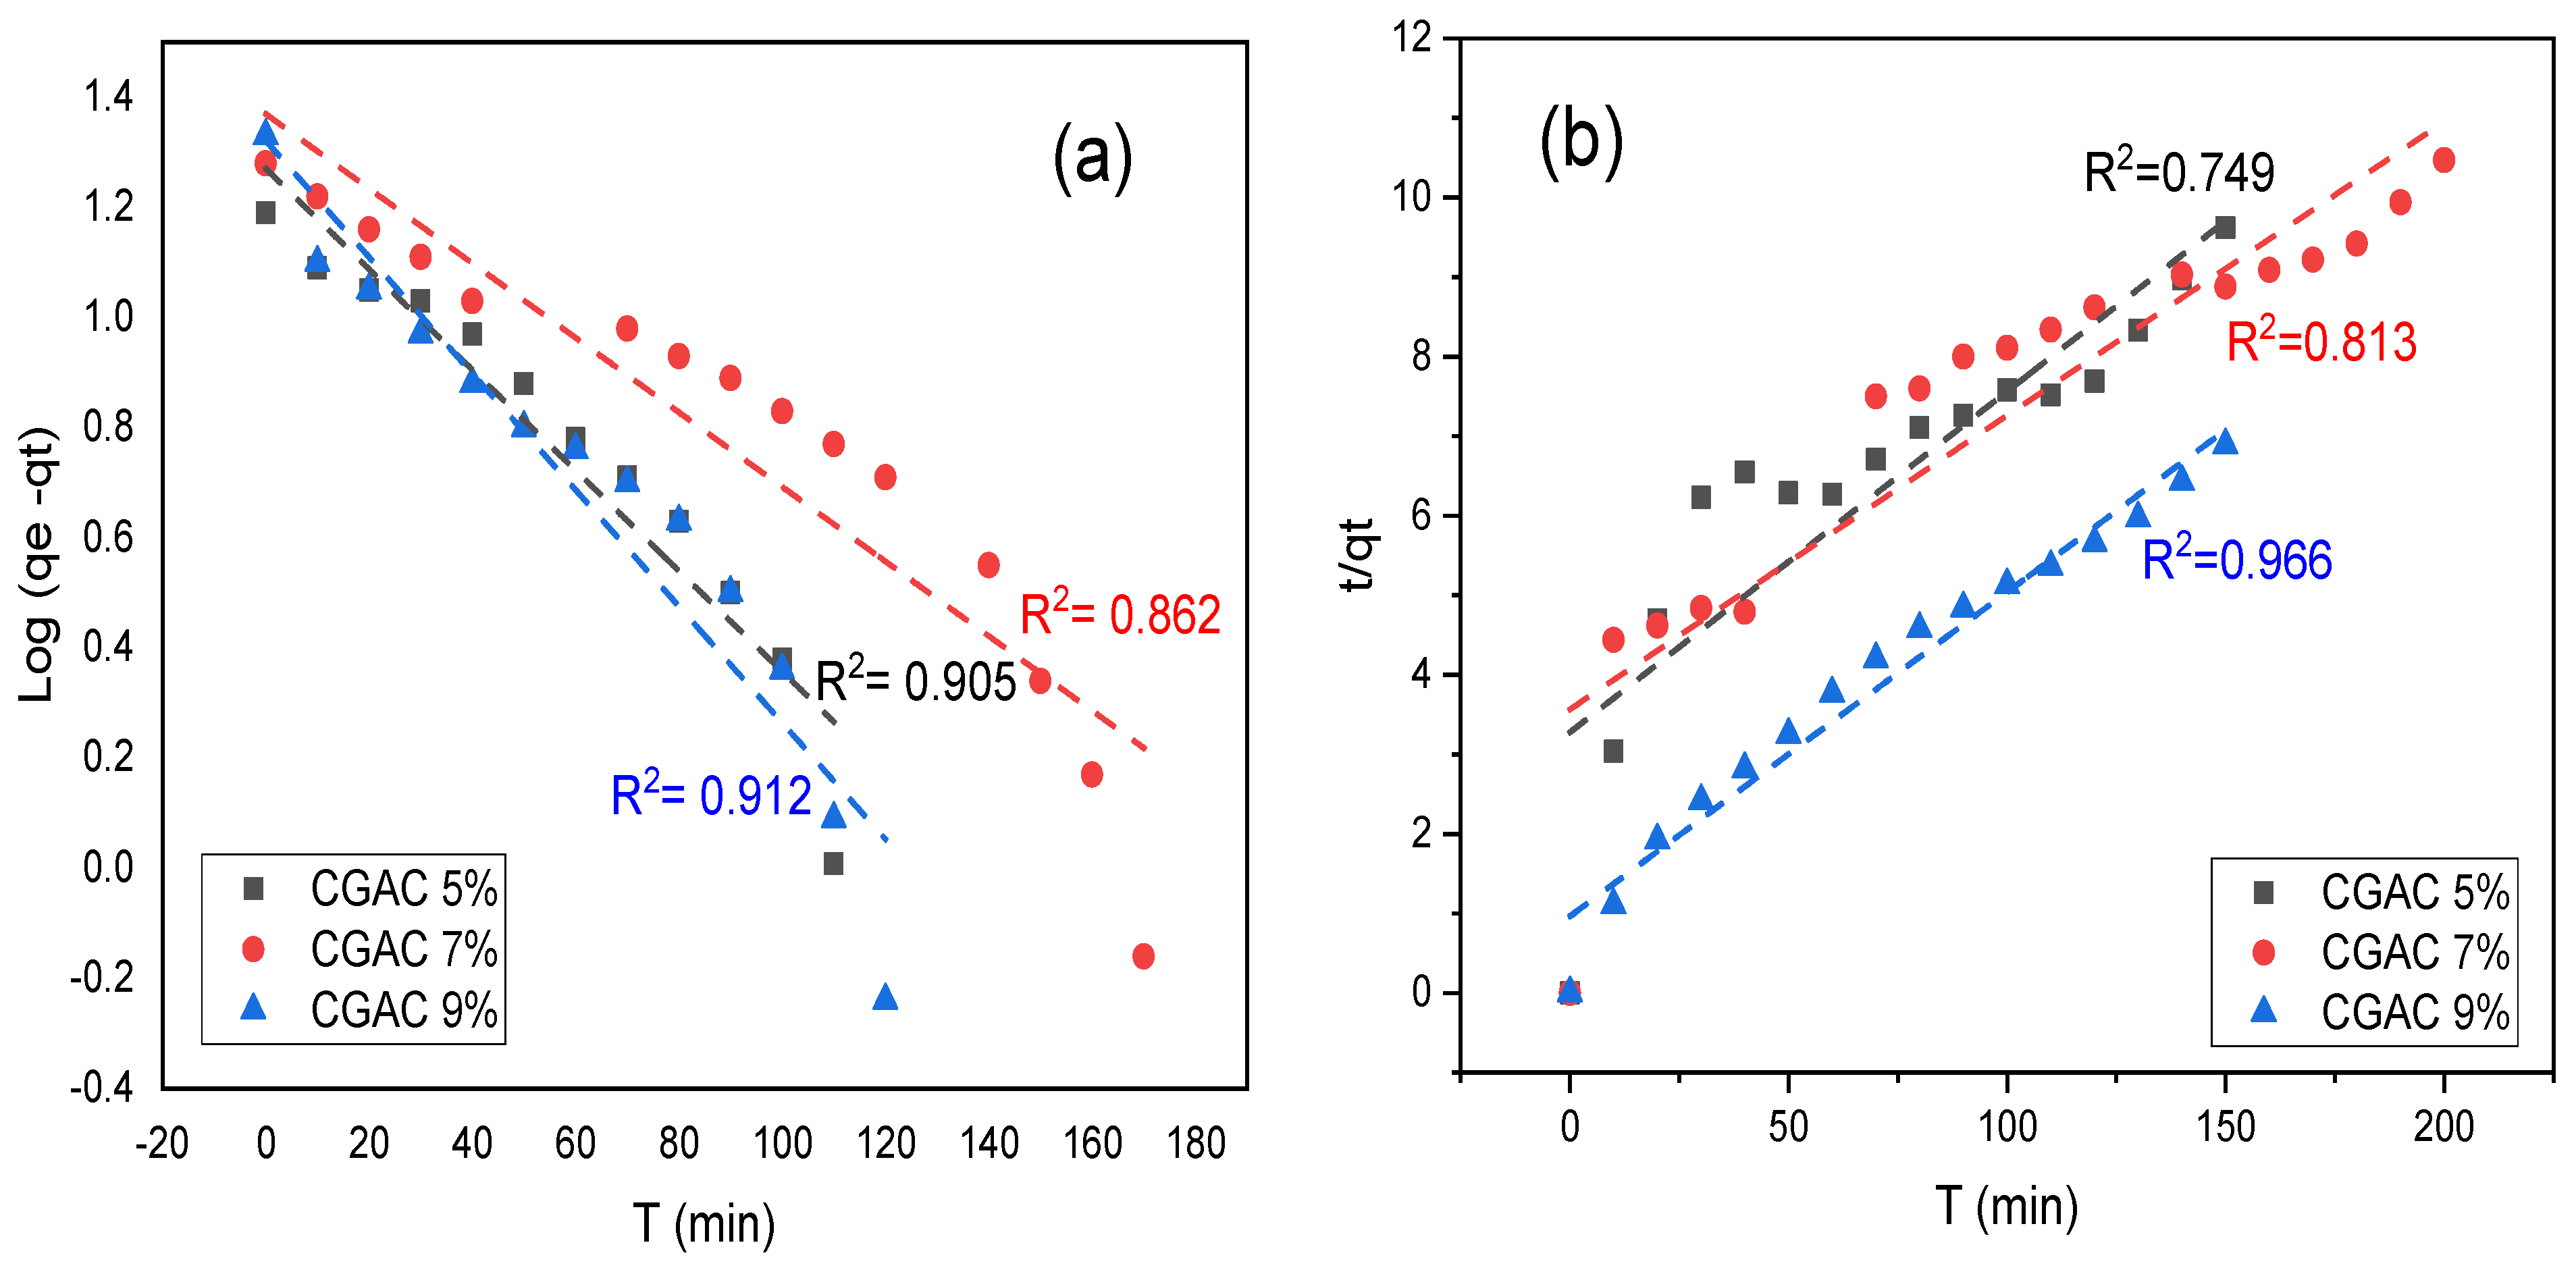
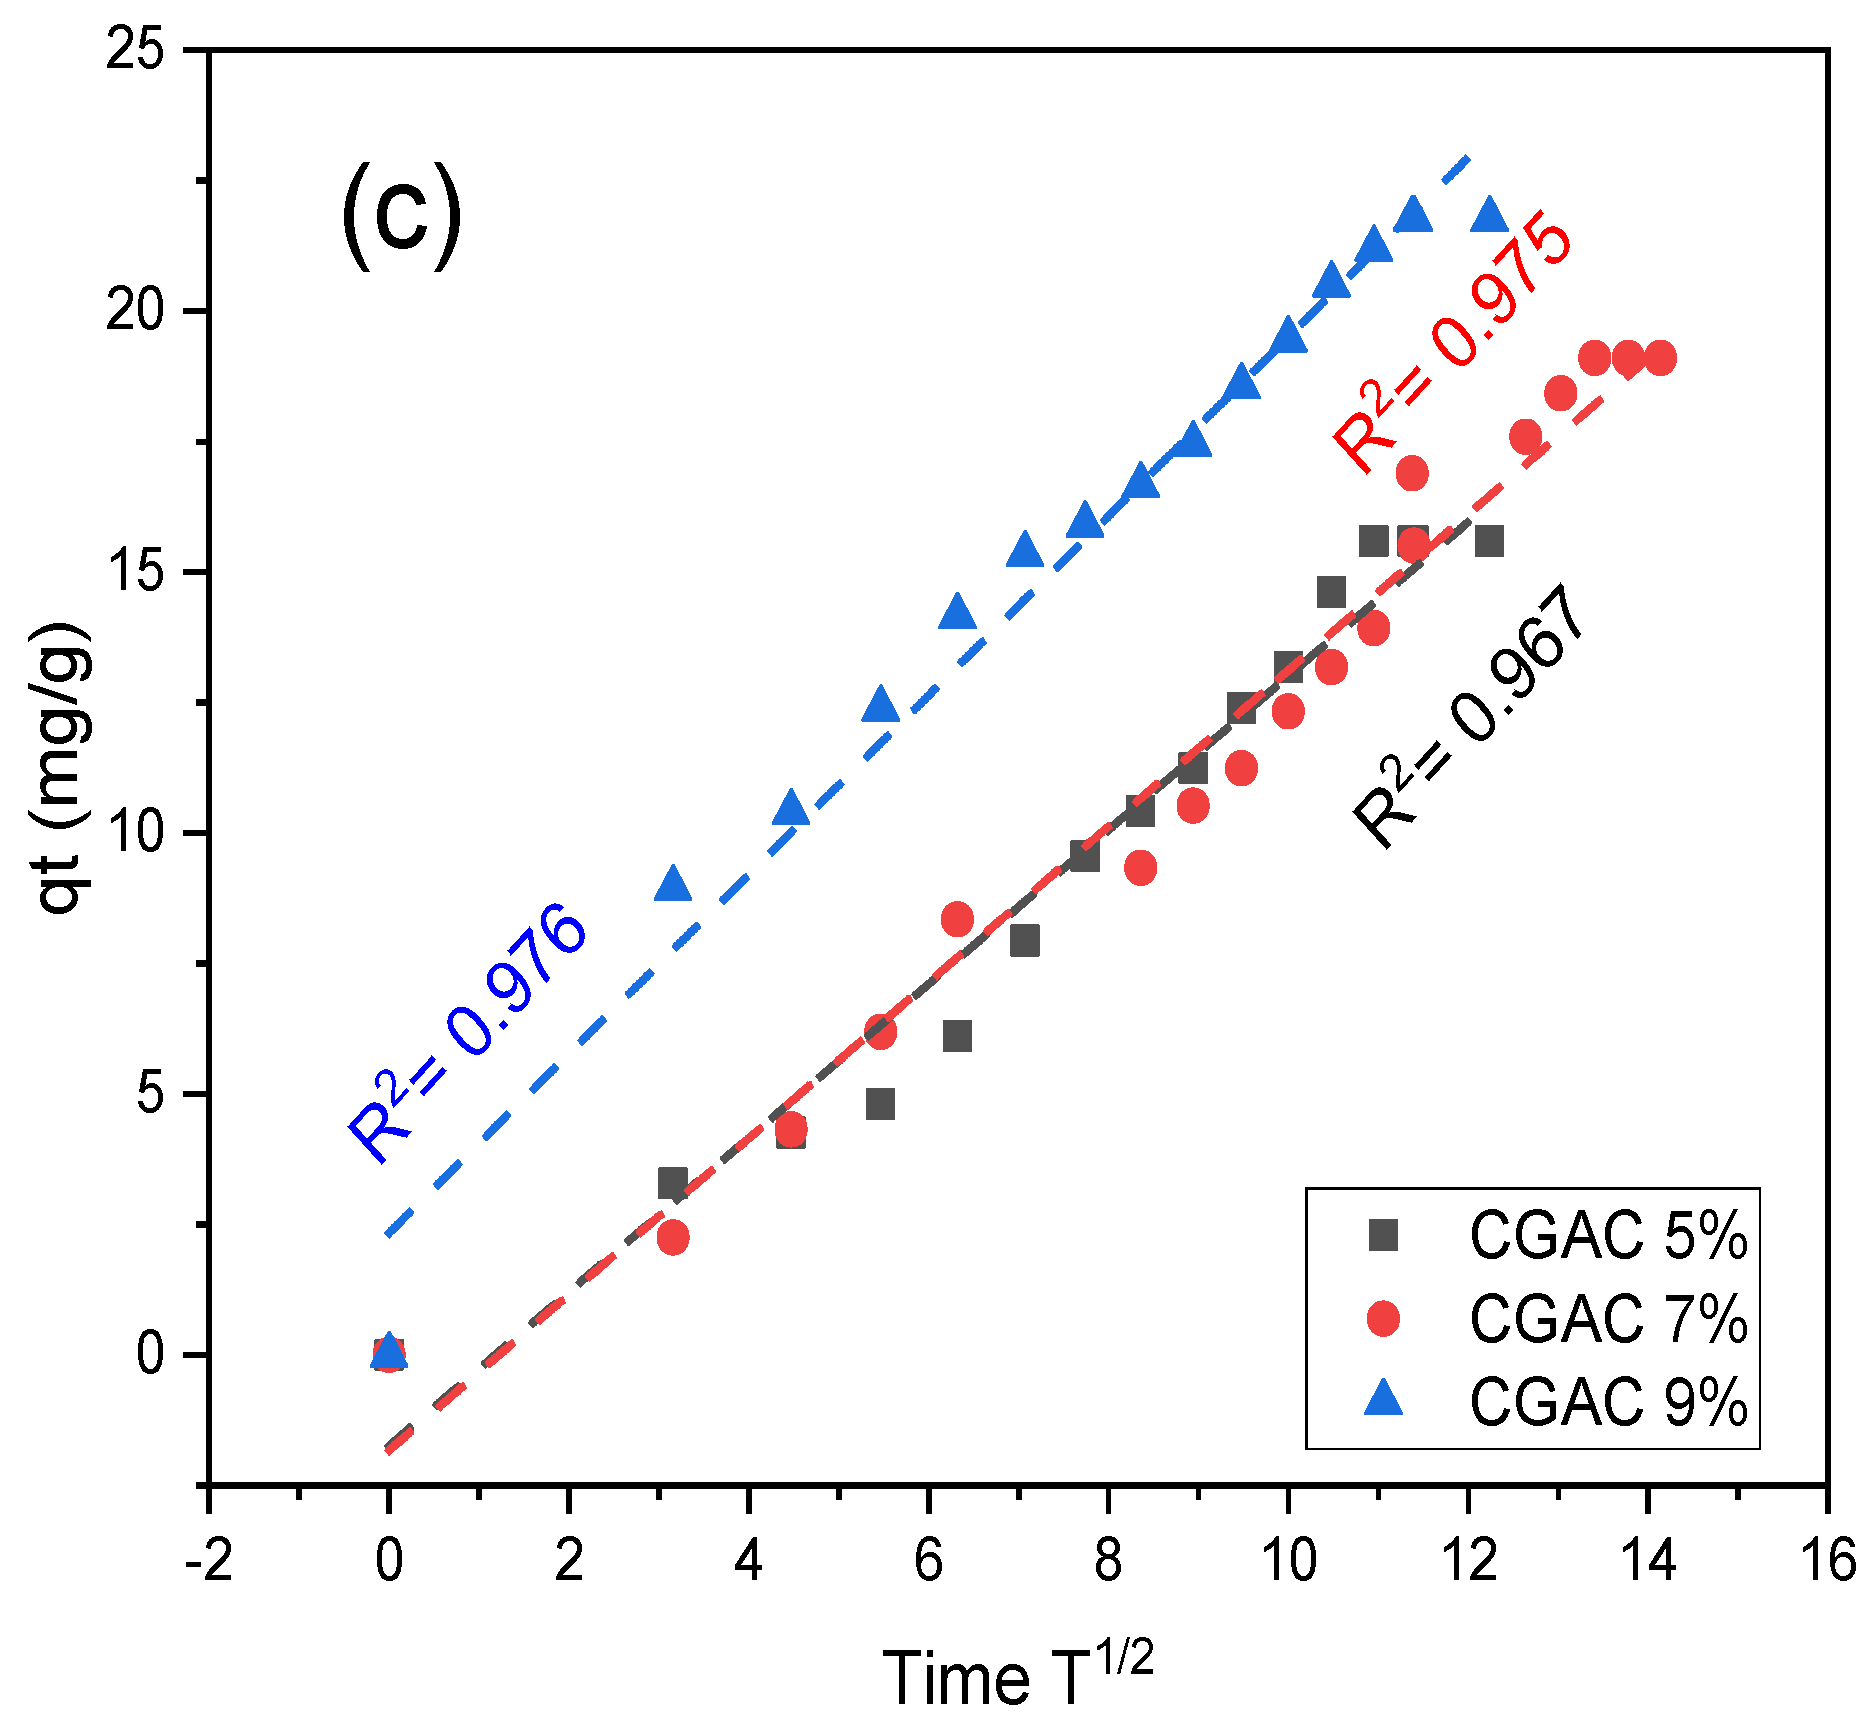
3.4. Adsorption Kinetics

To investigate the adsorption control mechanism, we examined the pseudo-first-order and pseudo-second-order rate models, as well as the intra-particle diffusion model. The experimental results are summarized in Table 3.
For CGAC5% and CGAC7% chitin samples, the coefficients of determination (R2) for the pseudo-first-order model were 0.905 and 0.862, respectively, and are higher than those of the pseudo-second-order model (0.749 and 0.813). The theoretical qe values obtained from the pseudo-first-order model closely matched the experimental data, suggesting its applicability in describing the CR adsorption process with CGAC5% and CGAC7%.
In contrast, for CGAC9%, the (R2) coefficient for the pseudo-second-order model was 0.966, which is larger than the value of the pseudo-first-order model (0.912), indicating the suitability of the pseudo-second-order kinetic model in describing the CR adsorption process with CGAC9%.
The plot of the kinetic parameters for CR adsorption with the chitin samples is illustrated in Figure 9. As shown in Figure 9c, the graphs depicting qt versus t1/2 display an initial linear trend with the correlation coefficients being between 0.967 and 0.976. These plots did not pass through the origin, suggesting the presence of some degree of boundary layer control, while also indicating that intra-particle diffusion is not the rate-controlling step.

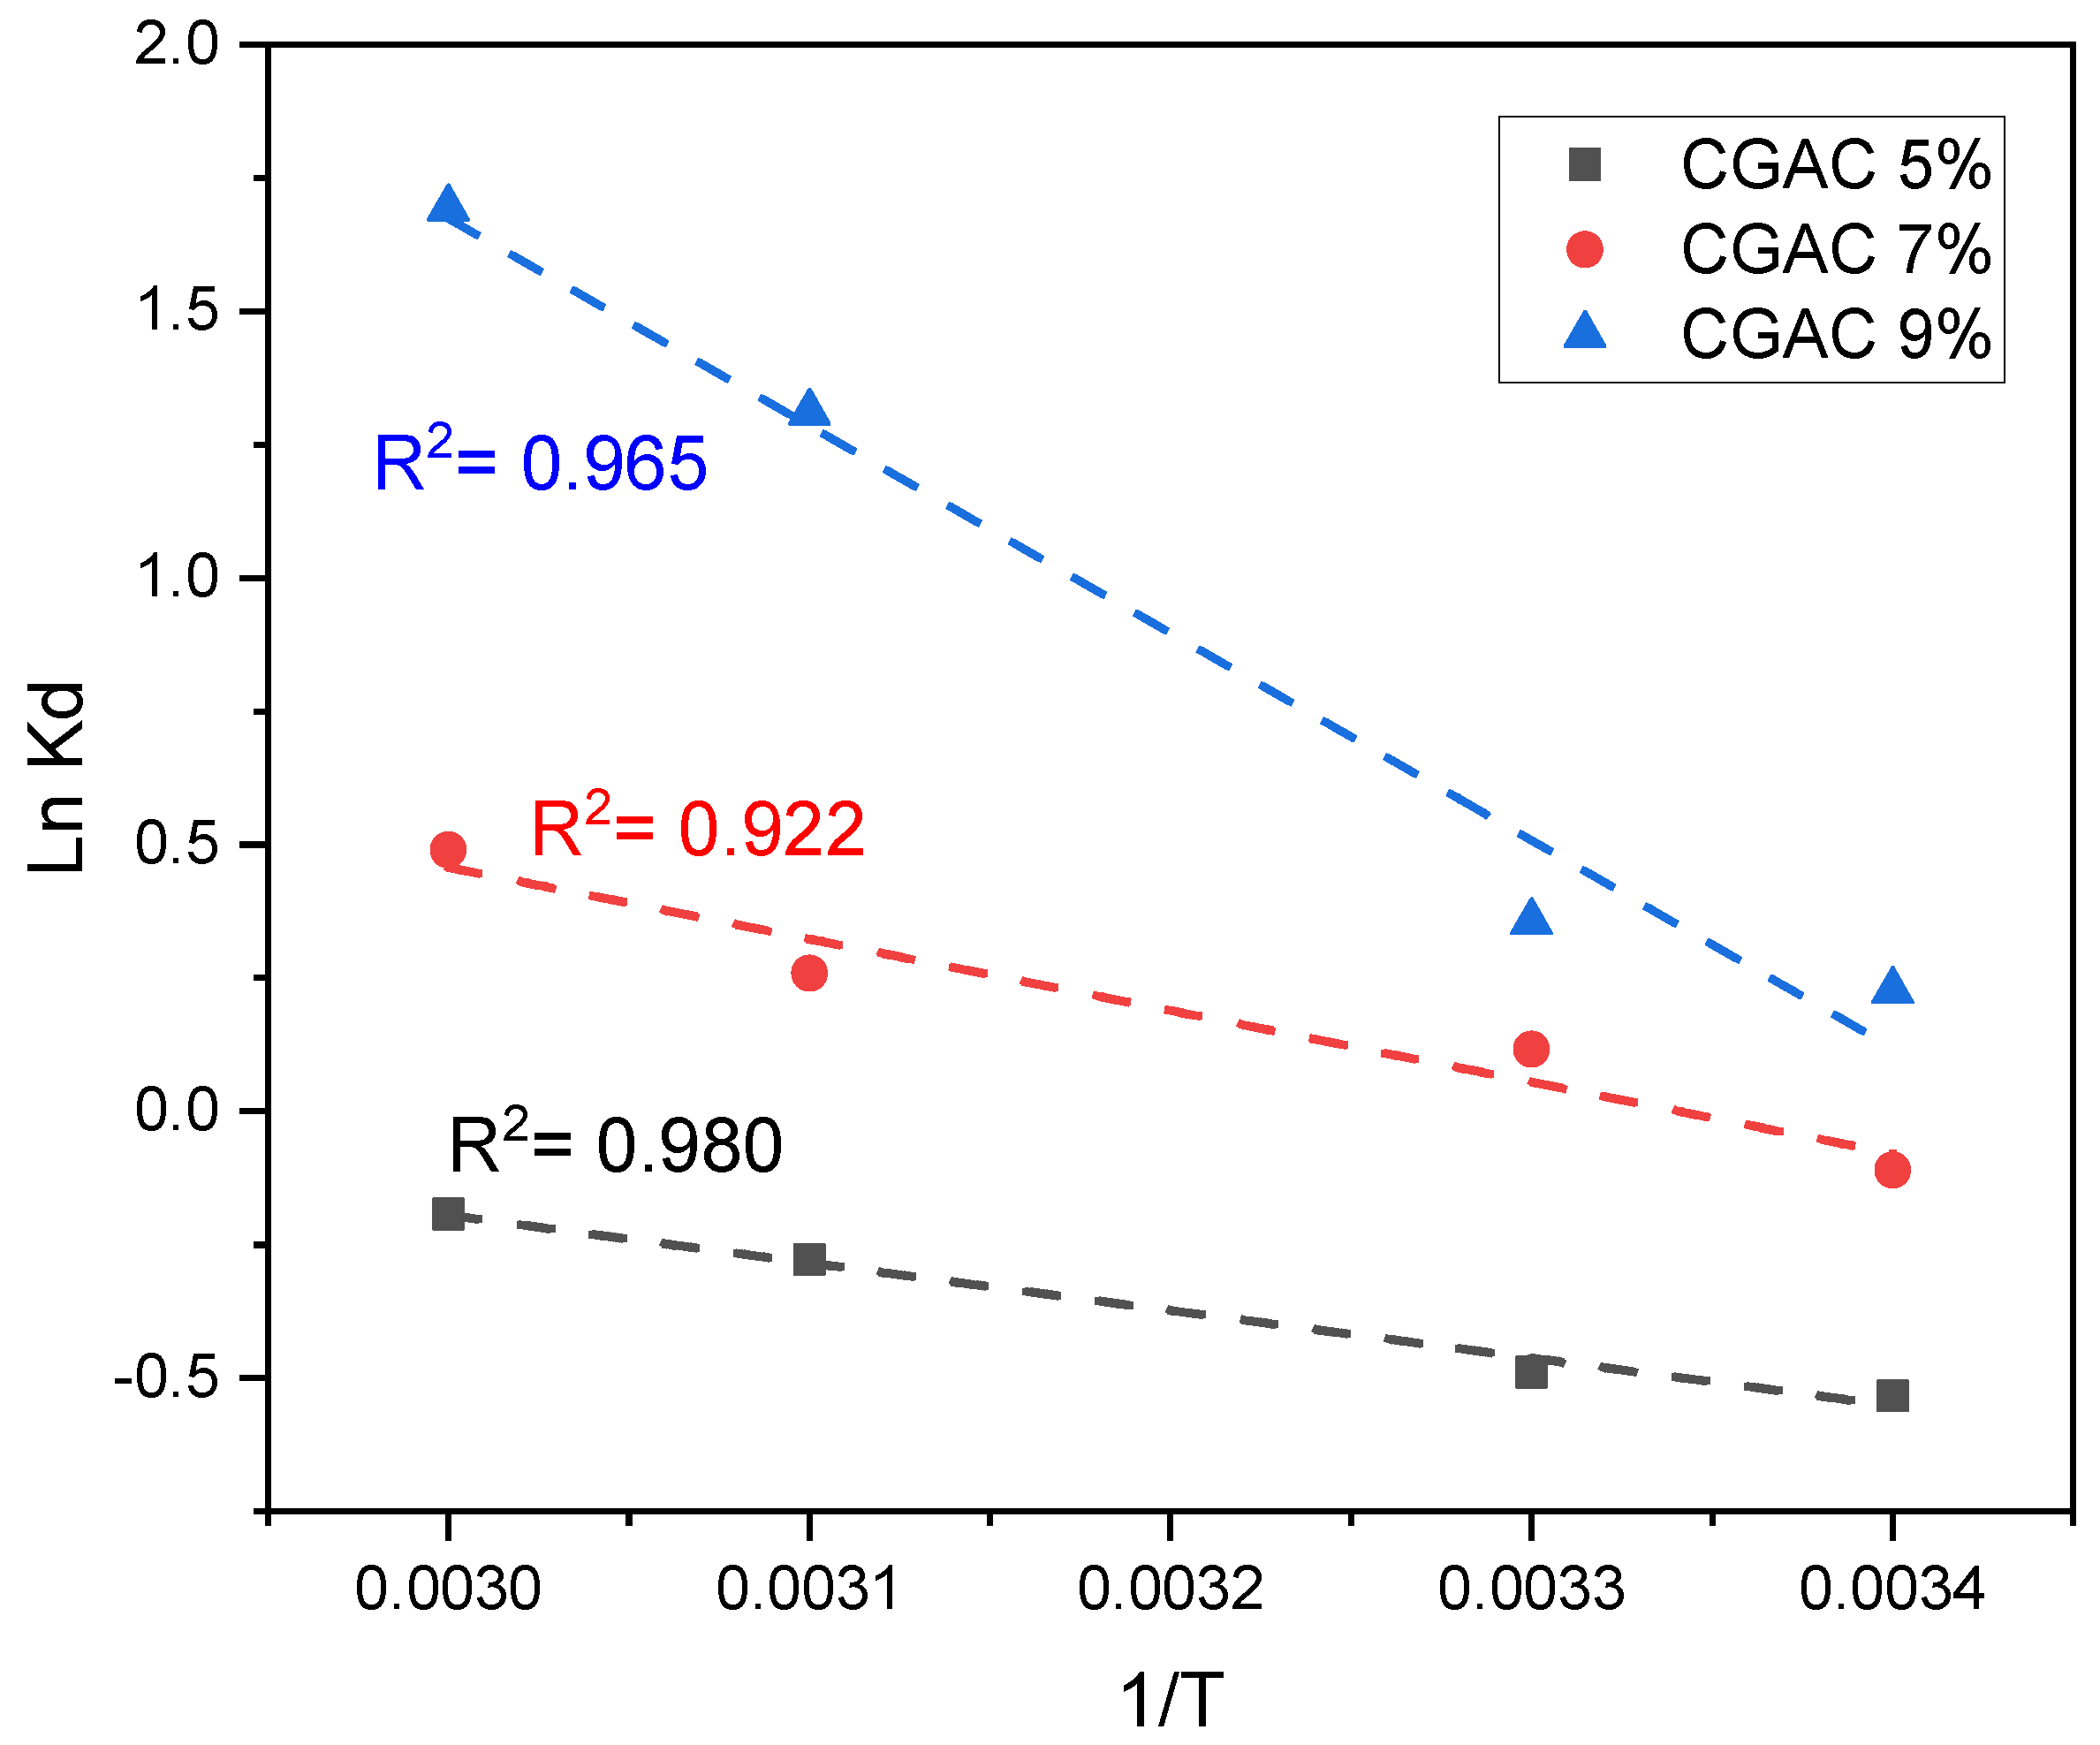
3.5. Adsorption Thermodynamics

The thermodynamic parameters, as outlined in Table 4 and plotted in Figure 10, provide valuable insights into the CR adsorption process. The positive values of ΔH indicate that this process is naturally endothermic [65]. Additionally, the ΔH values, all falling below 40 kJ/mol, suggest physical adsorption [66]. Furthermore, the obtained positive values of ΔS indicate an affinity between the CR surface and chitin as well as an increase in randomness at the solid–solution interface as the temperature increases during the adsorption process [39].
The adsorbed solvent molecules replace the adsorbate, gaining more translational entropy than the adsorbed molecules lose, thus making the randomness of the system common. For CGAC 9%, the ΔG values at temperatures of 293, 303, 313, and 323 K were −0.551 kJ/mol, −0.895 kJ/mol, −3.407 kJ/mol, and −4.544 kJ/mol, respectively, indicating that the interaction of CR with chitin is possible and spontaneous at different temperatures [31].

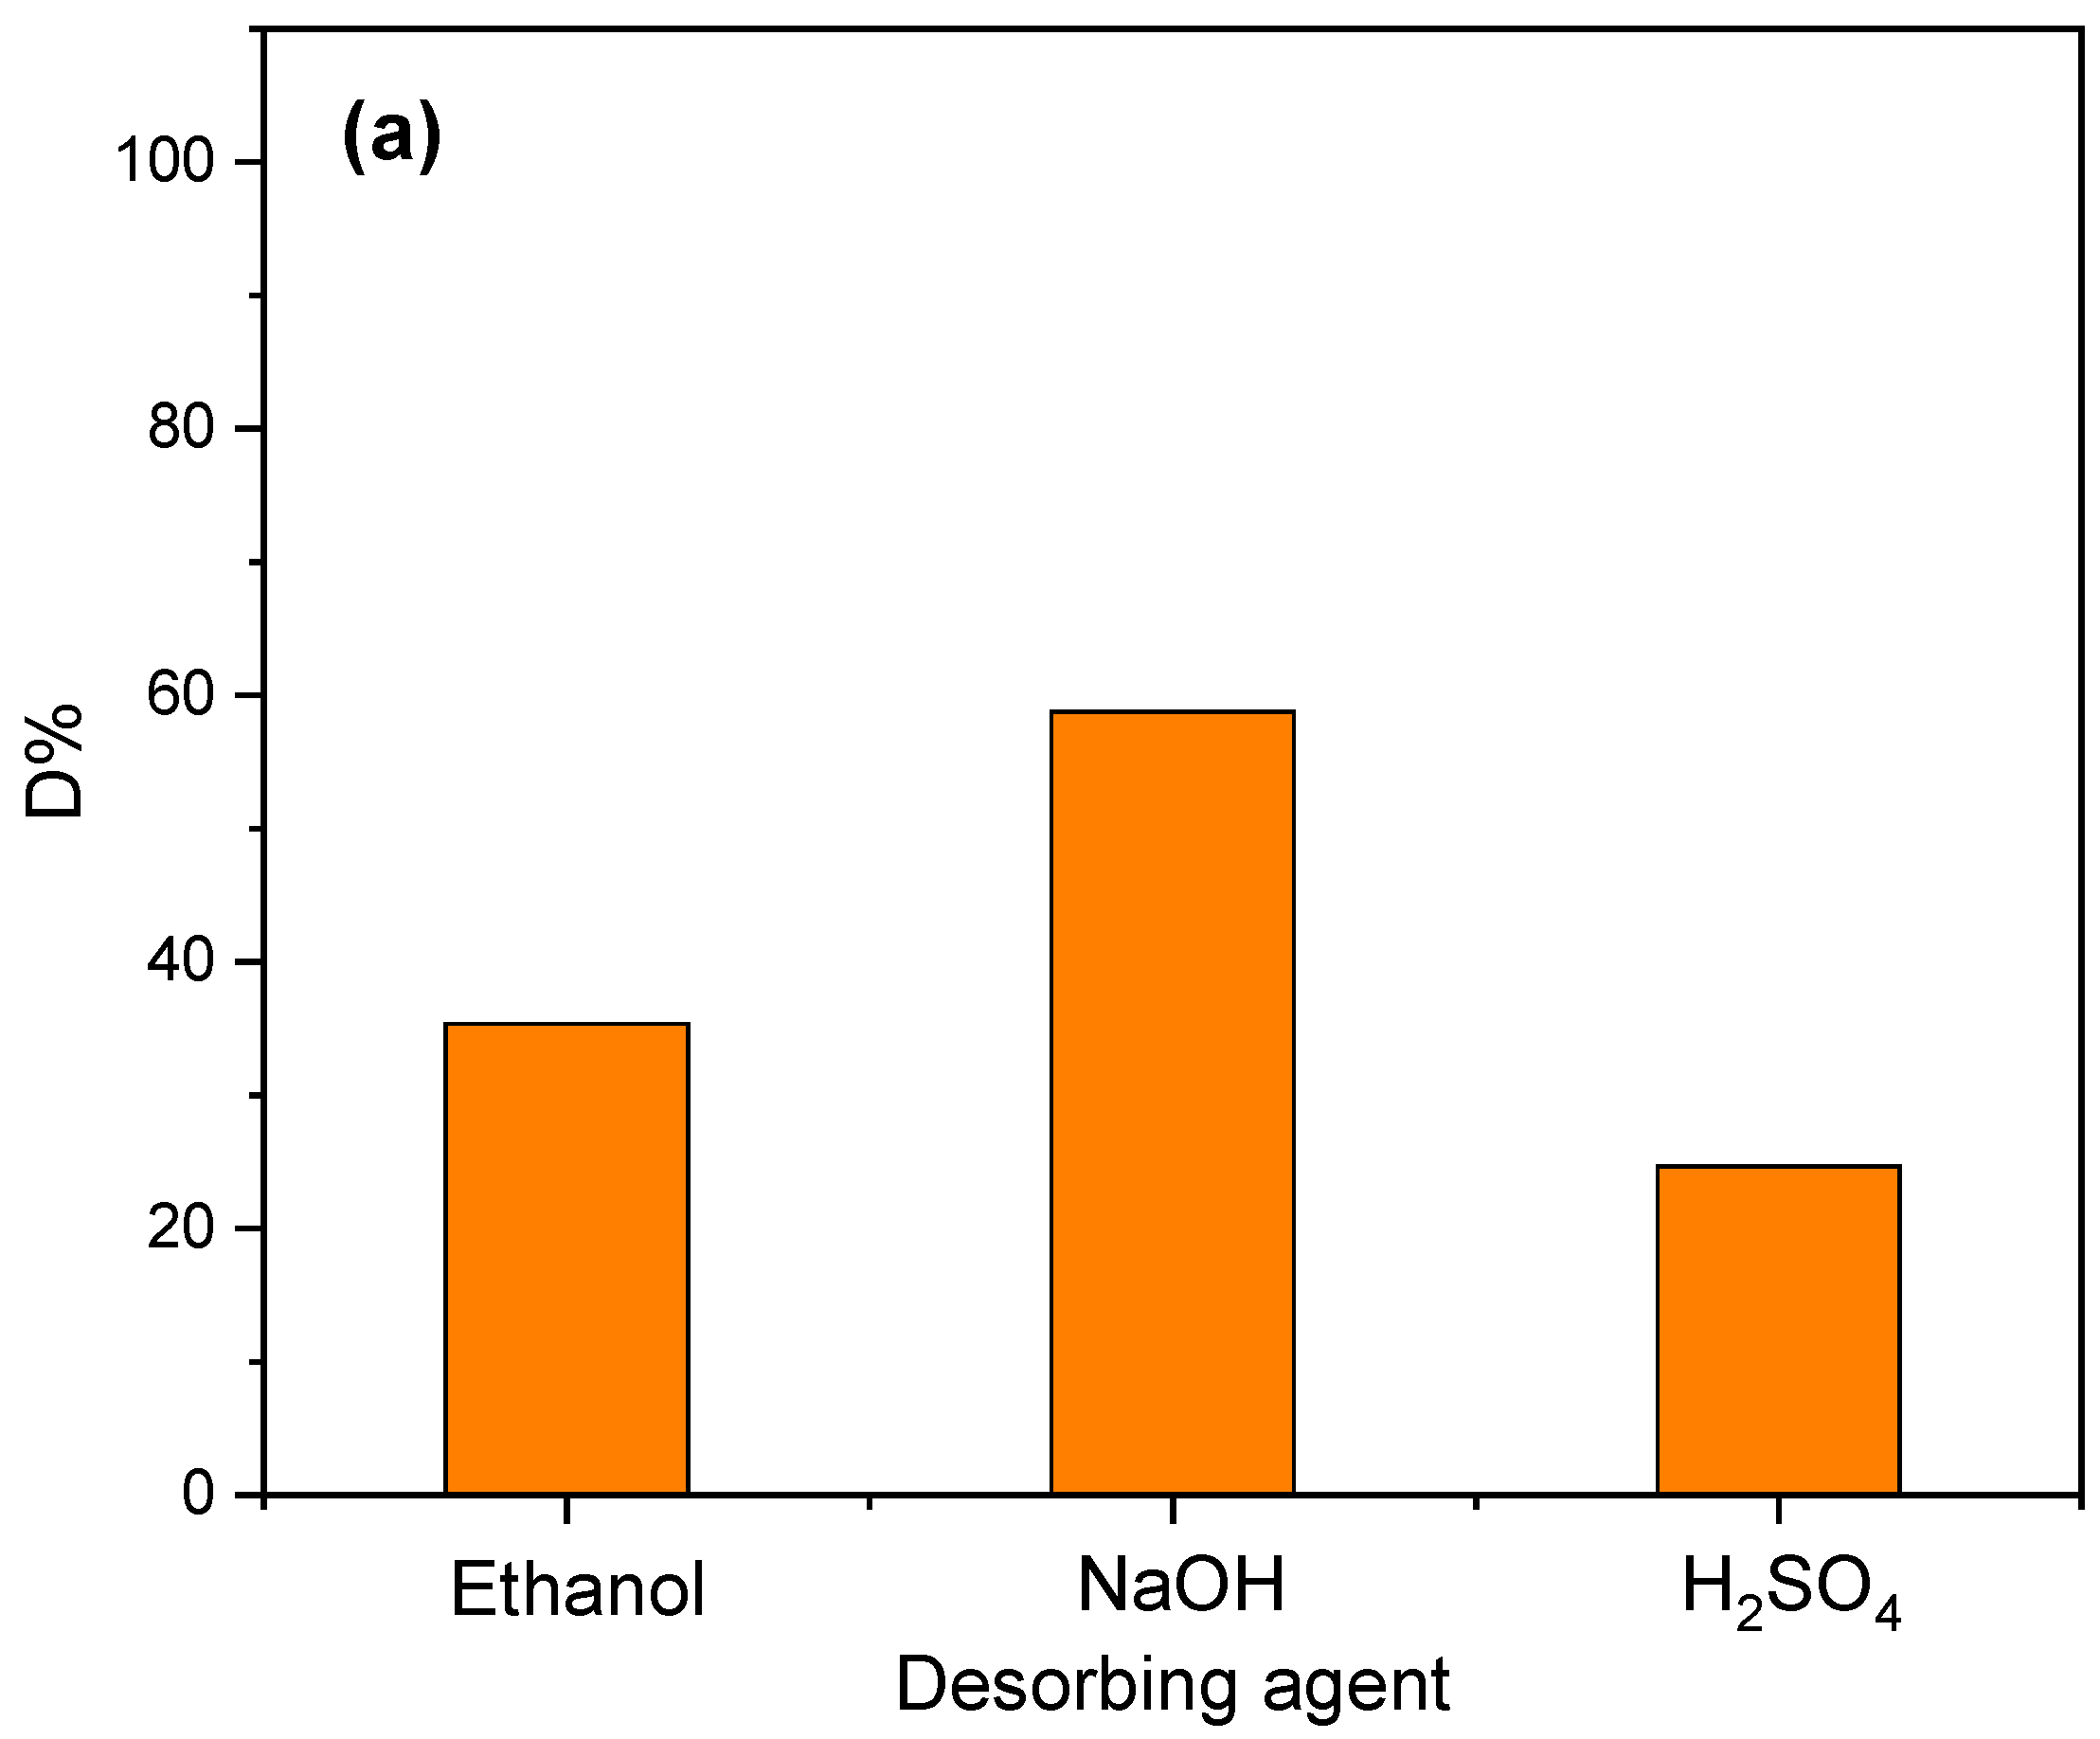
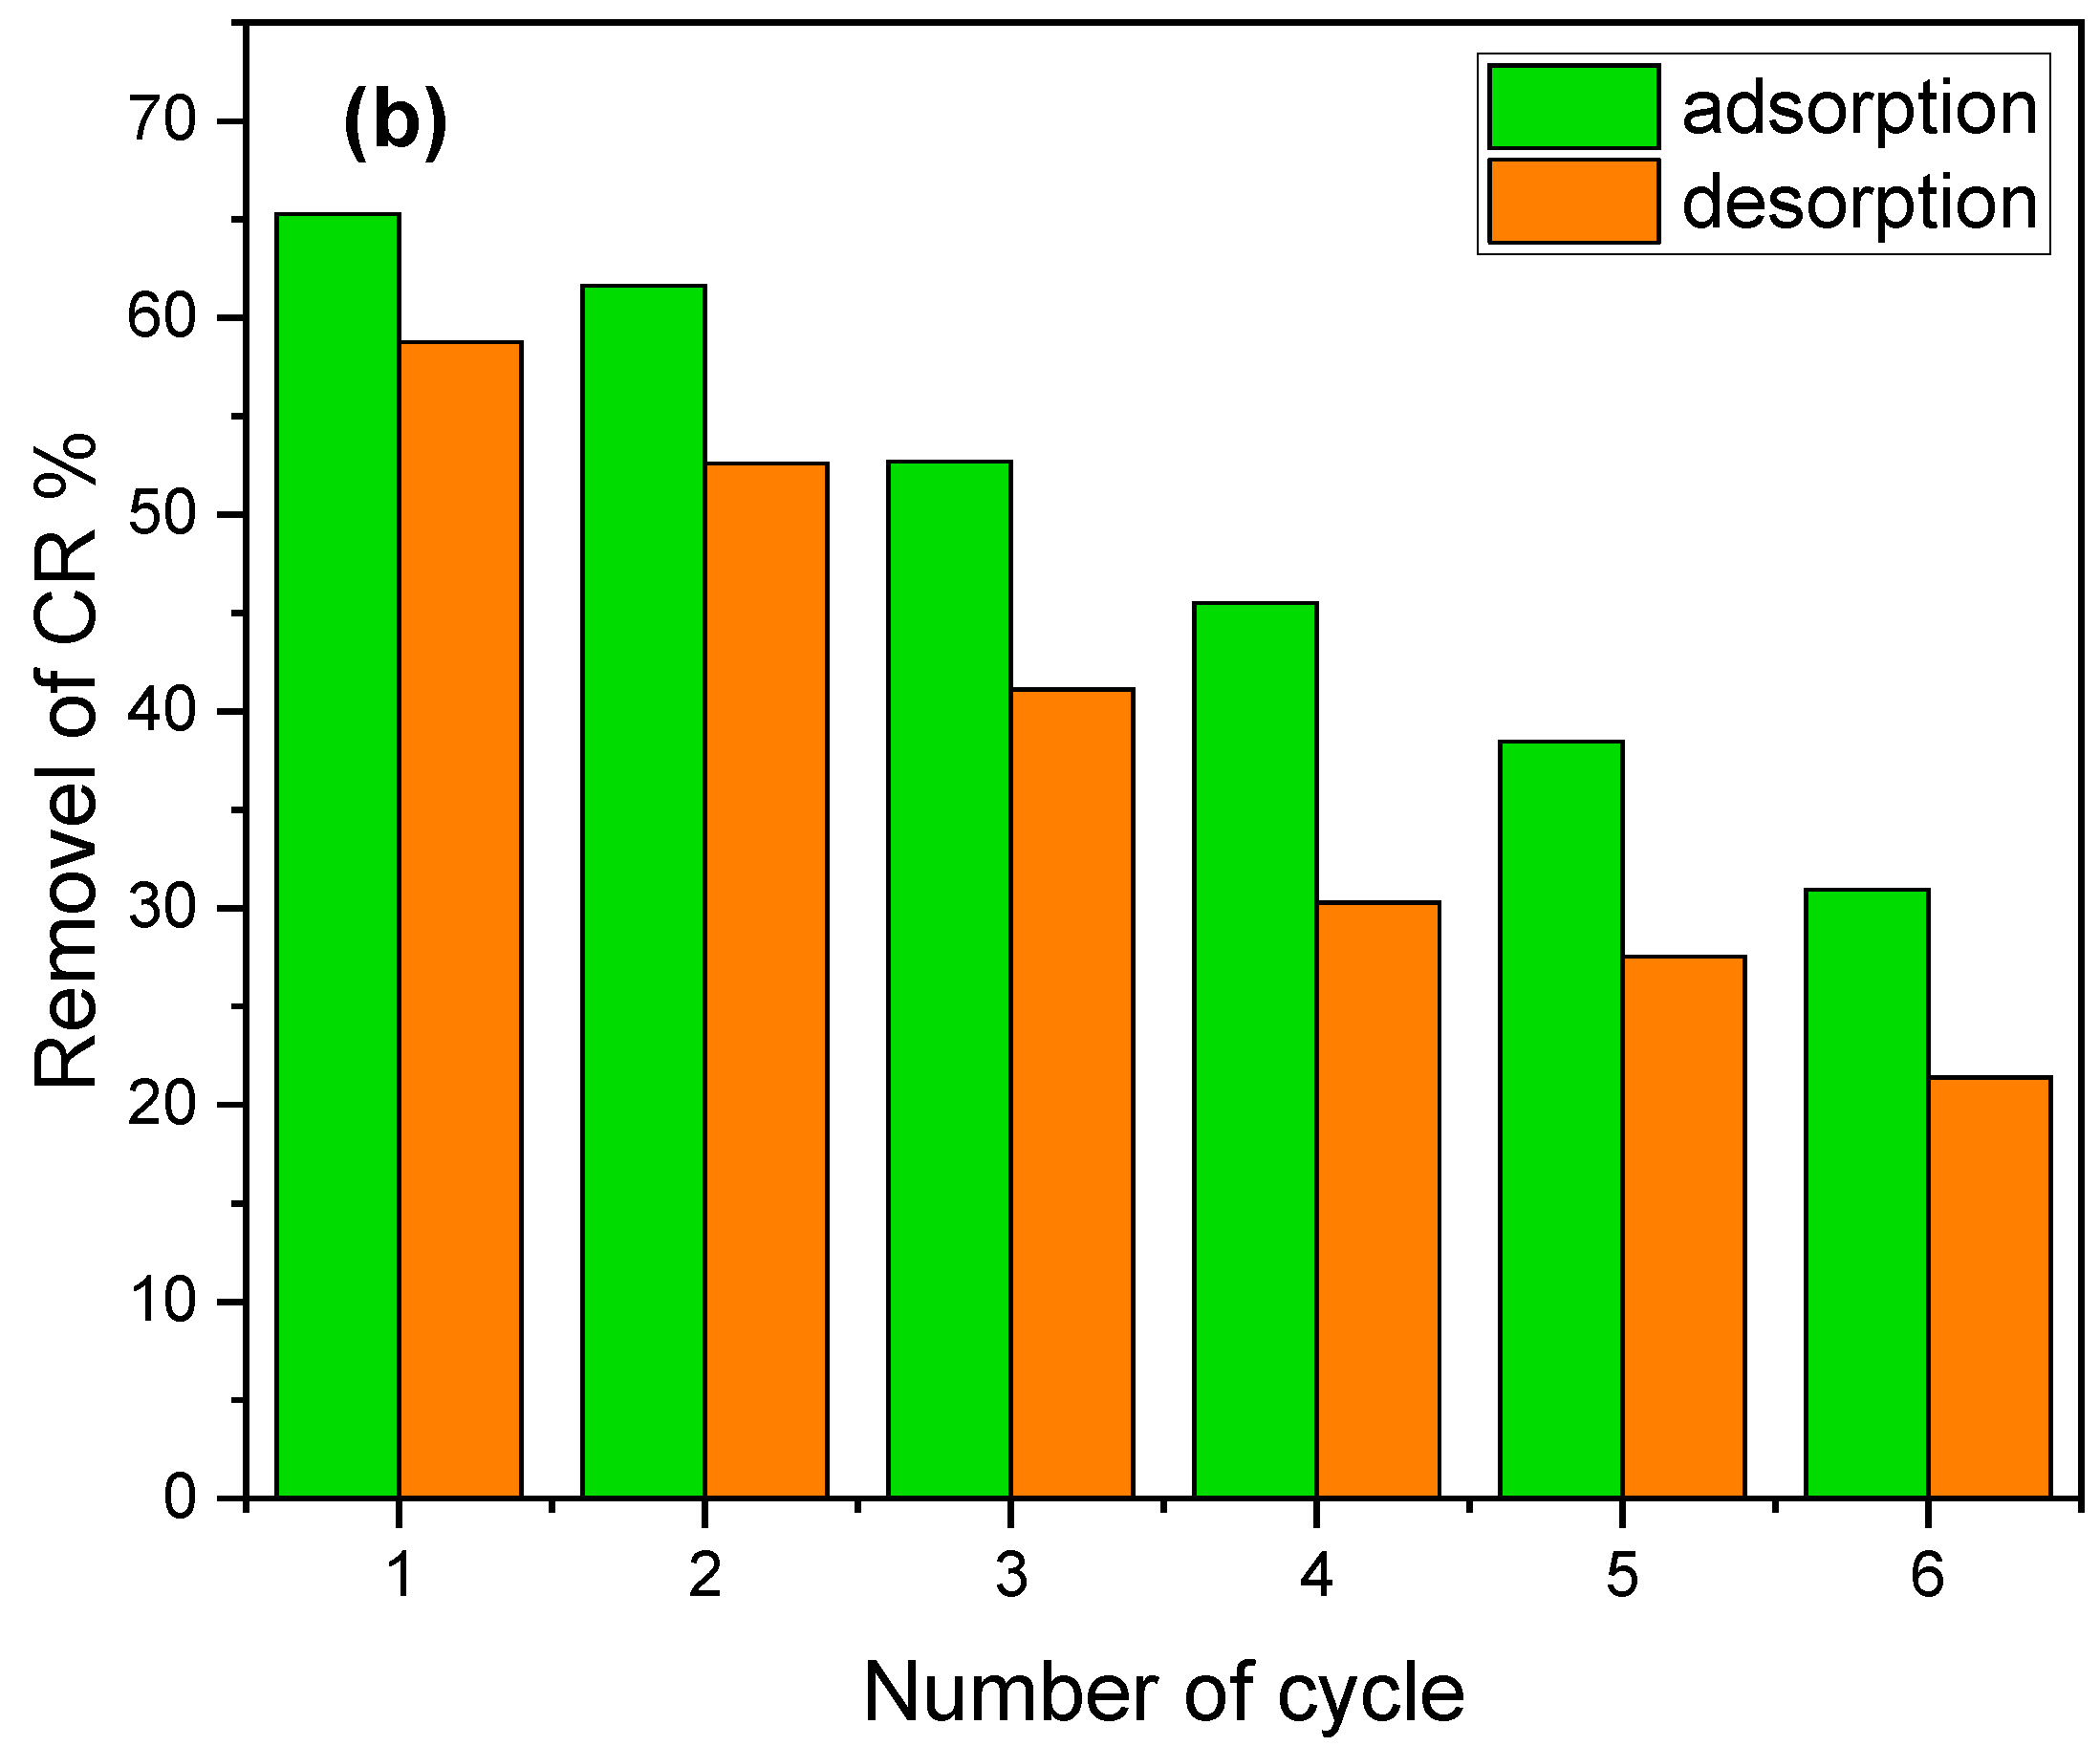
3.6. Desorption and Regeneration

The adsorbent regeneration is an important factor for consideration when assessing the feasibility of the process from an economic and practical perspective. As seen in Figure 11a, the sodium hydroxide solution was the best desorbing agent, with a desorption yield of approximately 58%, which was attributed to the weaker interactions between the chitin and dye in basic solutions.
Chitin regeneration and re-adsorption of CR in successive cycles was performed to regenerate the biosorbent material. A desorption step was carried out after each adsorption cycle, corresponding to the saturation of the chitin. This study was conducted during the fifth consecutive cycle of adsorption and desorption.
As illustrated in Figure 11b, the chitin retained a good adsorption efficiency even after three cycles. However, the efficiency of Congo red adsorption onto chitin started to decrease after the third cycle (desorption decreased below 50%).

3.7. Mechanism of the CR Adsorption into Chitin

The adsorption mechanism may be influenced by various factors, including the characteristics of the adsorbate, the functional groups present on the adsorbents and dyes, the pH of the solution, and the surface charge of the nanoparticles, among others. To clarify the CR dye molecules’ adsorption mechanism, an FT-IR analysis of CGAC 5% was performed before and after CR adsorption. As observed in Figure 12a, the characteristic bands of CR appeared in the spectrum of CGAC 5%+CR (after CR adsorption) but slightly shifted toward a lower wavenumber compared to free Congo red dye. For instance, the stretching O–H band slightly shifted after CR adsorption to 3456 cm−1 compared to 3510 cm−1, and the stretching N–H band slightly shifted after dye adsorption from 3267 cm−1 to 3243 cm−1 due to the formation of hydrogen bond interactions between the amine groups of CR molecules and NH/OH groups presented on the surface of the chitin.
Also, the results obtained from the pH studies conducted in Section 3.2 indicate that the process of adsorption is influenced by the pH value. The observed increase in the adsorption efficiency at lower pH values suggests that the adsorption of the anionic CR dye onto protonated chitin is primarily driven by electrostatic interactions between the positive charges on the surface of the chitin (pH < pHpzc; chitin is positively charged) and the negative charges of Congo red dye (anionic dye). However, it is important to highlight that the CR molecule exhibits a negative charge at elevated pH levels. Consequently, the affinity between the adsorbent surface and CR molecules is diminished, resulting in a decrease in the adsorption efficiency due to the presence of electrostatic repulsion. The observed weak adsorption is indicative of the existence of hydrogen bonds. The findings of the thermodynamic investigation further support the lack of chemical bonding (sorption chemistry) based on the observed enthalpy results. Specifically, all enthalpy values for the three chitins employed in the study were found to be below 40 kJ/mol, leading to the conclusion that the phenomenon observed is solely attributed to the physisorption mechanism. The depicted Figure 12b illustrates the proposed mechanism for this study.

4. Conclusions

A faster and eco-friendly approach for chitin extraction from shrimp shell waste was applied as an attractive solution for producing chitin suitable for the removal of Congo red dye from aqueous solutions.
The adsorption of Congo red dye onto prepared chitin was investigated using kinetic, equilibrium, and thermodynamic studies. The results revealed that CGAC 9% chitin sample exhibited a high adsorption capacity of 29.69 ± 0.2 mg/g, under the optimal conditions established in this work (pH 7, contact time = 130 min, at 50 °C). Furthermore, the adsorption equilibrium was found to be favorable according to both the Freundlich and the Langmuir isotherm models, with the latter being more suitable for describing the adsorption process. Adsorption kinetics showed that the pseudo-first-order model provided a better fit for CGAC 5% and CGAC 7% in contrast to CGAC 9%, which exhibited a better fit for the second-order model. The thermodynamic analysis suggested that the removal of Congo red dye is a spontaneous and endothermic process. The adsorption mechanism of Congo red dye on chitin was found to be optimal in an acidic environment due to the electrostatic interactions and hydrogen bonding that were present. The thermodynamic data indicated a physisorption process.
These findings highlight the potential of chitin as a cost-effective adsorbent for the efficient removal of dyes from industrial wastewater, thus contributing to a more sustainable strategy in addressing the environmental concerns associated with dyes.

Supplementary Materials

The following supporting information can be downloaded at: https://www.mdpi.com/article/10.3390/separations10120599/s1, Figure S1: Determination of λmax of Congo Red dye solution using a UV-visible spectrophotometer; Figure S2: Calibration curve for different concentrations of standard Congo red dye solutions.

Author Contributions

Conceptualization, N.B. and Y.B.; methodology, F.Z.G., N.B. and N.S.; software, Y.B., S.R., M.D. and M.S.; validation, N.B., Y.B., N.S. and M.S.; formal analysis, F.Z.G., N.B., Y.B., N.S. and S.R.; investigation, F.Z.G., N.B. and M.D.; resources, N.B., Y.B. and M.S.; data curation, F.Z.G., N.S. and S.R.; writing—original draft preparation, F.Z.G., N.B., Y.B., N.S. and M.D.; writing—review and editing, Y.B., N.S. and S.R.; visualization, F.Z.G. and M.D.; supervision, N.B. and Y.B.; project administration, N.B.; funding acquisition, N.B., Y.B. and S.R. All authors have read and agreed to the published version of the manuscript.

Funding

This research received no external funding.

Data Availability Statement

The data presented in this study are available in the article and Supplementary Materials.

Acknowledgments

The authors wish to express their gratitude to Faiza Zermane for her valuable assistance with XRD analyses at the Water Environment and Sustainable Development Laboratory, Faculty of Technology, Blida 1 University, BP 270, Blida 09000, Algeria.

Conflicts of Interest

The authors declare no conflict of interest.

References

  1. Shoaib, M.; Ashar, A.; Bhutta, Z.A.; Muzammil, I.; Ali, M.; Kanwal, A. Chapter 15—Biological methods for degradation of textile dyes from textile effluent. In Development in Wastewater Treatment Research and Processes; Shah, M.P., Rodriguez-Couto, S., Kapoor, R.T., Eds.; Elsevier: Amsterdam, The Netherlands, 2022; pp. 329–353. [Google Scholar]
  2. Banerjee, D.; Sharma, A.K.; Das, N.S. Nano Materials Induced Removal of Textile Dyes from Waste Water; Bentham Science Publishers: Sharjah, United Arab Emirates, 2022. [Google Scholar]
  3. Mashkoor, F.; Nasar, A. Magsorbents: Potential candidates in wastewater treatment technology—A review on the removal of methylene blue dye. J. Magn. Magn. Mater. 2020, 500, 166408. [Google Scholar] [CrossRef]
  4. Raval, N.P.; Shah, P.U.; Shah, N.K. Malachite Green “a Cationic Dye” and Its Removal from Aqueous Solution by Adsorption. Appl. Water Sci. 2017, 7, 3407–3445. [Google Scholar] [CrossRef]
  5. Iwuozor, K.O.; Ighalo, J.O.; Emenike, E.C.; Ogunfowora, L.A.; Igwegbe, C.A. Adsorption of methyl orange: A review on adsorbent performance. Curr. Res. Green Sustain. Chem. 2021, 4, 100179. [Google Scholar] [CrossRef]
  6. Oladoye, P.O.; Bamigboye, M.O.; Ogunbiyi, O.D.; Akano, M.T. Toxicity and Decontamination Strategies of Congo Red Dye. Groundw. Sustain. Dev. 2022, 19, 100844. [Google Scholar] [CrossRef]
  7. Nag, S.; Biswas, S. Cellulose-Based Adsorbents for Heavy Metal Removal. In Green Adsorbents to Remove Metals, Dyes and Boron from Polluted Water; Springer: Cham, Switzerland, 2021; pp. 113–142. [Google Scholar]
  8. Selvaraj, V.; Swarna Karthika, T.; Mansiya, C.; Alagar, M. An over Review on Recently Developed Techniques, Mechanisms and Intermediate Involved in the Advanced Azo Dye Degradation for Industrial Applications. J. Mol. Struct. 2021, 1224, 129195. [Google Scholar] [CrossRef]
  9. Shafiqul Alam, M.; Khanom, R.; Arifur Rahman, M. Removal of Congo Red Dye from Industrial Wastewater by Untreated Sawdust. Am. J. Environ. Prot. 2015, 4, 207. [Google Scholar] [CrossRef]
  10. Sharma, S.; Kaur, A. Various methods for removal of dyes from industrial effluents–A review. Indian J. Sci. Technol 2018, 11, 1–21. [Google Scholar] [CrossRef]
  11. Fan, H.; Zhou, S.; Jiao, W.-Z.; Qi, G.-S.; Liu, Y.-Z. Removal of heavy metal ions by magnetic chitosan nanoparticles prepared continuously via high-gravity reactive precipitation method. Carbohydr. Polym. 2017, 174, 1192–1200. [Google Scholar] [CrossRef]
  12. Sherlala, A.; Raman, A.; Bello, M.M.; Asghar, A. A review of the applications of organo-functionalized magnetic graphene oxide nanocomposites for heavy metal adsorption. Chemosphere 2018, 193, 1004. [Google Scholar] [CrossRef]
  13. Al-sareji, O.J.; Meiczinger, M.; Somogyi, V.; Al-Juboori, R.A.; Grmasha, R.A.; Stenger-Kovács, C.; Jakab, M.; Hashim, K.S. Removal of Emerging Pollutants from Water Using Enzyme-Immobilized Activated Carbon from Coconut Shell. J. Environ. Chem. Eng. 2023, 11, 109803. [Google Scholar] [CrossRef]
  14. Sardar, M.; Manna, M.; Maharana, M.; Sen, S. Remediation of Dyes from Industrial Wastewater Using Low-Cost Adsorbents. In Green Adsorbents to Remove Metals, Dyes and Boron from Polluted Water; Inamuddin, A.M.I., Lichtfouse, E., Asiri, A.M., Eds.; Springer: Cham, Switzerland, 2021; pp. 377–403. [Google Scholar]
  15. Rahali, S.; Aissa, M.A.B.; Modwi, A.; Said, R.B.; Belhocine, Y. Application of mesoporous CaO@g-C3N4 nanosorbent materials for high-efficiency removal of Pb (II) from aqueous solution. J. Mol. Liq. 2023, 379, 121594. [Google Scholar] [CrossRef]
  16. Moumen, A.; Belhocine, Y.; Sbei, N.; Rahali, S.; Ali, F.A.M.; Mechati, F.; Hamdaoui, F.; Seydou, M. Removal of Malachite Green Dye from Aqueous Solution by Catalytic Wet Oxidation Technique Using Ni/Kaolin as Catalyst. Molecules 2022, 27, 7528. [Google Scholar] [CrossRef] [PubMed]
  17. Hong, S.; Yang, Q.; Yuan, Y.; Chen, L.; Song, Y.; Lian, H. Sustainable co-solvent induced one step extraction of low molecular weight chitin with high purity from raw lobster shell. Carbohydr. Polym. 2019, 205, 236–243. [Google Scholar] [CrossRef] [PubMed]
  18. Zúñiga-Zamora, A.; García-Mena, J.; Cervantes-González, E. Removal of Congo Red from the aqueous phase by chitin and chitosan from waste shrimp, Desalin. Water Treat. 2016, 57, 14674–14685. [Google Scholar] [CrossRef]
  19. Devi, R.; Dhamodharan, R. Pretreatment in Hot Glycerol for Facile and Green Separation of Chitin from Prawn Shell Waste. ACS Sustain. Chem. Eng. 2017, 6, 846–853. [Google Scholar] [CrossRef]
  20. Liu, C.; Wang, G.; Sui, W.; An, L.; Si, C. Preparation and Characterization of Chitosan by a Novel Deacetylation Approach Using Glycerol as Green Reaction Solvent. ACS Sustain. Chem. Eng. 2017, 5, 4690–4698. [Google Scholar] [CrossRef]
  21. Ifuku, S.; Ikuta, A.; Izawa, H.; Morimoto, M.; Saimoto, H. Control of mechanical properties of chitin nanofiber film using glycerol without losing its characteristics. Carbohydr. Polym. 2014, 101, 714–717. [Google Scholar] [CrossRef]
  22. Zhang, J.; Feng, M.; Lu, X.; Shi, C.; Li, X.; Xin, J.; Yue, G.; Zhang, S. Base-free preparation of low molecular weight chitin from crab shell. Carbohydr. Polym. 2018, 190, 148–155. [Google Scholar] [CrossRef]
  23. Kaya, M.; Sofi, K.; Sargin, I.; Mujtaba, M. Changes in physicochemical properties of chitin at developmental stages (larvae, pupa and adult) of Vespa crabro (wasp). Carbohydr. Polym. 2016, 145, 64–70. [Google Scholar] [CrossRef]
  24. Boultif, W.; Dehchar, C.; Belhocine, Y.; Zouaoui, E.; Rahali, S.; Zouari, S.E.; Sbei, N.; Seydou, M. Chitosan and Metal Oxide Functionalized Chitosan as Efficient Sensors for Lead (II) Detection in Wastewater. Separations 2023, 10, 479. [Google Scholar] [CrossRef]
  25. Soon, C.Y.; Tee, Y.B.; Tan, C.H.; Rosnita, A.T.; Khalina, A. Extraction and physicochemical characterization of chitin and chitosan from Zophobas morio larvae in varying sodium hydroxide concentration. Int. J. Biol. Macromol. 2018, 108, 135–142. [Google Scholar] [CrossRef] [PubMed]
  26. Huang, W.; Zhao, D.; Guo, N.; Xue, C.; Mao, X. Green and facile production of chitin from crustacean shells using a natural deep eutectic solvent. J. Agric. Food Chem. 2018, 66, 11897–11901. [Google Scholar] [CrossRef] [PubMed]
  27. Bradford, M.M. A Rapid and Sensitive Method for the Quantitation of Microgram Quantities of Protein Utilizing the Principle of Protein-Dye Binding. Anal. Biochem. 1976, 72, 248–254. [Google Scholar] [CrossRef] [PubMed]
  28. Poirier, M.; Charlet, G. Chitin fractionation and characterization in N, N-dimethylacetamide/lithium chloride solvent system. Carbohydr. Polym. 2002, 50, 363–370. [Google Scholar] [CrossRef]
  29. Setoguchi, T.; Kato, T.; Yamamoto, K.; Kadokawa, J.-I. Facile production of chitin from crab shells using ionic liquid and citric acid. Int. J. Biol. Macromol. 2012, 50, 861–864. [Google Scholar] [CrossRef] [PubMed]
  30. Focher, B.; Beltranme, P.L.; Naggi, A.; Torri, G. Alkaline Ndeacetylation of chitin enhanced by flash treatments: Reaction kinetics and structure modifications. Carbohydr. Polym. 1990, 12, 405–418. [Google Scholar] [CrossRef]
  31. Bhanvase, B.A.; Veer, A.; Shirsath, S.R.; Sonawane, S.H. Ultrasound assisted preparation, characterization and adsorption study of ternary chitosan-ZnO-TiO2 nanocomposite: Advantage over conventional method. Ultrason. Sonochem. 2019, 52, 120–130. [Google Scholar] [CrossRef]
  32. Langmuir, I. The adsorption of gases on plane surfaces of glass, mica and platinum. J. Am. Chem. Soc. 1918, 40, 1361–1403. [Google Scholar] [CrossRef]
  33. Freundlich, H. Over the adsorption in the solution. J. Phys. Chem. 1906, 57, 385–470. [Google Scholar]
  34. Crini, G.; Peindy, H.N.; Gimbert, F.; Robert, C. Removal of C.I. Basic Green 4 (Malachite Green) from aqueous solutions by adsorption using cyclodextrin-based adsorbent: Kinetic and equilibrium studies. Sep. Purif. Technol. 2007, 53, 97–110. [Google Scholar] [CrossRef]
  35. Ofomaja, A.E.; Ho, Y.S. Equilibrium Sorption of Anionic Dye from Aqueous Solution by Palm Kernel Fibre as Sorbent. Dye Pigment. 2007, 74, 60–66. [Google Scholar] [CrossRef]
  36. Al-Sareji, O.J.; Meiczinger, M.; Al-Juboori, R.A.; Grmasha, R.A.; Andredaki, M.; Somogyi, V.; Idowu, I.A.; Stenger-Kovács, C.; Jakab, M.; Lengyel, E.; et al. Efficient removal of pharmaceutical contaminants from water and wastewater using immobilized laccase on activated carbon derived from pomegranate peels. Sci. Rep. 2023, 13, 11933. [Google Scholar] [CrossRef] [PubMed]
  37. Ozacar, M. Equilibrium and Kinetic Modelling of Adsorption of Phosphorus on Calcined Alunite. Adsorption 2003, 9, 125–132. [Google Scholar] [CrossRef]
  38. Bhattacharyya, K.G.; Sharma, A. Azadirachta indica leaf powder as an effective biosorbent for dyes: A case study with aqueous Congo Red solutions. J. Environ. Manag. 2004, 71, 217–229. [Google Scholar] [CrossRef] [PubMed]
  39. Auta, M.; Hameed, B.H. Chitosan–clay composite as highly effective and low cost adsorbent for batch and fixed-bed adsorption of methylene blue. Chem. Eng. J. 2014, 237, 352–361. [Google Scholar] [CrossRef]
  40. Wang, W.; Bo, S.Q.; Li, S.Q.; Qin, W. Determination of the Mark-Houwink equation for chitosans with different degrees of deacetylation. Int. J. Biol. Macromol. 1991, 13, 281–285. [Google Scholar] [CrossRef] [PubMed]
  41. Shamshina, J.L.; Barber, P.S.; Gurau, G.; Griggs, C.S.; Rogers, R.D. Pulping of Crustacean Waste using Ionic Liquids: To Extract or Not to Extract? ACS Sustain. Chem. Eng. 2016, 4, 6072–6081. [Google Scholar] [CrossRef]
  42. Focher, B.; Naggi, A.; Torri, G.; Cosani, A.; Terbojevich, M. Structural differences between chitin polymorphs and their precipitates from solutions-evidence from CP-MAS 13CNMR, FT-IR and FT-Raman spectroscopy. Carbohydr. Polym. 1992, 17, 97–102. [Google Scholar] [CrossRef]
  43. Sharma, M.; Mukesh, C.; Mondal, D.; Prasad, K. Dissolution of α-chitin in deep eutectic solvents. RSC Adv. 2013, 3, 18149–18155. [Google Scholar] [CrossRef]
  44. Cárdenas, G.; Carbrera, G.; Taboada, E.; Miranda, S.P. Chitin characterization by SEM, FTIR, XRD, and 13C cross polarization/mass angle spinning NMR. J. Appl. Polym. Sci. 2004, 93, 1876–1885. [Google Scholar] [CrossRef]
  45. Wang, W.T.; Zhu, J.; Wang, X.L.; Huang, Y.; Wang, Y.Z. Dissolution behavior of chitin in ionic liquids. J. Macromol. Sci. Part B Phys. 2010, 49, 528–541. [Google Scholar] [CrossRef]
  46. Ifuku, S.; Nomura, R.; Morimoto, M.; Saimoto, H. Preparation of chitin nanofibers from mushrooms. Materials 2011, 4, 1417–1425. [Google Scholar] [CrossRef] [PubMed]
  47. Elhussiny, A.; Faisal, M.; D’angelo, G.; Everitt, N.M.; Fahim, I.S. Experimental Investigation of Chitosan Film Reinforced by Chitin Fibers and Chitin Whiskers Extracted from Shrimp Shell Waste. J. Eng. Sci. Technol. 2020, 15, 2730–2745. [Google Scholar]
  48. Kumirska, J.; Czerwicka, M.; Kaczyński, Z.; Bychowska, A.; Brzozowski, K.; Thöming, J.; Stepnowski, P. Application of Spectroscopic Methods for Structural Analysis of Chitin and Chitosan. Mar. Drugs 2010, 8, 1567–1636. [Google Scholar] [CrossRef] [PubMed]
  49. Sikorski, P.; Hori, R.; Wada, M. Revisit of α-chitin crystal structure using high resolution X-ray diffraction data. Biomacromolecules 2009, 10, 1100–1105. [Google Scholar] [CrossRef] [PubMed]
  50. Kaya, M.; Mujtaba, M.; Bulut, E.; Akyuz, B.; Zelencova, L.; Sofi, K. Fluctuation in physicochemical properties of chitins extracted from different body parts of honeybee. Carbohydr. Polym. 2015, 132, 9–16. [Google Scholar] [CrossRef] [PubMed]
  51. Aranaz, I.; Mengíbar, M.; Harris, R.; Paños, I.; Miralles, B.; Acosta, N.; Galed, G.; Heras, A. Functional characterization of chitin and chitosan. Curr. Chem. Biol. 2009, 3, 203–230. [Google Scholar]
  52. Dotto, G.L.; Santos, J.M.N.; Rodrigues, I.L.; Rosa, R.; Pavan, F.A.; Lima, E.C. Adsorption of methylene blue by ultrasonic surface modified chitin. J. Colloid Interface Sci. 2015, 446, 133–140. [Google Scholar] [CrossRef]
  53. González, J.A.; Villanueva, M.E.; Piehl, L.L.; Copello, G. Development of a chitin/graphene oxide hybrid composite for the removal of pollutant dyes: Adsorption and desorption study. Chem. Eng. J. 2015, 280, 41–48. [Google Scholar] [CrossRef]
  54. Aksu, Z.; Tezer, S. Biosorption of reactive dyes on the green alga Chlorella vulgaris. Process Biochem. 2005, 40, 1347–1361. [Google Scholar] [CrossRef]
  55. Guo, L.; Li, J.; Li, H.; Zhu, Y.; Cui, B. The structure property and adsorption capacity of new enzyme-treated potato and sweet potato starches. Int. J. Biol. Macromol. 2020, 144, 863–873. [Google Scholar] [CrossRef] [PubMed]
  56. Lima, V.V.C.; Nora, F.B.D.; Peres, E.C.; Reis, G.S.; Lima Éder, C.; Oliveira, M.L.; Dotto, G.L. Synthesis and characterization of biopolymers functionalized with APTES (3-aminopropyltriethoxysilane) for the adsorption of sunset yellow dye. J. Environ. Chem. Eng. 2019, 7, 103410. [Google Scholar] [CrossRef]
  57. Cakmak, M.; Tasar, S.; Selen, V.; Ozer, D.; Ozer, A. Removal of astrazon golden yellow 7GL from colored wastewater using chemically modified clay. J. Central South Univ. 2017, 24, 743–753. [Google Scholar] [CrossRef]
  58. Onida, B.; Bonelli, B.; Flora, L.; Geobaldo, F.; Arean, C.O.; Garrone, E. Permeability of micelles in surfactant-containing MCM-41 silica as monitored by embedded dye molecules. Chem. Commun. 2001, 21, 2216–2217. [Google Scholar] [CrossRef] [PubMed]
  59. Lafi, R.; Montasser, I.; Hafiane, A. Adsorption of congo red dye from aqueous solutions by prepared activated carbon with oxygen-containing functional groups and its regeneration. Adsorpt. Sci. Technol. 2018, 37, 160–181. [Google Scholar] [CrossRef]
  60. Liu, S.; Ding, Y.; Li, P.; Diao, K.; Tan, X.; Lei, F.; Zhan, Y.; Li, Q.; Huang, B.; Huang, Z. Adsorption of the anionic dye Congo red from aqueous solution onto natural zeolites modified with N,N-dimethyl dehydroabietylamine oxide. Chem. Eng. J. 2014, 248, 135–144. [Google Scholar] [CrossRef]
  61. Purkait, M.K.; Maiti, A.; DasGupta, S.; De, S. Removal of congo red using activated carbon and its regeneration. J. Hazard. Mater. 2007, 145, 287–295. [Google Scholar] [CrossRef]
  62. Litefti, K.; Freire, M.S.; Stitou, M.; Gonzalez-Alvarez, J. Adsorption of an anionic dye (Congo red) from aqueous solutions by pine bark. Sci. Rep. 2019, 9, 16530. [Google Scholar] [CrossRef]
  63. Mitrogiannis, D.; Markou, G.; Çelekli, A.; Bozkurt, H. Biosorption of methylene blue onto Arthrospira platensis biomass: Kinetic, equilibrium and thermodynamic studies. J. Environ. Chem. Eng. 2015, 3, 670–680. [Google Scholar] [CrossRef]
  64. Hou, F.; Wang, D.; Ma, X.; Fan, L.; Ding, T.; Ye, X.; Liu, D. Enhanced adsorption of Congo red using chitin suspension after sonoenzymolysis. Ultrason. Sonochem. 2021, 70, 105327. [Google Scholar] [CrossRef]
  65. Wei, C.; Huang, Y.; Liao, Q.; Xia, A.; Zhu, X.; Zhu, X. Adsorption thermodynamic characteristics of Chlorella vulgaris with organic polymer adsorbent cationic starch: Effect of temperature on adsorption capacity and rate. Bioresour. Technol. 2019, 293, 122056. [Google Scholar] [CrossRef]
  66. Kumar, R.; Barakat, M.A. Decolourization of hazardous brilliant green from aqueous solution using binary oxidized cactus fruit peel. Chem. Eng. J. 2013, 226, 377–383. [Google Scholar] [CrossRef]
Figure 1. Biuret test for protein in obtained samples.
Separations 10 00599 g001
Figure 2. FT-IR spectra of the extracted chitin samples and shrimp shells.
Separations 10 00599 g002
Figure 3. XRD data of chitin separated from shrimp shells.
Separations 10 00599 g003
Figure 4. Scanning electron microscopy (SEM) of the extracted chitin samples. CGAC 5% (A), CGAC 7% (B), and CGAC 9% (C).
Separations 10 00599 g004
Figure 5. (a) Time contact (CR Ci = 50 mg/L), (b) effect of CR initial concentration to the adsorption of CR (mchitin = 75 mg, V = 50 mL, 250 rpm, T = 20 °C, pH = 7).
Separations 10 00599 g005
Figure 6. Determination of pHpzc for (a) CGAC 5%, (b) CGAC 7%, and (c) CGAC 9%.
Separations 10 00599 g006aSeparations 10 00599 g006b
Figure 7. (a) pH effect; (b) temperature effect on the adsorption of CR with chitin (mchitin = 75 mg, V = 50 mL, 250 rpm, Ci = 50 mg/L).
Separations 10 00599 g007
Figure 8. Adsorption of CR on different chitin samples CGAC5%, CGAC7% and CGAC9% through the Langmuir and Freundlich isotherm models (ac): non-linear fittings. (d,e): linear fittings.
Separations 10 00599 g008aSeparations 10 00599 g008b
Figure 9. Kinetic parameters plot for CR adsorption with chitin samples, (a) pseudo-first-order, (b) pseudo-second-order, and (c) intra-particle diffusion models.
Separations 10 00599 g009aSeparations 10 00599 g009b
Figure 10. Thermodynamic parameters plot of the chitin samples at various temperatures.
Separations 10 00599 g010
Figure 11. (a) Percentage of CR released from chitin employing different desorbing agents. (b) CR adsorption–desorption cycles (adsorption: Ci of CR = 50 mg/L, pH 7, V = 50 mL, contact time: 130 min; desorption: 50 mL of 0.01 M NaOH, contact time: 45 min).
Separations 10 00599 g011aSeparations 10 00599 g011b
Figure 12. (a) FT-IR spectra of CR, CGAC 5%, and CGAC@CR; (b) the proposed adsorption mechanism of Congo red adsorption with chitin at an acidic pH.
Separations 10 00599 g012
Table 1. The chemical composition of shrimp shells and the extracted chitin, and related properties.
SamplesYield
(%)
Water (%)ASH
(%)
Protein
(%)
Purity
%
Intrinsic Viscosity (dL/g)M (KDa)
Shrimp shells-9.90 ± 0.1438.30 ± 1.0527.845 ± 2.29---
CGAC 5%41.25 ± 0.233.33 ± 0.610.354 ± 0.191.7966 ± 0.54946.946167
CGAC 7%29.64 ± 0.123.05 ± 0.210.177 ± 0.341.7237 ± 0.27956.160147
CGAC 9%28.07 ± 0.032.62 ± 0.150.165 ± 0.280.6464 ± 0.41974.799113
Table 2. Equilibrium parameters for CR adsorption on chitin.
LangmuirFreundlich
qm (mg/g)RLKLR21/nfKfR2
CGAC5%34.6740.74–0.260.0350.9270.5912.2990.949
CGAC7%28.4830.52–0.120.0910.9350.4264.7310.805
CGAC9%36.1230.55–0.130.0820.9810.4884.8990.939
Table 3. Kinetic parameters for CR adsorption with chitin samples.
qe (mg/g)
exp
Pseudo 1st OrderPseudo 2nd OrderIntra-Particle Diffusion
qe cal (mg/g)R2K1 (min−1)qe cal(mg/g)R2K2
(min−1)
KintCR2
CGAC5%15.5918.640.9050.02129.870.7492.63 × 10−41.66−3.380.975
CGAC7%19.1023.420.8620.01532.800.8132.07 × 10−41.61−3.040.967
CGAC9%21.7620.950.9120.02426.330.9661.15 × 10−31.573.810.976
Table 4. Thermodynamic parameters for the adsorption of CR on various chitin samples.
AdsorbentT (K)KdΔG° (kJ/mol)ΔH° (kJ/mol)ΔS°
(J/mol)
R2
GCAC5%293
303
313
323
0.586
0.613
0.757
0.824
1.301
1.231
0.724
0.519
7.4220.640.980
GCAC7%293
303
313
323
0.895
1.123
1.296
1.633
0.270
−0.292
−0.674
−1.316
11.1637.280.922
GCAC9%293
303
313
323
1.254
1.427
3.707
5.437
−0.551
−0.895
−3.407
−4.544
32.31110.860.965
Disclaimer/Publisher’s Note: The statements, opinions and data contained in all publications are solely those of the individual author(s) and contributor(s) and not of MDPI and/or the editor(s). MDPI and/or the editor(s) disclaim responsibility for any injury to people or property resulting from any ideas, methods, instructions or products referred to in the content.

