Abstract
Supercritical fluid chromatography (SFC) has witnessed a resurge of interest in the last decade, motivated by substantial progress in hardware capabilities and the development of specifically tailored packing materials. Meanwhile, the technique has been transitioning to the use of mobile phases in which an organic co-solvent is mixed to carbon dioxide under subcritical conditions (subFC). The use of a mobile phase modifier will also affect the selectivity, and extend the range of SFC-amenable compounds, including lipids. In this research, a subFC method was developed for the separation of triacylglycerols (TAGs) in edible oils of vegetable origin, namely borage, corn, hazelnut, olive, palm, peanut, and soybean oil. For all the samples investigated, elution of the TAG species was achieved within 8 min, the only exception being borage oil (14 min run), characterized by TAGs spanning in a wide range of partition number (PN 36–56), as constituted by fatty acids differing for alkyl chain lengths (CN 14–24), and degree of unsaturation (DB 0–9). The coupling to mass spectrometry (MS) detection allowed for the average parameters of fatty acid composition to be derived in the oil TAG constituents. A total of 121 TAGs were identified by subFC-MS, with reduced analysis time and solvent consumption (1.5 mL per analysis) compared to common chromatographic approaches. Key features of the method developed hereby are low toxicity, costs, and environmental impact. Notably, the achieved separations were conducted at room temperature, which is beneficial in terms of column life.
1. Introduction
The task of triacylglycerols (TAGs) analysis and profiling is of concern in different fields, including metabolomics, pharmaceuticals, cosmetics, and foods [1,2,3]. TAGs dietary intake represents the main source of free fatty acids (FAs) and polyunsaturated fatty acids (PUFAs), which exert a functional role as essential components of all membranes, as gene regulators, and as direct substrates for energy production via the beta oxidation pathway [4,5]. PUFAs are precursors of biologically active metabolites (like the eicosanoids), while α-linolenic acid (ALA, C18:3, omega-3) and linoleic acid (LA, C18:2, omega-6) are essential for humans [6]. A PUFA deficiency can result in retarded growth, dermatitis, kidney diseases, and several brain disorders [7,8].
TAGs account almost wholly for the composition of most animal fats (e.g., butter, tallow, lard, and processed products like margarine) and vegetable oils of commercial relevance. As a consequence, TAGs determine the functionalities of these lipid substances either as food ingredients or for the physiological effects resulting from food intake. For such reasons, profiling of the intact TAGs in fats and oils is a key tool for their characterization, allowing confirming authenticity or detecting adulterations, as well as for the prediction of their physical/physiological properties (and those of the derived food products). Apart from food quality and health concerns, TAG analysis is significant in the food industry, for a number of other reasons, i.e., legal, economic, and processing issues [9,10].
A variety of chromatographic techniques have been employed for TAG analysis and separation, including thin layer chromatography (TLC), high-performance liquid chromatography (HPLC), capillary electrochromatography (CEC), gas chromatography (GC), supercritical (SFC), and subcritical fluid chromatography (SubFC) [11]. Multidimensional comprehensive methods have also been implemented to attain superior separation power [12,13] and improve the detection for lipid samples of high complexity [14,15]. As for detection, the coupling to mass spectrometry (MS) may provide additional resolution and bring complementary information to retention data, consisting of molecular weight and possibly fragment ions [16,17,18]. HPLC methods using reversed-phase (RP) and silver ion columns have been widely applied for the separation of intact TAGs, either independently or in offline or online combinations, the latter exploiting the complementary nature of the two retention mechanisms and, thus, of the information attainable. In RP-HPLC, the retention of TAGs increases with the increasing degree of hydrophobicity, commonly expressed in terms of partition number (PN), as given by the sum of the total carbon number of all acyl chains (CN), minus twice the number of double bonds (DB): PN = CN-2DB [19]. Under properly optimized conditions, the separation of critical TAG pairs within the same PN group is also feasible, as well as the resolution of TAGs differing only in the position of double bond(s). On the other hand, the technique does not allow discriminating between regioisomers and diastereomers. The latter two issues may be addressed by the use of silver ion columns, on which TAG separation is controlled by the unsaturation degree, and the distribution of DBs in the FA chains. Both RP- and silver ion HPLC rely on the use of low polarity, non-aqueous (NA) mobile phases, which are well suited to the non-polar nature of TAGs. One main advantage of both techniques consists in the use of mild temperatures, so that degradation risks of the more labile long-chain PUFAs are minimized [20].
On the other hand, SFC is well suitable for lipid analysis, and the reduced organic solvent consumption with respect to LC has favorable fallout in terms of toxicity, costs, and environmental impact. Furthermore, the low mobile phase viscosity and the higher diffusion coefficients allow for faster or more efficient separations to be attained by the use of high linear velocities or longer columns, respectively [21]. Additionally, shorter re-equilibration times are needed, after each gradient elution in SFC, allowing for faster separations and better resolution to be achieved [22]. Advantages of the use of SFC over other chromatographic techniques practiced for lipid analysis have been demonstrated for TAG analysis [23,24,25] and are discussed in a number of reviews focusing on food lipids [26,27].
Most recent SFC and SubFC separation techniques are based on packed columns, operated with small (2–40%) percentages of a polar organic solvent (co-solvent or modifier) added to the CO2 mobile phase. The purpose is to allow the solubility of more polar analytes, resulting in less retention, reduced peak tailing phenomena, and minimized undesired interactions between the analytes and active residual silanol groups on the stationary phase. The use of a co-solvent will in turn affect the selectivity, by introducing additional hydrogen bonding or dipole–dipole interactions. The critical temperature (31 °C) and pressure (73 bar) of pure CO2 will rapidly increase, depending on the amount (and the nature) of the modifier. As an example, for a mobile phase containing 3.5% MeOH into CO2, a temperature of 40 °C and a pressure of 83 bar would be required to maintain the supercritical state. A practical consequence is that, under a typical gradient program at the mild temperatures adopted for the separations, a subcritical fluid will be obtained very quickly, since the conditions required to maintain a supercritical mobile phase would be non-practicable (e.g., 135 °C and 168 bar for a 70:30 CO2:MeOH mixture). Operating at such high temperatures would be in fact detrimental for most HPLC columns, since commonly employed stationary phases would soon degrade. Moreover, the heating system should be fast and precise enough to avoid temperature gradients in the separation column (and peak broadening).
The main aspects of packed column SFC and SubFC have been critically reviewed by Lesellier and West [28]. It is highlighted in the discussion how recent instrumental developments have contributed to make efficiency and sensitivity of modern SFC and SubFC comparable to that of HPLC or ultra-high pressure HPLC (UHPLC). Minimized void volumes, higher pressure capabilities, and the novel design of backpressure regulator have made SFC and SubFC operation with sub-2 μm and superficially porous particles feasible [29,30]. A number of packing materials specifically tailored for SFC have been introduced, affording improved selectivity, peak shape, and sample capacity [31]. Applications of packed SFC (pSFC) for TAG profiling in foodstuffs have been reviewed recently [32], mainly based on octadecylsilica (ODS) columns. In these applications, retention of TAGs on ODS stationary phases closely resembles that observed under NARP-LC conditions, as PN is the main factor ruling a separation. Moreover, for TAGs within the same PN group, a linear relationship has been demonstrated between TAG retention and their DB values.
The aim of this research was the characterization of the TAG profile in edible oils of vegetable origin, using CO2 as the main mobile phase solvent, under subcritical conditions. The coupling to quadrupole MS detection allowed for the average parameters of FA composition to be derived in the oil TAG constituents identified. Advantages of the method proposed over conventional HPLC separations include considerably reduced analysis times and related costs, organic solvent consumption, and environmental impact.
2. Materials and Methods
2.1. Chemicals and Standards
Compressed CO2 (99.9% grade) used as the main mobile phase was from Rivoira (Milan, Italy); LC-MS grade solvents (acetonitrile (AcN), ethanol (EtOH), n-hexane, isopropyl alcohol (IPA), and methanol (MeOH), used as the modifier or sample diluent and standard TAGs (trilinolein (C18:2/C18:2/C18:2) and 1,3-palmitin-2-olein (C16:0/C18:1/C16:0)) were from Merck Life Science (Darmstadt, Germany).
2.2. Samples and Sample Preparation
Samples of borage oil (Borago officinalis L.), corn oil (Zea mays L.), refined hazelnut oil (Corylus colurna L.), extravirgin olive oil (Olea europaea L.), palm oil (Elaeis guineensis L.), peanut oil (Arachis hypogaea L.), and soybean oil (Glycine max L.) were from a local market. All samples were filtered through 0.45 µm Acrodisc nylon membrane filter (Merck Life Science, Darmstadt, Germany) and diluted with IPA (around 100 ppm) prior to SubFC-MS analyses.
2.3. Instruments
SubFC-MS analyses were performed on a Nexera SFC system coupled to an LCMS-2020 liquid chromatograph mass spectrometer through an atmospheric pressure chemical ionization (APCI) interface (Shimadzu Europa, Duisburg, Germany). The SFC system consisted of the following modules: Nexera UC LC-30ADSF CO2 pump, Nexera UC SFC-30A Back Pressure Regulator, Nexera XR LC-20ADXR liquid chromatograph, DGU-20A3R degassing unit, CTO-20AC Prominence column oven, Nexera X2 SIL-30AC autosampler, CBM-20A Communication Bus Module. The instrument was controlled by Shimadzu LabSolution ver. 5.82 software.
2.4. Analytical Conditions
Chromatographic separations were carried out on Ascentis Express C18 (100 × 30 mm L × i.d., 2.0 μm d.p., partially porous) column (Merck Life Science, Darmstadt, Germany). The column was operated at a constant mobile phase flow rate of 1.0 mL/min. The injection volume was 2.0 μL. The following experimental parameters were investigated: nature and percentage of modifier (AcN, EtOH, IPA) into compressed CO2, type of elution (isocratic vs. gradient), gradient profile, and column temperature (20° C and 30° C). Under optimized experimental conditions SubFC separation of the vegetable oil samples was achieved under the following conditions: column temperature, 20° C; ABPR set, 150 bar and 50 °C; and gradient elution of AcN into CO2, 0–5 min, 5% B, 5–15 min, to 20% B, hold for 3 min.
The MS spectra were acquired under the following conditions: APCI mode, positive; acquisition mode, scan; mass range, 200 to 1200 m/z; interface temperature, 250 °C; desolvation line temperature, 200 °C; heat block, 200 °C; nebulizing gas flow, 2.5 L min−1; and dry-gas flow, 5.0 L min−1. The effluent from the SFC system was delivered to the MS interface by means of the shortest length of insulated peek tubing (0.005″ i.d).
3. Results and Discussion
Analysis of the plant oil samples (borage, corn, hazelnut, olive, palm, peanut, and soybean oil) was carried out on a 10 cm ODS column consisting of superficially porous particles (2.0 μm).
For optimization of the SubFC method, in terms of TAG separation, peak shape, and analysis time, the effect of selected parameters was investigated, i.e., column temperature, nature, and percentage of organic modifier, elution, and gradient steepness. The retention behaviour of TAGs on RP ODS columns as a function of the temperature has been previously investigated, with neat CO2 as the mobile phase (at a pressure of 150 bar) [33]. It has been demonstrated that in the supercritical region (35–45 °C) TAG retention increases with increasing temperature, due to the decrease of density, while an opposite behaviour was observed by lowering the temperature below the critical point of 31.3 °C. At the subcritical temperatures employed in this work (20–30 °C) and in the presence of an organic modifier added to CO2 mobile phase, it was observed that TAG retention decreased with increasing temperature, in a similar way to HPLC but to a lesser extent. In accordance with previous research [34] the separation of TAGs containing saturated FAs (such as miristic acid, palmitic acid, and stearic acid) was more affected by changes in the temperature, likely as a result of the larger changes in the solubility (data not shown). On the basis of the results obtained hereby, a column temperature of 20 °C proved to be the best choice in terms of elution times and compound separation.
For selection of the mobile phase to be employed for TAG separation, AcN, EtOH, and IPA were evaluated as co-solvents, in search of optimum selectivity. The results obtained for a sample of olive oil, with regard to the elution window of the main TAG constituents, are shown in Figure 1. A gradient from 2 to 20% of EtOH into CO2, at 1.0 mL/min, allowed for complete sample TAG elution within 11 min (Figure 1A). Trioleoyl-glycerol (triolein, OOO) eluted at a retention time (tR) of 5.9 min, with a mobile phase containing < 3% of the modifier, and was partially co-eluted with a TAG molecule having the same PN, namely dioleoyl-palmitoyl-glycerol (OOP). Baseline separation was not achieved for main TAG constituents of olive oil, i.e., OOO and OOP with PN 48, oleoyl-linoleyl-palmitoyl-glycerol (OLP), and dioleoyl-linoleyl-glycerol (OLO) with PN 46.
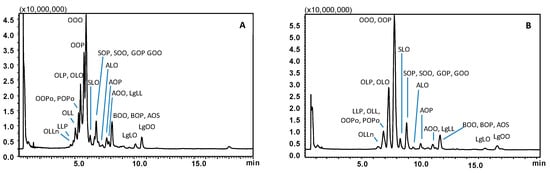
Figure 1.
SubFC-APCI-MS TAG profiles obtained for an extra virgin olive oil sample employing a gradient of EtOH (A) and IPA (B) into CO2. Column: Ascentis Express C18, 100 × 30 mm L × i.d., 2.0 μm d.p., partially porous. Column temperature, 20 °C; ABPR, 150 bar and 50 °C; gradient elution of EtOH (A) or IPA (B) into CO2, 2% to 20% B in 20 min at 1.0 mL/min. Injection volume, 2.0 μL. Peak labeling as in Table 1.
Replacing EtOH with IPA resulted in increased retention, yet the separation was markedly impaired. As can be appreciated in Figure 1B, OOO and OOP entirely co-eluted at tR 7.8 min within a single peak and OLO and OLP were also totally co-eluted at tR of 7.3 min. Remarkably, severe co-elutions also occurred for TAGs differing in the PN, i.e., dioleoyl-palmitoleyl-glycerol (OOPo) and palmitoyl-oleyl-palmitoleyl-glycerol (POPo) with PN 46, dilinoleyl-oleyl-glycerol (OLL) and dilinoleyl-palmitoyl-glycerol (LLP) with PN 44 all showed up under a single broad peak around 7 min. Changes in the gradient steepness did not improve the separation either using EtOH or IPA in the mobile phase.
Finally, the employment of AcN as a modifier afforded baseline resolution of the four most abundant TAG constituents of the sample analyzed (i.e., the critical pairs OOO/OOP, OLO/OLP). Finally, being the separation of much more complex samples (i.e., borage oil) foreseen, a much steeper gradient was designed to keep the analysis time reduced. As can be seen in Figure 2A, co-elution of TAGs within different PN values was no longer observed, and moreover, the separation of the most abundant TAGs belonging to the same PN was also achieved. In detail, the critical pairs OOP and OOO, with PN 48, showed up as well-separated peaks at tR of 5.2 and 5.5 min, respectively; OLP and OLO with PN 46 were eluted at tR of 4.6 and 4.8 min, respectively. Moreover, TAGs with PN values of 42–44 which co-eluted under CO2/IPA gradient, were partially resolved as follows: OLLn at tR of 3.9 min (PN 42), LLP at tR of 4.1 min, and OLL at tR of 4.2 min (PN 44). The different selectivity afforded by the use of AcN/CO2 mobile phase, over the ones containing alcohol modifiers may be explained on the basis of additional dipole–dipole interactions established with the TAG molecules, especially more unsaturated compounds.
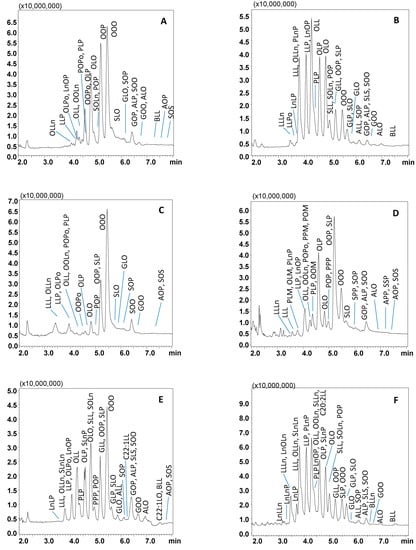
Figure 2.
SubFC-APCI-MS TAG profiles of extra virgin olive oil (A), corn oil (B), hazelnut oil (C), palm oil (D), peanut oil (E), soybean oil (F). Relevant part of the TAGs elution region, employing a gradient of AcN into CO2. Column: Ascentis Express C18, 100 × 30 mm L × i.d., 2.0 μm d.p., partially porous. Column temperature, 20 °C; ABPR, 150 bar and 50 °C; gradient elution of AcN into CO2, 0–5 min, 5% B, 5–15 min, to 20% B at 1.0 mL/min. Injection volume, 2.0 μL. Peak labeling as in Table 1.
Following optimization, SubFC separation of the vegetable oil samples was carried out under the following conditions: column temperature, 20 °C; ABPR, 150 bar, and 50 °C; gradient elution of AcN into CO2, 0–5 min, 5% B, 5–15 min, to 20% B. For all the samples investigated, elution of the most abundant TAG species was achieved within 8 min, as shown in the chromatograms in Figure 2A–F, the only exception being borage oil (14 min analysis time), illustrated in Figure 3. The latter sample was characterized by TAGs spanning in a wide range of PN (36–56), as constituted by FAs differing for alkyl chain lengths (CN 14–24) and degree of unsaturation (DB 0–9). Table 1 lists PN, DB, and the calculated m/z values (protonated molecular ions observed by APCI-MS) of the 121 TAG components identified in the vegetable oil samples; among these, 81 were detected in borage oil. The other oil samples investigated were characterized by lower complexity, namely: corn oil, 42 TAGs, 40–56 PN range, and 1–7 DB value; hazelnut oil, 23 TAGs, 42–52 PN range, and 1–6 DB value; olive oil, 34 TAGs, 42–56 PN range, and 1–6 DB value; palm oil, 41 TAGs, 40–56 PN range, and 0–7 DB value; peanut oil, 53 TAGs, 42–56 PN range, and 0–6 DB value; soybean oil, 49 TAGs, 38–54 PN range and 1–8 DB value.
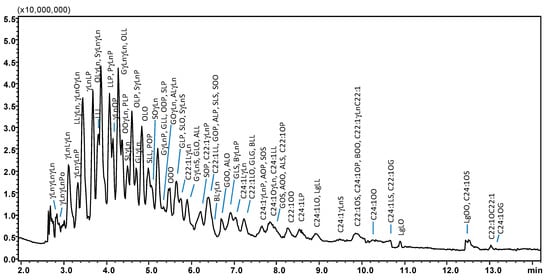
Figure 3.
SubFC-APCI-MS TAG profile of a borage seed oil sample, employing a gradient of AcN into CO2. Column: Ascentis Express C18, 100 × 30 mm L × i.d., 2.0 μm d.p., partially porous. Column temperature, 20 °C; ABPR, 150 bar and 50 °C; gradient elution of AcN into CO2, 0–5 min, 5% B, 5–15 min, to 20% B at 1.0 mL/min. Injection volume, 2.0 μL. Peak labeling as in Table 1.

Table 1.
TAG composition 1 of the oil samples investigated, reported according to the increasing PN (partition number) obtained by SubFC on an ODS column. The DB (double bond) number and the experimental m/z values of the protonated molecular ions ([M + H]+exp.) are also reported.
Individual TAGs were identified on the basis of the observed protonated molecular ions, [M + H]+, and the [M + H-RCOOH]+ fragment ions originated from the loss of FA moieties from the glycerol backbone. The abundant in-source fragmentation assisted in compound identification, based on the number and relative abundance of the resulting diacylglycerol-like (DG+) fragment ions. Namely, the cleavage of FAs from the sn-1 and sn-3 positions on the glycerol skeleton was preferred compared to the sn-2 position. The [M + H-R1COOH]+ and [M + H-R3COOH]+ ions observed were more intense than the [M + H-R2COOH]+ ion, accordingly. Such behaviour was useful in determining the prevailing FA in the sn-2 position.
Following a common practice, TAGs in Table 1 are notated according to the decreasing FA molecular masses. Indeed, sn-1 and sn-3 positions were not determined and considered equivalent; yet a preference of unsaturated FAs (namely linoleic acid) in the sn-2 position is reported in the literature for plant oils. Furthermore, according to the literature, borage oil contains high levels of ω-6 polyunsaturated FAs (PUFAs), including linoleic (18:2) and γ-linolenic acids (18:3) [35,36].
To account for the different response factors to the mass analyzer of the different TAG species, the method limit of detection (LOD) was estimated by injection of standard LLL and POP solutions. The experimental LOD values were 4.7 ng and 14.3 ng, respectively.
From the chromatogram in Figure 3 it can be seen that all the TAG species contained in borage oil were eluted within 14 min, with a mobile phase containing around 20% of the modifier (AcN). From the list of identified compounds in Table 1 it appears that the elution order of TAGs was mainly governed by hydrophobicity of the solutes, since retention increases from PN 36 (γLnγLnγLn) to PN 56 (C24:1OG). Similarly to what was observed in RP-HPLC on ODS columns and in SubFC with neat CO2, the apolar character of TAGs becomes dominant at higher PN values, providing more interaction with the separation medium and diminished solubility in the mobile phase; as a result, the retention increases. Likewise, for compounds having identical PN (but differing in CN and DB) reversion of the retention order was observed, e.g., the OLL-LLP (PN 44) elution order reported in RP-HPLC became LLP-OLL in SubFC with AcN. An increase in the DB value resulted in the faster elution of TAGs within the same PN, due to the increase in polarity and solubility in the mobile phase (LLP: CN 52, DB 4; OLL: CN 54, DB 5).
Baseline resolution was not achieved for peak pairs such as C18:2/C18:2/C18:3 (LLγLn) and C18:3/C18:1/C18:3 (γLnOγLn), only differing by double bond location in the alkyl chains. Likewise, GOO (C20:1/C18:1/C18:1) e ALO (C20:0/C18:2/C18:1) critical pairs were longer retained and always separated except that in borage oil.
Furthermore, the presence in different oil samples analyzed of different combinations of oleic (C18:1)(O) and linoleic (C18:2)(L) acid chains, allowed to study the change in selectivity for TAG compounds differing by one double bond, e.g., the series OOO/OLO/OLL/LLL with PN values ranging from 48 to 42 (DB 3–6). For this TAG series displaying the same CN, a linear relationship was found to exist between log k vs. DB. Furthermore, the replacement of one L chain with one Ln progressively increased unsaturation of the TAG compounds, namely LLγLn/γLnLγLn/γLnγLnγLn, with PN values ranging from 40 to 36 (DB 7–9). The same linear equation could be extended to include the last three compounds:
- -
- OOO/OLO/OLL/LLL/LLγLn/γLnLγLn/γLnγLnγLn, y = −0.0537x + 1.1497 (R2 = 0.9993).
Similarly, linearity was found in the log k vs. DB dependence for the following TAG series with the same CN, differing by 1 DB and 2 PN:
- -
- SOO/SLO/SLL/SLLn, y = −0.0652x + 1.2051 (R2 = 0.9982);
- -
- OOP/OLP/OLnP/PLLn, y = −0.0555x + 1.0825 (R2 = 0.9993);
- -
- SOS/SOO/OOO/OLO/OOLn/OLLn/OLnLn, y = −0.0632x + 1.1978 (R2 = 0.992);
- -
- OOPo/OLPo/LLPo/γLnγLnP/γLnγLnPo, y = −0.0573x + 1.0769 (R2 = 0.9972);
- -
- SLS/SγLnS/SOγLn/SLγLn/SγLnγLn, y = −0.0600x + 1.1956 (R2 = 0.9963).
Also in these series, successive replacement of one FA moiety varies DB by one, and the retention decreases as mainly governed by hydrophobicity.
The presence of palmitic (C16:0)(P), stearic (C18:0)(S), linoleic (C18:2)(L), and linolenic (C18:3)(Ln) chains also allowed to study the change in selectivity for varied series of TAG compounds differing either by one chain and two or three double bonds, with PN decreasing by two or four:
- -
- PPP/PLP/PLL/LLL, y = −0.0197x + 0.9389 (R2 = 0.9402);
- -
- SPP/SγLnP/SγLnγLn, y = −0.0257x + 1.0382 (R2 = 0.9753);
- -
- PPP/PγLnP/γLnγLnP/γLnγLnγLn, y = −0.0314x + 0.948 (R2 = 0.9983);
- -
- SPP/SLnP/SLnLn, y = −0.0357x + 1.0356 (R2 = 0.9861).
For compounds of identical PN, separation was achieved on the basis of the unsaturation number. Namely, for the series POP/OOP/OOO, SOP/SOO/GOO, APP/AOP/AOO/BLO retention increased linearly with the DB value, due to an increase in TAG polarity starting from the more saturated compounds. Taking into account the P-O series, it appears the greater solubility of the short, saturated palmitate chains vs. the longer, unsaturated oleate ones in the subcritical mobile phase employed. This behaviour is similar to what was observed in silver ion chromatography [19,20,37,38], with the inversion of the elution order observed in RP-HPLC [33,39,40]. Finally, a linear trend is shown in Figure 4 of log k vs. DB, covering the entire DB range of TAGs, i.e., from the monounsaturated SOS to γLnγLnγLn, which contains nine double bonds.
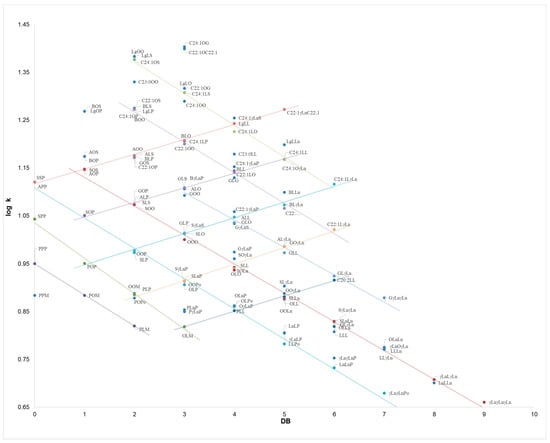
Figure 4.
Dependence of log k vs. DB for 121 TAG compounds, as obtained from independent subFC-APCI-MS analyses of seven oil samples: borage oil (Borago officinalis L.), corn oil (Zea mays L.), refined hazelnut oil (Corylus colurna L.), extra virgin olive oil (Olea europaea L.), palm oil (Elaeis guineensis L.), peanut oil (Arachis hypogaea L.), and soybean oil (Glycine max L.). The parametric equations are reported in the text. TAG notation as in Table 1.
The dependence of log k vs. DB is plotted in Figure 4 for all the TAG compounds identified in the vegetable oils, as obtained from the average tR values of three replicate analyses of the seven samples. For sake of clarity, only the most significant trend lines are shown, while the other parametric equations obtained for the main TAG series are reported below:
- -
- PPP/POM/PLM, y = −0.0652x + 0.9499 (R2 = 0.9998);
- -
- SPP/POP/PLP/OLM, y = −0.074x + 1.0352 (R2 = 0.9927);
- -
- SSP/SOP/OOP/OOPo/OLPo/LLPo/γLnγLnP/γLnγLnPo, y = −0.0632x + 1.1082 (R2 = 0.9957);
- -
- SOS/SOO/OOO/OLO/OLL/OLγLn/γLnLγLn/γLnγLnγLn, y = −0.0603x + 1.1904 (R2 = 0.9957);
- -
- GOS/GLS/GLO/GLL/GLγLn/GγLnγLn, y = −0.0595x + 1.2831 (R2 = 0.9922);
- -
- C22:1OS/C22:1OO/C22:1LO/C22:1LL/C22:1LγLn, y = −0.0636x + 1.3944 (R2 = 0.9943);
- -
- C24:1OS/C24:1LS/C24:1LO/C24:1LL/C24:1LγLn, y = −0.0664x + 1.5047 (R2 = 0.9924);
- -
- APP/AOP/AOO/BLO/LgLL/C22:1γLnC22:1, y = 0.0309x + 1.1166 (R2 = 0.9972);
- -
- SOP/SOO/ALO/BLL/C24:1LL, y = 0.0304x + 1.0172 (R2 = 0.9928);
- -
- POP/SLP/GLP/ALL/BLγLn/C24:1LγLn, y = 0.0328x + 0.9147 (R2 = 0.9959);
- -
- PLP/SLnP/SOLn/GOγLn/C22:1LγLn, y = 0.0344x + 0.8116 (R2 = 0.9902);
- -
- OLM/PLL/SLLn/C20:2LL, y = 0.0322x + 0.7216 (R2 = 0.9989).
Relative standard deviations between the samples were in the 0.15–4.63 range (except for cases like γLnγLnγLn which was found only in borage, for which inter-sample RSD% could not be calculated), thus demonstrating the reproducibility of the method.
It must be specified at this point that the parameter calculated as “k” does not exactly represent the retention factor, since it does not account for the gradient elution. Thus, it should be regarded as “relative retention time”, which is likely to change with changes in column dimensions and the mobile phase flow rate.
Comparing the efficiency and sensitivity of SFC-MS methods to those of LC-MS ones is a frequent issue. From the separation standpoint, the use of CO2 as the main mobile phase solvent may afford complementary selectivity to LC, especially if working in SubFC conditions. The addition of a modifier will not only affect the polarity of the eluent, but also its density, and will further interact with the stationary phase by deactivation of active sites. Moreover, the reduced viscosity and increased diffusivity allow operation at higher linear velocities, resulting in a faster chromatographic analysis compared to LC. Taking borage oil as an example, 88 TAGs were separated by NARP-LC, using a 109 min gradient and organic solvent in excess of 100 mL [35]. In this study, similar results (81 separated TAGs) were achieved in 15 min by SubFC, and notably the consumption of AcN as mobile phase modifier was estimated (in excess) as equal to 1.5 mL per analysis.
From the detection standpoint, the method hereby proposed was not assessed for quantitative capabilities. In principle, the better desolvation efficiency achieved in the coupling of SubFC to MS should favour greater sensitivity, as only a small portion of organic solvent enters the MS interface at the outlet of the BPR (or the column, depending on the interface type). However, a CO2 expansion may result in poor solvation of the solutes, and their precipitation into the transfer capillary. To compensate for this, a make-up solvent may be added to increase the solubility of the components and promote their ionization. Nonetheless, such an aspect was disregarded in this research, which was only aimed at qualitative fingerprinting.
4. Conclusions
The SubFC method developed hereby alleviates common drawbacks associated to NARP-LC methods, consisting in relatively long run times and the use of toxic solvents. Qualitative TAG fingerprinting was achieved in a series of vegetable oils within analysis times reduced by a factor of 14 and negligible organic solvent consumption. In addition, CO2 is easily evaporated and recycled, improving the economics and environmental footprint of the separation process.
The RSD% obtained for TAG retention times obtained from the analysis of seven different samples demonstrate good reproducibility of the method, even in the absence of make-up solvent prior to MS detection. Thus, the “green” character of the separation was not impaired. Current research is directed to address the method limitation, in terms of quantitative analysis.
Author Contributions
Conceptualization and methodology, P.D.; validation, E.T. and D.S.; formal analysis, P.A., M.O. and T.M.G.S.; investigation, T.M.G.S.; data curation, P.A., M.O. and T.M.G.S.; writing—original draft preparation, P.D. and M.O.; writing—review and editing, P.D., M.O. and P.A.; visualization, E.T. and D.S.; resources, supervision, project administration, and funding acquisition, L.M. All authors have read and agreed to the published version of the manuscript.
Funding
This research received no funding.
Data Availability Statement
The data presented in this study are available within the article.
Acknowledgments
The authors are grateful to Shimadzu Europa (Duisburg, Germany) and Merck Life Science (Darmstadt, Germany) for the continuous support.
Conflicts of Interest
The authors declare no conflict of interest.
References
- Galanakis, C.M. Lipids and Edible Oils Properties, Processing and Applications, 1st ed.; Academic Press: London, UK, 2020. [Google Scholar]
- Wenk, M.R. Encyclopedia of Lipidomics, 1st ed.; Springer: Dordrecht, The Netherlands, 2022. [Google Scholar]
- Holčapek, M.; Liebisch, G.; Ekroos, K. Lipidomic Analysis. Anal. Chem. 2018, 90, 4249–4257. [Google Scholar] [CrossRef]
- Gyamfi, D.; Awuah, E.O.; Owusu, S. Lipid Metabolism: An Overview. In The Molecular Nutrition of Fats; Patel, V.B., Ed.; Academic Press: London, UK, 2019; pp. 17–32. [Google Scholar] [CrossRef]
- Brown, H.A.; Marnett, L.J. Introduction to lipid biochemistry, metabolism, and signaling. Chem Rev. 2011, 111, 5817–5820. [Google Scholar] [CrossRef]
- Djuricic, I.; Calder, P.C. Beneficial Outcomes of Omega-6 and Omega-3 Polyunsaturated Fatty Acids on Human Health: An Update for 2021. Nutrients 2021, 13, 2421. [Google Scholar] [CrossRef] [PubMed]
- James, W.; Elston, D.; Treat, J.; Rosenbach, M.; Micheletti, R. Nutritional Diseases. In Andrews’ Diseases of the Skin: Clinical Dermatology, 13th ed.; Elsevier: New York, NY, USA, 2019. [Google Scholar]
- Bazinet, R.P.; Layé, S. Polyunsaturated fatty acids and their metabolites in brain function and disease. Nat. Rev. Neurosci. 2014, 15, 771–785. [Google Scholar] [CrossRef] [PubMed]
- Gunstone, F.D. Vegetable Oils in Food Technology: Composition, Properties and Uses, 2nd ed.; Wiley-Blackwell: Hoboken, NJ, USA, 2011. [Google Scholar]
- Lechhab, T.; Salmoun, F.; Lechhab, W.; El Majdoub, Y.O.; Russo, M.; Testa Camillo, M.R.; Trovato, E.; Dugo, P.; Mondello, L.; Cacciola, F. Determination of bioactive compounds in extra virgin olive oils from 19 Moroccan areas using liquid chromatography coupled to mass spectrometry: A study over two successive years. Eur. Food Res. Technol. 2021, 247, 2993–3012. [Google Scholar] [CrossRef]
- Indelicato, S.; Bongiorno, D.; Pitonzo, R.; Di Stefano, V.; Calabrese, V.; Indelicato, S.; Avellone, G. Triacylglycerols in edible oils: Determination, characterization, quantitation, chemometric approach and evaluation of adulterations. J. Chromatogr. A 2017, 1515, 1–16. [Google Scholar] [CrossRef] [PubMed]
- Tranchida, P.Q.; Donato, P.; Dugo, P.; Dugo, G.; Mondello, L. Comprehensive Chromatographic Methods for the Analysis of Lipids. Trends Anal. Chem. 2007, 26, 191–205. [Google Scholar] [CrossRef]
- Tranchida, P.Q.; Giannino, A.; Mondello, M.; Sciarrone, D.; Dugo, P.; Dugo, G.; Mondello, L. Elucidation of Fatty Acid Profiles in Vegetable Oils Exploiting Group-Type Patterning and Enhanced Sensitivity of Comprehensive Two-Dimensional Gas Chromatography. J. Sep. Sci. 2008, 31, 1797–1802. [Google Scholar] [CrossRef] [PubMed]
- Tranchida, P.Q.; Costa, R.; Donato, P.; Sciarrone, D.; Ragonese, C.; Dugo, P.; Dugo, G.; Mondello, L. Acquisition of deeper knowledge on the human plasma fatty acid profile exploiting comprehensive 2-D GC. J Sep Sci. 2008, 31, 3347–3351. [Google Scholar] [CrossRef]
- Donato, P.; Micalizzi, G.; Oteri, M.; Rigano, F.; Sciarrone, D.; Dugo, P.; Mondello, L. Comprehensive lipid profiling in marine organisms by hyphenated and multidimensional chromatography techniques coupled to mass spectrometry detection. Anal. Bioanal. Chem. 2018, 410, 3297–3313. [Google Scholar] [CrossRef]
- Kallio, H.; Nylund, M.; Boström, P.; Yang, B. Triacylglycerol regioisomers in human milk resolved with an algorithmic novel electrospray ionization tandem mass spectrometry method. Food Chem. 2017, 233, 351–360. [Google Scholar] [CrossRef]
- Murphy, R.C. Challenges in Mass Spectrometry-based Lipidomics of Neutral Lipids. Trends Anal. Chem. 2018, 107, 91–98. [Google Scholar] [CrossRef] [PubMed]
- Cacciola, F.; Donato, P.; Sciarrone, D.; Dugo, P.; Mondello, L. Comprehensive Liquid Chromatography and Other Liquid-Based Comprehensive Techniques Coupled to Mass Spectrometry in Food Analysis. Anal. Chem. 2017, 89, 414–429. [Google Scholar] [CrossRef]
- Beccaria, M.; Sullini, G.; Cacciola, F.; Donato, P.; Dugo, P.; Mondello, L. High performance characterization of triacylglycerols in milk and milk-related samples by liquid chromatography and mass spectrometry. J. Chromatogr. A 2014, 1360, 172–187. [Google Scholar] [CrossRef]
- Lísa, M.; Denev, R.; Holčapek, M. Retention behaviour of isomeric triacylglycerols in silver-ion HPLC: Effects of mobile phase composition and temperature. J. Sep. Sci. 2013, 36, 2888–2900. [Google Scholar] [CrossRef]
- Lee, M.L.; Markides, K.E. Chromatography with supercritical fluids. Science 1987, 235, 1342–1347. [Google Scholar] [CrossRef]
- Donato, P.; Giuffrida, D.; Oteri, M.; Inferrera, V.; Dugo, P.; Mondello, L. Supercritical Fluid Chromatography × Ultra-High Pressure Liquid Chromatography for Red Chilli Pepper Fingerprinting by Photodiode Array, Quadrupole-Time-of-Flight and Ion Mobility Mass Spectrometry (SFC × RP-UHPLC-PDA-Q-ToF MS-IMS). Food Anal. Methods 2018, 11, 3331–3341. [Google Scholar] [CrossRef]
- Buchgraber, M.; Ulberth, F.; Emons, H.; Anklam, E. Triacylglycerol profiling by using chromatographic techniques. Eur. J. Lipid Sci. Technol. 2004, 106, 621–648. [Google Scholar] [CrossRef]
- Manninen, P.; Laakso, P.; Kallio, H. Method for characterization of triacylglycerols and fat-soluble vitamins in edible oils and fats by supercritical fluid chromatography. J. Am. Oil Chem. Soc. 1995, 72, 1001–1008. [Google Scholar] [CrossRef]
- Sandra, P.; Medvedovici, A.; Zhao, Y.; David, F. Characterization of triglycerides in vegetable oils by silver-ion packed-column supercritical fluid chromatography coupled to mass spectroscopy with atmospheric pressure chemical ionization and coordination ion spray. J. Chromatogr. A 2002, 974, 231–241. [Google Scholar] [CrossRef]
- Bernal, J.L.; Martín, M.T.; Toribio, L. Supercritical fluid chromatography in food analysis. J. Chromatogr. A 2013, 1313, 24–36. [Google Scholar] [CrossRef]
- Laboureur, L.; Ollero, M.; Touboul, D. Lipidomics by supercritical fluid chromatography. Int. J. Mol. Sci. 2015, 16, 13868–13884. [Google Scholar] [CrossRef] [PubMed]
- Lesellier, E.; West, C. The many faces of packed column supercritical fluid chromatography—A critical review. J. Chromatogr. A 2015, 1382, 2–46. [Google Scholar] [CrossRef] [PubMed]
- Nováková, L.; Perrenoud, A.G.-G.; François, I.; West, C.; Lesellier, E.; Guillarme, D. Modern analytical supercritical fluid chromatography using columns packed with sub-2 particles: A tutorial. Anal. Chim. Acta 2014, 824, 18–35. [Google Scholar] [CrossRef] [PubMed]
- Bonaccorsi, I.; Cacciola, F.; Utczas, M.; Inferrera, V.; Giuffrida, D.; Donato, P.; Dugo, P.; Mondello, L. Characterization of the pigment fraction in sweet bell peppers (Capsicum annuum L.) harvested at green and overripe yellow and red stages by offline multidimensional convergence chromatography/liquid chromatography-mass spectrometry. J. Sep. Sci. 2016, 39, 3281–3291. [Google Scholar] [CrossRef]
- Poole, C.F. Stationary phases for packed-column supercritical fluid chromatography. J. Chromatogr. A 2012, 1250, 157–171. [Google Scholar] [CrossRef] [PubMed]
- Donato, P.; Inferrera, V.; Sciarrone, D.; Mondello, L. Supercritical fluid chromatography for lipid analysis in foodstuffs. J. Sep. Sci. 2017, 40, 361–382. [Google Scholar] [CrossRef] [PubMed]
- Funada, Y.; Hirata, Y. Retention behavior of triglycerides in subcritical fluid chromatography with carbon dioxide mobile phase. J. Chromatogr. A 1997, 764, 301–307. [Google Scholar] [CrossRef]
- Lesellier, E.; Tchapla, A. Retention behavior of triglycerides in octadecyl packed subcritical fluid chromatography with CO2/modifier mobile phases. Anal. Chem. 1999, 71, 5372–5378. [Google Scholar] [CrossRef]
- Lísa, M.; Holčapek, M. Triacylglycerols profiling in plant oils important in food industry, dietetics and cosmetics using high-performance liquid chromatography-atmospheric pressure chemical ionization mass spectrometry. J. Chromatogr. A 2008, 1198–1199, 115–130. [Google Scholar] [CrossRef] [PubMed]
- Holčapek, M.; Lísa, M.; Jandera, P.; Kabátová, N. Quantitation of triacylglycerols in plant oils using HPLC with APCI-MS, evaporative light-scattering, and UV detection. J. Sep. Sci. 2005, 28, 1315–1333. [Google Scholar] [CrossRef] [PubMed]
- Mondello, L.; Beccaria, M.; Donato, P.; Cacciola, F.; Dugo, G.; Dugo, P. Comprehensive two-dimensional liquid chromatography with evaporative light scattering detection for the analysis of triacylglycerols in Borago Officinalis. J. Sep. Sci. 2011, 34, 688–692. [Google Scholar] [CrossRef] [PubMed]
- Arena, P.; Sciarrone, D.; Dugo, P.; Donato, P.; Mondello, L. Pattern-Type Separation of Triacylglycerols by Silver Thiolate×Non-Aqueous Reversed Phase Comprehensive Liquid Chromatography. Separations 2021, 8, 88. [Google Scholar] [CrossRef]
- Bamba, T.; Matsubara, A.; Lee, J.W.; Fukusaki, E. Metabolic profiling of lipids by supercritical fluid chromatography/mass spectrometry. J. Chromatogr. A 2012, 1250, 212–219. [Google Scholar] [CrossRef] [PubMed]
- Lee, J.W.; Nishiumib, S.; Yoshida, M.; Fukusaki, E.; Bamba, T. Simultaneous profiling of polar lipids by supercritical fluid chromatography/tandem mass spectrometry with methylation. J. Chromatogr. A 2013, 1279, 98–107. [Google Scholar] [CrossRef] [PubMed]


Disclaimer/Publisher’s Note: The statements, opinions and data contained in all publications are solely those of the individual author(s) and contributor(s) and not of MDPI and/or the editor(s). MDPI and/or the editor(s) disclaim responsibility for any injury to people or property resulting from any ideas, methods, instructions or products referred to in the content. |
© 2023 by the authors. Licensee MDPI, Basel, Switzerland. This article is an open access article distributed under the terms and conditions of the Creative Commons Attribution (CC BY) license (https://creativecommons.org/licenses/by/4.0/).