
Climate Change Effects on the Predicted Heat Strain and Labour Capacity of Outdoor Workers in Australia


Abstract
1. Introduction
2. Methods
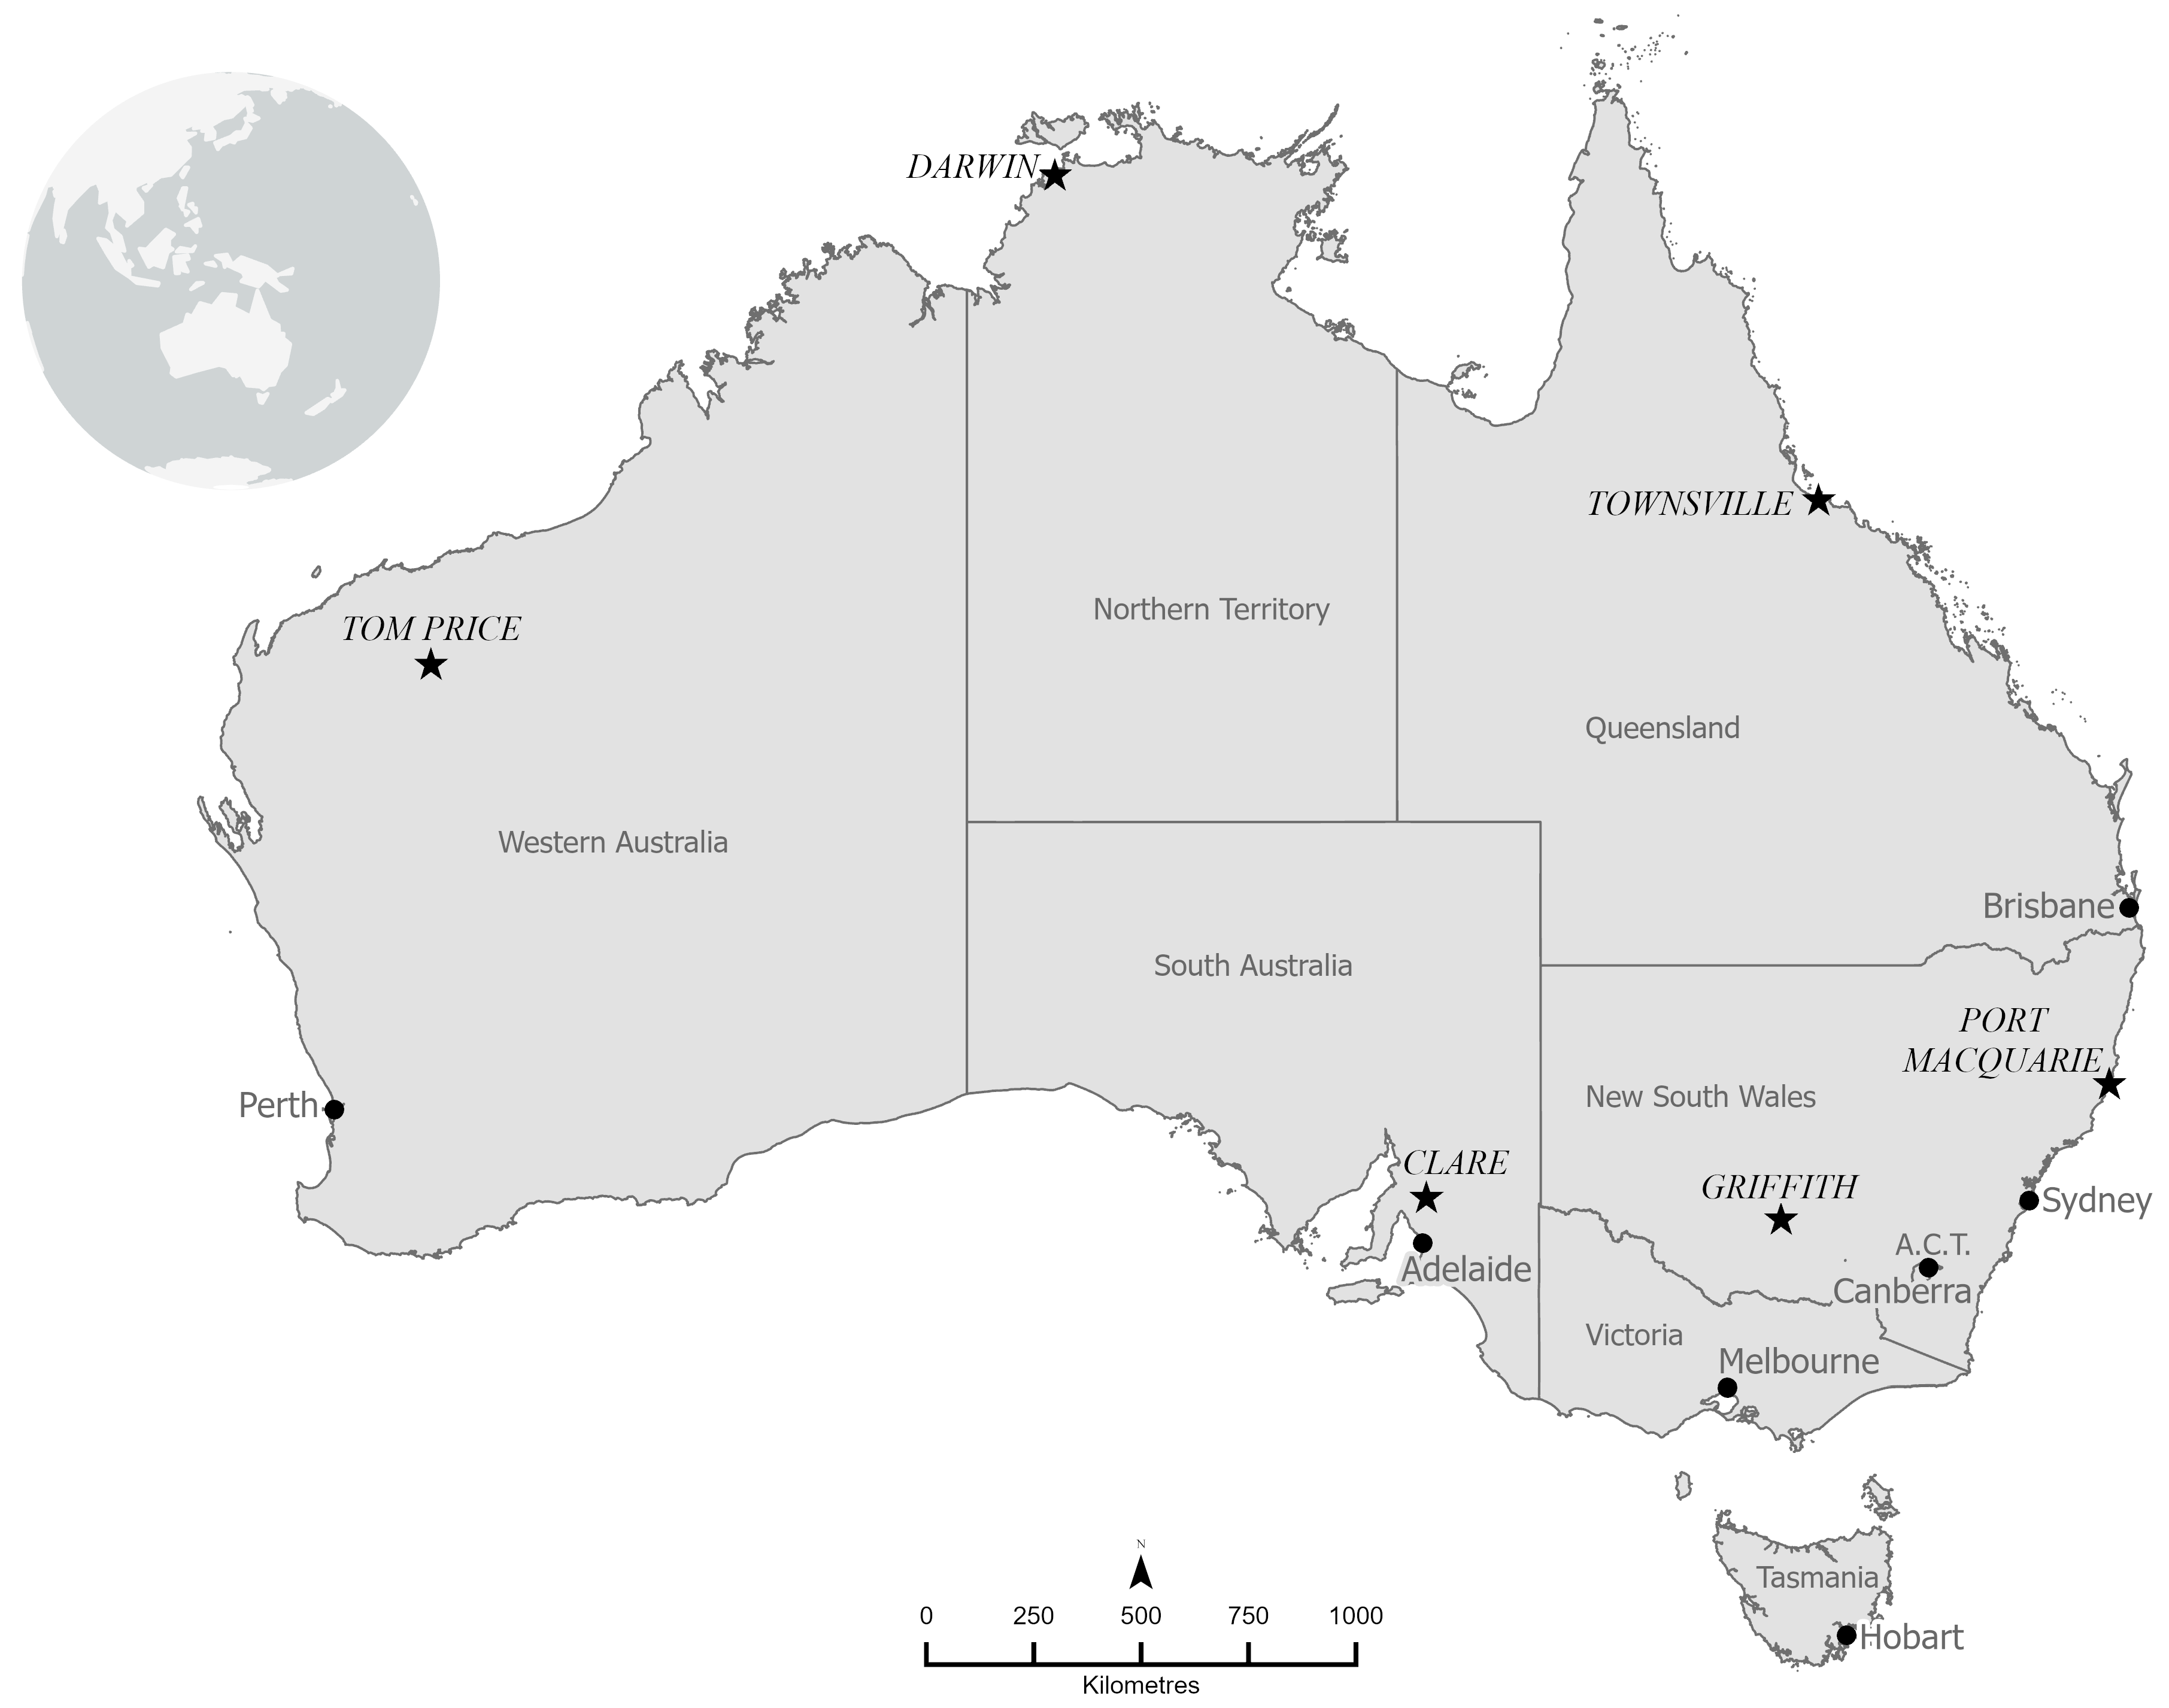
2.1. Environments
2.2. Predicted Heat Strain
2.3. Analysis
3. Results
4. Discussion
4.1. Heat Strain and Labour Capacity
4.2. Risk Management
4.3. Assumptions and Limitations
5. Conclusions
Author Contributions
Funding
Institutional Review Board Statement
Informed Consent Statement
Data Availability Statement
Acknowledgments
Conflicts of Interest
References
- Flouris, A.D.; Dinas, P.C.; Ioannou, L.G.; Nybo, L.; Havenith, G.; Kenny, G.P.; Kjellstrom, T. Workers’ health and productivity under occupational heat strain: A systematic review and meta-analysis. Lancet Planet. Health 2018, 2, e521–e531. [Google Scholar] [CrossRef]
- Zander, K.K.; Botzen, W.J.W.; Oppermann, E.; Kjellstrom, T.; Garnett, S.T. Heat stress causes substantial labour productivity loss in Australia. Nat. Clim. Chang. 2015, 5, 647. [Google Scholar] [CrossRef]
- Mora, C.; Dousset, B.; Caldwell, I.R.; Powell, F.E.; Geronimo, R.C.; Bielecki, C.R.; Counsell, C.W.W.; Dietrich, B.S.; Johnston, E.T.; Louis, L.V.; et al. Global risk of deadly heat. Nat. Clim. Chang. 2017, 7, 501–506. [Google Scholar]
- Coffel, E.D.; Horton, R.M.; de Sherbinin, A. Temperature and humidity based projections of a rapid rise in global heat stress exposure during the 21st century. Environ. Res. Lett. 2017, 13, 014001. [Google Scholar] [CrossRef]
- Romanello, M.; Di Napoli, C.; Drummond, P.; Green, C.; Kennard, H.; Lampard, P.; Scamman, D.; Arnell, N.; Ayeb-Karlsson, S.; Ford, L.B.; et al. The 2022 report of the Lancet Countdown on health and climate change: Health at the mercy of fossil fuels. Lancet 2022, 400, 1619–1654. [Google Scholar] [CrossRef]
- Jay, O.; Brotherhood, J.R. Occupational heat stress in Australian workplaces. Temperature 2016, 3, 394–411. [Google Scholar] [CrossRef] [PubMed]
- Cheung, S.S.; McLellan, T.M.; Tenaglia, S. The Thermophysiology of Uncompensable Heat Stress: Physiological Manipulations and Individual Characteristics. Sport. Med. 2000, 29, 329–359. [Google Scholar] [CrossRef]
- Hall, A.; Horta, A.; Khan, M.R.; Crabbe, R.A. Spatial analysis of outdoor wet bulb globe temperature under RCP4.5 and RCP8.5 scenarios for 2041–2080 across a range of temperate to hot climates. Weather. Clim. Extrem. 2022, 35, 100420. [Google Scholar] [CrossRef]
- World Health Organization. Health factors involved in working under conditions of heat stress: Report of a WHO scientific group. In World Health Organization Technical Report Series; no 412; World Health Organization: Geneva, Switzerland, 1969. [Google Scholar]
- ISO 7933; Ergonomics of the Thermal Environment—Analytical Determination and Interpretation of Heat Stress Using Calculation of the Predicted Heat Strain. International Organisation for Standardisation: Geneva, Switzerland, 2004.
- Ioannou, L.G.; Tsoutsoubi, L.; Mantzios, K.; Flouris, A.D. A free software to predict heat strain according to the ISO 7933:2018. Ind. Health 2019, 57, 711–720. [Google Scholar] [CrossRef] [PubMed]
- Greenleaf, J.E. Problem: Thirst, drinking behavior, and involuntary dehydration. Med. Sci. Sport. Exerc. 1992, 24, 645–656. [Google Scholar] [CrossRef]
- ISO 9920; Ergonomics of the Thermal Environment—Estimation of Thermal Insulation and Water Vapour Resistance of Clothing Ensemble. International Organisation for Standardisation: Geneva, Switzerland, 2007.
- R Core Team. R: A Language and Environment for Statistical Computing; R Foundation for Statistical Computing: Vienna, Austria, 2019. [Google Scholar]
- Chan, C.-H.; Chan, G.C.; Leeper, T.J.; Becker, J. Rio: A Swiss-Army Knife for Data File I/O. 2021. Available online: https://rdrr.io/cran/rio/man/rio.html/ (accessed on 12 March 2023).
- Wickham, H. Stringr: Simple, Consistent Wrappers for Common String Operations. 2019. Available online: https://rdrr.io/cran/stringr/ (accessed on 12 March 2023).
- Wickham, H.; François, R.; Henry, L.; Müller, K. Dplyr: A Grammar of Data Manipulation. 2020. Available online: https://dplyr.tidyverse.org/reference/dplyr-package.html, (accessed on 12 March 2023).
- Wickham, H. ggplot2: Elegant Graphics for Data Analysis; Springer-Verlag: New York, NY, USA, 2016. [Google Scholar]
- Edwards, S.M. Lemon: Freshing Up Your ‘ggplot2’ Plots. 2020. Available online: https://rdrr.io/cran/lemon/ (accessed on 12 March 2023).
- Hunt, A.P.; Parker, A.W.; Stewart, I.B. Heat strain and hydration status of surface mine blast crew workers. J. Occup. Environ. Med./Am. Coll. Occup. Environ. Med. 2014, 56, 409–414. [Google Scholar] [CrossRef] [PubMed]
- Brearley, M.; Harrington, P.; Lee, D.; Taylor, R. Working in Hot Conditions—A Study of Electrical Utility Workers in the Northern Territory of Australia. J. Occup. Environ. Hyg. 2015, 12, 156–162. [Google Scholar] [CrossRef] [PubMed]
- Miller, V.; Bates, G. Hydration of outdoor workers in northwest Australia. J. Occup. Health Saf. Aust. NZ 2007, 23, 79–87. [Google Scholar]
- Hunt, A.P.; Stewart, I.B.; Billing, D.C. Indices of physiological strain for firefighters of the Australian Defence Forces. J. Occup. Environ. Hyg. 2019, 16, 727–734. [Google Scholar] [CrossRef] [PubMed]
- Stewart, I.B.; Rojek, A.M.; Hunt, A.P. Heat strain during explosive ordnance disposal. Mil. Med. 2011, 176, 959–963. [Google Scholar] [CrossRef]
- Stewart, I.B.; Hunt, A.P. Negligible heat strain in armored vehicle officers wearing personal body armor. J. Occup. Med. Toxicol. 2011, 6, 22–27. [Google Scholar] [CrossRef]
- ISO 7243:2017; Ergonomics of the Thermal Environment—Assessment of Heat Stress Using the WBGT (Wet Bulb Globe Temperature) Index. International Organisation for Standardisation: Geneva, Switzerland, 2017.
- Hunt, A.P.; Billing, D.C.; Patterson, M.J.; Caldwell, J.N. Heat strain during military training activities: The dilemma of balancing force protection and operational capability. Temperature 2016, 3, 307–317. [Google Scholar] [CrossRef]
- Donoghue, A.M.; Sinclair, M.J.; Bates, G.P. Heat exhaustion in a deep underground metalliferous mine. Occup. Environ. Med. 2000, 57, 165–174. [Google Scholar] [CrossRef]
- Humphrys, E.; Goodman, J.; Newman, F. ‘Zonked the hell out’: Climate change and heat stress at work. Econ. Labour Relat. Rev. 2022, 33, 256–271. [Google Scholar] [CrossRef]
- Zander, K.K.; Mathew, S.; Garnett, S.T. Exploring Heat Stress Relief Measures among the Australian Labour Force. Int. J. Environ. Res. Public Health 2018, 15, 401. [Google Scholar] [CrossRef]
- Rogerson, S.; Brearley, M.; Meir, R.; Brooks, L. Influence of age, geographical region, and work unit on heat strain symptoms: A cross-sectional survey of electrical utility workers. J. Occup. Environ. Hyg. 2020, 17, 515–522. [Google Scholar] [CrossRef] [PubMed]
- Hunt, A.; Parker, A.; Stewart, I. Symptoms of heat illness in surface mine workers. Int. Arch. Occup. Environ. Health 2013, 86, 519–527. [Google Scholar] [CrossRef]
- Carter, S.; Field, E.; Oppermann, E.; Brearley, M. The impact of perceived heat stress symptoms on work-related tasks and social factors: A cross-sectional survey of Australia’s Monsoonal North. Appl. Ergon. 2020, 82, 102918. [Google Scholar] [CrossRef] [PubMed]
- Brake, D.J.; Bates, G.P. Fluid losses and hydration status of industrial workers under thermal stress working extended shifts. Occup. Environ. Med. 2003, 60, 90. [Google Scholar] [CrossRef] [PubMed]
- The Lancet. Health in a world of extreme heat. Lancet 2021, 398, 641. [Google Scholar] [CrossRef]
- Di Corleto, R.; Firth, I.; Maté, J. A Guide to Managing Heat Stress. Australian Institute of Occupational Hygienists: Tullamarine, VIC, Australia, 2013. [Google Scholar]
- Ioannou, L.G.; Mantzios, K.; Tsoutsoubi, L.; Notley, S.R.; Dinas, P.C.; Brearley, M.; Epstein, Y.; Havenith, G.; Sawka, M.N.; Bröde, P.; et al. Indicators to assess physiological heat strain—Part 1: Systematic review. Temperature 2022, 9, 227–262. [Google Scholar] [CrossRef]
- Blazejczyk, K.; Epstein, Y.; Jendritzky, G.; Staiger, H.; Tinz, B. Comparison of UTCI to Selected Thermal Indicies. Int. J. Biometeorol. 2012, 56, 515–535. [Google Scholar] [CrossRef]
- IIoannou, L.G.; Tsoutsoubi, L.; Mantzios, K.; Vliora, M.; Nintou, E.; Piil, J.F.; Notley, S.R.; Dinas, P.C.; Gourzoulidis, G.A.; Havenith, G.; et al. Indicators to assess physiological heat strain—Part 3: Multi-country field evaluation and consensus recommendations. Temperature 2022, 9, 274–291. [Google Scholar] [CrossRef]
- Vanos, J.K.; Grundstein, A.J. Variations in Athlete Heat-Loss Potential Between Hot-Dry and Warm-Humid Environments at Equivalent Wet-Bulb Globe Temperature Thresholds. J. Athl. Train. 2020, 55, 1190–1198. [Google Scholar] [CrossRef]
- Claassen, N.; Kok, R. The accuracy of the WBGT heat stress index at low and high humidity levels. Occup. Health South. Afr. 2007, 13, 12–18. [Google Scholar]
- Ramanathan, N.L.; Belding, H.S. Physiological Evaluation of the WBGT Index for Occupational Heat Stress. Am. Ind. Hyg. Assoc. J. 1973, 34, 375–383. [Google Scholar] [CrossRef] [PubMed]
- Sawka, M.N.; Coyle, E.F. Influence of body water and blood volume on thermoregulation and exercise performance in the heat. Exerc. Sport Sci. Rev. 1999, 27, 167–218. [Google Scholar]
- American College of Sports Medicine. Exercise and Fluid Replacement. Med. Sci. Sport. Exerc. 2007, 39, 377–390. [Google Scholar] [CrossRef] [PubMed]
- Brearley, M.; Berry, R.; Hunt, A.H.; Pope, R. A systematic review of post-work core temperature cooling rates conferred by passive rest. Biology (under review).
- Ioannou, L.G.; Mantzios, K.; Tsoutsoubi, L.; Nintou, E.; Vliora, M.; Gkiata, P.; Dallas, C.N.; Gkikas, G.; Agaliotis, G.; Sfakianakis, K.; et al. Occupational Heat Stress: Multi-Country Observations and Interventions. Int. J. Environ. Res. Public Health 2021, 18, 6303. [Google Scholar] [CrossRef] [PubMed]
- Sinclair, W.H.; Brownsberger, J.C. Wearing long pants while working outdoors in the tropics does not yield higher body temperatures. Aust. N. Z. J. Public Health 2013, 37, 70–75. [Google Scholar] [CrossRef] [PubMed]


| Darwin | Tom Price | Townsville | Griffith | Clare | Port Macquarie | ||
|---|---|---|---|---|---|---|---|
| BASELINE | Ta (°C) | 32.6 | 38.9 | 31.5 | 32.2 | 29.3 | 26.7 |
| 1986–2005 | Tg (°C) | 47.4 | 53.3 | 45.6 | 46.9 | 44.2 | 40.9 |
| Tnwb (°C) | 29.5 | 24.8 | 27.6 | 22.8 | 20.6 | 24.6 | |
| RH (%) | 79.5 | 30.9 | 74.1 | 44.2 | 44.8 | 84.2 | |
| WBGT (°C) | 33.4 | 31.9 | 31.6 | 28.6 | 26.2 | 28 | |
| RCP4.5 | Ta (°C) | 33.6 | 41.0 | 32.4 | 33.1 | 30.9 | 27.1 |
| 2041–2060 | Tg (°C) | 48.4 | 55.3 | 46.6 | 47.9 | 45.8 | 41.3 |
| Tnwb (°C) | 30.4 | 25.6 | 28.6 | 23.8 | 21.6 | 25.3 | |
| RH (%) | 79.2 | 28.4 | 75.1 | 45.5 | 43.4 | 86.5 | |
| WBGT (°C) | 34.4 | 33.1 | 32.6 | 29.6 | 27.4 | 28.6 | |
| RCP4.5 | Ta (°C) | 34.0 | 41.2 | 32.7 | 33.9 | 31.4 | 27.9 |
| 2061–2080 | Tg (°C) | 48.8 | 55.5 | 46.9 | 48.6 | 46.3 | 42.1 |
| Tnwb (°C) | 30.7 | 26.1 | 28.7 | 24.0 | 21.7 | 25.6 | |
| RH (%) | 78.7 | 29.6 | 74.0 | 43.4 | 41.9 | 83.1 | |
| WBGT (°C) | 34.7 | 33.5 | 32.8 | 29.9 | 27.6 | 29.0 | |
| RCP8.5 | Ta (°C) | 34.6 | 42.6 | 33.0 | 34.6 | 31.6 | 28.5 |
| 2041–2060 | Tg (°C) | 49.4 | 56.6 | 47.2 | 49.4 | 46.5 | 42.8 |
| Tnwb (°C) | 30.9 | 25.8 | 28.8 | 24.7 | 21.8 | 26.2 | |
| RH (%) | 76.6 | 25.4 | 72.9 | 44.1 | 41.6 | 83.3 | |
| WBGT (°C) | 35.0 | 33.6 | 32.9 | 30.7 | 27.8 | 29.7 | |
| RCP8.5 | Ta (°C) | 35.2 | 43.7 | 33.6 | 36.3 | 33.2 | 29.8 |
| 2061–2080 | Tg (°C) | 50.0 | 57.6 | 47.9 | 51.0 | 48.0 | 44.1 |
| Tnwb (°C) | 31.4 | 26.3 | 29.5 | 25.5 | 22.7 | 27.1 | |
| RH (%) | 76.2 | 24.6 | 73.8 | 41.6 | 39.9 | 81.0 | |
| WBGT (°C) | 35.5 | 34.3 | 33.6 | 31.7 | 28.9 | 30.7 |
| Location | Work | Baseline | RCP4.5 2041–2060 | RCP4.5 2061–2080 | RCP8.5 2041–2060 | RCP8.5 2061–2080 |
|---|---|---|---|---|---|---|
| CLARE | Light | NL (100) | NL (100) | NL (100) | NL (100) | NL (100) |
| Moderate | NL (100) | NL (100) | NL (100) | NL (100) | NL (100) | |
| Heavy | NL (100) | NL (100) | NL (100) | NL (100) | NL (100) | |
| PORT MACQUARIE | Light | NL (100) | NL (100) | 211 (70) | 129 (43) | 86 (29) |
| Moderate | NL (100) | 216 (72) | 154 (51) | 103 (34) | 72 (24) | |
| Heavy | NL (100) | 122 (41) | 98 (33) | 73 (24) | 56 (19) | |
| DARWIN | Light | 46 (100) | 40 (87) | 38 (83) | 37 (80) | 35 (76) |
| Moderate | 42 (100) | 36 (86) | 35 (83) | 34 (81) | 32 (76) | |
| Heavy | 36 (100) | 32 (89) | 30 (83) | 30 (83) | 28 (78) | |
| TOM PRICE | Light | 160 (100) | 98 (61) | 83 (52) | 90 (56) | 76 (48) |
| Moderate | 159 (100) | 92 (58) | 76 (48) | 84 (53) | 70 (44) | |
| Heavy | 104 (100) | 65 (63) | 58 (56) | 58 (56) | 51 (49) | |
| TOWNSVILLE | Light | 73 (100) | 57 (78) | 55 (75) | 54 (74) | 47 (64) |
| Moderate | 63 (100) | 50 (79) | 49 (78) | 48 (76) | 42 (67) | |
| Heavy | 50 (100) | 42 (84) | 41 (82) | 40 (80) | 36 (72) | |
| GRIFFITH | Light | NL (100) | NL (100) | NL (100) | 229 (76) | 118 (39) |
| Moderate | NL (100) | NL (100) | NL (100) | 214 (71) | 106 (35) | |
| Heavy | NL (100) | NL (100) | NL (100) | 174 (58) | 83 (28) |
| Location | Work | Baseline | RCP4.5 2041–2060 | RCP4.5 2061–2080 | RCP8.5 2041–2060 | RCP8.5 2061–2080 |
|---|---|---|---|---|---|---|
| CLARE | Light | NL | NL | NL | NL | 269 |
| Moderate | NL | 284 | 278 | 274 | 245 | |
| Heavy | 267 | 242 | 238 | 235 | 214 | |
| PORT MACQUARIE | Light | 299 | 271 | 252 | 220 | 185 |
| Moderate | 260 | 236 | 221 | 196 | 179 | |
| Heavy | 216 | 197 | 187 | 180 | 178 | |
| DARWIN | Light | 177 | 177 | 177 | 177 | 177 |
| Moderate | 176 | 176 | 176 | 176 | 176 | |
| Heavy | 176 | 176 | 176 | 176 | 176 | |
| TOM PRICE | Light | 185 | 176 | 176 | 176 | 176 |
| Moderate | 178 | 176 | 176 | 176 | 175 | |
| Heavy | 177 | 175 | 175 | 175 | 174 | |
| TOWNSVILLE | Light | 178 | 176 | 176 | 176 | 117 |
| Moderate | 177 | 176 | 176 | 176 | 176 | |
| Heavy | 177 | 176 | 176 | 176 | 175 | |
| GRIFFITH | Light | 280 | 242 | 232 | 210 | 184 |
| Moderate | 253 | 220 | 213 | 194 | 178 | |
| Heavy | 219 | 195 | 188 | 179 | 177 |
Disclaimer/Publisher’s Note: The statements, opinions and data contained in all publications are solely those of the individual author(s) and contributor(s) and not of MDPI and/or the editor(s). MDPI and/or the editor(s) disclaim responsibility for any injury to people or property resulting from any ideas, methods, instructions or products referred to in the content. |
© 2023 by the authors. Licensee MDPI, Basel, Switzerland. This article is an open access article distributed under the terms and conditions of the Creative Commons Attribution (CC BY) license (https://creativecommons.org/licenses/by/4.0/).
Share and Cite
Hunt, A.P.; Brearley, M.; Hall, A.; Pope, R. Climate Change Effects on the Predicted Heat Strain and Labour Capacity of Outdoor Workers in Australia. Int. J. Environ. Res. Public Health 2023, 20, 5675. https://doi.org/10.3390/ijerph20095675
Hunt AP, Brearley M, Hall A, Pope R. Climate Change Effects on the Predicted Heat Strain and Labour Capacity of Outdoor Workers in Australia. International Journal of Environmental Research and Public Health. 2023; 20(9):5675. https://doi.org/10.3390/ijerph20095675
Chicago/Turabian StyleHunt, Andrew P., Matt Brearley, Andrew Hall, and Rodney Pope. 2023. "Climate Change Effects on the Predicted Heat Strain and Labour Capacity of Outdoor Workers in Australia" International Journal of Environmental Research and Public Health 20, no. 9: 5675. https://doi.org/10.3390/ijerph20095675
APA StyleHunt, A. P., Brearley, M., Hall, A., & Pope, R. (2023). Climate Change Effects on the Predicted Heat Strain and Labour Capacity of Outdoor Workers in Australia. International Journal of Environmental Research and Public Health, 20(9), 5675. https://doi.org/10.3390/ijerph20095675