
The Development of Emotion Recognition Skills from Childhood to Adolescence


Abstract
1. Introduction
1.1. An Overview of Some of the Factors That May Influence the Development of ER
1.2. Aims of the Present Study
2. Materials and Methods
2.1. Participants
2.2. Stimuli
2.3. Tools and Procedures
3. Results
3.1. Emotions Total Scores Data Analysis Description
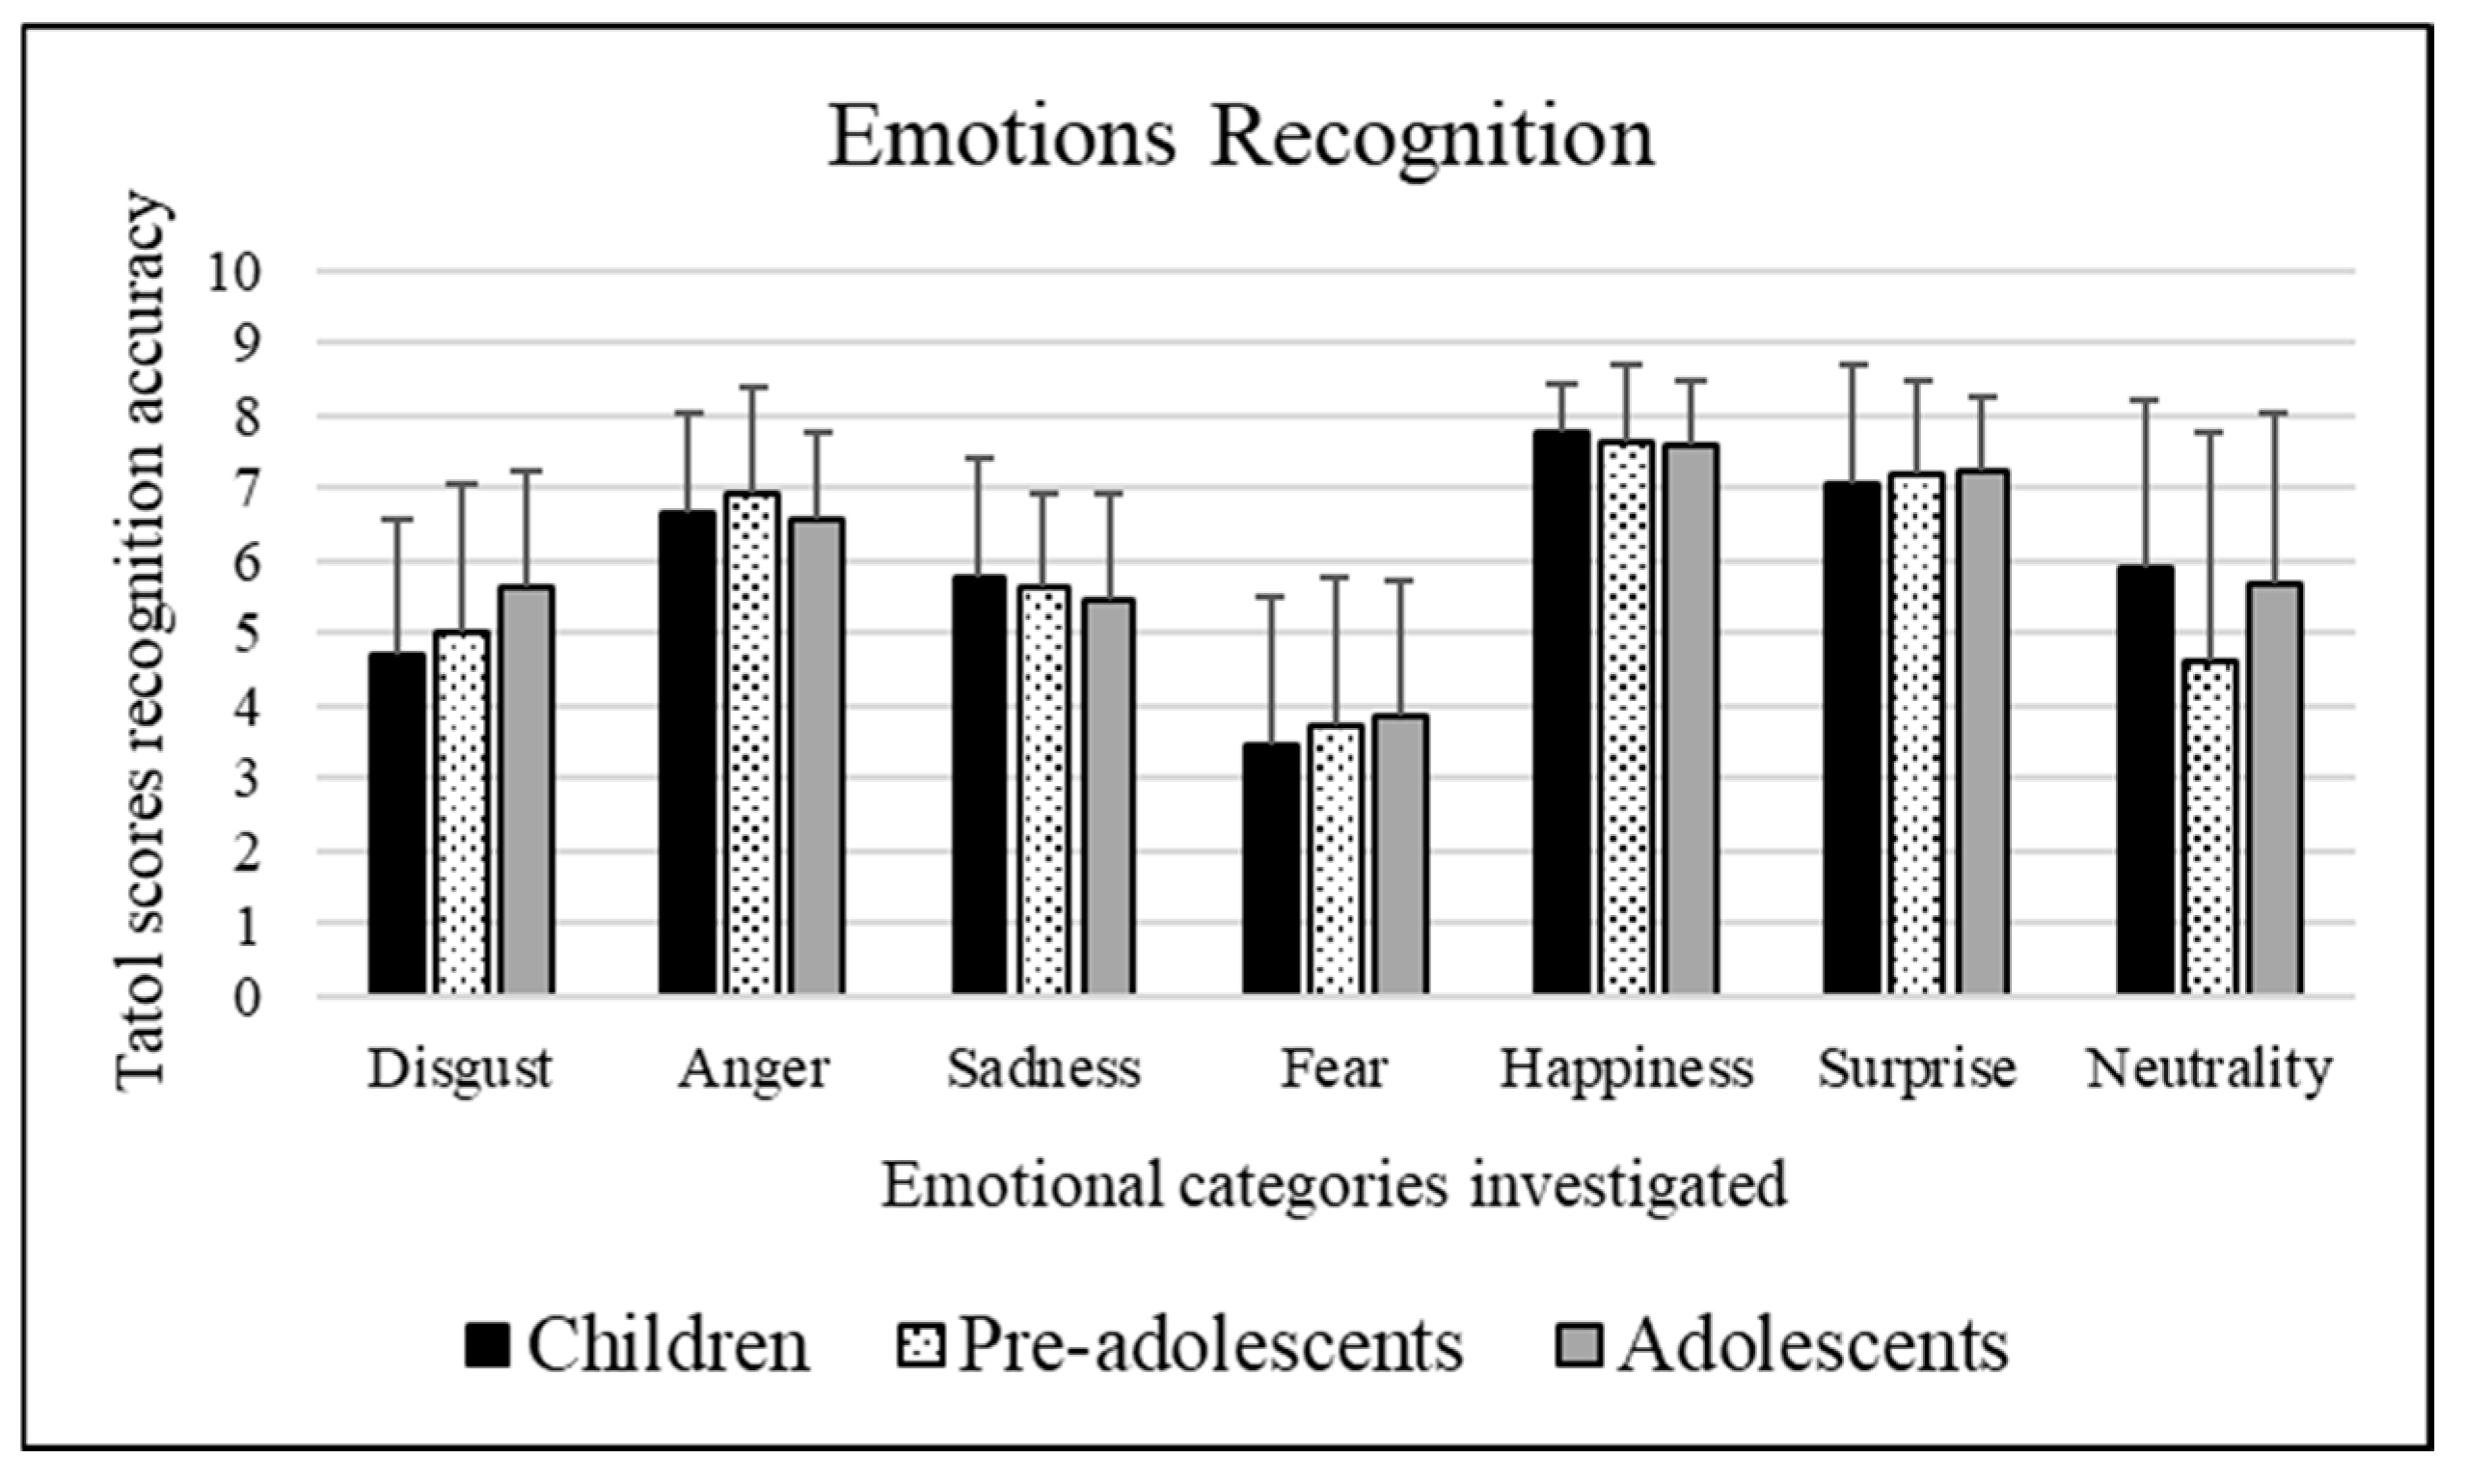
Emotions Total Scores Results
- Concerning age groups: Adolescents (mean = 5.627) better recognized stimuli depicting disgust than children (mean = 4.686, p << 0.01). Moreover, pre-adolescents (4.522) were worse at recognizing stimuli depicting neutrality than children (mean = 5.902, p = 0.001) and adolescents (mean = 5.679, p = 0.008).
- Concerning emotions recognition scores obtained by children: Each emotional category significantly differed from each other: happiness (mean = 7.739), surprise (mean = 7.053), anger (mean = 6.652), neutrality (mean = 5.902), sadness (mean = 5.776), disgust (mean = 4.686), and fear (mean = 3.462), p < 0.01. Happiness significantly differs from all the others (p << 0.01) since it was the emotional category most recognized by participants, which was followed by surprise which significantly differs from the others p << 0.01, except anger (p = 0.224). Then, follows anger which significantly differs from the others p << 0.01, with the exception of surprise (as mentioned before) and neutrality (p = 0.140). Neutrality significantly differs from the others (p << 0.01), except anger (as mentioned before) and sadness (p = 1.000). Sadness significantly differs from all the others (p << 0.01) with the exception of neutrality (as already stated). Finally, disgust and fear significantly differ (p << 0.01) from all the other emotions as they were the least recognized. Concerning emotions recognition scores obtained by pre-adolescents: Each emotional category significantly differed from each other: happiness (mean = 7.627), surprise (mean = 7.174), anger (mean = 6.898), sadness (mean = 5.657), disgust (mean = 4.970), neutrality (mean = 4.522), and fear (mean = 3.694), p < 0.01. Happiness significantly differs from all the others (p << 0.01) since it was the emotional category most recognized by participants with the exception of surprise (p = 0.079). Followed by surprise which significantly differs from the others p << 0.01, except happiness (as already stated) and anger (p = 1.000). Then, follows anger which significantly differs from the others (p << 0.01), with the exception of surprise (as mentioned before). Sadness significantly differs from all the others (p < 0.05) with the exception of disgust (p = 0.286). Disgust significantly differs from all the others (p << 0.01) with the exception of sadness (as mentioned before) and neutrality (p = 1.000). Neutrality significantly differs from the others (p < 0.05), except disgust (as mentioned before) and fear (p = 0.623). Finally, fear appeared to be significantly different (p << 0.01) from all the other emotions as it was the least recognized with the exception of neutrality (as already described). Regarding emotions recognition scores obtained by adolescents: Each emotional category significantly differed from each other: happiness (mean = 7.565), surprise (mean = 7.240), anger (mean = 6.578), neutrality (mean = 5.679), disgust (mean = 5.627), sadness (mean = 5.445), and fear (mean = 3.821), p < 0.01. Happiness significantly differs from all the others (p << 0.01) since it was the emotional category most recognized by participants with the exception of surprise (p = 0.305). Followed by surprise which significantly differs from the others (p < 0.01), except happiness (as already stated). Then, anger which significantly differs from the others (p < 0.05). Neutrality significantly differs from the others (p < 0.05), except disgust (p = 1.000) and sadness (p = 1.000). Disgust and sadness differ significantly from all others (p << 0.01) except neutrality (p = 1.000) and from each other (p = 1.000). Lastly, fear appeared to be significantly different (p << 0.01) from all the other emotions since it was the least recognized among all the emotional categories explored.
3.2. Effects of Faces’ Ethnicity and Sex Data Analyses Description
3.2.1. Disgust
- Concerning participants’ age groups: Adolescents (mean = 0.612) better decoded male facial expressions than pre-adolescents (mean = 0.491, p = 0.014). Moreover, children (mean = 0.607) were worse at recognizing female facial expressions than adolescents (mean = 0.795, p << 0.01) and pre-adolescents (mean = 0.751, p << 0.01).
- Concerning stimuli’s sex: Pre-adolescents better decoded female stimuli (mean = 0.751) compared to male stimuli (mean = 0.491, p << 0.01). Similarly, adolescents better decoded female stimuli (mean = 0.795) compared to male stimuli (mean = 0.612, p << 0.01).
- Concerning participants’ age groups: Caucasian/European American facial expressions were better decoded by adolescents (mean = 0.562) than children (mean = 0.405, p = 0.006). Adolescents (mean = 0.898) better recognized African American facial expressions than pre-adolescents (mean = 0.756, p = 0.003). Moreover, adolescents (mean = 0.655) better recognized Latino facial expressions than children (mean = 0.500, p = 0.001).
- Concerning stimuli’s ethnicity: Children better decoded African American facial expressions (mean = 0.849, p << 0.01) compared to Caucasian/European American (mean = 0.405), Latino (mean = 0.500), and Asian facial expressions (mean = 0.590). Regarding pre-adolescents, they better decoded African American facial expressions (mean = 0.756) compared to Caucasian/European American (mean = 0.521, p << 0.01), Latino (mean = 0.592, p = 0.001), and Asian facial expressions (mean = 0.616, p = 0.008). Lastly, concerning adolescents, they better decoded African American facial expressions (mean = 0.898, p << 0.01) compared to Caucasian/European American (mean = 0.562), Latino (mean = 0.655), and Asian facial expressions (mean = 0.699). In addition, adolescents better decoded Asian facial expressions (mean = 0.699) compared to Caucasian/European American facial expressions (mean = 0.562, p = 0.010).
- Concerning stimuli’s sex: Caucasian/European American facial expressions were better decoded when conveyed by female stimuli (mean = 0.548) compared to male stimuli (mean = 0.443, p = 0.006). Similarly, African American facial expressions were better decoded when conveyed by female stimuli (mean = 0.917) compared to male stimuli (mean = 0.752, p << 0.01). Interestingly, Latino facial expressions were also better decoded when conveyed by female stimuli (mean = 0.814) compared to male stimuli (mean = 0.351, p << 0.01). Conversely, Asian facial expressions were better decoded when conveyed by male stimuli (mean = 0.679) compared to female stimuli (mean = 0.591, p = 0.015).
- Concerning stimuli’s ethnicity: Male Caucasian/European American facial expressions (mean = 0.443, p << 0.01) were more poorly decoded compared to male African American (mean = 0.752) and male Asian facial expressions (mean = 0.679). Moreover, male Latino facial expressions (mean = 0.351, p << 0.01) were more poorly decoded than male African American (mean = 0.752) and male Asian facial expressions (mean = 0.679). Female African American facial expressions (mean = 0.917, p << 0.01) were better decoded compared to female Caucasian/European American (mean = 0.548), female Latino (mean = 0.814), and female Asian facial expressions (mean = 0.591). Moreover, female Latino facial expressions (mean = 0.814, p << 0.01) were better decoded than female Caucasian/European American (mean = 0.548) and female Asian facial expressions (mean = 0.591).
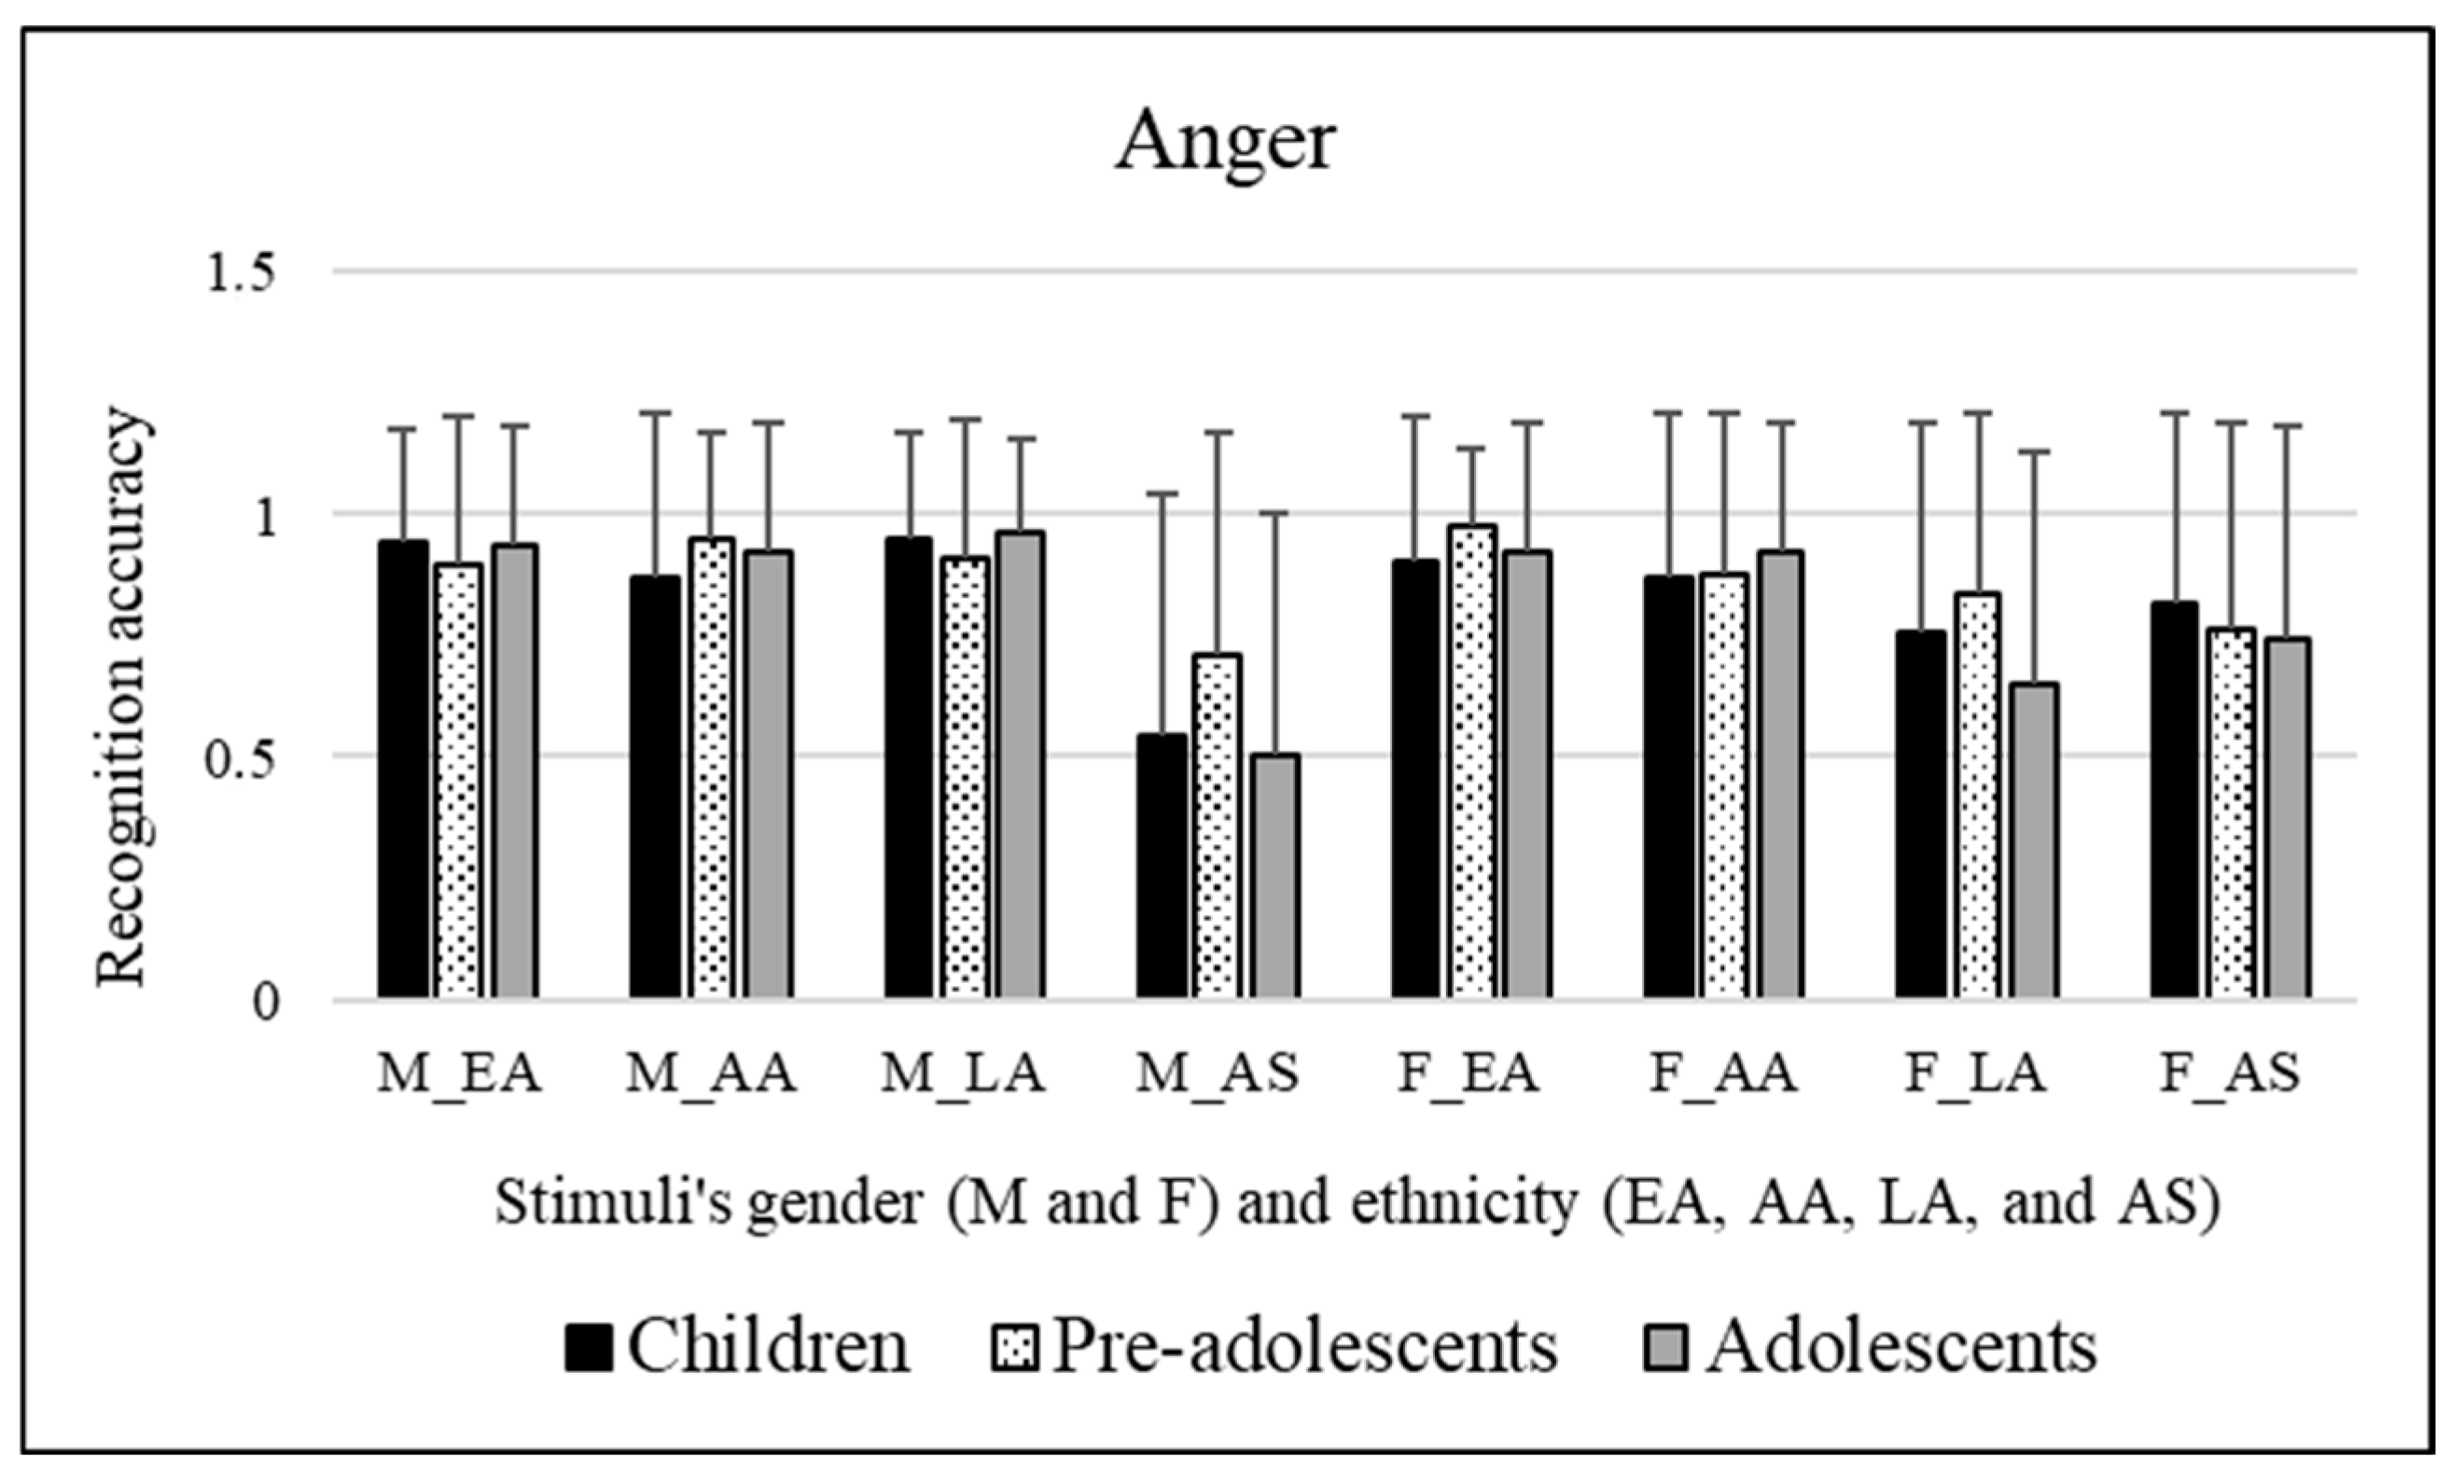
3.2.2. Anger
- Concerning stimuli’s sex: Latino facial expressions were better decoded when conveyed by male stimuli (mean = 0.941) compared to female stimuli (mean = 0.746, p << 0.01). Conversely, Asian facial expressions were better decoded when conveyed by female stimuli (mean = 0.778) compared to male stimuli (mean = 0.583, p << 0.01).
- Concerning stimuli’s ethnicity: Male Asian facial expressions (mean = 0.583, p << 0.01) were poorly decoded compared to male Caucasian/European American (mean = 0.922), male African American (mean = 0.914), and male Latino facial expressions (mean = 0.941). Moreover, female Caucasian/European American facial expressions (mean = 0.935, p << 0.01) were better decoded compared to female Latino (mean = 0.746) and female Asian (mean = 0.778) facial expressions. Similarly, female African American facial expressions (mean = 0.891) were better decoded compared to female Latino (mean = 0.746, p << 0.01) and female Asian (mean = 0.778, p = 0.001) facial expressions.
3.2.3. Sadness
- Concerning participants’ age groups: Caucasian/European American facial expressions were better decoded by pre-adolescents (mean = 0.850) than adolescents (mean = 0.726, p = 0.024). Children (mean = 0.688) better recognized Latino facial expressions than pre-adolescents (mean = 0.530, p = 0.001).
- Concerning stimuli’s ethnicity: Children were worse at decoding Asian facial expressions (mean = 0.585) compared to Caucasian/European American expressions (mean = 0.774, p << 0.01). Moreover, they better decoded African American facial expressions (mean = 0.840, p << 0.01) compared to Latino (mean = 0.688) and Asian (mean = 0.585) facial expressions. Regarding pre-adolescents, they better decoded Caucasian/European American facial expressions (mean = 0.850, p << 0.01) compared to Latino (mean = 0.530) and Asian facial expressions (mean = 0.590). Moreover, they better decoded African American facial expressions (mean = 0.858, p << 0.01) compared to Latino (mean = 0.530) and Asian facial expressions (mean = 0.590). Lastly, concerning adolescents, they better decoded African American facial expressions (mean = 0.858) compared to Caucasian/European American (mean = 0.726, p = 0.001), Latino (mean = 0.611, p << 0.01), and Asian facial expressions (mean = 0.527, p << 0.01). In addition, adolescents better decoded Caucasian/European American facial expressions (mean = 0.726) compared to Latino (mean = 0.611, p = 0.017) and Asian facial expressions (mean = 0.527, p << 0.01).
- Concerning stimuli’s sex: Caucasian/European American facial expressions were better decoded when conveyed by female stimuli (mean = 0.861) compared to male stimuli (mean = 0.706, p << 0.01). Similarly, Latino facial expressions were better decoded when conveyed by female stimuli (mean = 0.885) compared to male stimuli (mean = 0.334, p << 0.01). Conversely, Asian facial expressions were better decoded when conveyed by male stimuli (mean = 0.778) compared to female stimuli (mean = 0.357, p << 0.01).
- Concerning stimuli’s ethnicity: Male Latino facial expressions (mean = 0.334, p << 0.01) were poorly decoded compared to male Caucasian/European American (mean = 0.706), male African American (mean = 0.849), and male Asian facial expressions (mean = 0.778). Moreover, male African American facial expressions (mean = 0.849, p << 0.01) were better decoded compared to male Caucasian/European American (mean = 0.706) facial expressions. Female Asian facial expressions (mean = 0.357, p << 0.01) were poorly decoded compared to female Caucasian/European American (mean = 0.861), female African American (mean = 0.855), and Latino facial expressions (mean = 0.855).
3.2.4. Fear
- Concerning participants’ age groups: African American facial expressions were better decoded by adolescents (mean = 0.520) than children (mean = 0.374, p = 0.004).
- Concerning stimuli’s ethnicity: Children better decoded Caucasian/European American facial expressions (mean = 0.606) compared to African American (mean = 0.374, p << 0.01), Latino (mean = 0.288, p << 0.01), and Asian (mean = 0.464, p = 0.003) facial expressions. Moreover, they were worse at decoding Latino facial expressions (mean = 0.288) compared to Asian (mean = 0.464, p << 0.01) facial expressions. Pre-adolescents better decoded Caucasian/European American facial expressions (mean = 0.609) compared to African American (mean = 0.405, p << 0.01) and Latino (mean = 0.319, p << 0.01) facial expressions. Moreover, they poorly decoded Latino facial expressions (mean = 0.319) compared to Asian (mean = 0.515, p << 0.01) facial expressions. Lastly, adolescents better decoded Caucasian/European American facial expressions (mean = 0.632) compared to African American (mean = 0.520, p = 0.009), Latino (mean = 0.266, p << 0.01) and Asian (mean = 0.491, p = 0.006) facial expressions. Moreover, they were worse at decoding Latino facial expressions (mean = 0.266, p << 0.01) compared to African American (mean = 0.520) and Asian (mean = 0.491) facial expressions.
- Concerning stimuli’s sex: Caucasian/European American facial expressions were better decoded when conveyed by female stimuli (mean = 0.914) compared to male stimuli (mean = 0.316, p << 0.01). Similarly, African American facial expressions were better decoded when conveyed by female stimuli (mean = 0.656) compared to male stimuli (mean = 0.210, p << 0.01). Conversely, Latino facial expressions were better decoded when conveyed by male stimuli (mean = 0.373) compared to female stimuli (mean = 0.209, p << 0.01).
- Concerning stimuli’s ethnicity: Male African American facial expressions (mean = 0.210) were poorly decoded compared to male Caucasian/European American (mean = 0.316, p = 0.009), male Latino (mean = 0.373, p << 0.01), and male Asian facial expressions (mean = 0.498, p << 0.01). Moreover, male Asian facial expressions (mean = 0.498) were better decoded compared to male Caucasian/European American (mean = 0.316, p << 0.01) and male Latino (mean = 0.373, p = 0.001) facial expressions. Female Caucasian/European American facial expressions (mean = 0.914, p << 0.01) were better decoded compared to female African American (mean = 0.656), female Latino (mean = 0.209), and female Asian facial expressions (mean = 0.482). Moreover, female African American facial expressions (mean = 0.656, p << 0.01) were better decoded compared to female Latino (mean = 0.209) and female Asian facial expressions (mean = 0.482). Conversely, female Latino (mean = 0.209) were more poorly decoded than female Asian (mean = 0.482, p << 0.01) facial expressions.
3.2.5. Surprise
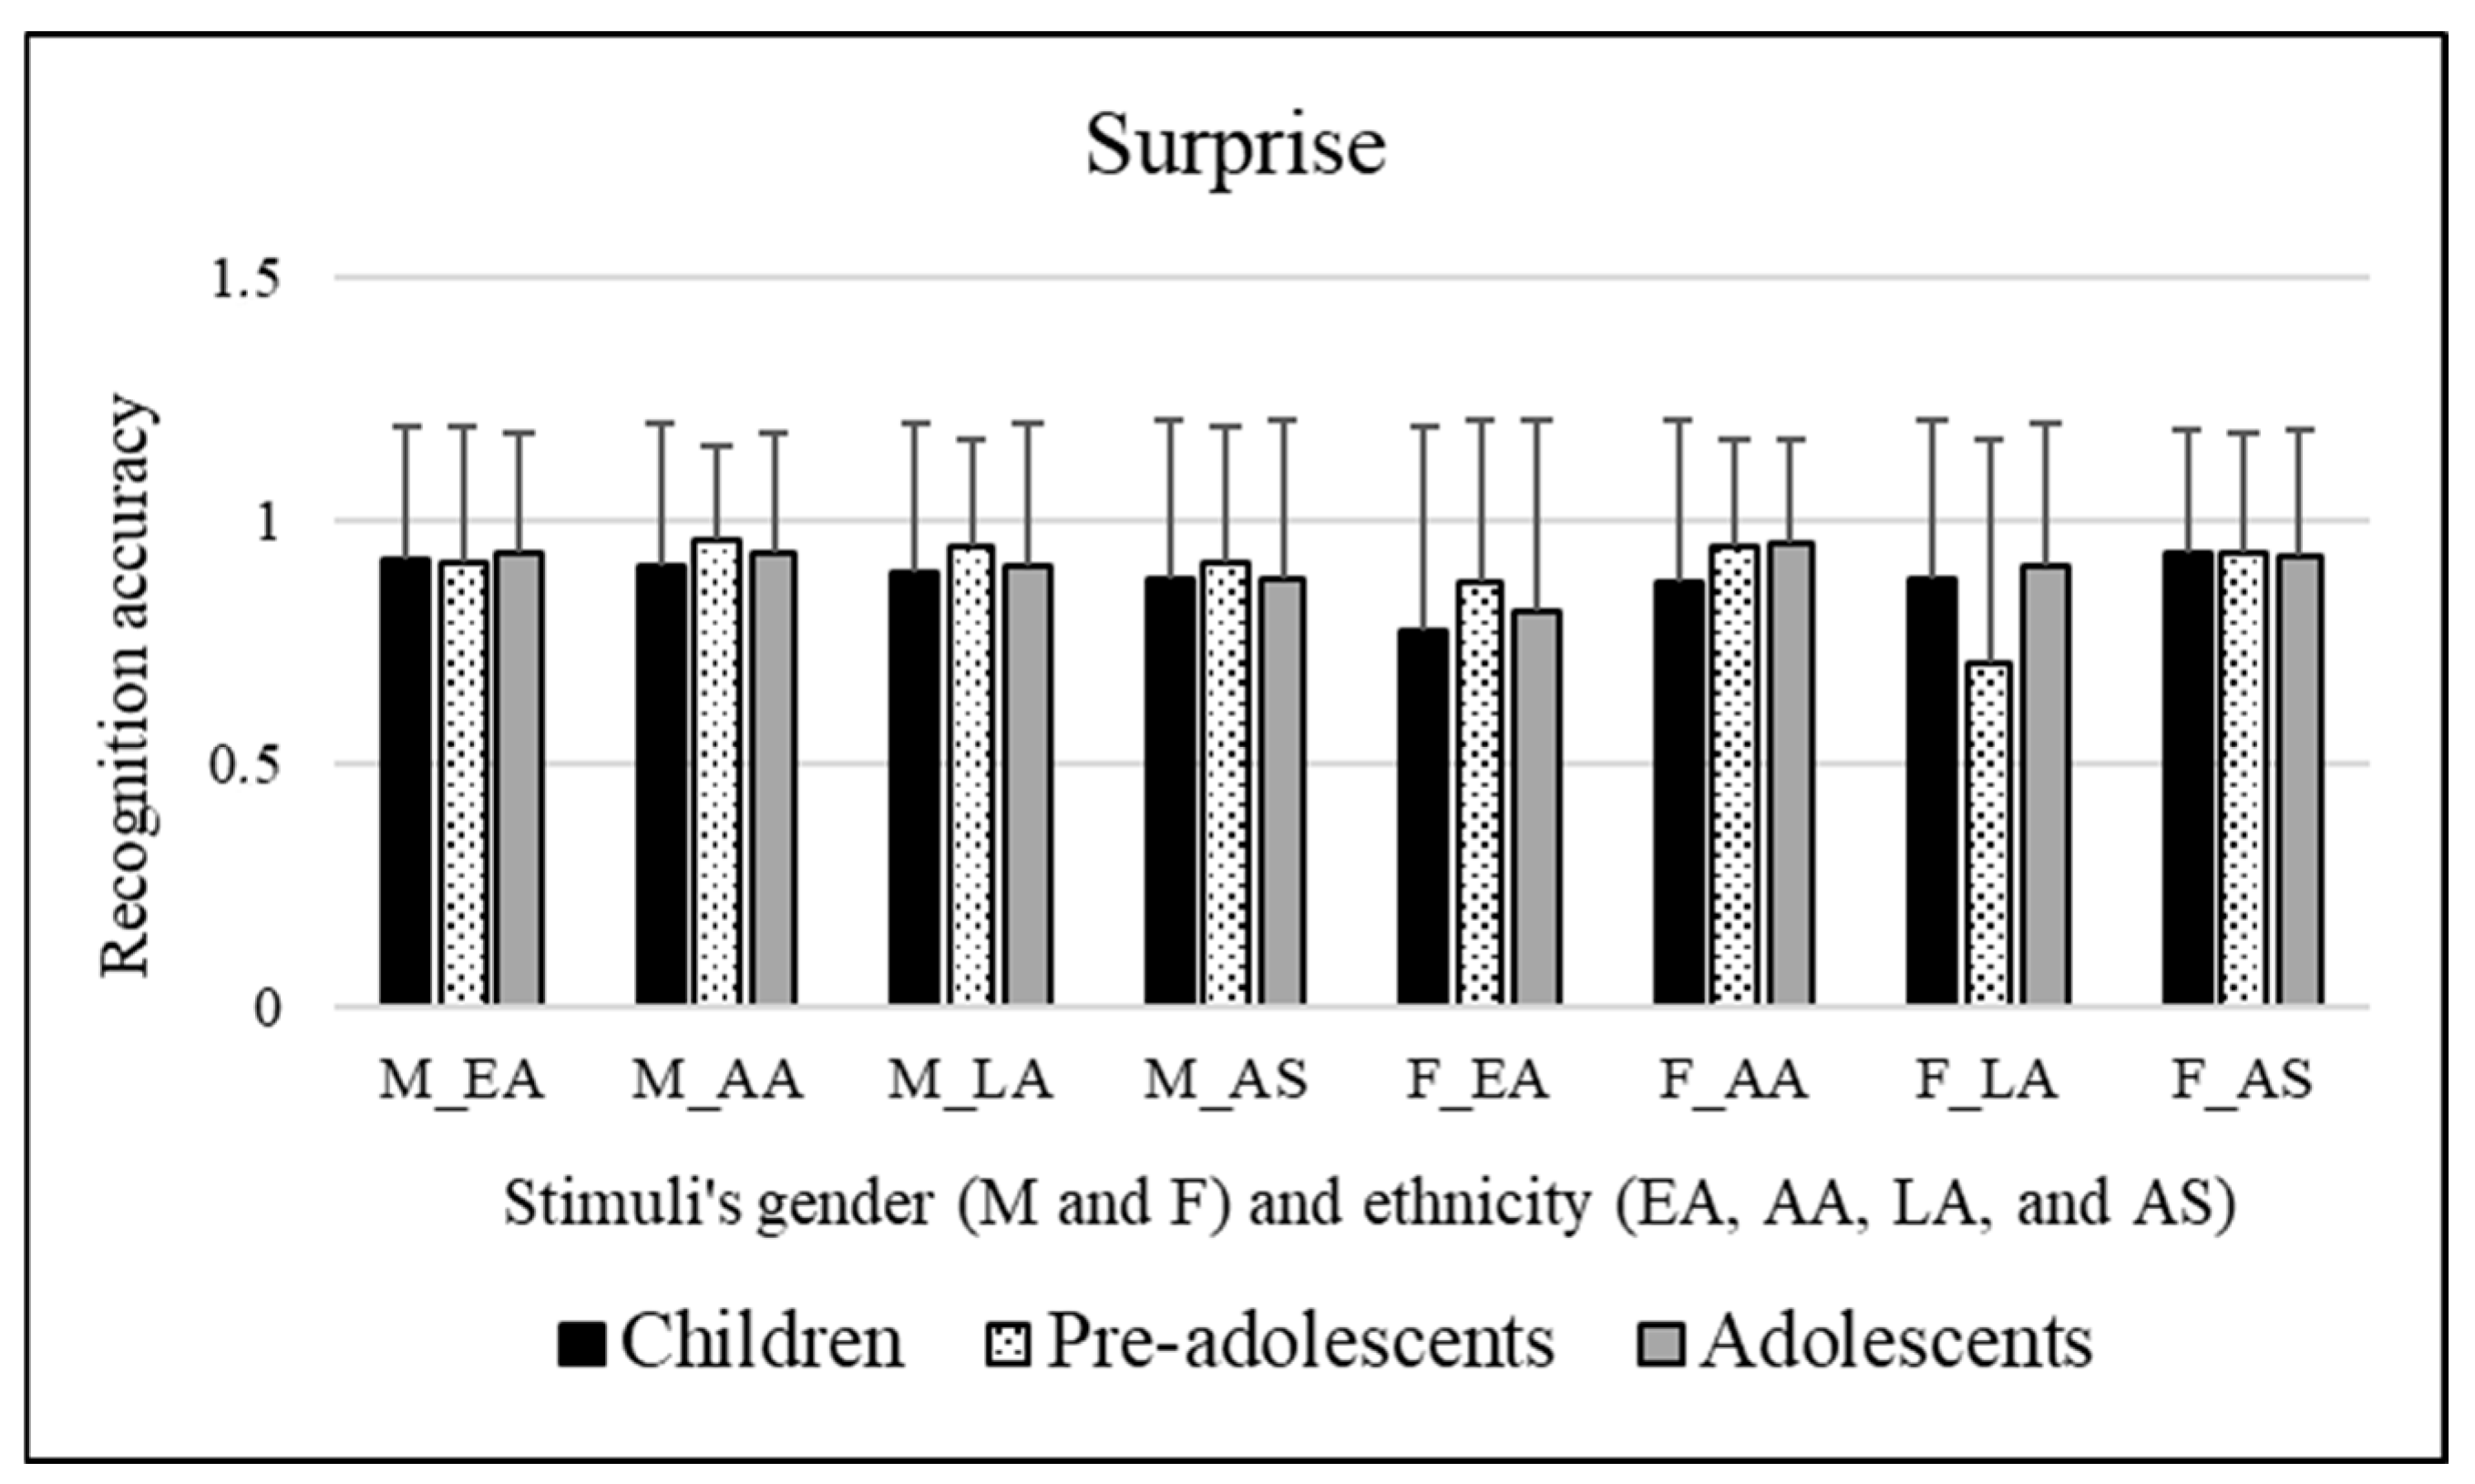
- Concerning participants’ age groups: Since Bonferroni post hoc analysis tends to be very restrictive in this case the main effect disappeared. Therefore, there were no significant differences among the three levels of age groups investigated in decoding the different facial expressions of the ethnicities proposed.
- Concerning stimuli’s ethnicity: Pre-adolescents were worse at decoding Latino facial expressions (mean = 0.823) compared to African American (mean = 0.953, p << 0.01) and Asian (mean = 0.920, p = 0.013) facial expressions. Adolescents better decoded African American facial expressions (mean = 0.944) compared to Caucasian/European American (mean = 0.872, p = 0.049) facial expressions.
- Concerning stimuli’s sex: Caucasian/European American facial expressions were better decoded when conveyed by male stimuli (mean = 0.922) compared to female stimuli (mean = 0.819, p << 0.01). Similarly, Latino facial expressions were better decoded when conveyed by male stimuli (mean = 0.917) compared to female stimuli (mean = 0.826, p << 0.01).
- Concerning stimuli’s ethnicity: Female Caucasian/European American facial expressions (mean = 0.819, p << 0.01) were poorly decoded compared to female African American (mean = 0.925) and female Asian facial expressions (mean = 0.925). Moreover, female Latino (mean = 0.826, p << 0.01) facial expressions were more poorly decoded than female African American (mean = 0.925) and female Asian facial expressions (mean = 0.925).
3.2.6. Happiness
- Concerning stimuli’s sex: African American facial expressions were better decoded when conveyed by female stimuli (mean = 0.979) compared to male stimuli (mean = 0.926, p = 0.001).
- Concerning stimuli’s ethnicity: Male Asian facial expressions (mean = 0.975, p = 0.011) were better decoded compared to male African American (mean = 0.926) facial expressions. Moreover, female African American (mean = 0.979, p = 0.049) expressions were better decoded than female Caucasian/European American facial expressions (mean = 0.941).
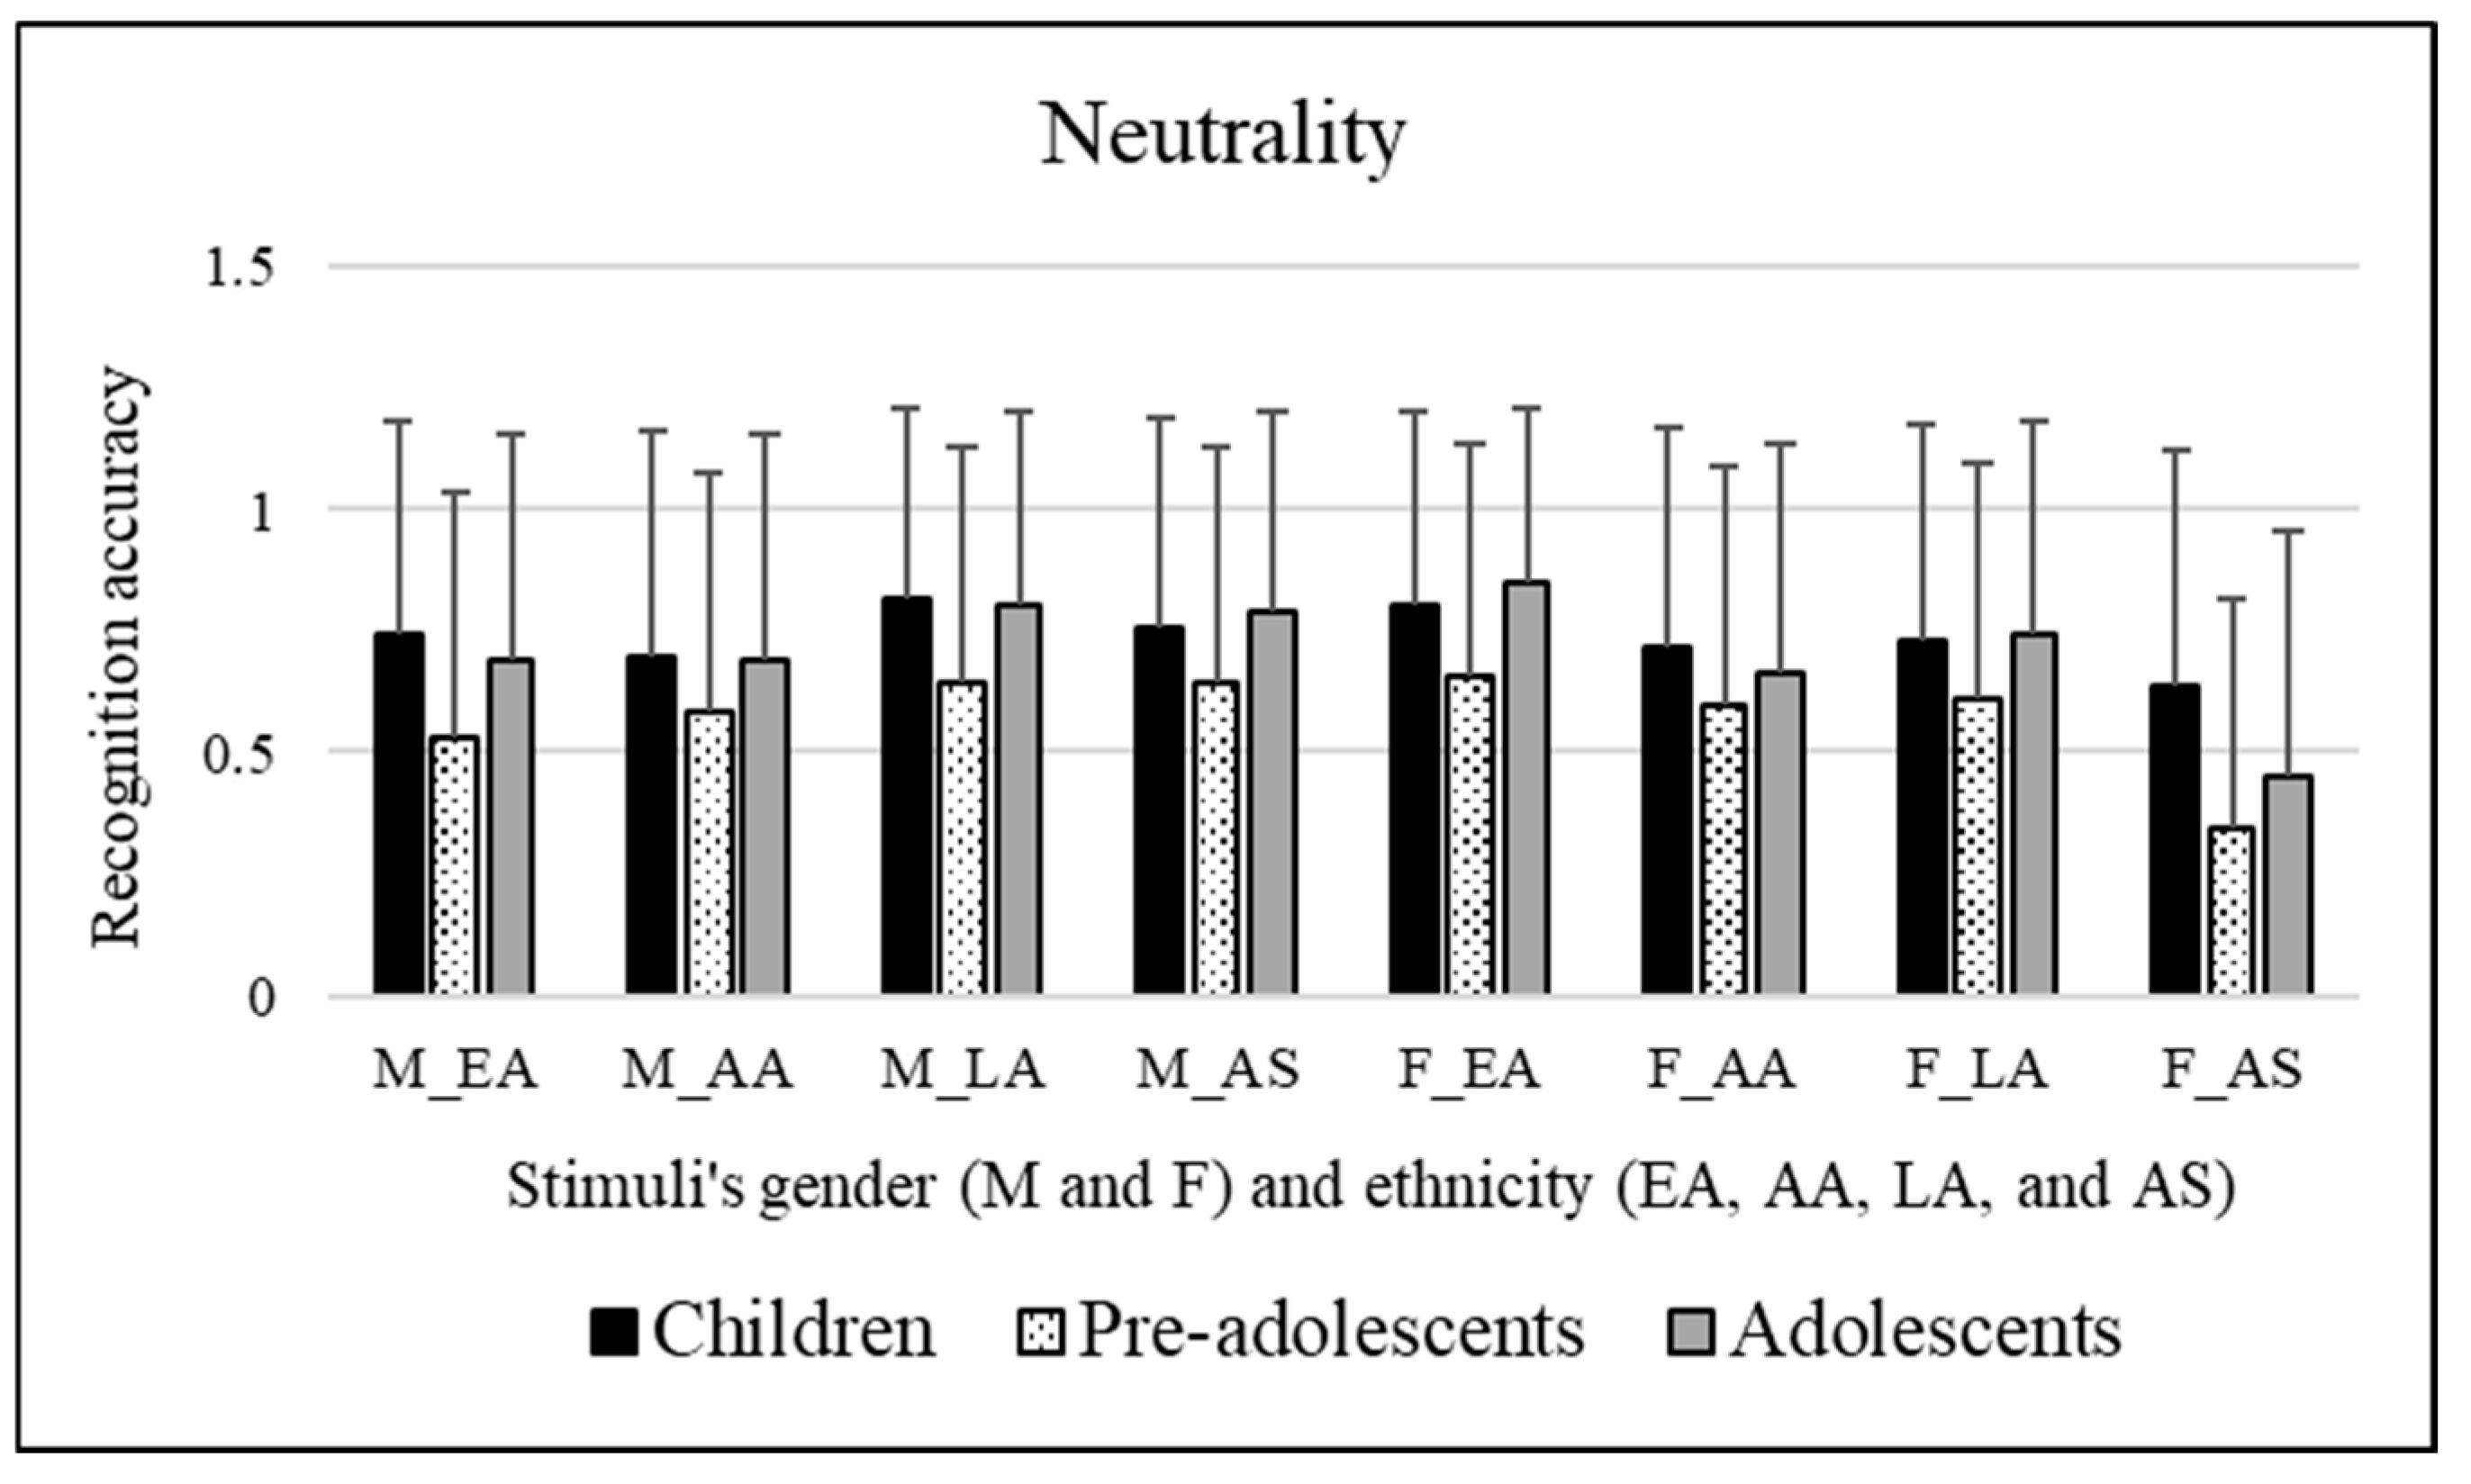
3.2.7. Neutrality
- Concerning stimuli’s sex: Caucasian/European American facial expressions were better decoded when conveyed by female stimuli (mean = 0.765) compared to male stimuli (mean = 0.654, p << 0.01). Conversely, Latino facial expressions were better decoded when conveyed by male stimuli (mean = 0.755) compared to female stimuli (mean = 0.687, p = 0.006). Similarly, Asian facial expressions were better decoded when conveyed by male stimuli (mean = 0.727) compared to female stimuli (mean = 0.475, p << 0.01).
- Concerning stimuli’s ethnicity: Male Latino facial expressions (mean = 0.755) were better decoded compared to male Caucasian/European American (mean = 0.654, p = 0.003) and male African American facial expressions (mean = 0.652, p = 0.001). Moreover, male Asian facial expressions (mean = 0.727) were better decoded compared to male African American facial expressions (mean = 0.652, p = 0.025). Female Asian facial expressions (mean = 0.475, p << 0.01) were more poorly decoded compared to female Caucasian/European American (mean = 0.765), female African American (mean = 0.654), and female Latino (mean = 0.687) facial expressions. Moreover, female Caucasian/European American facial expressions (mean = 0.765) were better decoded compared to female African American (mean = 0.654, p = 0.001) and female Latino (mean = 0.687, p = 0.016) facial expressions.
3.3. The Emotion Recognition Accuracy in Percentage Values Computed for Children, Pre-Adolescents, and Adolescents Divided Between Male and Female Participants
4. Discussion
5. Conclusions
Author Contributions
Funding
Institutional Review Board Statement
Informed Consent Statement
Data Availability Statement
Conflicts of Interest
References
- Bardack, S. R., & Widen, S. C. (2019). Emotion understanding and regulation: Implications for positive school adjustment. In Handbook of emotional development (pp. 479–491). Springer. [Google Scholar] [CrossRef]
- Bayet, L., Pascalis, O., & Gentaz, É. (2014). The development of emotional facial expression discrimination by infants in the first year of life. L’Année Psychologique, 114(3), 469–500. Available online: https://shs.cairn.info/journal-l-annee-psychologique1-2014-3-page-469?lang=en (accessed on 1 November 2017).
- Bick, J., Luyster, R., Fox, N. A., Zeanah, C. H., & Nelson, C. A. (2017). Effects of early institutionalization on emotion processing in 12-year-old youth. Development and Psychopathology, 29(5), 1749–1761. [Google Scholar] [CrossRef] [PubMed]
- Bons, D., van den Broek, E., Scheepers, F., Herpers, P., Rommelse, N., & Buitelaaar, J. K. (2013). Motor, emotional, and cognitive empathy in children and adolescents with autism spectrum disorder and conduct disorder. Journal of Abnormal Child Psychology, 41, 425–443. [Google Scholar] [CrossRef] [PubMed]
- Castro, V. L., Cheng, Y., Halberstadt, A. G., & Grühn, D. (2016). EUReKA! A conceptual model of emotion understanding. Emotion Review, 8(3), 258–268. [Google Scholar] [CrossRef]
- Esposito, A., Esposito, A. M., Cordasco, G., Maldonato, M., Vogel, C., & Bourbakis, N. (2018, August 22–24). Emotional faces of children and adults: What changes in their perception. 2018 9th IEEE International Conference on Cognitive Infocommu-Nications (CogInfoCom) (pp. 000099–000104), Budapest, Hungary. [Google Scholar] [CrossRef]
- Ewing, L., Karmiloff-Smith, A., Farran, E. K., & Smith, M. L. (2017). Distinct profiles of information-use characterize identity judgments in children and low-expertise adults. Journal of Experimental Psychology: Human Perception and Performance, 43(12), 1937. [Google Scholar] [CrossRef]
- Gao, X., Maurer, D., & Nishimura, M. (2010). Similarities and differences in the perceptual structure of facial expressions of children and adults. Journal of Experimental Child Psychology, 105(1–2), 98–115. [Google Scholar] [CrossRef]
- Gasper, K., Spencer, L. A., & Hu, D. (2019). Does neutral affect exist? How challenging three beliefs about neutral affect can advance affective research. Frontiers in Psychology, 10, 2476. [Google Scholar] [CrossRef]
- Gil, S., & Le Bigot, L. (2023). Emotional face recognition when a colored mask is worn: A cross-sectional study. Scientific Reports, 13(1), 174. [Google Scholar] [CrossRef]
- Goodfellow, S., & Nowicki, S., Jr. (2009). Social adjustment, academic adjustment, and the ability to identify emotion in facial expressions of 7-year-old children. The Journal of Genetic Psychology, 170(3), 234–243. [Google Scholar] [CrossRef]
- Griffiths, S., Penton-Voak, I. S., Jarrold, C., & Munafò, M. R. (2015). No own-age advantage in children’s recognition of emotion on prototypical faces of different ages. PLoS ONE, 10(5), e0125256. [Google Scholar] [CrossRef]
- Hoemann, K., Xu, F., & Barrett, L. F. (2019). Emotion words, emotion concepts, and emotional development in children: A constructionist hypothesis. Developmental Psychology, 55(9), 183. [Google Scholar] [CrossRef]
- Izard, C., Fine, S., Schultz, D., Mostow, A., Ackerman, B., & Youngstrom, E. (2001). Emotion knowledge as a predictor of social behavior and academic competence in children at risk. Psychological Science, 12(1), 18–23. [Google Scholar] [CrossRef] [PubMed]
- Kang, S. M., & Lau, A. S. (2013). Revisiting the out-group advantage in emotion recognition in a multicultural society: Further evidence for the in-group advantage. Emotion, 13(2), 203. [Google Scholar] [CrossRef]
- Kret, M. E., & De Gelder, B. (2012). A review on sex differences in processing emotional signals. Neuropsychologia, 50(7), 1211–1221. [Google Scholar] [CrossRef] [PubMed]
- Larsen, J. T., Norris, C. J., McGraw, A. P., Hawkley, L. C., & Cacioppo, J. T. (2009). The evaluative space grid: A single-item measure of positivity and negativity. Cognition and Emotion, 23(3), 453–480. [Google Scholar] [CrossRef]
- Lawrence, K., Campbell, R., & Skuse, D. (2015). Age, gender, and puberty influence the development of facial emotion recognition. Frontiers in Psychology, 6, 761. [Google Scholar] [CrossRef]
- Lee, E., Kang, J. I., Park, I. H., Kim, J. J., & An, S. K. (2008). Is a neutral face really evaluated as being emotionally neutral? Psychiatry Research, 157(1–3), 77–85. [Google Scholar] [CrossRef]
- LoBue, V., & Thrasher, C. (2015). The Child Affective Facial Expression (CAFE) set: Validity and reliability from untrained adults. Frontiers in Psychology, 5, 1532. [Google Scholar] [CrossRef]
- Mancini, G., Agnoli, S., Baldaro, B., Ricci Bitti, P. E., & Surcinelli, P. (2013). Facial expressions of emotions: Recognition accuracy and affective reactions during late childhood. The Journal of Psychology, 147(6), 599–617. [Google Scholar] [CrossRef]
- Mancini, G., Biolcati, R., Agnoli, S., Andrei, F., & Trombini, E. (2018). Recognition of facial emotional expressions among italian pre-adolescents, and their affective reactions. Frontiers in Psychology, 9, 1303. [Google Scholar] [CrossRef]
- McDuff, D., Kodra, E., Kaliouby, R. E., & LaFrance, M. (2017). A large-scale analysis of sex differences in facial expressions. PLoS ONE, 12(4), e0173942. [Google Scholar] [CrossRef]
- Montirosso, R., Peverelli, M., Frigerio, E., Crespi, M., & Borgatti, R. (2010). The development of dynamic facial expression recognition at different intensities in 4-to 18-year-olds. Social Development, 19(1), 71–92. [Google Scholar] [CrossRef]
- Motta-Mena, N. V., & Scherf, K. S. (2017). Pubertal development shapes perception of complex facial expressions. Developmental Science, 20(4), e12451. [Google Scholar] [CrossRef]
- Moulson, M. C., Shutts, K., Fox, N. A., Zeanah, C. H., Spelke, E. S., & Nelson, C. A. (2015). Effects of early institutionalization on the development of emotion processing: A case for relative sparing? Developmental Science, 18(2), 298–313. [Google Scholar] [CrossRef]
- Olderbak, S., Wilhelm, O., Hildebrandt, A., & Quoidbach, J. (2019). Sex differences in facial emotion perception ability across the lifespan. Cognition and Emotion, 33(3), 579–588. [Google Scholar] [CrossRef]
- Palama, A., Malsert, J., & Gentaz, E. (2018). Are 6-month-old human infants able to transfer emotional information (happy or angry) from voices to faces? An eye-tracking study. PLoS ONE, 13(4), e0194579. [Google Scholar] [CrossRef]
- Patton, G. C., Sawyer, S. M., Santelli, J. S., Ross, D. A., Afifi, R., Allen, N. B., Arora, M., Azzopardi, P., Baldwin, W., Bonell, C., & Viner, R. M. (2016). Our future: A Lancet commission on adolescent health and wellbeing. The Lancet, 387(10036), 2423–2478. [Google Scholar] [CrossRef]
- Reyes, B. N., Segal, S. C., & Moulson, M. C. (2018). An investigation of the effect of race-based social categorization on adults’ recognition of emotion. PLoS ONE, 13(2), e0192418. [Google Scholar] [CrossRef]
- Rhodes, M. G., & Anastasi, J. S. (2012). The own-age bias in face recognition: A meta-analytic and theoretical review. Psychological Bulletin, 138(1), 146. [Google Scholar] [CrossRef]
- Rodger, H., Vizioli, L., Ouyang, X., & Caldara, R. (2015). Mapping the development of facial expression recognition. Developmental Science, 18(6), 926–939. [Google Scholar] [CrossRef]
- Ruba, A. L., & Pollak, S. D. (2020a). The development of emotion reasoning in infancy and early childhood. Annual Review of Developmental Psychology, 2(1), 503–531. [Google Scholar] [CrossRef]
- Ruba, A. L., & Pollak, S. D. (2020b). Children’s emotion inferences from masked faces: Implications for social interactions during COVID-19. PLoS ONE, 15(12), e0243708. [Google Scholar] [CrossRef]
- Russell, J. A. (2003). Core affect and the psychological construction of emotion. Psychological Review, 110(1), 145. [Google Scholar] [CrossRef]
- Sawyer, S. M., Azzopardi, P. S., Wickremarathne, D., & Patton, G. C. (2018). The age of adolescence. The Lancet Child & Ado-Lescent Health, 2(3), 223–228. [Google Scholar] [CrossRef]
- Shablack, H., & Lindquist, K. A. (2019). The role of language in emotional development. In Handbook of emotional development (pp. 451–478). Springer International Publishing. [Google Scholar] [CrossRef]
- Torres, M. M., Domitrovich, C. E., & Bierman, K. L. (2015). Preschool interpersonal relationships predict kindergarten achievement: Mediated by gains in emotion knowledge. Journal of Applied Developmental Psychology, 39, 44–52. [Google Scholar] [CrossRef]
- UNICEF. (2018). UNICEF programme guidance for the second decade: Programming with and for adolescents. UNICEF. [Google Scholar]
- Vannucci, A., Simpson, E. G., Gagnon, S., & Ohannessian, C. M. (2020). Social media use and risky behaviors in adolescents: A meta-analysis. Journal of Adolescence, 79, 258–274. [Google Scholar] [CrossRef]
- Waters, S. F., Virmani, E. A., Thompson, R. A., Meyer, S., Raikes, H. A., & Jochem, R. (2010). Emotion regulation and attachment: Unpacking two constructs and their association. Journal of Psychopathology and Behavioral Assessment, 32, 37–47. [Google Scholar] [CrossRef]
- Widen, S. C. (2013). Children’s interpretation of facial expressions: The long path from valence-based to specific discrete categories. Emotion Review, 5(1), 72–77. [Google Scholar] [CrossRef]
- Widen, S. C., & Russell, J. A. (2008). Children acquire emotion categories gradually. Cognitive Development, 23(2), 291–312. [Google Scholar] [CrossRef]
- Widen, S. C., & Russell, J. A. (2010). The “disgust face” conveys anger to children. Emotion, 10(4), 455. [Google Scholar] [CrossRef]
- World Health Organization. (2019). Accelerated action for the health of adolescents (AA-HA!): A manual to facilitate the process of developing national adolescent health strategies and plans. In Accelerated action for the health of adolescents (AA-HA!): A manual to facilitate the process of developing national adolescent health strategies and plans. Available online: https://apps.who.int/iris/bitstream/handle/10665/330483/9789241517058-eng.pdf?ua=1 (accessed on 17 January 2020).


| Children | Pre-Adolescents | Adolescents | ||||
|---|---|---|---|---|---|---|
| Females | Males | Females | Males | Females | Males | |
| Disgust | 59.8% | 53.5% | 12.5% | 31.9% | 69.2% | 55.4% |
| Anger | 84.4% | 76.5% | 11.5% | 46.9% | 76.3% | 68.8% |
| Sadness | 75.4% | 64.4% | 13.3% | 39.4% | 64.4% | 55.8% |
| Fear | 47.7% | 36.3% | 12.5% | 24.8% | 48.3% | 36.5% |
| Happiness | 97.7% | 89.4% | 12.5% | 51.7% | 91.5% | 75.8% |
| Surprise | 90.8% | 79.8% | 9.4% | 48.1% | 86.9% | 73.1% |
| Neutrality | 74.8% | 67.9% | 12.5% | 27.5% | 67.5% | 57.9% |
Disclaimer/Publisher’s Note: The statements, opinions and data contained in all publications are solely those of the individual author(s) and contributor(s) and not of MDPI and/or the editor(s). MDPI and/or the editor(s) disclaim responsibility for any injury to people or property resulting from any ideas, methods, instructions or products referred to in the content. |
© 2025 by the authors. Published by MDPI on behalf of the University Association of Education and Psychology. Licensee MDPI, Basel, Switzerland. This article is an open access article distributed under the terms and conditions of the Creative Commons Attribution (CC BY) license (https://creativecommons.org/licenses/by/4.0/).
Share and Cite
Cuciniello, M.; Amorese, T.; Vogel, C.; Cordasco, G.; Esposito, A. The Development of Emotion Recognition Skills from Childhood to Adolescence. Eur. J. Investig. Health Psychol. Educ. 2025, 15, 56. https://doi.org/10.3390/ejihpe15040056
Cuciniello M, Amorese T, Vogel C, Cordasco G, Esposito A. The Development of Emotion Recognition Skills from Childhood to Adolescence. European Journal of Investigation in Health, Psychology and Education. 2025; 15(4):56. https://doi.org/10.3390/ejihpe15040056
Chicago/Turabian StyleCuciniello, Marialucia, Terry Amorese, Carl Vogel, Gennaro Cordasco, and Anna Esposito. 2025. "The Development of Emotion Recognition Skills from Childhood to Adolescence" European Journal of Investigation in Health, Psychology and Education 15, no. 4: 56. https://doi.org/10.3390/ejihpe15040056
APA StyleCuciniello, M., Amorese, T., Vogel, C., Cordasco, G., & Esposito, A. (2025). The Development of Emotion Recognition Skills from Childhood to Adolescence. European Journal of Investigation in Health, Psychology and Education, 15(4), 56. https://doi.org/10.3390/ejihpe15040056