
Assessing System Justification in Czech Population Using the System Justification Scale


Abstract
:1. Introduction
- (a)
- System justification, as examined by the SJS, is a unidimensional construct.
- (b)
- All SJS items are highly correlated with each other.
- (c)
- The psychometric properties of the SJS indicate a good fit of the tested construct to the empirical data.
2. Materials and Methods
2.1. Participants and Procedures
2.2. Research Ethics
2.3. Translation of the Instrument
2.4. Measures
2.4.1. System Justification Scale (SJS)
2.4.2. Control Indicators
2.5. Data Analysis
3. Results
3.1. Univariate Statistics and Internal Consistency
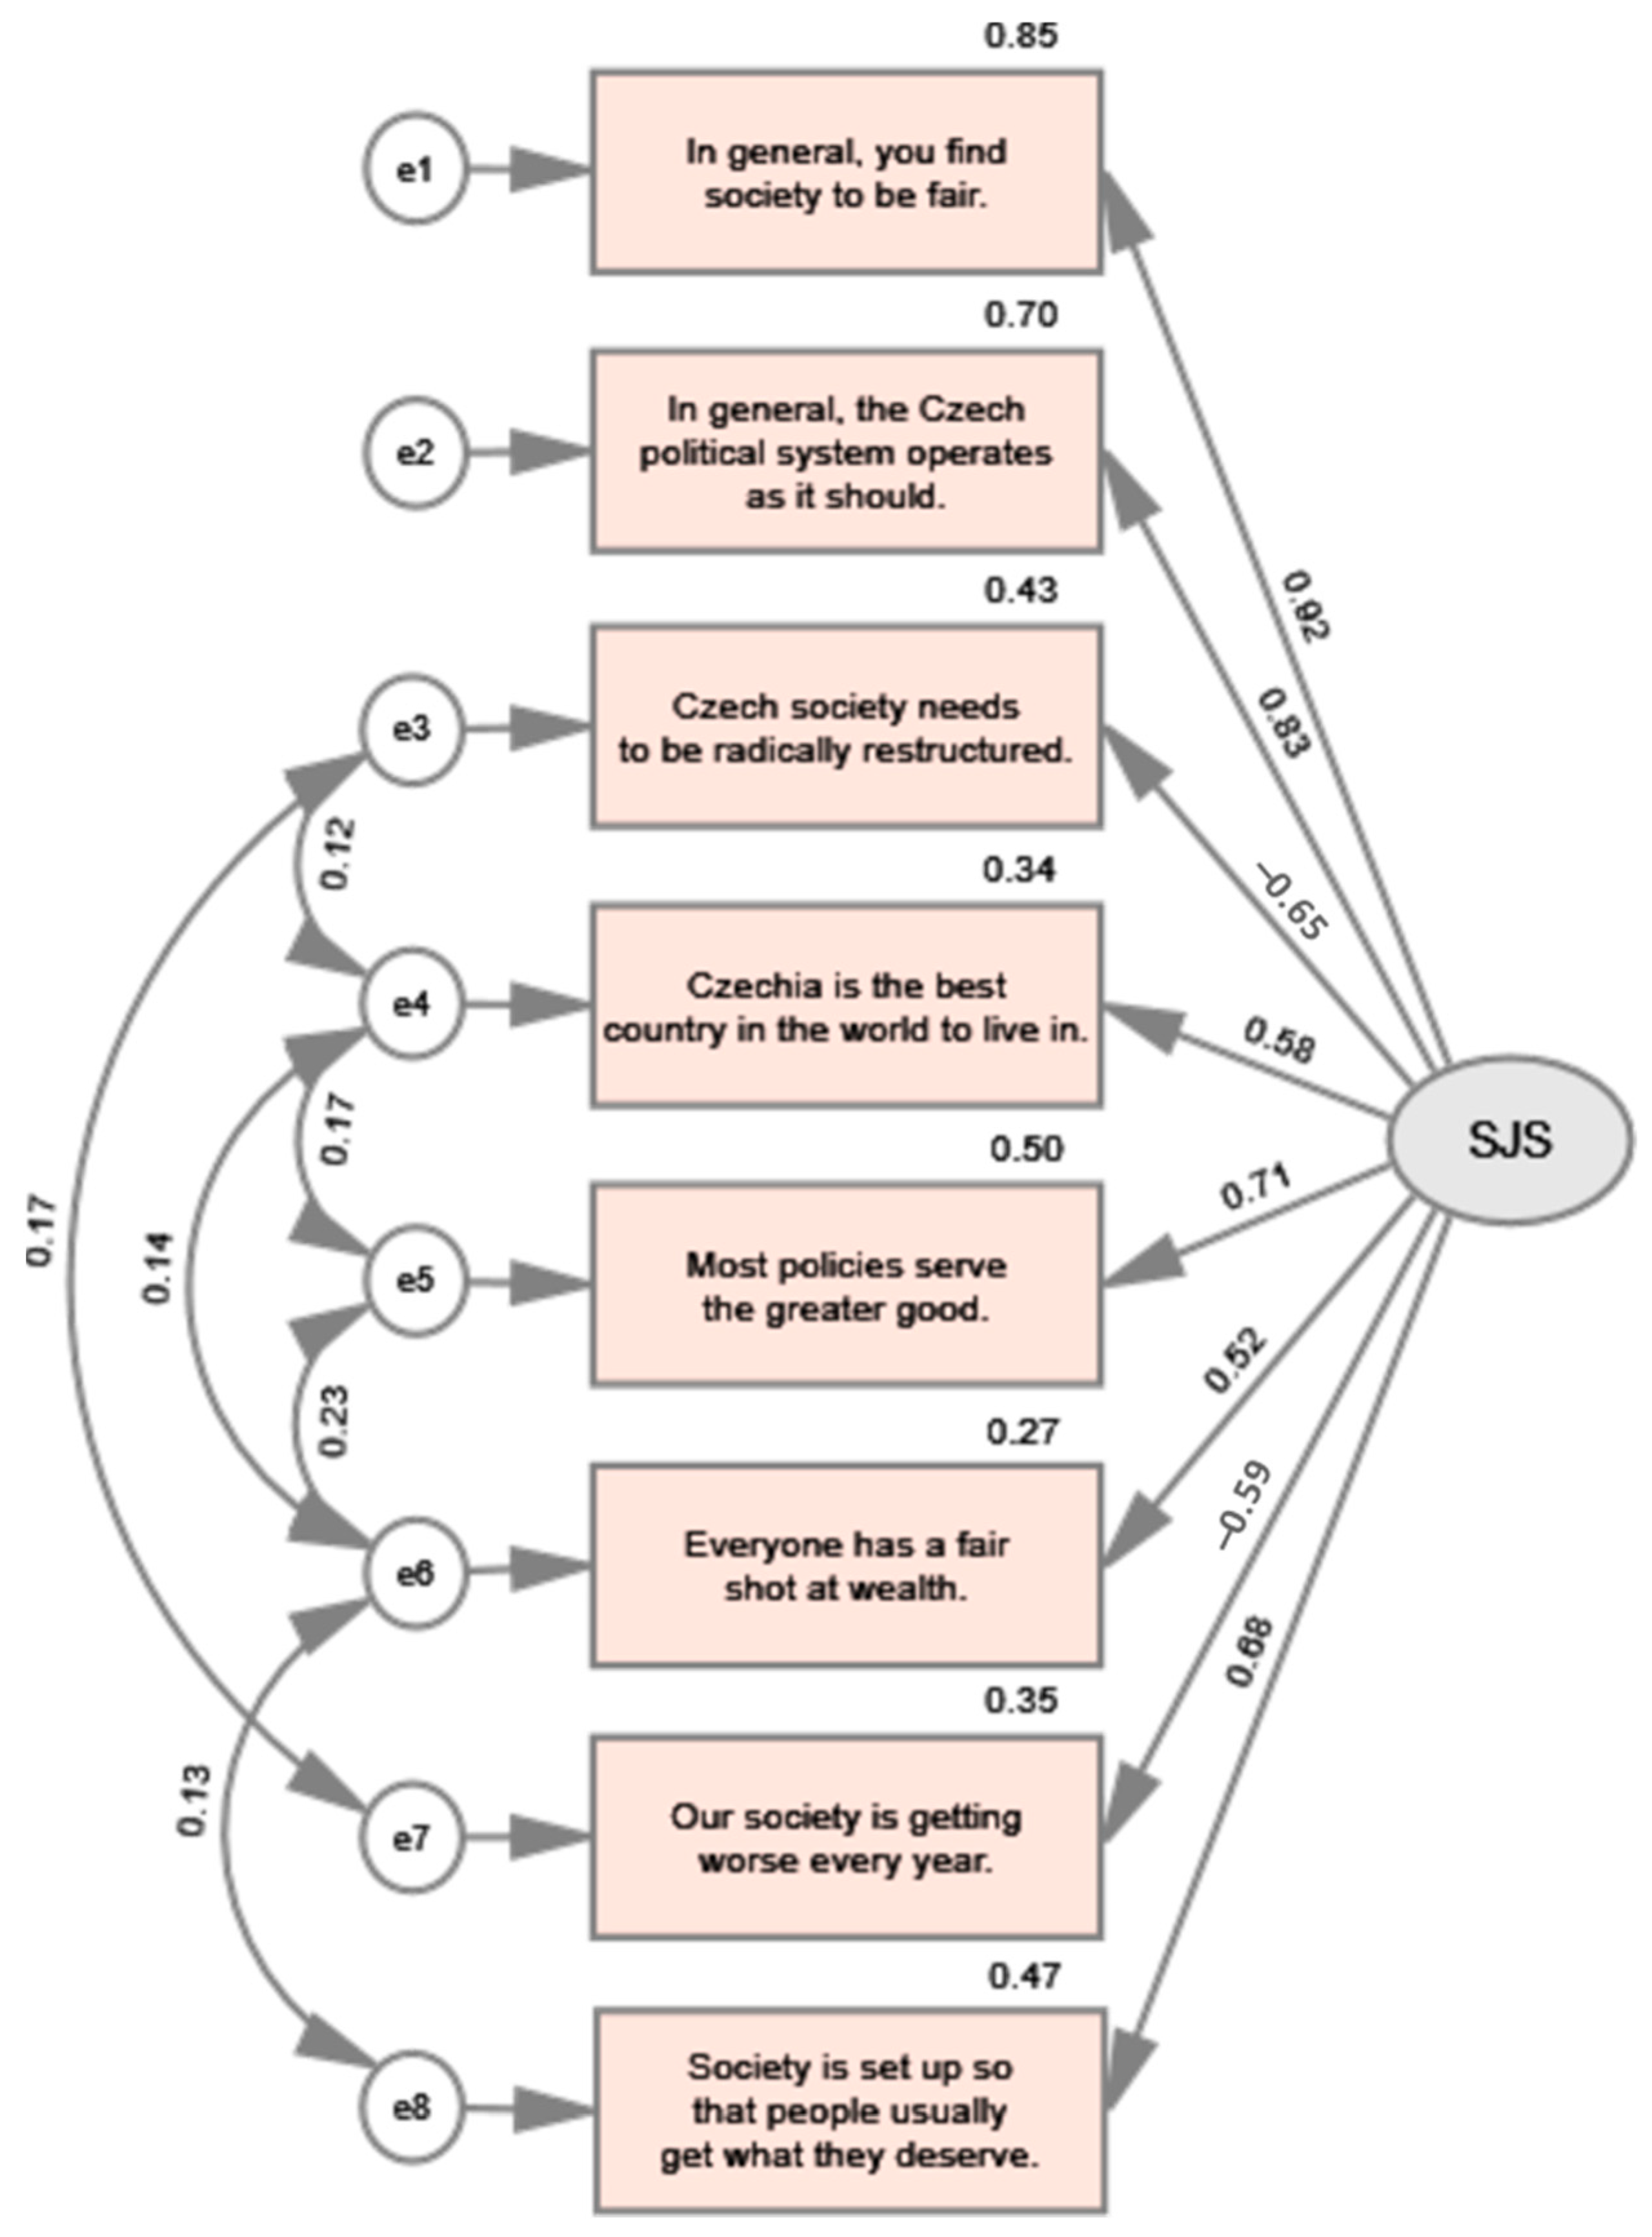
3.2. Psychometric Properties of the SJS
3.3. Construct Convergent and Divergent Validity
- (a)
- Exploratory factor analysis; in addition to the previously mentioned results regarding factor loadings (FL) and communalities (h2) in Table 3, low or no cross-validation in the EFA indicated high construct convergent validity. The latter is high because there is only one factor.
- (b)
- The average variance extracted (AVE), which represented the average amount of variance captured by the indicators associated with the latent variable, reached 0.54. The value obtained indicated that, on average, 54% of the variance of the items was explained by the latent variable; the result also indicated a high (acceptable) convergent validity given that the items were interrelated and measured the same underlying construct.
- (c)
- Composite reliability (CR), which tested for correlations between indicators of the latent variable. The CR value in this case was 0.76, which exceeded the recommended value of 0.7. Thus, this result also indicated that the items were correlated with each other, which supported the hypothesis of the satisfactory convergent validity of the SJS and suggested that the scale was a reliable instrument in this case.
- (d)
- The correlation matrix presented in Table 5 shows statistically significant associations between all items, suggesting that all items may be measuring the same construct. Thus, the correlation matrix provides another strong argument to support the construct validity assumption of the scale.
- (e) Table 6 shows that respondents who agreed with the statement about the need to comply with the laws, even if they are bad, had higher scores on the SJS. Furthermore, the expected negative association between the SJS and perceived fairness is evident in the empirical data, with respondents who agreed with the statement that ordinary people do not get a fair share of the national wealth scoring lower on the SJS. Similarly, those who agreed with the statement that different rules apply to rich and poor people had lower SJS scores. Consistent with the expectation embedded in social justification theory, the significantly lower willingness to strike of people with high SJS scores is evident, confirming their resistance to activities aimed at delegitimizing the existing order.
4. Discussion
5. Conclusions
Funding
Institutional Review Board Statement
Informed Consent Statement
Data Availability Statement
Acknowledgments
Conflicts of Interest
References
- Brandt, M.J.; Kuppens, T.; Spears, R.; Andrighetto, L.; Autin, F.; Babincak, P.; Badea, C.; Bae, J.; Batruch, A.; Becker, J.C.; et al. Subjective status and perceived legitimacy across countries. Eur. J. Soc. Psychol. 2020, 50, 921–942. [Google Scholar] [CrossRef] [PubMed]
- Cichocka, A.; Jost, J.T. Stripped of illusions? Exploring system justification processes in capitalist and post-communist societies. Int. J. Psychol. 2014, 49, 6–29. [Google Scholar] [CrossRef] [PubMed]
- van der Toorn, J.; Berkics, M.; Jost, J.T. System justification, satisfaction, and perceptions of fairness and typicality at work: A cross-system comparison involving the US and Hungary. Soc. Justice Res. 2010, 23, 189–210. [Google Scholar] [CrossRef]
- Osborne, D.; Sengupta, N.K.; Sibley, C.G. System justification theory at 25: Evaluating a paradigm shift in psychology and looking towards the future. Br. J. Soc. Psychol. 2019, 58, 340–361. [Google Scholar] [CrossRef] [PubMed]
- Harwood-Gross, A.; Vayngrib, M.; Halperin, E. Moral Injury as a Social Phenomenon: Looking at the Unique Relationship with System Justification. J. Aggress. Maltreatment Trauma 2023, 1–18. [Google Scholar] [CrossRef]
- Cargile, A.C.; Kahn, A.S. System justification in communication: A study of imagined dialogue receptivity. Commun. Res. Rep. 2021, 38, 103–111. [Google Scholar] [CrossRef]
- Vesper, D.; König, C.J.; Siegel, R.; Friese, M. Is use of the general system justification scale across countries justified? Testing its measurement equivalence. Br. J. Soc. Psychol. 2022, 61, 1032–1049. [Google Scholar] [CrossRef] [PubMed]
- Jost, J.T.; Banaji, M.R. The role of stereotyping in system-justification and the production of false consciousness. Br. J. Soc. Psychol. 1994, 33, 1–27. [Google Scholar] [CrossRef]
- Jost, J.T.; van der Toorn, J. System justification theory. In Handbook of Theories of Social Psychology; van Lange, P.A.M., Kruglanski, A.W., Higgins, E.T., Eds.; Sage: London, UK, 2012; Volume 2, pp. 313–343. [Google Scholar]
- Silva, W.A.D.; Pereira, C.R. Do people see the way things are as they should be? Measuring the individual differences in system justification. Curr. Psychol. 2022, 42, 17805–17824. [Google Scholar] [CrossRef]
- Kay, A.C.; Gaucher, D.; Peach, J.M.; Friesen, J.; Laurin, K.; Zanna, M.P.; Spencer, S.J. Inequality, discrimination, and the power of the status quo: Direct evidence for a motivation to view what is as what should be. J. Personal. Soc. Psychol. 2009, 97, 421–434. [Google Scholar] [CrossRef]
- Jost, J.T.; Banaji, M.R.; Nosek, B.A. A decade of system justification theory: Accumulated evidence of conscious and unconscious bolstering of the status quo. Political Psychol. 2004, 25, 881–920. [Google Scholar] [CrossRef]
- van der Toorn, J.; Tyler, T.R.; Jost, J.T. More than fair: Outcome dependence, system justification, and the perceived legitimacy of authority. J. Exp. Soc. Psychol. 2011, 47, 127–138. [Google Scholar] [CrossRef]
- Card, K.G.; Hepburn, K. Social position and economic system justification in Canada: Implications for advancing health equity and social justice from an exploratory study of factors shaping economic system justification. Front. Public Health 2022, 10, 3912. [Google Scholar] [CrossRef] [PubMed]
- Jost, J.T. A quarter century of system justification theory: Questions, answers, criticisms, and societal applications. Br. J. Soc. Psychol. 2019, 58, 263–314. [Google Scholar] [CrossRef]
- Caricati, L. Evidence of decreased system justification among extreme conservatives in non-American samples. J. Soc. Psychol. 2019, 159, 725–745. [Google Scholar] [CrossRef]
- Jost, J.T.; Glaser, J.; Kruglanski, A.W.; Sulloway, F. Political conservatism as motivated social cognition. Psychol. Bull. 2003, 129, 339–375. [Google Scholar] [CrossRef]
- Nakagoshi, M.; Inamasu, K. The role of system justification theory in support of the government under long-term conservative party dominance in Japan. Front. Psychol. 2023, 14, 909022. [Google Scholar] [CrossRef]
- Jylhä, K.M.; Akrami, N. Social dominance orientation and climate change denial: The role of dominance and system justification. Pers. Individ. Dif. 2015, 86, 108–111. [Google Scholar] [CrossRef]
- Pratto, F.; Sidanius, J.; Stallworth, L.M.; Malle, B.F. Social dominance orientation: A personality variable predicting social and political attitudes. J. Personal. Soc. Psychol. 1994, 67, 741–763. [Google Scholar] [CrossRef]
- Carter, T.J.; Ferguson, M.J.; Hassin, R.R. Implicit nationalism as system justification: The case of the United States of America. Soc. Cogn. 2011, 29, 341–359. [Google Scholar] [CrossRef]
- Osborne, D.; Sibley, C.G. Through rose-colored glasses: System-justifying beliefs dampen the effects of relative deprivation on well-being and political mobilization. Personal. Soc. Psychol. Bull. 2013, 39, 991–1004. [Google Scholar] [CrossRef] [PubMed]
- Jost, J.T.; Chaikalis-Petritsis, V.; Abrams, D.; Sidanius, J.; van der Toorn, J.; Bratt, C. Why men (and women) do and don’t rebel: Effects of system justification on willingness to protest. Personal. Soc. Psychol. Bull. 2012, 38, 707–720. [Google Scholar] [CrossRef] [PubMed]
- Liekefett, L.; Becker, J.C. Low system justification is associated with support for both progressive and reactionary social change. Eur. J. Soc. Psychol. 2022, 52, 1015–1030. [Google Scholar] [CrossRef]
- Solak, N.; Tamir, M.; Sümer, N.; Jost, J.T.; Halperin, E. Expressive suppression as an obstacle to social change: Linking system justification, emotion regulation, and collective action. Motiv. Emot. 2021, 45, 661–682. [Google Scholar] [CrossRef]
- Jost, J.T.; Hunyady, O. Antecedents and consequences of system-justifying ideologies. Curr. Dir. Psychol. Sci. 2005, 14, 260–265. [Google Scholar] [CrossRef]
- Zimmerman, J.L.; Reyna, C. The meaning and role of ideology in system justification and resistance for high-and low-status people. J. Personal. Soc. Psychol. 2013, 105, 1–23. [Google Scholar] [CrossRef]
- Jost, J.T.; Pelham, B.W.; Carvallo, M.R. Non-conscious forms of system justification: Implicit and behavioral preferences for higher status groups. J. Exp. Soc. Psychol. 2002, 38, 586–602. [Google Scholar] [CrossRef]
- Vargas-Salfate, S.; Paez, D.; Khan, S.S.; Liu, J.H.; Gil de Zúñiga, H. System justification enhances well-being: A longitudinal analysis of the palliative function of system justification in 18 countries. Br. J. Soc. Psychol. 2018, 57, 567–590. [Google Scholar] [CrossRef]
- Durante, F.; Tablante, C.B.; Fiske, S.T. Poor but warm, rich but cold (and Competent): Social classes in the stereotype content model. J. Soc. 2017, 73, 138–157. [Google Scholar] [CrossRef]
- Jost, J.T.; Kay, A.C.; Thorisdottir, H. (Eds.) Social and Psychological Bases of Ideology and System Justification; Oxford University Press: New York, NY, USA, 2009; pp. 158–181. [Google Scholar] [CrossRef]
- Kay, A.C.; Friesen, J. On social stability and social change: Understanding when system justification does and does not occur. Curr. Dir. Psychol. Sci. 2011, 20, 360–364. [Google Scholar] [CrossRef]
- Kish, L. A procedure for objective respondent selection within the household. J. Am. Stat. Assoc. 1949, 44, 380–387. [Google Scholar] [CrossRef]
- Sousa, V.D.; Rojjanasrirat, W. Translation, adaptation and validation of instruments or scales for use in cross-cultural health care research: A clear and user-friendly guideline. J. Eval. Clin. Pract. 2011, 17, 268–274. [Google Scholar] [CrossRef]
- Yu, D.S.; Lee, D.T.; Woo, J. Issues and challenges of instrument translation. West. J. Nurs. Res. 2004, 26, 307–320. [Google Scholar] [CrossRef] [PubMed]
- Willis, G.B. Cognitive Interviewing; SAGE Publications, Inc.: Thousand Oaks, CA, USA, 2015. [Google Scholar] [CrossRef]
- Roccato, M.; Rosato, R.; Mosso, C.O.; Russo, S. Measurement properties of the system justification scale: A Rasch analysis. TPM Test. Psychom. Methodol. Appl. Psychol. 2014, 21, 267–278. [Google Scholar]
- Langer, M.; Vasilopoulos, P.; McAvay, H.; Jost, J.T. System justification in France: Liberté, égalité, fraternité. Curr. Opin. Behav. Sci. 2020, 34, 185–191. [Google Scholar] [CrossRef]
- Raykov, T. Scale reliability, Cronbach’s coefficient alpha, and violations of essential tau-equivalence with fixed congeneric components. Multivar. Behav. Res. 1997, 32, 329–353. [Google Scholar] [CrossRef]
- Revelle, W.; Zinbarg, R. Coefficients alpha, beta, omega, and the GLB: Comments on Sijtma. Psychometrika 2009, 74, 145–154. [Google Scholar] [CrossRef]
- Tavakol, M.; Dennick, R. Making sense of Cronbach’s alpha. Int. J. Med. Educ. 2011, 2, 53–55. [Google Scholar] [CrossRef]
- Field, A. Discovering Statistics Using SPSS, 5th ed.; Sage Publications: London, UK, 2017. [Google Scholar]
- Comrey, A.L.; Lee, H.B. A First Course in Factor Analysis; Psychology Press: London, UK, 2013. [Google Scholar]
- Byrne, B.M. Structural Equation Modeling with AMOS. In Basic Concepts, Applications, and Programming, 2nd ed.; Routledge: New York, NY, USA, 2001. [Google Scholar]
- Remr, J. Validation of the Health Consciousness Scale among the Czech Population. Healthcare 2023, 11, 1628. [Google Scholar] [CrossRef]
- Cain, M.K.; Zhang, Z.; Yuan, K.H. Univariate and multivariate skewness and kurtosis for measuring nonnormality: Prevalence, influence and estimation. Behav. Res. Methods 2017, 49, 1716–1735. [Google Scholar] [CrossRef]
- Byrne, B.M.; Campbell, T.L. Cross-cultural comparisons and the presumption of equivalent measurement and theoretical structure: A look beneath the surface. J. Cross-Cult. Psychol. 1999, 30, 555–574. [Google Scholar] [CrossRef]
- Pett, M.A.; Lackey, N.R.; Sullivan, J.J. Making Sense of Factor Analysis; SAGE Publications, Inc.: Thousand Oaks, CA, USA, 2003. [Google Scholar] [CrossRef]
- Hogarty, K.Y.; Hines, C.V.; Kromrey, J.D.; Ferron, J.M.; Mumford, K.R. The Quality of Factor Solutions in Exploratory Factor Analysis: The Influence of Sample Size, Communality, and Overdetermination. Educ. Psychol. Meas. 2005, 65, 202–226. [Google Scholar] [CrossRef]
- Taherdoost, H. Validity and reliability of the research instrument; How to Test the Validation of a Questionnaire/Survey in a Research. Int. J. Acad. Res. Manag. 2016, 5, 28–36. [Google Scholar] [CrossRef]
- Pituch, K.A.; Stevens, J.P. Applied Multivariate Statistics for the Social Sciences Analyses with SAS and IBM’s SPSS, 6th ed.; Routledge Taylor & Frances Group: New York, NY, USA, 2016. [Google Scholar]
- Nunnally, J.C.; Bernstein, I.H. Validity. Psychom. Theory 1994, 3, 99–132. [Google Scholar]
- Brown, T.A. Confirmatory Factor Analysis for Applied Research, 2nd ed.; The Guilford Press: New York, NY, USA, 2015. [Google Scholar]
- Hu, L.; Bentler, P.M. Fit indices in covariance structure modeling: Sensitivity to underparameterized model misspecification. Psychol. Methods 1998, 3, 424–453. [Google Scholar] [CrossRef]
- Furr, R.M. Scale Construction and Psychometrics for Social and Personality Psychology; Sage Publications: London, UK, 2011. [Google Scholar]
- Schreiber, J.B.; Nora, A.; Stage, F.K.; Barlow, E.A.; King, J. Reporting structural equation modeling and confirmatory factor analysis results: A review. J. Educ. Res. 2006, 99, 323–338. [Google Scholar] [CrossRef]
- Bardhoshi, G.; Erford, B.T. Processes and procedures for estimating score reliability and precision. Meas. Eval. Couns. Dev. 2017, 50, 256–263. [Google Scholar] [CrossRef]


| Variable | Theoretical Population * | Sample (%) | |
|---|---|---|---|
| Gender | Male | 50.0% | 50.2% |
| Female | 50.0% | 49.8% | |
| Total | 100.0% | 100.0% | |
| Age | 18–29 years | 17.1% | 16.9% |
| 30–39 years | 17.6% | 17.5% | |
| 40–49 years | 21.2% | 21.4% | |
| 50–59 years | 16.2% | 16.3% | |
| 60–79 years | 27.9% | 27.9% | |
| Total | 100.0% | 100.0% | |
| Size of place of residence | Less than 10,000 inhabitants | 46.1% | 46.4% |
| 10,000 to 19,999 inhabitants | 9.0% | 9.1% | |
| 20,000 to 49,999 inhabitants | 13.0% | 12.8% | |
| 50,000 to 99,999 inhabitants | 9.0% | 9.0% | |
| 100,000 inhabitants or more | 22.9% | 22.7% | |
| Total | 100.0% | 100.0% | |
| Variable | Definitely Agree | Agree | Disagree | Definitely Disagree | n | Mean | SD | |
|---|---|---|---|---|---|---|---|---|
| 1 | Even the bad laws must be complied with. | 21.0% | 38.9% | 26.3% | 13.8% | 692 | 2.67 | 0.959 |
| 2 | Ordinary people do not get a fair share of the national wealth. | 25.0% | 47.3% | 23.0% | 4.7% | 677 | 2.92 | 0.815 |
| 3 | There are different rules for rich and poor people. | 33.9% | 41.2% | 20.5% | 4.4% | 687 | 3.05 | 0.847 |
| 4 | I would strike for better living conditions. | 12.7% | 36.3% | 42.0% | 9.0% | 691 | 2.47 | 0.827 |
| 5 | It is important for me to participate in preserving the environment in which I live. | 21.6% | 43.8% | 26.7% | 7.9% | 700 | 2.79 | 0.869 |
| Mean | SD | Skewness | Kurtosis | ITC | FL | h2 | ||
|---|---|---|---|---|---|---|---|---|
| 1 | In general, you find society to be fair. | 2.30 | 0.795 | −0.059 | −0.644 | 0.815 | 0.875 | 0.77 |
| 2 | In general, the Czech political system operates as it should. | 2.34 | 0.785 | 0.039 | −0.470 | 0.747 | 0.830 | 0.69 |
| 3 | Czech society needs to be radically restructured. (R) | 2.74 | 0.848 | −0.120 | −0.677 | 0.597 | 0.795 | 0.63 |
| 4 | Czechia is the best country in the world to live in. | 2.25 | 0.851 | 0.210 | −0.596 | 0.574 | 0.758 | 0.57 |
| 5 | Most policies serve the greater good. | 2.23 | 0.802 | 0.067 | −0.637 | 0.714 | 0.677 | 0.46 |
| 6 | Everyone has a fair chance at wealth. | 2.22 | 0.775 | 0.006 | −0.641 | 0.574 | 0.674 | 0.45 |
| 7 | Our society is getting worse every year. (R) | 2.78 | 0.818 | −0.208 | −0.502 | 0.553 | −0.646 | 0.42 |
| 8 | Society is set up so that people usually get what they deserve. | 2.27 | 0.800 | 0.052 | −0.574 | 0.668 | −0.601 | 0.43 |
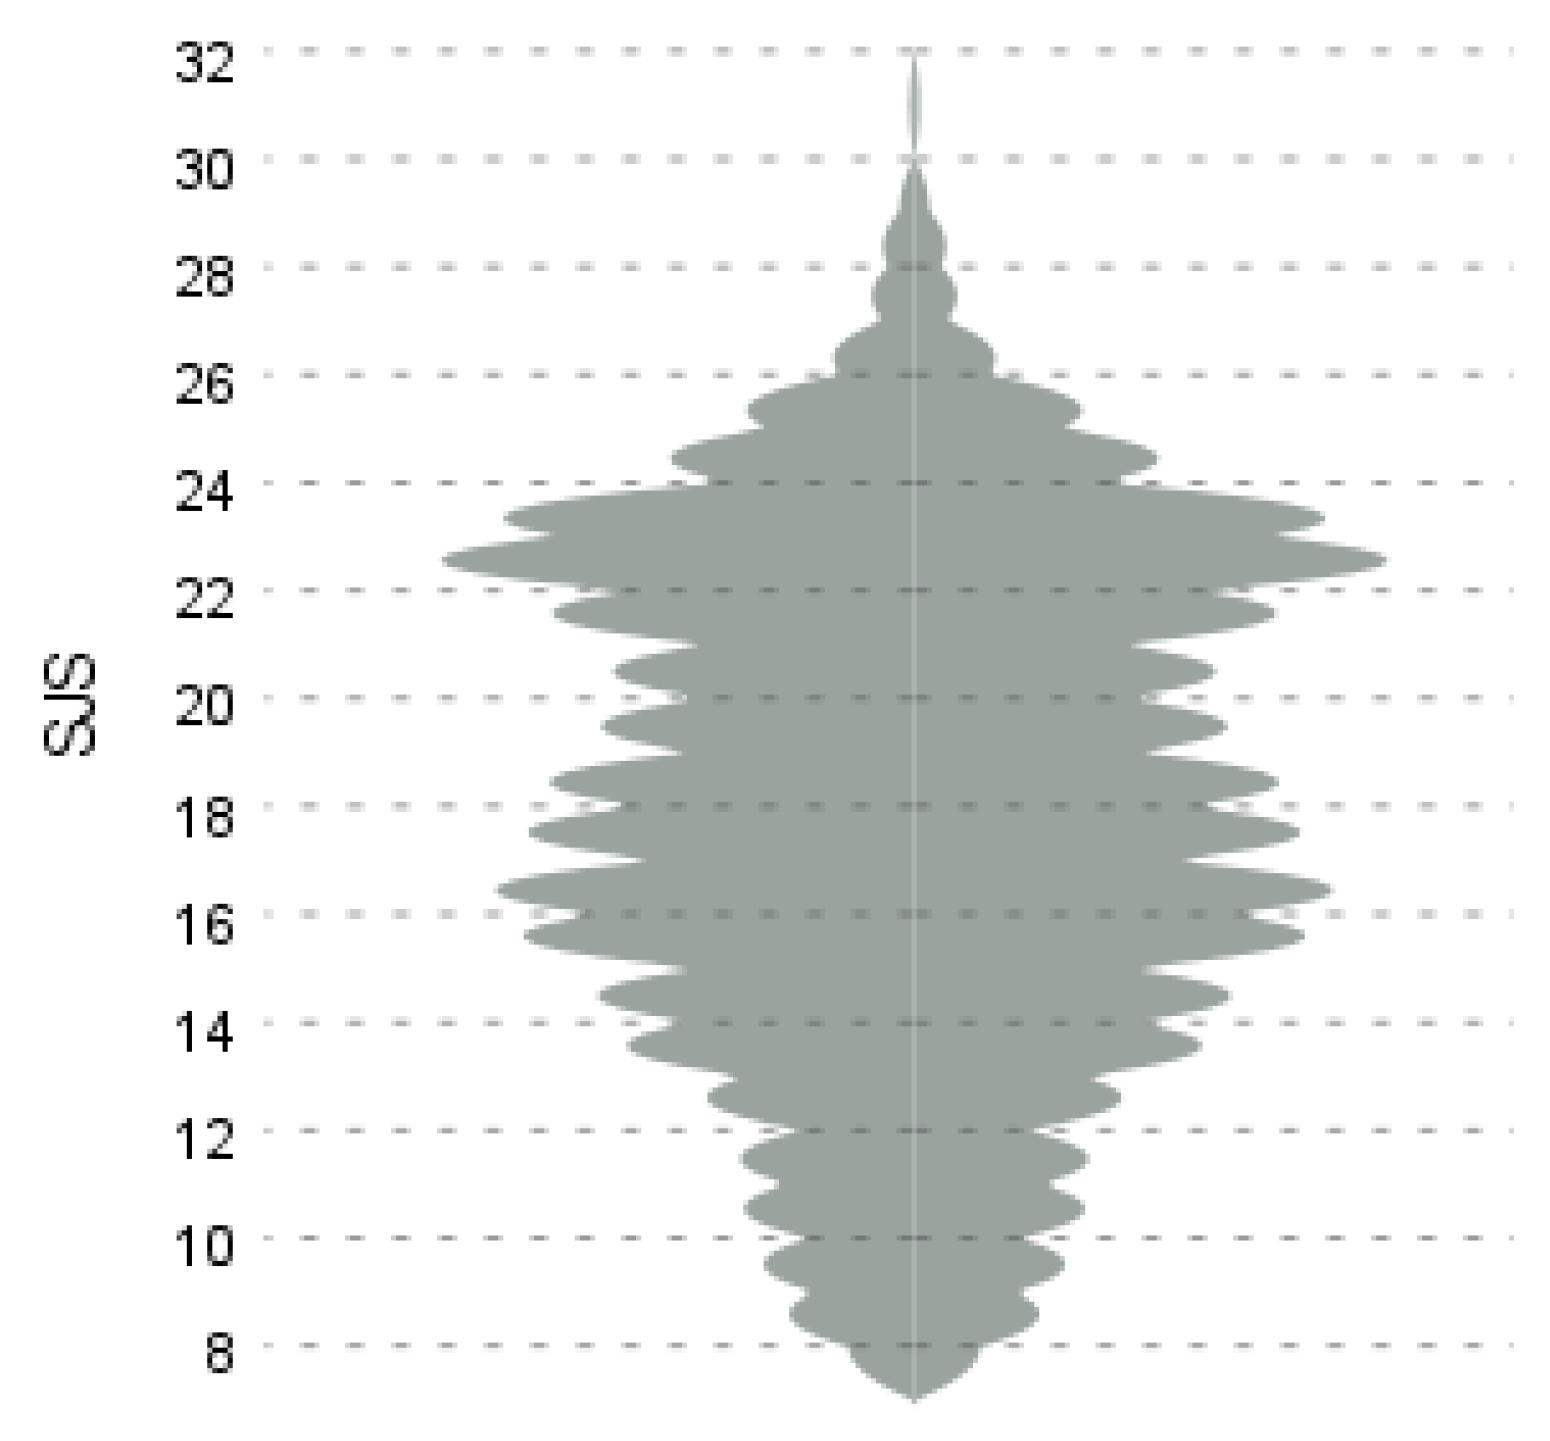
| The whole SJS scale | 18.13 | 4.815 | −0.142 | −0.740 | ||||
| Indices | Critical Values | Original Model | Improved Model |
|---|---|---|---|
| RMSEA (Root Mean Square Error of Approximation) | <0.080 | 0.089 | 0.041 |
| SRMR (Standardized Root Mean Square Residual) | <1.0000 | 0.0434 | 0.0206 |
| GFI (Goodness-of-Fit Index) | >0.9 | 0.949 | 0.989 |
| CFI (Comparative Fit Index) | >0.9 | 0.958 | 0.994 |
| TLI (Tucker–Lewis Index) | >0.9 | 0.941 | 0.988 |
| NFI (Normed Fit Index) | >0.9 | 0.951 | 0.989 |
| Item | 1 | 2 | 3 | 4 | 5 | 6 | 7 | 8 | |
|---|---|---|---|---|---|---|---|---|---|
| 1 | In general, you find society to be fair. | 1.000 | |||||||
| 2 | In general, the Czech political system operates as it should. | 0.722 ** | 1.000 | ||||||
| 3 | Czech society needs to be radically restructured. (R) | –0.504 ** | –0.455 ** | 1.000 | |||||
| 4 | Czechia is the best country in the world to live in. | 0.472 ** | 0.404 ** | –0.281 ** | 1.000 | ||||
| 5 | Most policies serve the greater good. | 0.594 ** | 0.554 ** | –0.414 ** | 0.457 ** | 1.000 | |||
| 6 | Everyone has a fair chance at wealth. | 0.463 ** | 0.437 ** | –0.229 ** | 0.401 ** | 0.472 ** | 1.000 | ||
| 7 | Our society is getting worse every year. (R) | –0.429 ** | –0.376 ** | 0.443 ** | –0.187 ** | –0.357 ** | –0.230 ** | 1.000 | |
| 8 | Society is set up so that people usually get what they deserve. | 0.558 ** | 0.559 ** | –0.293 ** | 0.410 ** | 0.479 ** | 0.465 ** | –0.303 ** | 1.000 |
| Items | n | % | SJS Mean Score | SJS Score SD | F | df | p-Value * | |
|---|---|---|---|---|---|---|---|---|
| Even the bad laws must be complied with. | definitely agree | 145 | 21.0% | 18.73 | 5.120 | 7.463 | 3 | 0.000 |
| agree | 269 | 38.9% | 18.61 | 4.752 | ||||
| disagree | 182 | 26.3% | 18.00 | 4.093 | ||||
| definitely disagree | 96 | 13.8% | 16.13 | 5.208 | ||||
| Ordinary people do not get a fair share of the national wealth. | definitely agree | 169 | 25.0% | 16.31 | 5.226 | 11.964 | 3 | 0.000 |
| agree | 320 | 47.3% | 18.42 | 4.648 | ||||
| disagree | 156 | 23.0% | 19.12 | 4.054 | ||||
| definitely disagree | 32 | 4.7% | 19.47 | 5.224 | ||||
| There are different rules for rich and poor people. | definitely agree | 233 | 33.9% | 16.38 | 5.059 | 18.451 | 3 | 0.000 |
| agree | 283 | 41.2% | 18.69 | 4.436 | ||||
| disagree | 141 | 20.5% | 19.27 | 3.923 | ||||
| definitely disagree | 30 | 4.4% | 19.78 | 5.971 | ||||
| I would strike for better living conditions. | definitely agree | 88 | 12.7% | 16.53 | 5.513 | 13.026 | 3 | 0.000 |
| agree | 251 | 36.3% | 17.83 | 4.558 | ||||
| disagree | 290 | 42.0% | 18.27 | 4.472 | ||||
| definitely disagree | 62 | 9.0% | 21.26 | 4.925 | ||||
| It is important for me to participate in preserving the environment in which I live. | definitely agree | 151 | 21.6% | 18.97 | 5.303 | 4.849 | 3 | 0.002 |
| agree | 307 | 43.8% | 18.35 | 4.585 | ||||
| disagree | 187 | 26.7% | 17.64 | 4.372 | ||||
| definitely disagree | 55 | 7.9% | 16.40 | 5.459 | ||||
Disclaimer/Publisher’s Note: The statements, opinions and data contained in all publications are solely those of the individual author(s) and contributor(s) and not of MDPI and/or the editor(s). MDPI and/or the editor(s) disclaim responsibility for any injury to people or property resulting from any ideas, methods, instructions or products referred to in the content. |
© 2023 by the author. Licensee MDPI, Basel, Switzerland. This article is an open access article distributed under the terms and conditions of the Creative Commons Attribution (CC BY) license (https://creativecommons.org/licenses/by/4.0/).
Share and Cite
Remr, J. Assessing System Justification in Czech Population Using the System Justification Scale. Eur. J. Investig. Health Psychol. Educ. 2023, 13, 1801-1814. https://doi.org/10.3390/ejihpe13090131
Remr J. Assessing System Justification in Czech Population Using the System Justification Scale. European Journal of Investigation in Health, Psychology and Education. 2023; 13(9):1801-1814. https://doi.org/10.3390/ejihpe13090131
Chicago/Turabian StyleRemr, Jiri. 2023. "Assessing System Justification in Czech Population Using the System Justification Scale" European Journal of Investigation in Health, Psychology and Education 13, no. 9: 1801-1814. https://doi.org/10.3390/ejihpe13090131
APA StyleRemr, J. (2023). Assessing System Justification in Czech Population Using the System Justification Scale. European Journal of Investigation in Health, Psychology and Education, 13(9), 1801-1814. https://doi.org/10.3390/ejihpe13090131