

Nutritional Status of Slovene Adults in the Post-COVID-19 Epidemic Period


Abstract
:1. Introduction
2. Materials and Methods
2.1. Study Design and Eligibility
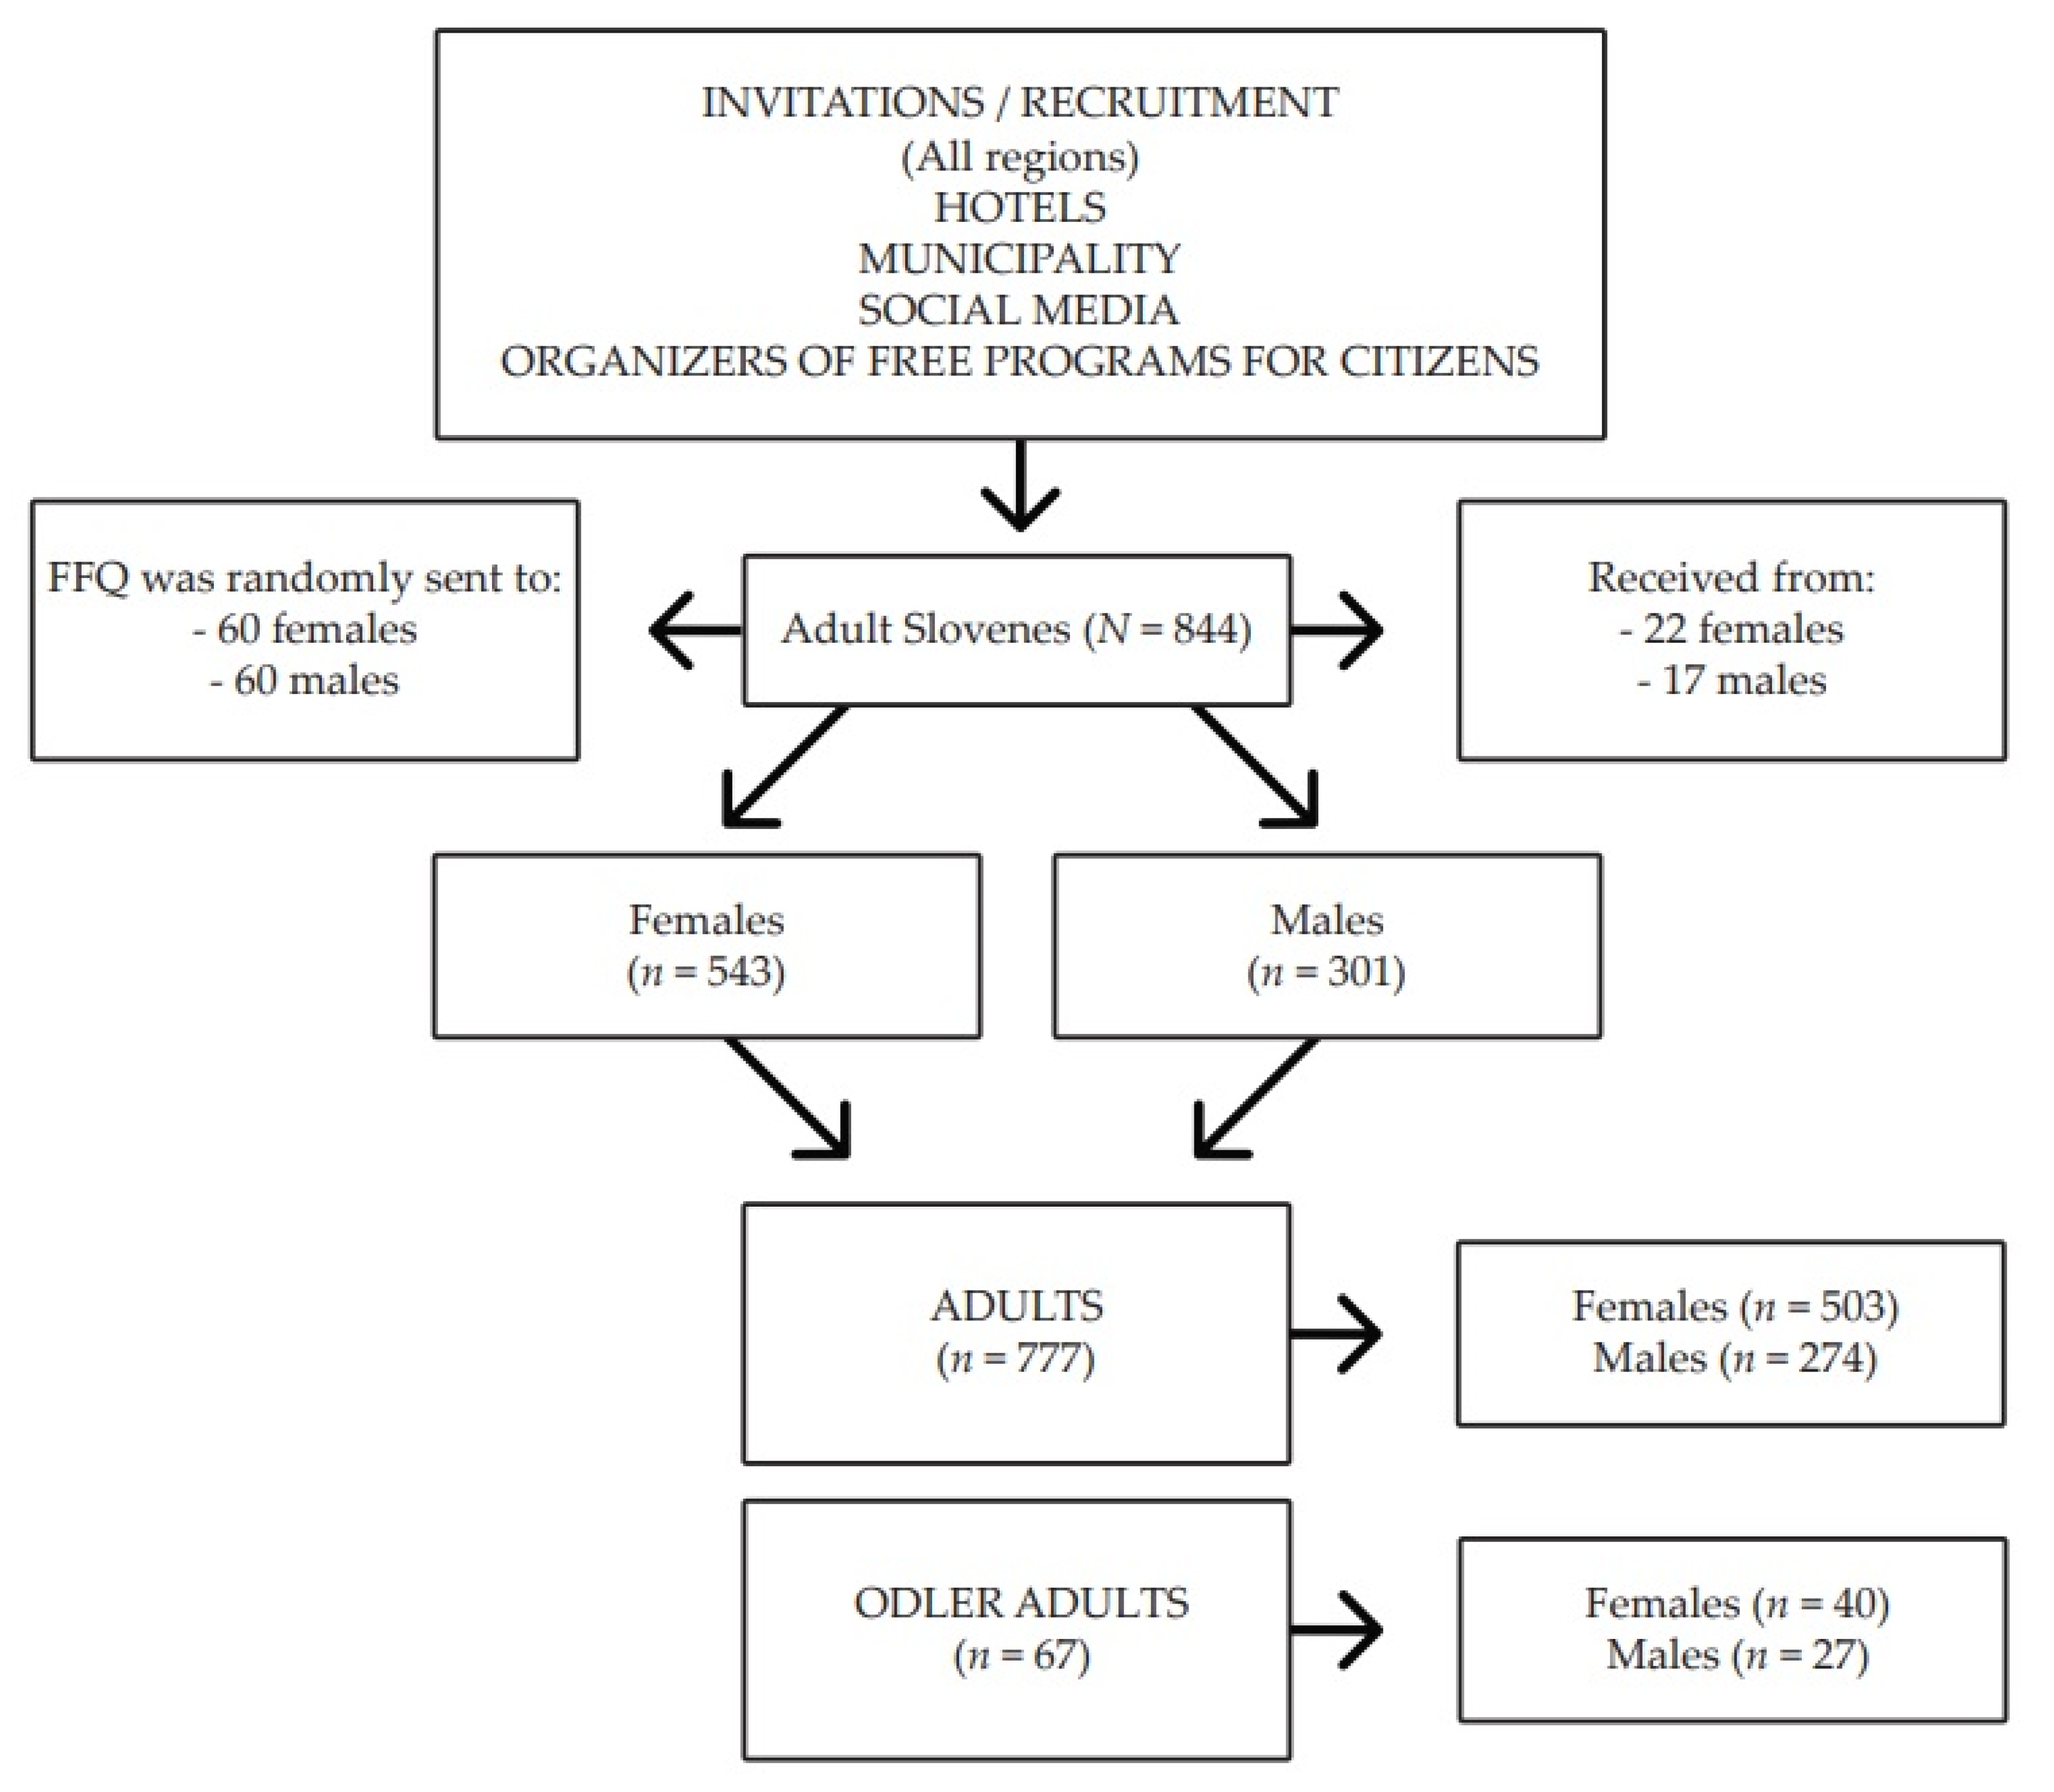
2.2. Subjects
2.3. Outcomes
2.3.1. Body Composition Measures
2.3.2. Dietary Intake
2.4. Statistical Analysis
3. Results
3.1. Characteristics of the Participants
3.2. Body Composition Status
3.3. Dietary Intake Status
4. Discussion
4.1. Main Findings
4.2. Body Composition Status
4.3. Dietary Intake Status
5. Strengths and Limitations
6. Conclusions
Author Contributions
Funding
Institutional Review Board Statement
Informed Consent Statement
Data Availability Statement
Acknowledgments
Conflicts of Interest
References
- Bentham, J.; di Cesare, M.; Bilano, V.; Bixby, H.; Zhou, B.; Stevens, G.A.; Riley, L.M.; Taddei, C.; Hajifathalian, K.; Lu, Y.; et al. Worldwide trends in body-mass index, underweight, overweight, and obesity from 1975 to 2016: A pooled analysis of 2416 population-based measurement studies in 128·9 million children, adolescents, and adults. Lancet 2017, 390, 2627–2642. [Google Scholar]
- Finucane, M.M.; Stevens, G.A.; Cowan, M.J.; Danaei, G.; Lin, J.K.; Paciorek, C.J.; Singh, G.M.; Gutierrez, H.R.; Lu, Y.; Bahalim, A.N.; et al. National, regional, and global trends in body-mass index since 1980: Systematic analysis of health examination surveys and epidemiological studies with 960 country-years and 9·1 million participants. Lancet 2011, 377, 557–567. [Google Scholar] [CrossRef] [PubMed] [Green Version]
- Boutari, C.; Mantzoros, C.S. A 2022 update on the epidemiology of obesity and a call to action: As its twin COVID-19 pandemic appears to be receding, the obesity and dysmetabolism pandemic continues to rage on. Metabolism 2022, 133, 155217. [Google Scholar] [CrossRef] [PubMed]
- Vera Anekwe, C.; Jarrell, A.R.; Townsend, M.J.; Gaudier, G.I.; Hiserodt, J.M.; Cody Stanford, F. Socioeconomics of Obesity HHS Public Access. Curr. Obes. Rep. 2020, 9, 272–279. [Google Scholar] [CrossRef]
- Marques, A.; Peralta, M.; Naia, A.; Loureiro, N.; de Matos, M.G. Prevalence of adult overweight and obesity in 20 European countries, 2014. Eur. J. Public Health 2018, 28, 295–300. [Google Scholar] [CrossRef] [Green Version]
- Pineda, E.; Sanchez-Romero, L.M.; Brown, M.; Jaccard, A.; Jewell, J.; Galea, G.; Webber, L.; Breda, J. Forecasting Future Trends in Obesity across Europe: The Value of Improving Surveillance. Obes. Facts 2018, 11, 360–371. [Google Scholar] [CrossRef]
- Kivimäki, M.; Strandberg, T.; Pentti, J.; Nyberg, S.T.; Frank, P.; Jokela, M.; Ervasti, J.; Suominen, S.B.; Vahtera, J.; Sipilä, P.N.; et al. Body-mass index and risk of obesity-related complex multimorbidity: An observational multicohort study. Lancet Diabetes Endocrinol. 2022, 10, 253–263. [Google Scholar] [CrossRef]
- Leyden, E.; Hanson, P.; Halder, L.; Rout, L.; Cherry, I.; Shuttlewood, E.; Poole, D.; Loveder, M.; Abraham, J.; Kyrou, I.; et al. Older age does not influence the success of weight loss through the implementation of lifestyle modification. Clin. Endocrinol. 2020, 94, 204–209. [Google Scholar] [CrossRef]
- Johnson, A.A.; English, B.W.; Shokhirev, M.N.; Sinclair, D.A.; Cuellar, T.L. Human age reversal: Fact or fiction? Aging Cell 2022, 21, e13664. [Google Scholar] [CrossRef]
- Chrysant, S.G.; Chrysant, G.S. The single use of body mass index for the obesity paradox is misleading and should be used in conjunction with other obesity indices. Postgrad. Med. 2019, 131, 96–102. [Google Scholar] [CrossRef]
- Chooi, Y.C.; Ding, C.; Magkos, F. The epidemiology of obesity. Metabolism 2019, 92, 6–10. [Google Scholar] [CrossRef] [PubMed]
- Hribar, M.; Hristov, H.; Lavriša, Ž.; Seljak, B.K.; Gregorič, M.; Blaznik, U.; Žmitek, K.; Pravst, I. Vitamin D Intake in Slovenian Adolescents, Adults, and the Elderly Population. Nutrients 2021, 13, 3528. [Google Scholar] [CrossRef] [PubMed]
- Marija, S.; Dragan, V.; Svetlana, R.; Nela, D. Socioeconomic inequalities in overweight and obesity in Serbia: Data from 2013 national health survey. Front. Pharmacol. 2018, 8, 967. [Google Scholar] [CrossRef] [PubMed] [Green Version]
- Jakše, B.; Jakše, B.; Pinter, S.; Pajek, J.; Fidler Mis, N. Whole-Food Plant-Based Lifestyle Program and Decreased Obesity. Am. J. Lifestyle Med. 2022, 16, 260–270. [Google Scholar] [CrossRef] [PubMed]
- Ghesmaty Sangachin, M.; Cavuoto, L.A.; Wang, Y. Use of various obesity measurement and classification methods in occupational safety and health research: A systematic review of the literature. BMC Obes. 2018, 5, 28. [Google Scholar] [CrossRef] [PubMed]
- Statistical Office of the Republic of Slovenia. Slovene Statistical Regions and Municipalities in Numbers; Statistical Office of the Republic of Slovenia: Ljubljana, Slovenia, 2020; Available online: https://www.stat.si/obcine/sl (accessed on 15 August 2022).
- WHO. Body Mass Index—BMI. World Health Organization, Copenhagen, Denmark, 2010. Available online: http://www.euro.who.int/en/health-topics/disease-prevention/nutrition/a-healthy-lifestyle/body-mass-index-bmi (accessed on 30 September 2019).
- WHO Physical Status: The Use and Intepretation of Anthropometry. Report of a WHO Expert Committee. World Health Organization, Geneva, Italy, 1995. Available online: https://www.who.int/childgrowth/publications/physical_status/en/ (accessed on 30 September 2019).
- De Keyzer, W.; Dekkers, A.; van Vlaslaer, V.; Ottevaere, C.; van Oyen, H.; de Henauw, S.; Huybrechts, I. Relative validity of a short qualitative food frequency questionnaire for use in food consumption surveys. Eur. J. Public Health 2013, 23, 737–742. [Google Scholar] [CrossRef] [PubMed] [Green Version]
- Clarys, P.; Deliens, T.; Huybrechts, I.; Deriemaeker, P.; Vanaelst, B.; de Keyzer, W.; Hebbelinck, M.; Mullie, P. Comparison of nutritional quality of the vegan, vegetarian, semi-vegetarian, pesco-vegetarian and omnivorous diet. Nutrients 2014, 6, 1318–1332. [Google Scholar] [CrossRef]
- Jakše, B.; Jakše, B.; Godnov, U.; Pinter, S. Nutritional, Cardiovascular Health and Lifestyle Status of ‘Health Conscious’ Adult Vegans and Non-Vegans from Slovenia: A Cross-Sectional Self-Reported Survey. Int. J. Environ. Res. Public Health 2021, 18, 5968. [Google Scholar] [CrossRef]
- Jakše, B.; Jakše, B.; Fidler Mis, N.; Jug, B.; Šajber, D.; Godnov, U.; Čuk, I. Nutritional Status and Cardiovascular Health in Female Adolescent Elite-Level Artistic Gymnasts and Swimmers: A Cross-Sectional Study of 31 Athletes. J. Nutr. Metab. 2021, 2021, 8810548. [Google Scholar] [CrossRef]
- Jakše, B.; Lipošek, S.; Zenić, N.; Šajber, D. Olympic Cycle Comparison of the Nutritional and Cardiovascular Health Status of an Elite-Level Female Swimmer: Case Study Report from Slovenia. Sports 2022, 10, 63. [Google Scholar] [CrossRef]
- OPKP Computer Web-Based Software: The Open Platform for Clinical Nutrition (OPEN); Institute Jožef Stefan, Ljubljana, Slovenia. Available online: http://www.opkp.si/sl_SI/fooddiary/diary (accessed on 28 September 2019).
- Korošec, M.; Golob, T.; Bertoncelj, J.; Stibilj, V.; Seljak, B.K. The Slovenian food composition database. Food Chem. 2013, 140, 495–499. [Google Scholar] [CrossRef] [PubMed]
- National Institute of Public Health of Slovenia. Reference Values for Energy Intake and Nutrient Intake; National Institute of Public Health of Slovenia: Ljubljana, Slovenia, 2020; Available online: https://www.nijz.si/sites/www.nijz.si/files/uploaded/referencne_vrednosti_2020_3_2.pdf (accessed on 15 July 2022).
- German Nutrition Society; Austrian Nutrition Society; Swiss Society of Nutrition Research. Ergaenzlieferung D-A-CH Referenzwerte für Die Nährstoffzufuhr (Reference Values for Nutrient Intake), 4th ed.; The German Nutrition Society (DGE): Bonn, Germany, 2018; Available online: https://www.dge-medienservice.de/d-a-ch-referenzwerte-fur-die-nahrstoffzufuhr.html (accessed on 21 October 2019).
- Jungert, A.; Ellinger, S.; Watzl, B.; Richter, M. Revised D-A-CH reference values for the intake of biotin. Eur. J. Nutr. 2022, 61, 1779–1787. [Google Scholar] [CrossRef] [PubMed]
- Scientific Advisory Committee on Nutrition. Carbohydrates and Health; The Stationery Office: London, UK, 2015. Available online: https://assets.publishing.service.gov.uk/government/uploads/system/uploads/attachment_data/file/445503/SACN_Carbohydrates_and_Health.pdf (accessed on 21 October 2019).
- Wickham, H.; Averick, M.; Bryan, J.; Chang, W.; McGowan, L.; Mcgowan, A.; François, R.; Grolemund, G.; Hayes, A.; Henry, L.; et al. Welcome to the Tidyverse. J. Open Source Softw. 2019, 4, 1686. [Google Scholar] [CrossRef] [Green Version]
- Patil, I. Visualizations with statistical details: The “ggstatsplot” approach. J. Open Source Softw. 2021, 6, 3167. [Google Scholar] [CrossRef]
- Heinzen, E.; Sinnwell, J.; Atkinson, E.; Gunderson, T.; Dougherty, G.; Votruba, P.; Lennon, R.; Lundt, E.; Broderick, B.; McCullough, M. An Arsenal of “R” Functions for Large-Scale Statistical Summaries [R package arsenal version 3.6.3]; Comprehensive R Archive Network (CRAN), 2021. Available online: https://cran.r-project.org/package=arsenal (accessed on 28 September 2022).
- Food and Agriculture Organization of the United Nations. Food Energy—Methods of Analysis and Conversion Factors; Food and Agriculture Organization of the United Nations: Rome, Italy, 2003; Available online: https://www.fao.org/uploads/media/FAO_2003_Food_Energy_02.pdf (accessed on 15 September 2022).
- World Health Organization. Guideline: Sugars Intake for Adults and Children; WHO: Geneva, Italy, 2015; Available online: https://www.who.int/publications/i/item/9789241549028 (accessed on 28 September 2021).
- Sedej, K.; Lusa, L.; Battelino, T.; Kotnik, P. Stabilization of Overweight and Obesity in Slovenian Adolescents and Increased Risk in Those Entering Non-Grammar Secondary Schools. Obes. Facts 2016, 9, 241–250. [Google Scholar] [CrossRef]
- Gregorič, M.; Blaznik, U.; Turk, V.F.; Delfar, N.; Korošec, A.; Lavtar, D.; Zaletel, M.; Seljak, B.K.; Golja, P.; Kotnik, K.Z.; et al. Različni Vidiki Prehranjevanja Prebivalcev Slovenije (v Starosti od 3 Mesecev do 74 let); National Institute of Public Health: Ljubljana, Slovenia, 2020; ISBN 978-961-6945-03-5. [Google Scholar]
- Li, Z.; Heber, D. Sarcopenic obesity in the elderly and strategies for weight management. Nutr. Rev. 2012, 70, 57–64. [Google Scholar] [CrossRef]
- Nuttall, F.Q. Body Mass Index. Nutr. Today 2015, 50, 117–128. [Google Scholar] [CrossRef] [Green Version]
- Roh, E.; Choi, K.M. Health Consequences of Sarcopenic Obesity: A Narrative Review. Front. Endocrinol. 2020, 11, 332. [Google Scholar] [CrossRef]
- Polyzos, S.A.; Margioris, A.N. Sarcopenic obesity. Hormones 2018, 17, 321–331. [Google Scholar] [CrossRef]
- Sedlmeier, A.M.; Baumeister, S.E.; Weber, A.; Fischer, B.; Thorand, B.; Ittermann, T.; Dörr, M.; Felix, S.B.; Völzke, H.; Peters, A.; et al. Relation of body fat mass and fat-free mass to total mortality: Results from 7 prospective cohort studies. Am. J. Clin. Nutr. 2021, 113, 639–646. [Google Scholar] [CrossRef]
- Okorodudu, D.O.; Jumean, M.F.; Montori, V.M.; Romero-Corral, A.; Somers, V.K.; Erwin, P.J.; Lopez-Jimenez, F. Diagnostic performance of body mass index to identify obesity as defined by body adiposity: A systematic review and meta-analysis. Int. J. Obes. 2010, 34, 791–799. [Google Scholar] [CrossRef] [PubMed]
- Statistical Office of the Republic of Slovenia. Supply Balance Sheets of Agricultural Products; Statistical Office of the Republic of Slovenia: Ljubljana, Slovenia, 2020. Available online: https://www.stat.si/StatWeb/en/News/Index/9954 (accessed on 10 October 2022).
- Willett, W.; Rockström, J.; Loken, B.; Springmann, M.; Lang, T.; Vermeulen, S.; Garnett, T.; Tilman, D.; Declerck, F. The Lancet Commissions Food in the Anthropocene: The EAT—Lancet Commission on healthy diets from sustainable food systems. Lancet 2019, 393, 447–492. [Google Scholar] [CrossRef] [PubMed]
- Lavriša, Ž.; Hristov, H.; Hribar, M.; Žmitek, K.; Kušar, A.; Koroušić Seljak, B.; Gregorič, M.; Blaznik, U.; Gregorič, N.; Zaletel, K.; et al. Dietary Intake and Status of Vitamin B12 in Slovenian Population. Nutrients 2022, 14, 334. [Google Scholar] [CrossRef]
- Pravst, I.; Lavriša, Ž.; Hribar, M.; Hristov, H.; Kvarantan, N.; Seljak, B.K.; Gregorič, M.; Blaznik, U.; Gregorič, N.; Zaletel, K.; et al. Dietary Intake of Folate and Assessment of the Folate Deficiency Prevalence in Slovenia Using Serum Biomarkers. Nutrients 2021, 13, 3860. [Google Scholar] [CrossRef]
- Seljak, B.K.; Valenčič, E.; Hristov, H.; Hribar, M.; Lavriša, Ž.; Kušar, A.; Žmitek, K.; Krušič, S.; Gregorič, M.; Blaznik, U.; et al. Inadequate Intake of Dietary Fibre in Adolescents, Adults, and Elderlies: Results of Slovenian Representative SI. Menu Study. Nutrients 2021, 13, 3826. [Google Scholar] [CrossRef]
- Zupanič, N.; Hristov, H.; Gregorič, M.; Blaznik, U.; Delfar, N.; Seljak, B.K.; Ding, E.L.; Mis, N.F.; Pravst, I. Total and Free Sugars Consumption in a Slovenian Population Representative Sample. Nutrients 2020, 12, 1729. [Google Scholar] [CrossRef] [PubMed]
- Mis, N.F.; Kobe, H.; Štimec, M. Dietary intake of macro-and micronutrients in Slovenian adolescents: Comparison with reference values. Ann. Nutr. Metab. 2012, 61, 305–313. [Google Scholar]
- Ge, L.; Sadeghirad, B.; Ball, G.D.C.; da Costa, B.R.; Hitchcock, C.L.; Svendrovski, A.; Kiflen, R.; Quadri, K.; Kwon, H.Y.; Karamouzian, M.; et al. Comparison of dietary macronutrient patterns of 14 popular named dietary programmes for weight and cardiovascular risk factor reduction in adults: Systematic review and network meta-analysis of randomised trials. BMJ 2020, 369, m696. [Google Scholar] [CrossRef] [Green Version]
- Noto, H.; Goto, A.; Tsujimoto, T.; Noda, M. Low-Carbohydrate Diets and All-Cause Mortality: A Systematic Review and Meta-Analysis of Observational Studies. PLoS ONE 2013, 8, e55030. [Google Scholar] [CrossRef] [Green Version]
- Volek, J.S.; Phinney, S.D.; Krauss, R.M.; Johnson, R.J.; Saslow, L.R.; Gower, B.; Yancy, W.S.; King, J.C.; Hecht, F.M.; Teicholz, N.; et al. Alternative Dietary Patterns for Americans: Low-Carbohydrate Diets. Nutrients 2021, 13, 3299. [Google Scholar] [CrossRef]
- Crosby, L.; Davis, B.; Joshi, S.; Jardine, M.; Paul, J.; Neola, M.; Barnard, N.D. Ketogenic Diets and Chronic Disease: Weighing the Benefits Against the Risks. Front. Nutr. 2021, 8, 702802. [Google Scholar] [CrossRef] [PubMed]
- Li, Z.; Heber, D. Ketogenic Diets. JAMA 2020, 323, 386. [Google Scholar] [CrossRef] [PubMed] [Green Version]
- Ghaedi, E.; Mohammadi, M.; Mohammadi, H.; Ramezani-Jolfaie, N.; Malekzadeh, J.; Hosseinzadeh, M.; Salehi-Abargouei, A. Effects of a Paleolithic Diet on Cardiovascular Disease Risk Factors: A Systematic Review and Meta-Analysis of Randomized Controlled Trials. Adv. Nutr. 2019, 10, 634–646. [Google Scholar] [CrossRef] [PubMed]
- Jenkins, D.J.A.; Jones, P.J.H.; Abdullah, M.M.H.; Lamarche, B.; Faulkner, D.; Patel, D.; Sahye-Pudaruth, S.; Paquette, M.; Bashyam, B.; Pichika, S.C.; et al. Low-carbohydrate vegan diets in diabetes for weight loss and sustainability: A randomized controlled trial. Am. J. Clin. Nutr. 2022, 116, 1240–1250. [Google Scholar] [CrossRef]
- Barnard, N.D.; Alwarith, J.; Rembert, E.; Brandon, L.; Nguyen, M.; Goergen, A.; Horne, T.; do Nascimento, G.F.; Lakkadi, K.; Tura, A.; et al. A Mediterranean Diet and Low-Fat Vegan Diet to Improve Body Weight and Cardiometabolic Risk Factors: A Randomized, Cross-over Trial. J. Am. Coll. Nutr. 2021, 41, 127–139. [Google Scholar] [CrossRef]
- Grosso, G.; Marventano, S.; Yang, J.; Micek, A.; Pajak, A.; Scalfi, L.; Galvano, F.; Kales, S.N. A comprehensive meta-analysis on evidence of Mediterranean diet and cardiovascular disease: Are individual components equal? Crit. Rev. Food Sci. Nutr. 2017, 57, 3218–3232. [Google Scholar] [CrossRef] [PubMed]
- Barnard, N.D.; Levin, S.M.; Yokoyama, Y. A Systematic Review and Meta-Analysis of Changes in Body Weight in Clinical Trials of Vegetarian Diets. J. Acad. Nutr. Diet. 2015, 115, 954–969. [Google Scholar] [CrossRef]
- Kahleova, H.; Levin, S.; Barnard, N.D. Vegetarian Dietary Patterns and Cardiovascular Disease. Prog. Cardiovasc. Dis. 2018, 61, 54–61. [Google Scholar] [CrossRef]
- Oussalah, A.; Levy, J.; Berthezène, C.; Alpers, D.H.; Guéant, J.L. Health outcomes associated with vegetarian diets: An umbrella review of systematic reviews and meta-analyses. Clin. Nutr. 2020, 39, 3283–3307. [Google Scholar] [CrossRef]
- Schick, A.; Boring, J.; Courville, A.; Gallagher, I.; Guo, J.; Howard, R.; Milley, L.; Raisinger, K.; Rozga, I.; Stagliano, M.; et al. Effects of Ad Libitum Low Carbohydrate Versus Low Fat Diets on Body Weight and Fat Mass. Curr. Dev. Nutr. 2020, 4, 658-658. [Google Scholar] [CrossRef]
- Jakše, B. Placing a Well-Designed Vegan Diet for Slovenes. Nutrients 2021, 13, 4545. [Google Scholar] [PubMed]
- Tran, E.; Dale, H.F.; Jensen, C.; Lied, G.A. Effects of Plant-Based Diets on Weight Status: A Systematic Review. Diabetes, Metab. Syndr. Obes. Targets Ther. 2020, 13, 3433–3448. [Google Scholar] [CrossRef] [PubMed]
- Mishra, S.; Xu, J.; Agarwal, U.; Gonzales, J.; Levin, S.; Barnard, N.D. A multicenter randomized controlled trial of a plant-based nutrition program to reduce body weight and cardiovascular risk in the corporate setting: The GEICO study. Eur. J. Clin. Nutr. 2013, 67, 718–724. [Google Scholar] [CrossRef] [Green Version]
- Turner-McGrievy, G.M.; Davidson, C.R.; Wingard, E.E.; Wilcox, S.; Frongillo, E.A. Comparative effectiveness of plant-based diets for weight loss: A randomized controlled trial of five different diets. Nutrition 2015, 31, 350–358. [Google Scholar] [CrossRef]
- WHO European Office for the Prevention and Control of Noncommunicable Diseases. Plant-Based Diets and Their Impact on Health, Sustainability and the Environment: A Review of the Evidence; World Health Organization: Copenhagen, Denmark, 2021; Available online: https://apps.who.int/iris/handle/10665/349086 (accessed on 6 March 2022).
- Jardine, M.A.; Kahleova, H.; Levin, S.M.; Ali, Z.; Trapp, C.B.; Barnard, N.D. Perspective: Plant-Based Eating Pattern for Type 2 Diabetes Prevention and Treatment: Efficacy, Mechanisms, and Practical Considerations. Adv. Nutr. 2021, 12, 2045–2055. [Google Scholar] [CrossRef] [PubMed]
- Calcagno, M.; Kahleova, H.; Alwarith, J.; Burgess, N.N.; Flores, R.A.; Busta, M.L.; Barnard, N.D. The Thermic Effect of Food: A Review. J. Am. Coll. Nutr. 2019, 38, 547–551. [Google Scholar] [CrossRef] [PubMed]
- Kahleova, H.; Petersen, K.F.; Shulman, G.I.; Alwarith, J.; Rembert, E.; Tura, A.; Hill, M.; Holubkov, R.; Barnard, N.D. Effect of a Low-Fat Vegan Diet on Body Weight, Insulin Sensitivity, Postprandial Metabolism, and Intramyocellular and Hepatocellular Lipid Levels in Overweight Adults. JAMA Netw. Open 2020, 3, e2025454. [Google Scholar] [CrossRef] [PubMed]
- Kahleova, H.; Rembert, E.; Alwarith, J.; Yonas, W.N.; Tura, A.; Holubkov, R.; Agnello, M.; Chutkan, R.; Barnard, N.D. Effects of a Low-Fat Vegan Diet on Gut Microbiota in Overweight Individuals and Relationships with Body Weight, Body Composition, and Insulin Sensitivity. A Randomized Clinical Trial. Nutrients 2020, 12, 2917. [Google Scholar] [CrossRef]
- Wong, M.W.; Yi, C.H.; Liu, T.T.; Lei, W.Y.; Hung, J.S.; Lin, C.L.; Lin, S.Z.; Chen, C.L. Impact of vegan diets on gut microbiota: An update on the clinical implications. Tzu-Chi Med. J. 2018, 30, 200–203. [Google Scholar]
- Glick-Bauer, M.; Yeh, M.C. The Health Advantage of a Vegan Diet: Exploring the Gut Microbiota Connection. Nutrients 2014, 6, 4822–4838. [Google Scholar] [CrossRef] [Green Version]
- Kahleova, H.; Dort, S.; Holubkov, R.; Barnard, N.D. A Plant-Based High-Carbohydrate, Low-Fat Diet in Overweight Individuals in a 16-Week Randomized Clinical Trial: The Role of Carbohydrates. Nutrients 2018, 10, 1302. [Google Scholar] [CrossRef] [PubMed] [Green Version]
- Hall, K.D.; Guo, J.; Courville, A.B.; Boring, J.; Brychta, R.; Chen, K.Y.; Darcey, V.; Forde, C.G.; Gharib, A.M.; Gallagher, I.; et al. Effect of a plant-based, low-fat diet versus an animal-based, ketogenic diet on ad libitum energy intake. Nat. Med. 2021, 27, 344–353. [Google Scholar] [CrossRef] [PubMed]
- Schmidt, C.V.; Mouritsen, O.G. The Solution to Sustainable Eating Is Not a One-Way Street. Front. Psychol. 2020, 11, 531. [Google Scholar] [CrossRef]
- Chen, C.; Chaudhary, A.; Mathys, A. Dietary Change Scenarios and Implications for Environmental, Nutrition, Human Health and Economic Dimensions of Food Sustainability. Nutrients 2019, 11, 856. [Google Scholar] [CrossRef] [PubMed] [Green Version]
- Statistical Office of the Republic of Slovenia (SiStat). Balance of Meat Production and Consumption (1000 t) According to: Production and Consumption, Meat; Statistical Office of the Republic of Slovenia: Ljubljana, Slovenia, 2021; Available online: https://pxweb.stat.si/SiStatData/pxweb/en/Data/Data/1563501S.px/ (accessed on 15 July 2022).
- Musicus, A.A.; Wang, D.D.; Janiszewski, M.; Eshel, G.; Blondin, S.A.; Willett, W.; Stampfer, M.J. Health and environmental impacts of plant-rich dietary patterns: A US prospective cohort study. Lancet Planet. Health 2022, 6, e892–e900. [Google Scholar] [CrossRef] [PubMed]
- Kim, T.J.; von dem Knesebeck, O. Income and obesity: What is the direction of the relationship? A systematic review and meta-analysis. BMJ Open 2018, 8, e019862. [Google Scholar]


| Parameter | BH (cm) | BM (kg) | BMI (kg/m2) | FAT (%) | FATM (kg) | FATM/BH (kg/cm) | FFM (%) | FFM (kg) | FFM/BH (kg/cm) | TBW (kg) | PhA (°) |
|---|---|---|---|---|---|---|---|---|---|---|---|
| Total | 170.9 ± 9.0 | 73.6 ± 17.2 | 25.1 ± 5.0 | 24.6 ± 8.3 | 18.7 ± 9.7 | 0.11 ± 0.06 | 75.4 ± 8.3 | 55.0 ± 11.6 | 0.32 ± 0.05 | 39.2 ± 8.3 | 5.9 ± 0.7 |
| Females | 166.3 ± 6.3 | 67.2 ± 13.9 | 24.3 ± 4.8 | 27.3 ± 7.6 | 19.2 ± 9.3 | 0.12 ± 0.06 | 72.7 ± 7.8 | 48.0 ± 6.1 | 0.29 ± 0.03 | 34.3 ± 4.4 | 5.6 ± 0.5 |
| Males | 179.1 ± 7.0 | 85.3 ± 16.4 | 26.6 ± 5.0 | 19.8 ± 7.1 | 17.8 ± 10.3 | 0.10 ± 0.06 | 80.1 ± 7.1 | 67.5 ± 8.2 | 0.38 ± 0.04 | 48.1 ± 6.1 | 6.4 ± 0.7 |
| p-value | <0.001 | <0.001 | <0.001 | <0.001 | 0.057 | <0.001 | <0.001 | <0.001 | <0.001 | <0.001 | <0.001 |
| Adults | 171.2 ± 8.9 | 73.4 ± 17.4 | 24.9 ± 5.0 | 24.3 ± 8.2 | 18.4 ± 9.7 | 0.11 ± 0.06 | 75.7 ± 8.2 | 55.0 ± 11.6 | 0.32 ± 0.05 | 39.3 ± 8.3 | 6.0 ± 0.7 |
| Older adults | 167.3 ± 8.5 | 76.5 ± 14.6 | 27.2 ± 4.2 | 28.7 ± 8.4 | 22.2 ± 8.2 | 0.13 ± 0.05 | 71.3 ± 8.4 | 54.3 ± 11.4 | 0.32 ± 0.72 | 38.1 ± 7.9 | 5.3 ± 0.6 |
| p-value | <0.001 | 0.162 | <0.001 | <0.001 | 0.002 | <0.001 | <0.001 | 0.631 | 0.717 | 0.252 | <0.001 |
| Adults | |||||||||||
| Females | 166.6 ± 6.2 | 67.0 ± 14.1 | 24.1 ± 4.9 | 26.9 ± 7.6 | 18.8 ± 9.3 | 0.11 ± 0.06 | 73.1 ± 7.6 | 48.2 ± 6.1 | 0.29 ± 0.03 | 34.5 ± 4.4 | 5.7 ± 0.5 |
| Males | 179.5 ± 7.1 | 85.1 ± 16.8 | 26.4 ± 5.0 | 19.5 ± 7.0 | 17.6 ± 10.4 | 0.10 ± 0.06 | 80.5 ± 7.0 | 67.6 ± 8.4 | 0.38 ± 0.04 | 48.3 ± 6.2 | 6.6 ± 0.6 |
| p-value | <0.001 | <0.001 | <0.001 | <0.001 | 0.077 | <0.001 | <0.001 | <0.001 | <0.001 | <0.001 | <0.001 |
| Older adults | |||||||||||
| Females | 161.7 ± 5.0 | 69.1 ± 11.0 | 26.4 ± 4.2 | 32.7 ± 6.5 | 23.1 ± 7.6 | 0.14 ± 0.05 | 67.3 ± 6.5 | 45.9 ± 4.7 | 0.28 ± 0.03 | 32.4 ± 3.4 | 5.1 ± 0.5 |
| Males | 175.6 ± 5.0 | 87.4 ± 12.3 | 28.4 ± 4.1 | 22.8 ± 7.3 | 20.7 ± 8.9 | 0.12 ± 0.05 | 77.2 ± 7.4 | 66.7 ± 5.2 | 0.38 ± 0.02 | 46.6 ± 4.0 | 5.6 ± 0.7 |
| p-value | <0.001 | <0.001 | 0.063 | <0.001 | 0.261 | 0.044 | <0.001 | <0.001 | <0.001 | <0.001 | <0.001 |
| Parameter | Total | Females | Males | Adults | Females | Males | Older Adults | Females | Males | |
|---|---|---|---|---|---|---|---|---|---|---|
| According to BMI classification (n/%) | ||||||||||
| Normal (BMI 18.5–24.9 kg/m2) | 479 (57) | 345 (64) | 134 (45) | 455 (58) | 327 (65) | 128 (47) | 24 (36) | 18 (45) | 6 (22) | |
| Overweight (BMI 25–29.9 kg/m2) | 233 (28) | 127 (23) | 106 (35) | 209 (27) | 115 (23) | 94 (34) | 24 (36) | 12 (30) | 12 (44) | |
| Obesity 1 class (BMI 30–34.9 kg/m2) | 86 (10) | 40 (7) | 46 (15) | 69 (9) | 31 (6) | 38 (14) | 17 (25) | 9 (23) | 8 (30) | |
| Obesity 2 class (BMI 35–39.9 kg/m2) | 18 (2) | 10 (2) | 8 (3) | 16 (2) | 9 (2) | 7 (3) | 2 (3) | 1 (3) | 1 (4) | |
| Obesity 3 class (BMI > 40 kg/m2) | 28 (3) | 21 (4) | 7 (2) | 28 (4) | 21 (4) | 7 (3) | 0 | 0 | 0 | |
| p-value | <0.001 | |||||||||
| According to FAT% obesity classification | ||||||||||
| Female | >35% | 92 (17) | 77 (15) | 15 (38) | ||||||
| <35% | 451 (83) | 426 (85) | 25 (62) | |||||||
| Male | >25% | 75 (25) | 64 (23) | 11 (41) | ||||||
| <25% | 226 (75) | 210 (77) | 16 (59) | |||||||
| p-value | 0.005 | 0.005 | 0.789 | |||||||
| Macronutrients (per Day) | Females (n = 22) | Males (n = 17) | Total (n = 39) | p-Value |
|---|---|---|---|---|
| Energy intake (kcal) | 1950 ± 142 | 2097 ± 399 | 2014 ± 421 | 0.213 |
| Carbohydrates (g) | 216 ± 61 | 198 ± 64 | 208 ± 64 | 0.428 |
| (% E) | 44 ± 6 | 38 ± 11 | 42 ± 10 | 0.034 |
| Total sugarsTS (g) | 70 ± 57 | 56 ± 25 | 64 ± 46 | 0.702 |
| Free sugarsFS (g) | 23 ± 37 | 10 ± 11 | 17 ± 29 | 0.340 |
| (% E) | 4 ± 6 | 2 ± 2 | 3 ± 5 | 0.186 |
| Starches (g) | 60 ± 38 | 79 ± 40 | 68 ± 40 | 0.106 |
| Dietary fibers (g) | 27 ± 6 | 26 ± 7 | 26 ± 6 | 0.619 |
| (% E) | 3 ± 1 | 3 ± 1 | 3 ± 1 | 0.321 |
| Fat (g) | 79 ± 31 | 91 ± 30 | 84 ± 31 | 0.240 |
| (% E) | 36 ± 10 | 39 ± 11 | 37 ± 10 | 0.213 |
| SFAs (g) | 22 ± 13 | 25 ± 11 | 23 ± 12 | 0.161 |
| (% E) | 10 ± 4 | 11 ± 5 | 10 ± 4 | 0.336 |
| MUFAs (g) | 27 ± 15 | 27 ± 15 | 27 ± 15 | 0.898 |
| (% E) | 12 ± 6 | 12 ± 7 | 12 ± 6 | 0.488 |
| PUFAs (g) | 19 ± 6 | 18 ± 7 | 18 ± 6 | 0.436 |
| (% E) | 9 ± 3 | 8 ± 2 | 8 ± 2 | 0.157 |
| Cholesterol (mg) | 307 ± 276 | 511 ± 352 | 395 ± 323 | 0.079 |
| Proteins (g) | 80 ± 22 | 108 ± 32 | 92 ± 30 | 0.007 |
| (% E) | 17 ± 4 | 21 ± 5 | 18 ± 5 | 0.012 |
| Plant proteins (g) | 39 ± 12 | 34 ± 15 | 37 ± 13 | 0.234 |
| (% E) | 8 ± 3 | 6 ± 3 | 7 ± 3 | 0.023 |
| Animal proteins (g) | 41 ± 19 | 74 ± 35 | 55 ± 31 | 0.004 |
| (% E) | 9 ± 3 | 14 ± 6 | 11 ± 6 | 0.003 |
| Total waterTW (L) | 1.7 ± 0.5 | 2.1 ± 0.5 | 1.9 ± 0.5 | 0.013 |
| Micronutrients (per Day) | Females (n = 22) | Males (n = 17) | Total (n = 39) | p-Value |
|---|---|---|---|---|
| Vitamins | ||||
| Thiamine (mg) | 1.4 ± 0.4 | 1.7 ± 0.6 | 1.6 ± 0.5 | 0.100 |
| Riboflavin (mg) | 1.5 ± 0.6 | 2.2 ± 0.9 | 1.8 ± 0.8 | 0.008 |
| Niacin (mg) | 16 ± 5 | 25 ± 13 | 20 ± 10 | 0.005 |
| Pantothenic acid (mg) | 5.7 ± 2.2 | 7.3 ± 2.7 | 6.4 ± 2.5 | 0.041 |
| Vitamin B6 (mg) | 1.7 ± 0.6 | 1.9 ± 0.6 | 1.8 ± 0.6 | 0.371 |
| Biotin (µg) | 60 ± 31 | 78 ± 35 | 68 ± 34 | 0.081 |
| Folate (µg) | 378 ± 152 | 420 ± 176 | 396 ± 162 | 0.420 |
| Vitamin B12 (µg) | 4.0 ± 3.4 | 6.1 ± 4.2 | 4.9 ± 3.9 | 0.084 |
| Retinol equ.RE (mg) | 2.1 ± 0.4 | 2.2 ± 0.2 | 2.1 ± 0.3 | 0.103 |
| Vitamin C (mg) | 78 ± 55 | 61 ± 33 | 71 ± 47 | 0.411 |
| Vitamin D (µg) | 3.8 ± 2.8 | 5.3 ± 3.5 | 4.5 ± 3.2 | 0.145 |
| Vitamin E (mg) | 13 ± 3 | 12 ± 5 | 13 ± 6 | 0.661 |
| Vitamin K (µg) | 205 ± 139 | 158 ± 126 | 185 ± 134 | 0.077 |
| Minerals | ||||
| Calcium (mg) | 725 ± 344 | 891 ± 366 | 798 ± 359 | 0.208 |
| Magnesium (mg) | 496 ± 149 | 470 ± 140 | 485 ± 144 | 0.661 |
| Phosphorus (mg) | 1624 ± 460 | 1800 ± 415 | 1701 ± 445 | 0.213 |
| Potassium (mg) | 3513 ± 1064 | 3172 ± 866 | 3364 ± 985 | 0.343 |
| Sodium (mg) † | 1604 ± 1303 | 1755 ± 934 | 1670 ± 1145 | 0.357 |
| Chloride (mg) † | 2131 ± 951 | 2684 ± 1446 | 2372 ± 1207 | 0.208 |
| Trace elements | ||||
| Iron (mg) | 17 ± 5 | 17 ± 4 | 17 ± 4 | 0.831 |
| Zinc (mg) | 11 ± 3 | 11 ± 3 | 11 ± 4 | 0.372 |
| Selenium (µg) | 71 ± 34 | 107 ± 60 | 87 ± 50 | 0.052 |
Publisher’s Note: MDPI stays neutral with regard to jurisdictional claims in published maps and institutional affiliations. |
© 2022 by the authors. Licensee MDPI, Basel, Switzerland. This article is an open access article distributed under the terms and conditions of the Creative Commons Attribution (CC BY) license (https://creativecommons.org/licenses/by/4.0/).
Share and Cite
Jakše, B.; Godnov, U.; Pinter, S. Nutritional Status of Slovene Adults in the Post-COVID-19 Epidemic Period. Eur. J. Investig. Health Psychol. Educ. 2022, 12, 1729-1742. https://doi.org/10.3390/ejihpe12120122
Jakše B, Godnov U, Pinter S. Nutritional Status of Slovene Adults in the Post-COVID-19 Epidemic Period. European Journal of Investigation in Health, Psychology and Education. 2022; 12(12):1729-1742. https://doi.org/10.3390/ejihpe12120122
Chicago/Turabian StyleJakše, Boštjan, Uroš Godnov, and Stanislav Pinter. 2022. "Nutritional Status of Slovene Adults in the Post-COVID-19 Epidemic Period" European Journal of Investigation in Health, Psychology and Education 12, no. 12: 1729-1742. https://doi.org/10.3390/ejihpe12120122