Abstract
Background: Gram-negative bacteremia is one of the leading causes of mortality and morbidity in Indian hospitals. We hereby describe changing trends in Gram-negative isolates from blood cultures from a single center over a ten-year period. Methods: Antibiotic susceptibility patterns were collected for a total of 4128 non-repetitive blood culture isolates from 2003 to 2013. We analyzed clinically important Gram-negative isolates (Escherichia coli, Klebsiella pneumoniae, Pseudomonas aeruginosa and Acinetobacter baumannii) and their susceptibility pattern. A. baumannii was studied between 2009 and 2013 only. Results: There was a steady increase in extended-spectrum beta-lactamase (ESBL) production in E. coli (56% to 80%) and an even steeper increase in K. pneumoniae (50% to 81%). Susceptibility to carbapenems fell marginally for E. coli (p = .242) but significantly for K. pneumoniae (p = .000) and P. aeruginosa (.0005). All these changes were seen irrespective of the source of the isolate (outpatient, inpatient and critical care unit – CCU), with a statistically significant fall among CCU isolates of K. pneumoniae and P. aeruginosa. P. aeruginosa was more susceptible to carbapenems than beta-lactam/beta-lactamase inhibitors until 2009, but thereafter the pattern reversed. A. baumannii was isolated from the CCU only: 75% were resistant to carbapenems and susceptible only to polymyxin E and tigecycline. Conclusion: There was a progressive increase in antimicrobial resistance in isolates of E. coli, K. pneumoniae, P. aeruginosa and A. baumannii isolated from blood cultures. ESBL production was seen in the majority of isolates of E. coli and K. pneumoniae. Carbapenem resistance in K. pneumoniae and E. coli is increasing rapidly. Resistance to even tigecycline and polymyxin E, antibiotics of last resort, has begun to emerge. There is an urgent need for antimicrobial stewardship and other measures to limit worsening of Gram-negative resistance in India.
Background
Bloodstream infections caused by multidrug-resistant Gram-negative organisms continue to be leading causes of morbidity and mortality in hospitalized patients [1,2,3]. Knowledge of longitudinal trends in antimicrobial susceptibility patterns will help both clinicians and infection control practitioners. Unlike many developed countries, India does not have a nationwide antimicrobial resistance monitoring network and therefore long term longitudinal single center studies can give important information regarding emerging resistance patterns. Most studies from India have been performed over 1 to 4 years [4,5,6,7,8,9,10,11]; only one has analyzed data over an 8 year period [12]. We herewith describe antibiotic susceptibility patterns of important Gram- negative blood culture isolates at a single center over 10 years.
Methods
A retrospective observational study was carried out at a 550-bed tertiary care referral center in South India. We studied the antimicrobial susceptibility patterns of 4128 non- repetitive blood culture isolates of Escherichia coli, Klebsiella pneumoniae and Pseudomonas aeruginosa from 2003-2013. Acinetobacter baumannii was included from 2009-2013 as blood culture isolates were uncommon prior to 2009. We collected the susceptibility patterns of all the four organisms both together and separately based upon whether collected from ward inpatients (IP), outpatients (OP) and patients in the critical care unit (CCU). Subsequent cultures of the same organism from the same patient were not included.
Isolation and identification was done with BacT/ALERT (bioMérieux, Marcy-l'Étoile, France) and VITEK 2 (bioMérieux, Marcy- l'Étoile, France) and also through standard microbiological tests. Susceptibility testing was done with the disc diffusion method (modified Kirby-Bauer method) using Mueller-Hinton agar and VITEK 2 antimicrobial susceptibility testing (AST) cards. The results were interpreted as per CLSI (Clinical and Laboratory Standards Institute) guidelines corresponding to that period [13]. All antibiotic discs were obtained from OXOID (Oxoid Ltd, Altrincham, Cheshire, United Kingdom) and BD BBL (Becton, Dickinson and Company Ltd, Franklin Lakes, New Jersey, USA). Extended-spectrum beta- lactamase (ESBL) production and carbapenem resistance was interpreted based on Kirby-Bauer disc susceptibility testing and the minimum inhibitory concentration (MIC) criteria by the VITEK COMPACT 2 as per CLSI guidelines. Tigecycline susceptibility was not performed for P. aeruginosa as it is inherently resistant. Meropenem was taken as a representative of the Group 2 carbapenems (meropenem, imipenem, doripenem).
Data was entered in Microsoft Excel worksheet and susceptibility percentages were calculated. Comparison of resistance of 2003 and 2013 was done with Z test for 2 population proportions.
We obtained institutional ethics committee clearance for the study.
Results
During the study period, susceptibility patterns of 4128 blood culture isolates of E. coli, K. pneumoniae, P. aeruginosa and A. baumannii were analysed. E. coli predominated in outpatient isolates whereas K. pneumoniae and P. aeruginosa predominated in CCU isolates. All A. baumannii isolates were from the CCU. Details of isolates are in Table 1. The overall susceptibility pattern of all blood isolates is depicted in Figure 1.

Table 1.
Details of number of isolates included in the study.
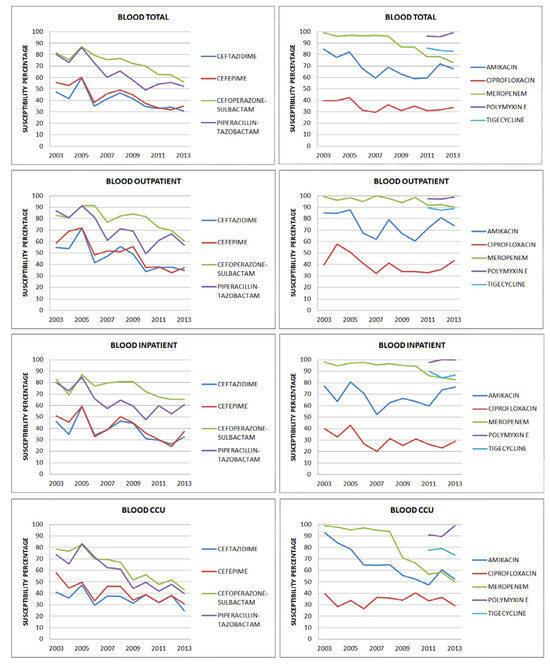
Figure 1.
Susceptibility patterns of all blood isolates.
Outpatient isolates (Table 2 and Table 5): Amikacin susceptibilities fell between 2003 (85%) and 2013 (74%), not statistically significant (p = .136). ESBL production rates increased from 45% to 67%. Susceptibility to ciprofloxacin was low throughout the study period (37%-40%). There was a significant drop in susceptibility to beta-lactam – beta-lactamase inhibitor (BL-BLIs) from 80% to 60% (p = .006 for cefoperazone-sulbactam and p = .0003 for piperacillin-tazobactam).
Table 2.
Comparison of resistance of all blood culture isolates in 2003 vs. 2013.
Meropenem susceptibility dropped from 96% to 79% (p = .005). Most isolates were susceptible to polymyxin E and tigecycline (97% and 89% respectively).
Inpatient isolates (Table 2): Susceptibility to amikacin was maintained throughout this period (77% to 76%). A drop in the susceptibility to ciprofloxacin was noted (40% to 29%) but it was not statistically significant (p = .082). There was a statistically significant drop in the susceptibility to ceftazidime and cefepime (p = .038 and .044). The drop in BL-BLIs (statistically significant – p = .005 and .003) and meropenem (not statistically significant, p = .327) susceptibilities was similar to outpatient isolates.
Table 3a.
Antibiotic susceptibility patterns of Gram-negative isolates in 2003 and 2013 (in percentage, rounded to the nearest full number) and comparison of resistance in 2003 vs. 2013.
Table 3a.
Antibiotic susceptibility patterns of Gram-negative isolates in 2003 and 2013 (in percentage, rounded to the nearest full number) and comparison of resistance in 2003 vs. 2013.
| Ceftazidime | Cefepime | |||||||
|---|---|---|---|---|---|---|---|---|
| 2003 % | 2013 % | Resistance comparison 2003 vs. 2013 | 2003 % | 2013 % | Resistance comparison 2003 vs. 2013 | |||
| Z score | p value | Z score | p value | |||||
| E. coli | ||||||||
| Total | 44 | 29 | 3.466 | .00058 | 47 | 35 | 2.4535 | .01428 |
| Outpatient | 53 | 41 | 1.0466 | .29372 | 56 | 41 | 1.2927 | .19706 |
| Inpatient | 40 | 24 | 1.7747 | .07672 | 40 | 32 | 0.8882 | .37346 |
| CCU | 41 | 21 | 2.0918 | .03662 | 46 | 34 | 1.1173 | .26272 |
| K. pneumoniae | ||||||||
| Total | 50 | 27 | 3.2198 | .00128 | 62 | 30 | 4.7265 | 0 |
| Outpatient | 57 | 25 | 2.1543 | .03156 | 57 | 33 | 1.543 | .12356 |
| Inpatient | 55 | 36 | 1.5663 | .11642 | 68 | 37 | 2.5915 | .0096 |
| CCU | 39 | 19 | 2.2114 | .0217 | 61 | 23 | 3.8936 | .0001 |
| P. aeruginosa | ||||||||
| Total | 51 | 57 | -1.0625 | .28914 | 57 | 55 | 0.6747 | .50286 |
| Outpatient | 60 | 50 | 0.3519 | .72634 | 80 | 38 | 1.4954 | .13362 |
| Inpatient | 46 | 67 | -1.2635 | .20766 | 46 | 67 | -1.2635 | .20766 |
| CCU | 47 | 55 | -0.5354 | .5892 | 80 | 59 | 1.4181 | .1556 |
| Cefoperazone-sulbactam | Piperacillin-tazobactam | |||||||
| 2003 % | 2013 % | Resistance comparison 2003 vs. 2013 | 2003 % | 2013 % | Resistance comparison 2003 vs. 2013 | |||
| Z score | p value | Z score | p value | |||||
| E. coli | ||||||||
| Total | 87 | 76 | 2.253 | .02444 | 78 | 65 | 2.5117 | .01174 |
| Outpatient | 85 | 81 | 0.4732 | .63836 | 88 | 68 | 2.8022 | .03752 |
| Inpatient | 93 | 77 | 1.9972 | .0455 | 83 | 68 | 1.9536 | .5118 |
| CCU | 84 | 71 | 1.4529 | 1.14706 | 65 | 60 | 0.4428 | .65994 |
| K. pneumoniae | ||||||||
| Total | 78 | 41 | 4.9607 | 0 | 77 | 38 | 5.9395 | 0 |
| Outpatient | 79 | 42 | 2.3453 | .01878 | 79 | 39 | 2.5198 | .01174 |
| Inpatient | 77 | 46 | 2.6293 | .00854 | 82 | 47 | 2.9157 | .0035 |
| CCU | 77 | 34 | 3.5991 | .00032 | 71 | 29 | 4.784 | 0 |
| P. aeruginosa | ||||||||
| Total | 82 | 52 | 2.2574 | .02382 | 85 | 77 | 0.9561 | .33706 |
| Outpatient | 98 | 50 | 1.0817 | .28014 | 100 | 88 | 0.8229 | .41222 |
| Inpatient | 69 | 53 | 0.9705 | .33204 | 69 | 73 | 0.2755 | .77948 |
| CCU | 80 | 52 | 1.8259 | .06724 | 87 | 69 | 1.2853 | .19706 |
CCU critical care unit.
Table 3b.
Antibiotic susceptibility patterns of Gram-negative isolates in 2003 and 2013 (in percentage, rounded to the nearest full number) and comparison of resistance in 2003 vs. 2013.
Table 3b.
Antibiotic susceptibility patterns of Gram-negative isolates in 2003 and 2013 (in percentage, rounded to the nearest full number) and comparison of resistance in 2003 vs. 2013.
| Amikacin | Ciprofloxacin | Meropenem | ||||||||||
|---|---|---|---|---|---|---|---|---|---|---|---|---|
| 2003 % | 2013 % | Resistance comparison 2003 vs. 2013 | 2003 % | 2013 % | Resistance comparison 2003 vs. 2013 | 2003 % | 2013 % | Resistance comparison 2003 vs. 2013 | ||||
| Z score | p value | Z score | p value | Z score | p value | |||||||
| E. coli | ||||||||||||
| Total | 90 | 89 | 0.147 | .88076 | 31 | 31 | 0.8808 | .37886 | 100 | 95 | 1.1698 | .242 |
| Outpatient | 88 | 89 | -0.127 | .89656 | 32 | 57 | -2.0645 | .0394 | 100 | 100 | 1.0596 | .29372 |
| Inpatient | 87 | 90 | -0.481 | .63122 | 30 | 21 | 0.1237 | .26272 | 100 | 96 | 0.2368 | .81034 |
| CCU | 95 | 90 | 0.8454 | .39532 | 32 | 26 | 0.6924 | .4902 | 100 | 91 | 1.8349 | .06724 |
| K. pneumoniae | ||||||||||||
| Total | 88 | 53 | 4.9262 | 0 | 46 | 32 | 1.9986 | .0455 | 99 | 54 | 5.5334 | 0 |
| Outpatient | 79 | 58 | 1.3386 | .18024 | 43 | 31 | 0.8245 | .41222 | 100 | 60 | 2.3496 | .01878 |
| Inpatient | 77 | 57 | 0.7648 | .0784 | 55 | 39 | 1.3516 | .17702 | 99 | 59 | 1.6498 | .09894 |
| CCU | 94 | 44 | 4.567 | 0 | 39 | 26 | 1.4054 | .15854 | 99 | 43 | 5.274 | 0 |
| P. aeruginosa | ||||||||||||
| Total | 74 | 66 | 0.9967 | .31732 | 59 | 47 | 0.4977 | .61708 | 100 | 65 | 3.4913 | .00048 |
| Outpatient | 80 | 75 | 0.2082 | .83366 | 80 | 38 | 1.4954 | .13362 | 100 | 75 | 1.2154 | .22246 |
| Inpatient | 54 | 57 | -0.171 | .86502 | 38 | 47 | 0.4976 | .61708 | 100 | 50 | 1.1662 | .242 |
| CCU | 87 | 66 | 1.4932 | .31732 | 60 | 55 | 0.3064 | .75656 | 100 | 48 | 3.431 | .0006 |
CCU critical care unit.
Table 4.
Antibiotic susceptibility of Gram-negative isolates from 2003 to 2013 (in percentage, rounded to the nearest full number).
Table 4.
Antibiotic susceptibility of Gram-negative isolates from 2003 to 2013 (in percentage, rounded to the nearest full number).
| Amikacin | Ceftazidime | Cefoperazone- sulbactam | Piperacillin- tazobactam | Meropenem | |||||||||||
|---|---|---|---|---|---|---|---|---|---|---|---|---|---|---|---|
| OP | IP | CCU | OP | IP | CCU | OP | IP | CCU | OP | IP | CCU | OP | IP | CCU | |
| 2003 | 85 | 77 | 93 | 55 | 46 | 41 | 83 | 83 | 78 | 87 | 80 | 73 | 99 | 98 | 99 |
| 2004 | 85 | 64 | 84 | 54 | 35 | 36 | 81 | 69 | 77 | 81 | 73 | 65 | 96 | 95 | 98 |
| 2005 | 88 | 81 | 78 | 72 | 59 | 47 | 91 | 87 | 82 | 91 | 85 | 83 | 98 | 97 | 95 |
| 2006 | 67 | 71 | 65 | 41 | 34 | 29 | 91 | 77 | 70 | 81 | 66 | 72 | 95 | 98 | 97 |
| 2007 | 62 | 52 | 64 | 47 | 39 | 38 | 77 | 80 | 69 | 61 | 58 | 62 | 100 | 96 | 95 |
| 2008 | 79 | 63 | 65 | 56 | 46 | 37 | 82 | 81 | 67 | 71 | 65 | 61 | 98 | 97 | 94 |
| 2009 | 67 | 66 | 56 | 49 | 44 | 31 | 84 | 81 | 52 | 69 | 60 | 44 | 94 | 95 | 71 |
| 2010 | 61 | 63 | 52 | 34 | 31 | 39 | 82 | 72 | 56 | 49 | 48 | 50 | 99 | 94 | 66 |
| 2011 | 72 | 60 | 47 | 37 | 29 | 32 | 72 | 67 | 48 | 61 | 60 | 42 | 92 | 86 | 57 |
| 2012 | 81 | 74 | 60 | 38 | 26 | 38 | 70 | 65 | 52 | 67 | 53 | 48 | 92 | 84 | 58 |
| 2013 | 74 | 76 | 52 | 35 | 32 | 25 | 60 | 65 | 43 | 57 | 61 | 40 | 79 | 83 | 50 |
CCU critical care unit; IP inpatient; OP outpatient.
Table 5.
Susceptibility to polymyxin E and tigecycline of Gram-negative isolates (in percentage, rounded to the nearest full number. CCU – critical care unit).
Table 5.
Susceptibility to polymyxin E and tigecycline of Gram-negative isolates (in percentage, rounded to the nearest full number. CCU – critical care unit).
| Total | E. coli | Klebsiella | |||||||
|---|---|---|---|---|---|---|---|---|---|
| 2011 | 2012 | 2013 | 2011 | 2012 | 2013 | 2011 | 2012 | 2013 | |
| OUTPATIENT | |||||||||
| Polymyxin E | 97 | 93 | 99 | 98 | 98 | 100 | 100 | 96 | 100 |
| Tigecycline | 89 | 87 | 89 | 98 | 100 | 100 | 96 | 98 | 97 |
| INPATIENT | |||||||||
| Polymyxin E | 98 | 100 | 100 | 100 | 100 | 100 | 88 | 100 | 100 |
| Tigecycline | 90 | 84 | 87 | 100 | 100 | 99 | 89 | 100 | 94 |
| CCU | |||||||||
| Polymyxin E | 91 | 90 | 99 | 100 | 95 | 100 | 100 | 100 | 100 |
| Tigecycline | 77 | 79 | 73 | 100 | 95 | 98 | 100 | 89 | 76 |
| Pseudomonas | Acinetobacter | ||||||||
| 2011 | 2012 | 2013 | 2011 | 2012 | 2013 | ||||
| OUTPATIENT | |||||||||
| Polymyxin E | 94 | 96 | 97 | ||||||
| Tigecycline | |||||||||
| INPATIENT | |||||||||
| Polymyxin E | 96 | 100 | 99 | ||||||
| Tigecycline | |||||||||
| CCU | |||||||||
| Polymyxin E | 98 | 87 | 97 | 100 | 98 | 95 | |||
| Tigecycline | 100 | 98 | 80 | ||||||
Table 6.
Comparison of susceptibility to polymyxin E and tigecycline in 2011 vs. 2013 (in percentage, rounded to the nearest full number. CCU – critical care unit).
Table 6.
Comparison of susceptibility to polymyxin E and tigecycline in 2011 vs. 2013 (in percentage, rounded to the nearest full number. CCU – critical care unit).
| 2011 % | 2013 % | Comparison of resistance 2011 vs. 2013 | ||
|---|---|---|---|---|
| Z score | p value | |||
| OUTPATIENT | ||||
| Polymyxin E | 97 | 98 | -0.7752 | .4354 |
| Tigecycline | 89 | 88 | 0.1196 | .90448 |
| INPATIENT | ||||
| Polymyxin E | 97 | 99 | -1.866 | .06148 |
| Tigecycline | 89 | 86 | 0.9364 | .34722 |
| CCU | ||||
| Polymyxin E | 91 | 98 | -3.8051 | .00014 |
| Tigecycline | 77 | 73 | 0.9889 | .32218 |
| TOTAL BLOOD ISOLATES | ||||
| Polymyxin E | 95 | 99 | -4.1913 | 0 |
| Tigecycline | 83 | 81 | 1.0556 | .28914 |
CCU isolates (Table 3 and Table 5): Amikacin susceptibility fell from 93% to 52% (p = .000). ESBL production rates increased from 60% to 80%, higher than among outpatient and inpatient isolates. There was a drop in meropenem susceptibility (from 99% to 77%). The drop in susceptibility to all antibiotics except for ciprofloxacin was statistically significant. The only antibiotics with susceptibilities greater than 80% were polymyxin E and tigecycline.
E. coli (Figure 2, Table 3a and 3b): Amikacin susceptibility was maintained for OP/IP/CCU isolates at 90%. ESBL rates increased from 56% in 2003 to 71% in 2013. The increase was more important in CCU isolates. There was a significant drop in ceftazidime susceptibility in CCU isolates (p = .037). Among the BL-BLIs, cefoperazone-sulbactam susceptibility was about 10% higher overall than that to piperacillin- tazobactam, although susceptibility to both fell by about 10% between 2003 and 2013. The statistically significant drop in cefoperazone- sulbactam (p = .024) susceptibility was more contributed by the inpatient isolates (p = .046). For piperacillin-tazobactam, the drop in susceptibility was significant (p = .012), more from the outpatient isolates (p = .038). There was a reduction in susceptibility to meropenem from 2003 to 2013 (100% to 95%), falling to as low as 91% among CCU isolates but this was not statistically significant.
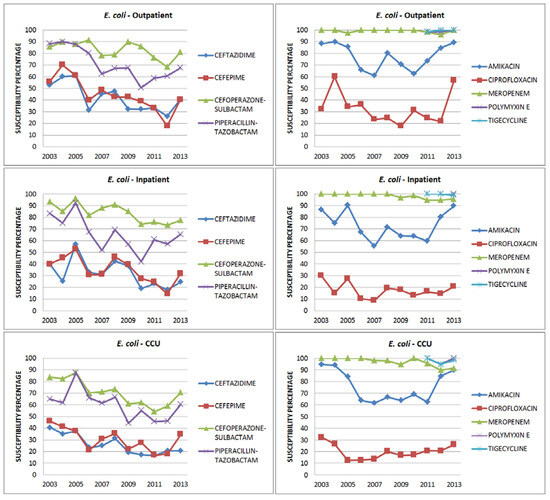
Figure 2.
Susceptibility patterns of E. coli.
Susceptibility to polymyxin E and tigecycline was high (100% to 95%).
K. pneumoniae (Figure 3, Table 3a and 3b): There was a significant drop in the susceptibility to amikacin in CCU isolates from 94% in 2003 to 44% in 2013 (p = .000). ESBL production rates were 75% in outpatient isolates and 81% in CCU isolates. The susceptibility rates to BL-BLIs were as low as 40% in both outpatient and inpatient isolates and just 30-35% in CCU isolates. The drops in the susceptibility to BL- BLIs of all isolates (outpatient, inpatient and CCU) were statistically significant. Meropenem susceptibility fell from100% in outpatient isolates in 2003 to 60% in 2013 (p = .019). A similar trend was seen in CCU isolates (p = .000). Even though there was a drop for inpatient isolates, it was not statistically significant. In 2013, only 59% of inpatient isolates and 43% CCU isolates were susceptible to meropenem. Susceptibility to tigecycline (76%) was lower than that to polymyxin E (100%) in CCU isolates (Table 5).
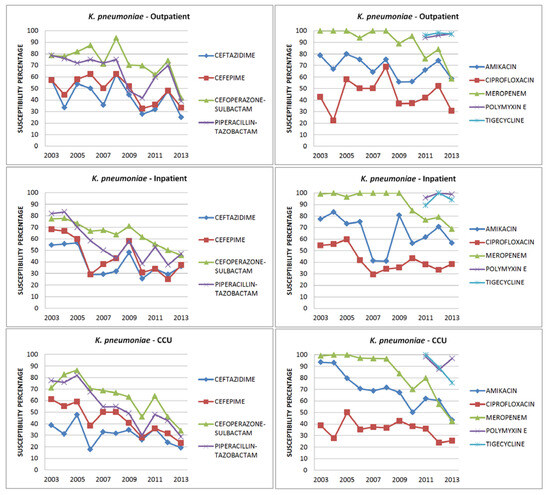
Figure 3.
Susceptibility patterns of K. pneumoniae.
P. aeruginosa (Figure 4, Table 3a and 3b): Amikacin susceptibility was maintained throughout the study period in inpatient isolates whereas there was a 20% reduction in CCU isolates (87% to 66%). The number of isolates susceptible to piperacillin-tazobactam was higher than that for ceftazidime and cefoperazone- sulbactam and the susceptibility to piperacillin- tazobactam was maintained throughout the study period. In 2003 strains were more susceptible to meropenem compared to BL-BLIs but from 2009, the trend got reversed. Even though there was a drop in the susceptibility to all antibiotics, the only statistically significant drop was for meropenem from CCU isolates (p = .0006). More than 90% of isolates were susceptible to polymyxin E (Table 5).
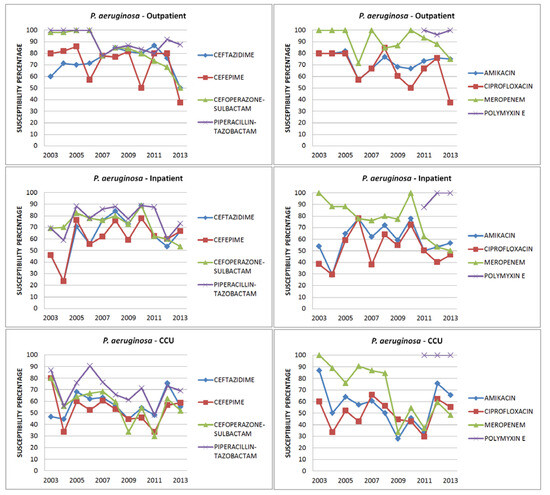
Figure 4.
Susceptibility patterns of P. aeruginosa.
A. baumannii (Figure 5): We analyzed data from 2009 to 2013 only, all from the CCU. Susceptibility to amikacin was low but steady (35% to 25%) between 2009 and 2013. Susceptibility to third generation cephalosporins/ BL-BLIs was low at 33% to 23%. Meropenem susceptibility was low throughout the study period (33% to 26%). Polymyxin E and tigecycline susceptibility fell from 100% to 95% and 80% respectively, both not statistically significant.
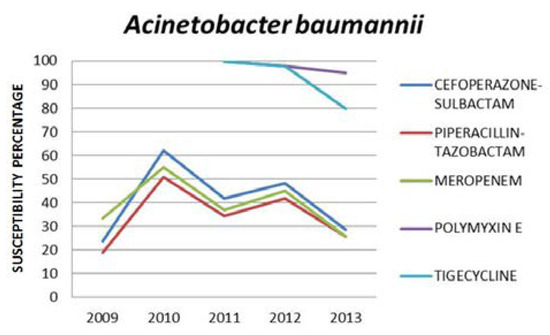
Figure 5.
Susceptibility patterns of A. baumannii.
Discussion
The rapid emergence of multidrug-resistant Gram-negative bacteria is an enormous problem not only in India but also globally [14,15,16,17]. We hereby demonstrate steadily increasing resistance rates among Gram-negative blood culture isolates with the greatest rise among CCU isolates, compared to outpatient and inpatient isolates.
ESBL production in Enterobacteriaceae in India has been increasing steadily in various studies. In our study ESBL production rate in E. coli increased from 56% in 2003 to 71% in 2013 and was as high as 80% in the CCU, which is higher than previous studies where it was between 45-70% [5,6,7,8]. Our ESBL rate in E. coli was similar to the rates in the study by Rajeevan et al. [9]. ESBL production in K. pneumoniae similarly increased from 50% in 2003 to 73% in 2013. A worrying trend in our study was the increasing ESBL production rate even in outpatient isolates (from 45% in 2003 to 67% in 2013). This increase in rates unfortunately may require clinicians to use high end antibiotics such as carbapenems even for community-acquired bacteremias.
The increase in ESBL rates may have resulted in widespread carbapenem usage in many Indian hospitals during the first decade of this century, which in turn probably fuelled emergence of carbapenem resistance. Carbapenem resistance in Enterobacteriaceae increased over this period in our study: E. coli isolates were fully susceptible to carbapenems in 2003 but not in 2013, when 4% of isolates were resistant. K. pneumoniae showed an even greater increase in carbapenem resistance (1% in 2003 to 46% in 2013 – Table 3b). The changes in carbapenem resistance were statistically significant in isolates from outpatient and CCU. This was similar to two other studies that showed that carbapenem resistance increased from 10% to 40% over a two year period [6,16]. A similar increase in carbapenem resistance from 2008 was reported in another study done in South India [12]. This probably reflects the emergence and subsequent dissemination of New Delhi metallo-beta- lactamase (NDM-1)-producing Enterobacteriaceae in multiple Indian hospitals in this period [17].
A similar rise in carbapenem resistance was noted in P. aeruginosa and A. baumannii. Carbapenem resistance in P. aeruginosa was not seen in 2003 but in 2013, 52% of CCU isolates were resistant, the difference being statistically significant. The drop in susceptibility in other isolates was not statistically significant. In another study done in India, 30-37% of P. aeruginosa isolates were resistant to carbapenem [18]. P. aeruginosa isolates were more susceptible to piperacillin-tazobactam (70% to 80%) than cefoperazone-sulbactam (50%) or carbapenems (65%). Again, the widespread use of carbapenems instead of BL-BLIs to treat ESBL Enterobacteriaceae may have contributed.
In our study A. baumannii isolates were all from the CCU. Susceptibility to meropenem was just 33% and decreased further to 26% in 2013 similar to another study which analyzed isolates between 2011 and 2012 and showed 20% susceptibility to carbapenems [19]. Carbapenem-resistant A. baumannii is a common cause of hospital-acquired bacteremia and pneumonia at our center. Carbapenems are therefore currently inappropriate as empiric therapy for hospital-acquired infections where A. baumannii may be a pathogen.
Beta-lactam/ beta-lactam inhibitors have been used as carbapenem-sparers for nosocomial infections, but susceptibility rates declined over time in our study (Table 4). Cefoperazone- sulbactam susceptibility of outpatient isolates declined from around 83% in 2003 to 60% in 2013 (p = .005). Susceptibility to piperacillin- tazobactam also declined from 87% in 2003 to 57% in 2013 for outpatient isolates (p = .0003) – Table 2. Although the drop in the susceptibility to BL-BLIs was statistically significant in all isolates (p ≤ .005), it was more pronounced in CCU isolates (40%) than in outpatient (60%) and inpatient isolates (60%). These findings have important implications for therapy: these drugs are no longer reliable as empiric choices for hospital-acquired infections and may not be effective as empiric choices for severe community-acquired bacteremias.
Polymyxin E and tigecycline were the most effective antibiotics for E. coli and K. pneumoniae (susceptibility ranged between 90-100%). However resistance to these antibiotics of last resort is clearly emerging at our center. Although there was a drop in overall susceptibility to polymyxin E and tigecycline in 2013, this was statistically significant (p = .0001) only for polymyxin E from CCU isolates (Table 6). In 2013, 3-5% of P. aeruginosa and A. baumannii isolates were resistant to polymyxin E and there was a fall in tigecycline susceptibility from 100% in 2011 to 70%-80% in 2013 among K. pneumoniae and A. baumannii isolates from CCU (Table 5). This highlights the need for careful antimicrobial stewardship to preserve polymyxin E and tigecycline as the drugs of last resort.
In 2013, 67% of the isolates were susceptible to amikacin, with a minimal fall in susceptibilities over a 10 year period. This could be due to the fact that aminoglycosides are rarely used as empiric or definitive therapy for Gram- negative sepsis at our center due to concern about toxicity: perhaps it is time to reconsider the use of aminoglycosides as empiric agents in Gram-negative sepsis, probably in combination with beta-lactam antibiotics.
We acknowledge some limitations in our study. The increase in carbapenem resistance in 2012 and 2013 may have been because of lowered MIC breakpoints by CLSI in 2012 [13]. We also did not test for molecular mechanisms of resistance, which might have yielded valuable insight into reasons behind emergence of resistance. For instance, we do not know whether carbapenem resistance was due to the production of NDM-1, other carbapenemases or still other mechanisms such as porin channel mutations or efflux pumps. We also did not test for clonality among isolates which might give useful information regarding the role of infection control efforts versus antimicrobial stewardship.
Conclusion
We hereby demonstrate significant increases in resistance in blood culture isolates of Gram- negative bacteria to all major classes of antibiotics. Inclusion of blood culture isolates alone, as opposed to cultures from non-sterile sites, increases the applicability of our findings to clinical practice. The majority of Enterobacteriaceae at our center are ESBL producers and this was true even for outpatient isolates. There was a drop in susceptibility to beta-lactam/beta-lactamase inhibitors, which are potential carbapenem-sparers. Carbapenem- resistant A. baumannii has established itself as a nosocomial pathogen, and almost half of P. aeruginosa isolates were also resistant. Rising carbapenem resistance was also noted with K. pneumoniae, especially for isolates from the CCU, where carbapenems can no longer be used as reliable empiric therapy. Resistance to polymyxin E and tigecycline, considered drugs of last resort, has begun to emerge in K. pneumoniae. Antimicrobial stewardship and other measures, such as those suggested by the Chennai Declaration [20], are urgently needed to tackle the problem of Gram-negative resistance.
Author Contributions
MA contributed to study concept, design, data collection, data analysis, and manuscript preparation. RG contributed to study concept, data analysis, and manuscript preparation. SNP contributed to study concept, data collection, data analysis, and manuscript preparation. SD contributed to study concept and manuscript editing. TMA contributed to study concept, data collection, and manuscript editing. VR contributed to study concept and manuscript editing. All authors read and approved the final version of the manuscript.
Conflicts of Interest
All authors – none to declare.
References
- Biedenbach, D.J.; Moet, G.J.; Jones, R.N. Occurrence and antimicrobial resistance pattern comparisons among bloodstream infection isolates from the SENTRY Antimicrobial Surveillance Program (1997-2002). Diagn Microbiol Infect Dis 2004, 50, 59–69. [Google Scholar] [CrossRef] [PubMed]
- Marra, A.R.; Camargo, L.F.; Pignatari, A.C.; et al. Nosocomial bloodstream infections in Brazilian hospitals: Analysis of 2,563 cases from a prospective nationwide surveillance study. J Clin Microbiol 2011, 49, 1866–1871. [Google Scholar] [PubMed]
- Lee, N.Y.; Lee, H.C.; Ko, N.Y.; et al. Clinical and economic impact of multidrug resistance in nosocomial Acinetobacter baumannii bacteremia. Infect Control Hosp Epidemiol 2007, 28, 713–719. [Google Scholar] [CrossRef] [PubMed]
- Gupta, A.; Sharma, S.; Arora, A.; Gupta, A. Changing trends of in vitro antimicrobial resistance patterns in blood isolates in a tertiary care hospital over a period of 4 years. Indian J Med Sci 2010, 64, 485–492. [Google Scholar] [CrossRef] [PubMed]
- Chadhary, M.; Kumar, S.; Payasi, A. Prevalence and antimicrobial sensitivity of ESBL producing Gram- negative bacteria from clinical settings in India from 2010 to 2012. Int J Med Med Sci 2013, 46, 1212–1217. [Google Scholar]
- Jain, S.; Khety, Z. Changing antimicrobial resistance pattern of isolates from an ICU over a 2 year period. J Assoc Physicians India 2012, 60, 27–28,33. [Google Scholar] [PubMed]
- Kumhar, G.D.; Ramachandran, V.G.; Gupta, P. Bacteriological analysis of blood culture isolates from neonates in a tertiary care hospital in India. J Health Popul Nutr 2002, 20, 343–347. [Google Scholar]
- Kaul, S.; Brahmadathan, K.N.; Jagannati, M.; et al. One year trends in the gram-negative bacterial antibiotic susceptibility patterns in a medical intensive care unit in South India. Indian J Med Microbiol 2007, 25, 230–235. [Google Scholar] [CrossRef] [PubMed][Green Version]
- Rajeevan, S.; Ahmad, S.M.; Jasmin, P.T. Study of prevalence and antimicrobial susceptibility pattern in blood isolates from a tertiary care hospital in North Kerala, India. Int J Curr Microbiol App Sci 2014, 3, 655–662. [Google Scholar]
- Chhina, D.; Gupta, V. Bacteriological profile and antimicrobial susceptibility pattern of blood isolates from a tertiary care hospital in North India. Int J Pharm Res Biosci 2013, 2, 24–35. [Google Scholar]
- Vanitha Rani, N.; Kannan, G.; Venkata Narendra, M.; et al. A retrospective study on blood stream infections and antibiotic susceptibility patterns in a tertiary care teaching hospital. Int J Pharm Pharm Sci 2012, 4, 543–548. [Google Scholar]
- Gopalakrishnan, R.; Sureshkumar, D. Changing trends in antimicrobial susceptibility and hospital acquired infections over an 8 year period in a tertiary care hospital in relation to introduction of an infection control programme. J Assoc Physicians India 2010, 58 Suppl, 25–31. [Google Scholar] [PubMed]
- Clinical and Laboratory Standards Institute. Performance Standards For Antimicrobial Susceptibility Testing; Thirteenth to Twenty Third Informational Supplements; CLSI document M100-18; Clinical and Laboratory Standards Institute: Wayne, PA, 2003-2013. [Google Scholar]
- Nair, P.K.; Vaz, M.D. Prevalence of carbapenem resistant Enterobacteriaceae from a tertiary care hospital in Mumbai, India. J Microbiol Infect Dis 2013, 3, 207–210. [Google Scholar] [CrossRef]
- Gupta, N.; Limbago, B.M.; Patel, J.B.; Kallen, A.J. Carbapenem-resistant Enterobacteriaceae: Epidemiology and prevention. Clin Infec Dis 2011, 53, 60–67. [Google Scholar] [CrossRef]
- Mohamudha Parveen, R.; Harish, B.N.; Parija, S.C. Emerging carbapenem resistance among nosocomial isolates of Klebsiella pneumoniae in South India. Int J Pharma Biosci 2010, 1, 1–11. [Google Scholar]
- Kumarasamy, K.K.; Toleman, M.A.; Walsh, T.R.; et al. Emergence of a new antibiotic resistance mechanism in India, Pakistan, and the UK: A molecular, biological, and epidemiological study. Lancet Infect Dis 2010, 10, 597–602. [Google Scholar] [CrossRef]
- Gupta, E.; Mohanty, S.; Sood, S.; Dhawan, B.; Das, B.K.; Kapil, A. Emerging resistance to carbapenems in a tertiary care hospital in north India. Indian J Med Res 2006, 124, 95–98. [Google Scholar] [PubMed]
- Sinha, N.; Agarwal, J.; Srivastava, S.; Singh, M. Analysis of carbapenem-resistant Acinetobacter from a tertiary care setting in North India. Indian J Med Microbiol 2013, 31, 60–63. [Google Scholar] [CrossRef] [PubMed]
- Chennai Declaration Team. "Chennai Declaration": 5-year plan to tackle the challenge of anti-microbial resistance. Indian J Med Microbiol 2014, 32, 221–228.


© GERMS 2015.