Introduction
There were 202,256 new leprosy cases registered globally in 2019 according to official figures from 161 countries from the six WHO Regions. Based on 178,371 cases at the end of 2019, the global prevalence corresponds to 22.9 per million population. Brazil, India and Indonesia accounted for 79.6% of all new cases globally with India having the highest disease burden [
1,
2]. In 2017, Nigeria recorded 2,447 new cases of leprosy consequently ranking 3
rd among African countries with the highest disease burden just below Democratic Republic of Congo and Ethiopia [
3].
Leprosy is a chronic granulomatous infectious disease caused by
Mycobacterium leprae that mainly affects the skin, the peripheral nervous system, mucosa of the upper respiratory tract, and eyes [
4].
Mycobacterium leprae is a non-motile acid-fast rod on Ziehl-Neelsen stain on microscopic slide [
5]. The pathogen multiplies slowly and the incubation period falls around 5 years; symptoms may occur within 1 year but can also take up to 20 years. According to the World Health Organization (WHO) classification, patients with five or fewer skin lesions often do not have bacilli in skin smears and are classified as paucibacillary. Conversely, those with more than five skin lesions may have positive smear microscopy and are termed multibacillary [
6]. The exact route of transmission of
M. leprae in humans has not yet been sufficiently elucidated [
5]. However, current knowledge suggests that humans affected by leprosy are considered to be the only source of infection via nasal mucosa that is followed by localized primary lesion similar to tuberculosis. Nevertheless, transcutaneous transmission following direct skin contacts with untreated, ulcerated, multibacillary lepromatous nodule has been thought to be a possible mode of transmission [
5]. Leprosy is treated with multidrug therapy (MDT), which is comprised of dapsone, rifampicin and clofazimine, and the treatment lasts for six months for paucibacillary and twelve months for multibacillary cases [
1].
Often, leprosy is accompanied by acute or sub-acute episodes of reactions termed leprosy reaction. They are characterized by cutaneous and systemic involvement caused by the changes in the status of patient’s immune responses [
7]. Leprosy reactions can be of type 1 or type 2. Type 1 reactions (also known as reversal reaction) result from activation of cell immunity to
M. leprae antigens, expressed clinically by exacerbation of skin and nerve trunk inflammation, resulting in sensory and motor impairment. Conversely, type 2 reactions (also known as erythema nodosum leprosum) corresponds to acute inflammatory reactions with systemic involvement, entailing the involvement of pro-inflammatory cytokines such as TNF, IL-1 and IL-6. The typical clinical sign of this reaction is the sudden onset of a large number of painful erythematous nodules throughout the body [
4,
7].
This study aimed to evaluate hematological parameters among patients with leprosy and to deduce diagnostic biomarkers for leprosy reaction.
Methods
Study design
This was a descriptive cross-sectional study with a purposive sampling approach, performed in the timespan between September 1, 2018 and August 1, 2019.
Study subjects
Eligible patients aged 18 to 65 years who had been diagnosed with leprosy by dermatological and laboratory results were recruited from the inpatient and outpatient units of Leprosy Referral Hospital in Ekpene Ebom, AkwaIbom State, Nigeria. Patients with comorbidities such as other mycobacterioses or immunosuppression states were excluded from the study. The test group consisted of 60 patients with confirmed leprosy diagnosis. Of these, 30 were on multidrug therapy (MDT) while 30 of the patients had completed MDT (cMDT). Thirty apparently healthy individuals without leprosy and without evidence of any chronic diseases were recruited as controls. The treatment of the patients consisted of the administration of dapsone 100 mg daily, rifampicin 600 mg monthly and clofazimine 50 mg daily for 24 months. Patients who had completed MDT post 24 months were enrolled. Diagnosis of leprosy reaction was done by physicians with expertise in diagnosis and treatment of leprosy.
Sample collection
Aseptic technique was used in collecting 3 mL of blood from each subject (test and control) via venipuncture into a vacutainer (Terumo vacutainer). To assess patients with leprosy with leprosy reaction, all blood samples were collected during and immediately after the leprosy reaction. The controls consisted of apparently healthy individuals not currently undergoing treatment for any chronic diseases and who did not suffer from leprosy.
Sample analysis
The samples were analyzed using the hematology auto-analyzer Sysmex KX-21N (Sysmex Corporation Kobe, Japan). The autoanalyzer uses Coulter principle which is a validated method.
Statistical analysis
Data generated in this study was analyzed using SPSS version 25 (IBM Corp., USA). Continuous variables are represented as means and standard deviations (for normally distributed data), and median and interquartile range (for non-normally distributed data), while categorical variables are represented in frequencies and percentages. Parametric statistics were used for normally distributed data while non-parametric statistics were used for non-normally distributed data. Shapiro-Wilk’s test was used to assess normality. The test of normality showed that only data for red blood cells, hemoglobin and hematocrit were normally distributed, while the rest were not. Analysis of variance (ANOVA) was used to determine difference among means of the control and the two categories of patients with leprosy for normally distributed data while the Kruskal Wallis test was used for non-normally distributed data. Fisher’s exact test was used to assess association. Eta squared was used to assess effect size within groups. The diagnostic importance (sensitivity and specificity) of the various hematological variables studied in diagnosing leprosy reaction was assessed using receiver operator characteristics (ROC) curve. The area under the curve (AUC) was calculated from the plot. Youden J index was used to define empirical cut-off for absolute eosinophil count for diagnosis of leprosy reaction. Bivariate logistics regression was used to determine biomarkers for leprosy reaction among patients with leprosy. Alpha value was set at 0.05.
Results
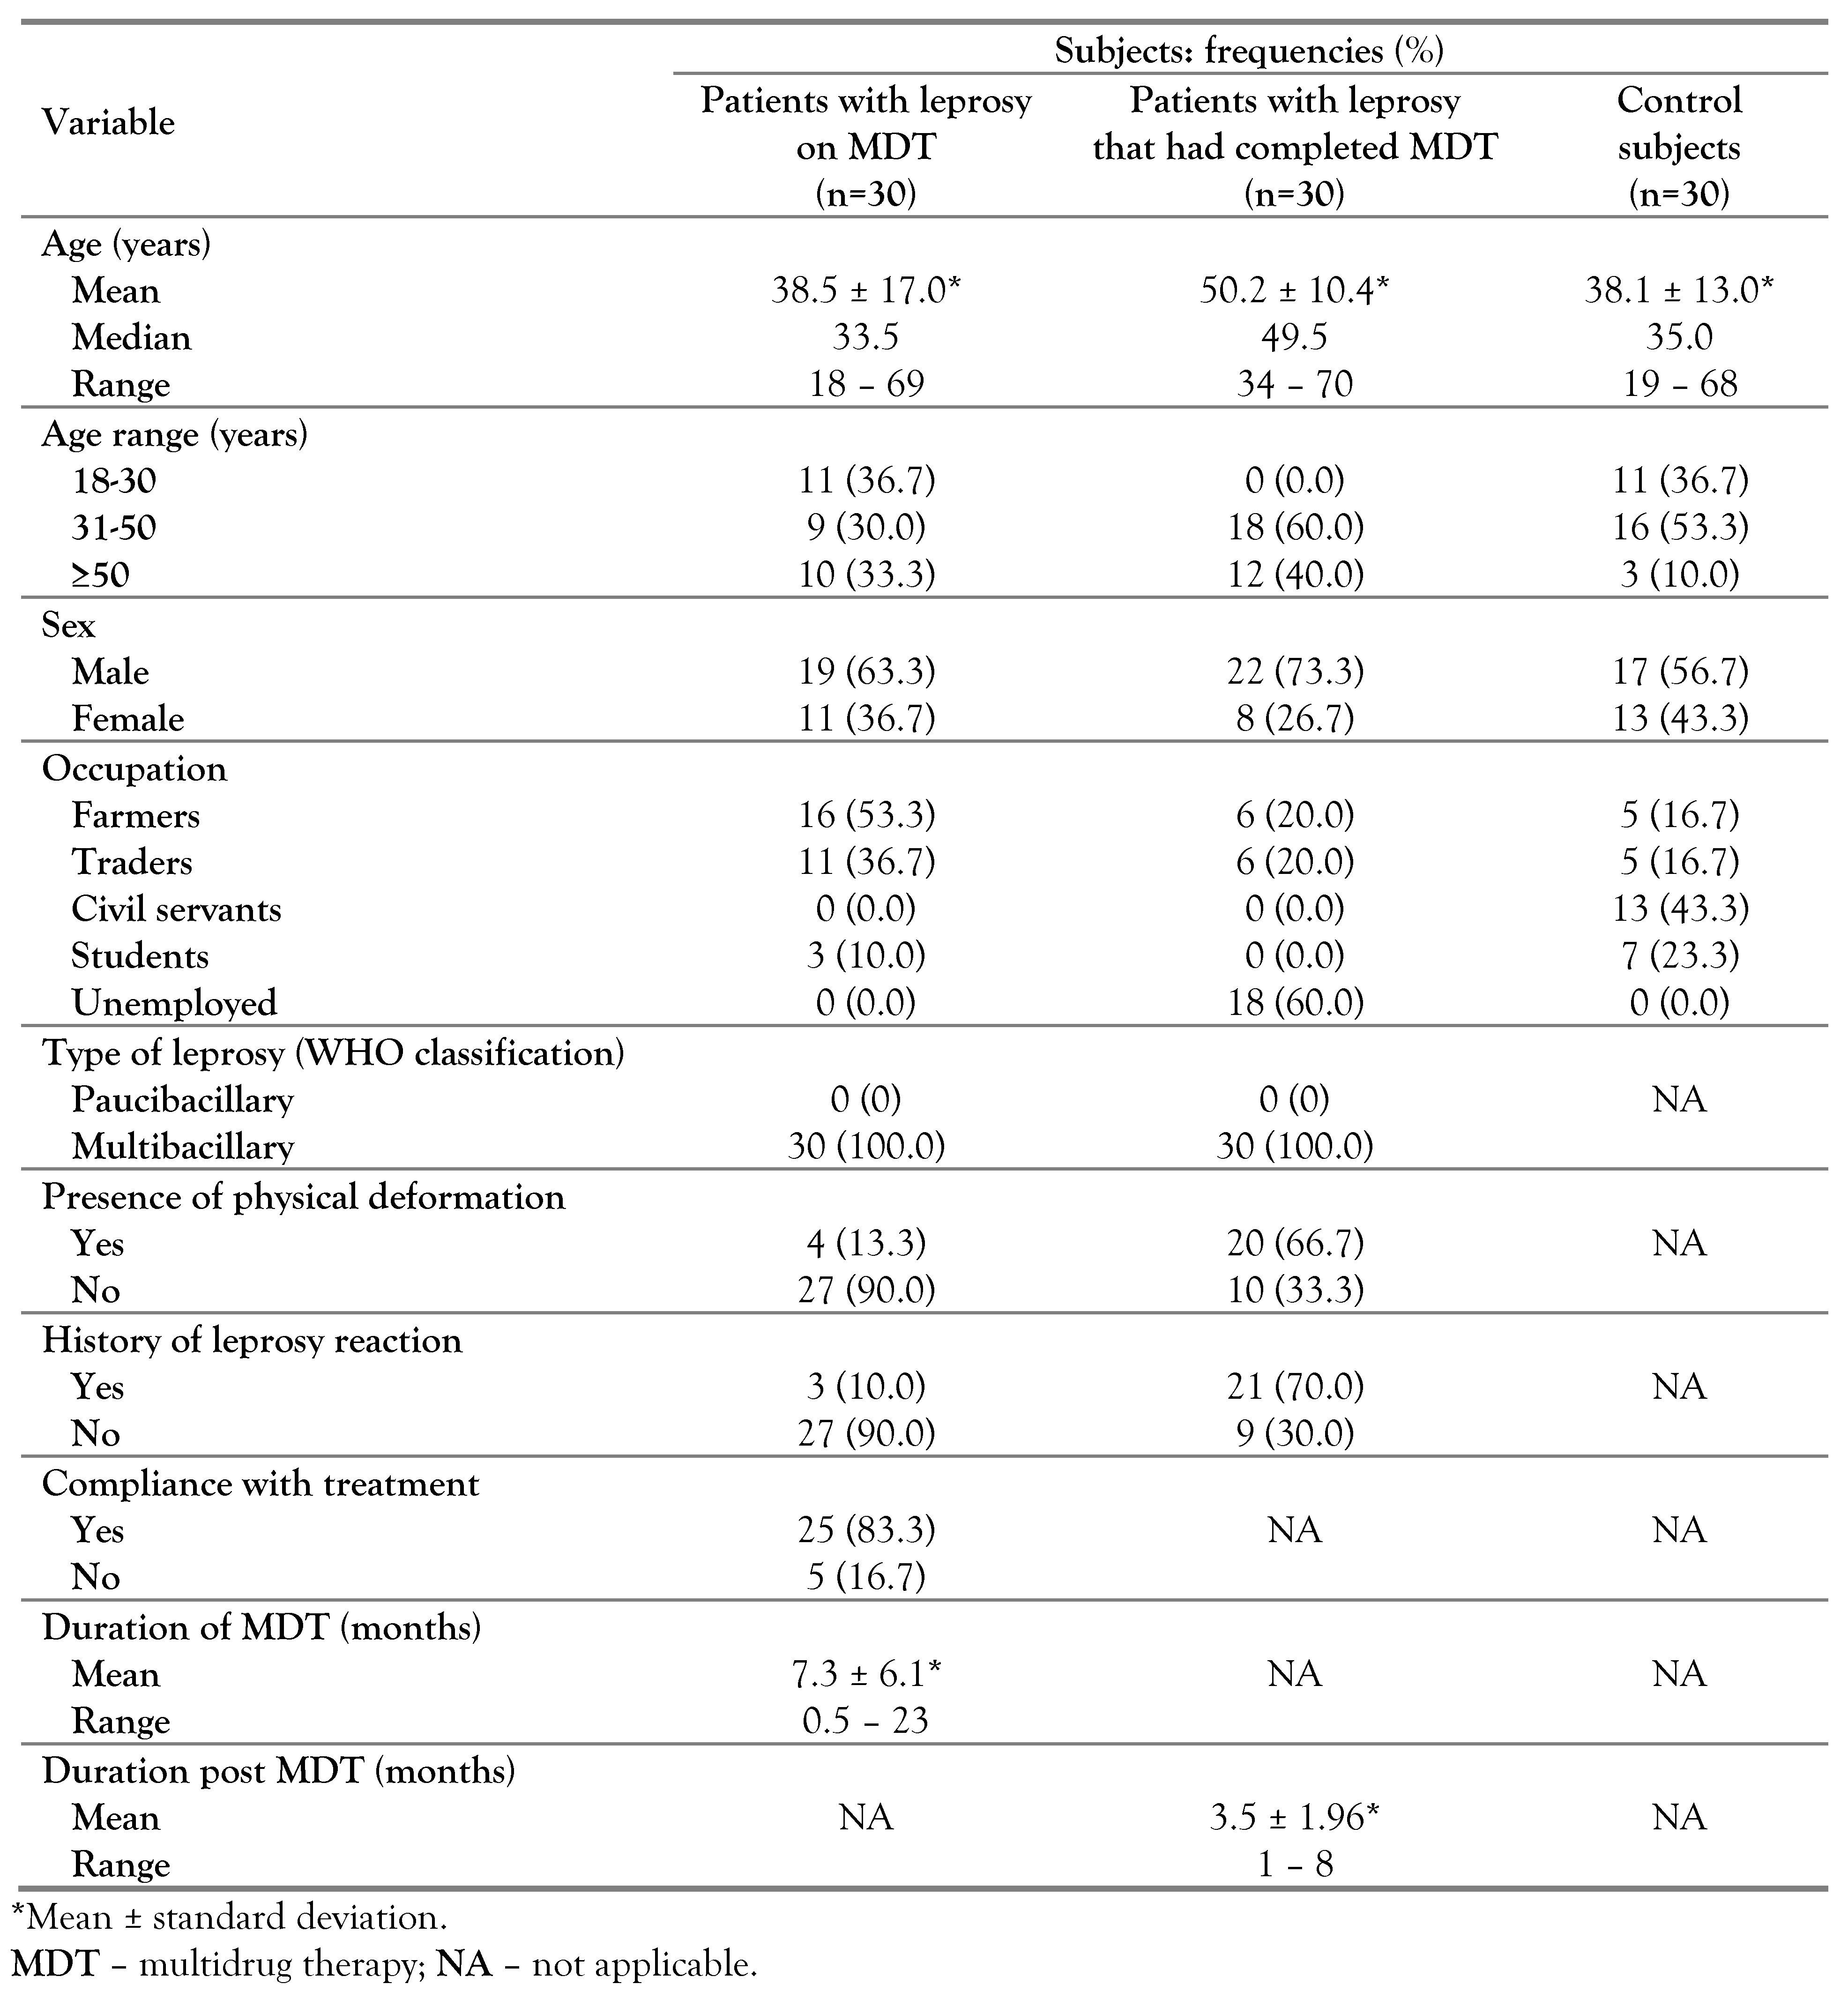
Sixty patients with leprosy and 30 apparently healthy subjects were studied. Among the patients with leprosy, 30 were on multidrug treatment while the other half had completed MDT. All the patients with leprosy were of the multibacillary type. The majority of the studied subjects were within the age range of ≥30 years of age. Males constituted the majority (68.3%) of the subjects with leprosy. The majority (95%) of the patients with leprosy were either farmers, traders or unemployed. Approximately 40% of the subjects with leprosy had leprosy reaction and physical deformation (
Table 1).
Analysis of variance showed statistically significant variations in total red blood cell count, hemoglobin concentration, total white blood cell count (TWBC), hematocrit, mean cell volume, mean cell hemoglobin concentration, red cell distribution width, absolute neutrophil count and absolute monocyte count. The red cell count, hematocrit (HCT) and absolute eosinophil count were significantly lower in the two (MDT and cMDT) leprosy categories than in the control subjects (p<0.05) while red cell distribution width (RDW), total white cell count, absolute neutrophil count and absolute monocyte counts of the two leprosy categories (MDT and cMDT) were significantly (p<0.05) higher than those of the control subjects. The hemoglobin (Hb) values of the three categories were significantly different (p<0.05) from each other, with the highest value in the control group, followed by that of the patients with leprosy on MDT, and the lowest in patients with leprosy who had completed MDT. The mean corpuscular volume (MCV) of the controls was comparable with each of the leprosy groups, while the values of the two leprosy groups differed significantly from each other (p<0.05) with lower values found among patients with leprosy who had completed MDT. The mean corpuscular hemoglobin concentration (MCHC) of controls and of cMDT were comparable (p>0.05) while both differed from the MDT group, which had lower values. The absolute lymphocyte count of patients with leprosy on MDT was comparable with that of patients with leprosy who had completed MDT and with that of controls, while both (controls and cMDT) differed from each other, with lower values in the control group. Analysis of effect size of the differing means/medians with significance showed small effect for eosinophils; medium effect for MCV, MCHC, lymphocytes; and large effect in red cell count, Hb, HCT, RDW, TWBC, neutrophils and monocytes (
Table 2).
Using the WHO cutoff for anemia (<13.0 g/dL for males and <12.0 g/dL for females), 3% of the control subjects were anemic, 53.3% and 76.7% of the patients with leprosy on MDT and those who had completed MDT, respectively were anemic. Using local reference ranges (MCV: 80-100 fL, mean corpuscular hemoglobin (MCH): 27-32 pg, RDW: 11-16%), microcytosis was observed in 3.3%, 6.7% and 30.0% of the controls, patients with leprosy on MDT and patients with leprosy who had completed treatment, respectively, while hypochromia was observed in 6.7% and 33.3% of the patients with leprosy on MDT and of the patients with leprosy who had completed MDT, respectively (
Table 3).
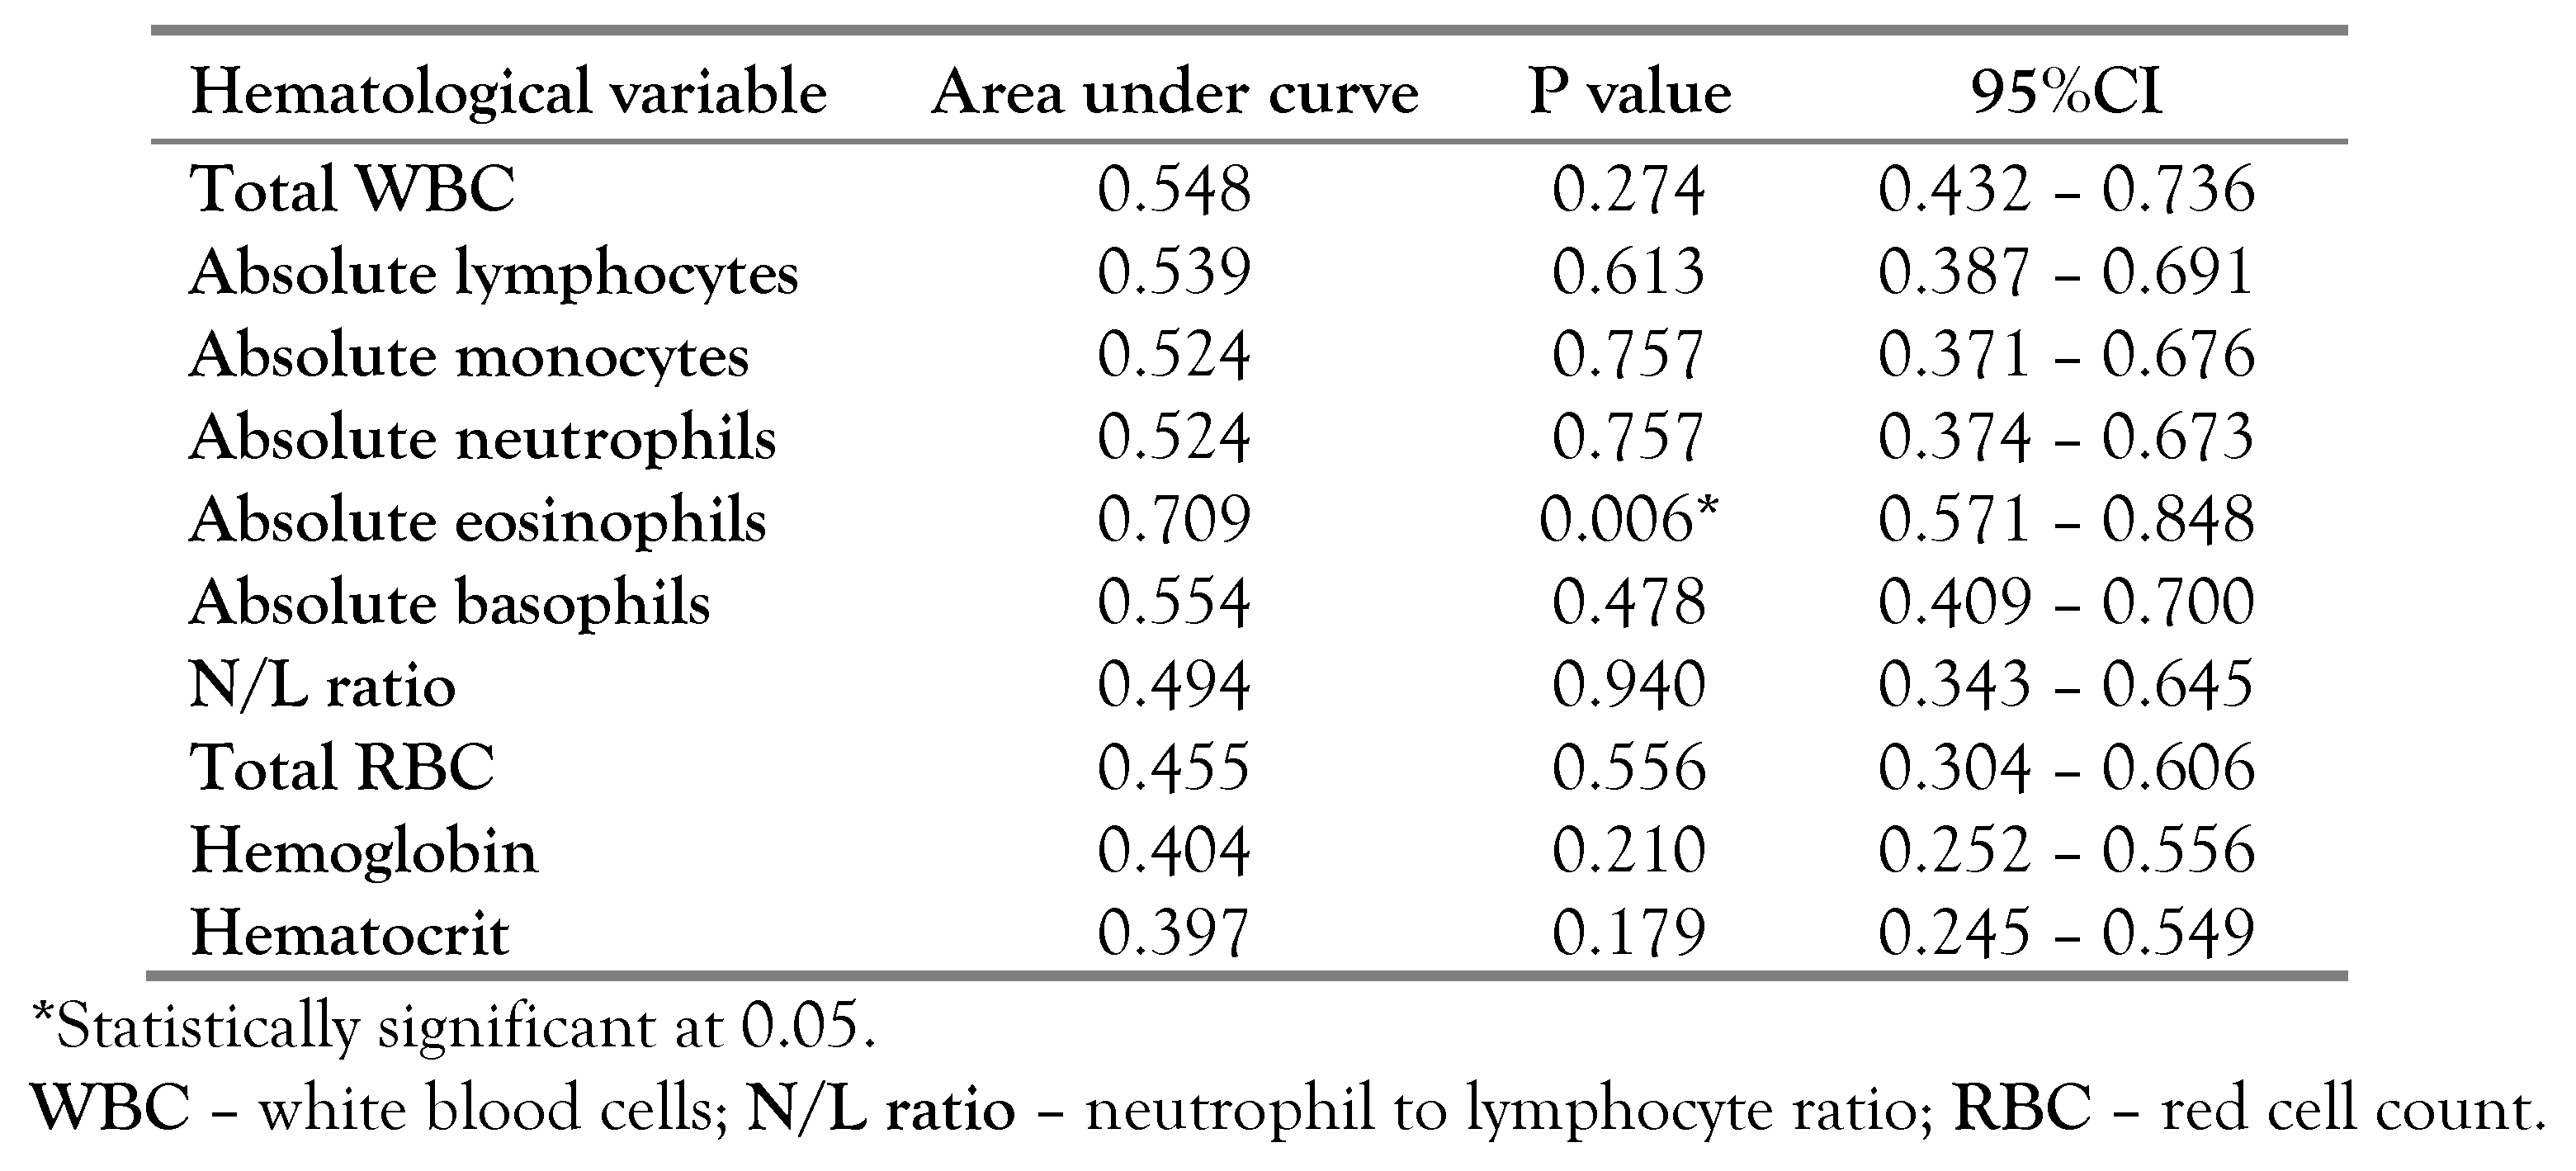
When evaluating the diagnostic relevance of hematological parameters as biomarkers for leprosy reaction, only absolute eosinophil count showed diagnostic value with AUC of 0.709 (95%CI: 0.374-0.673)—
Figure 1. The absolute eosinophil cutoff point for the diagnosis of leprosy reaction was 0.415 (sensitivity = 58.3%, specificity = 83.3%)—
Table 4.
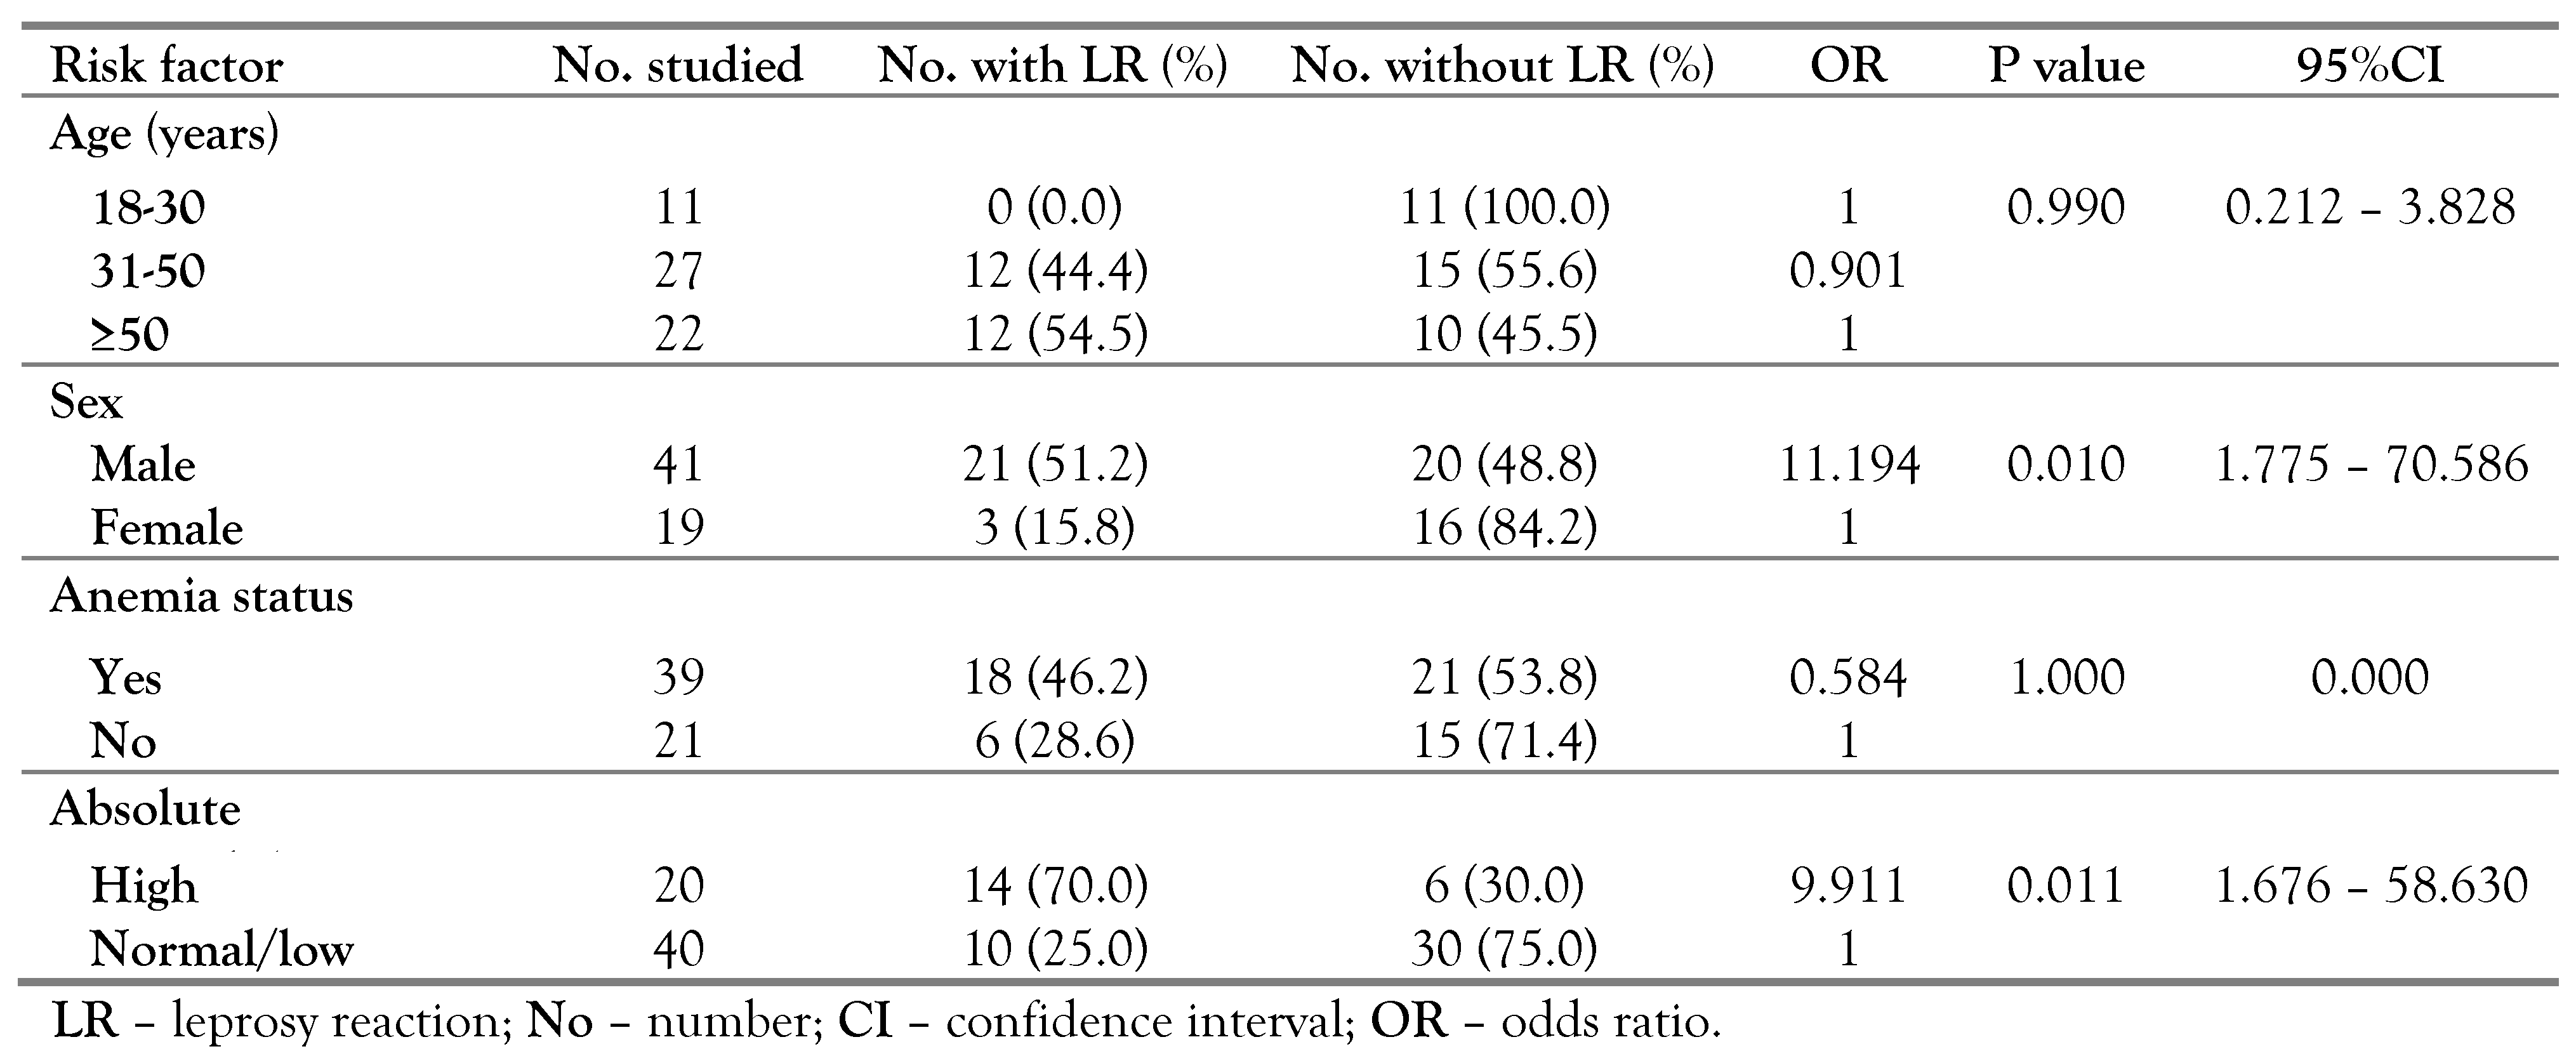
Dividing the subjects with leprosy into two subgroups: high absolute eosinophils and normal, using the cutoff value obtained from the ROC curve analysis, we observed that high absolute eosinophil count was a biomarker for leprosy reaction with those with high absolute eosinophil count having approximately 9.911 odds (1.616-56.630) of developing leprosy reaction than those with normal or low values. Similarly, male sex was associated with development of leprosy reaction with odds ratio of 11.194 (1.775-70.586)—
Table 5.
Anemia was more prevalent in patients with leprosy with and without leprosy reaction, compared to the controls. Distribution of microcytosis and hypochromia among the three groups (control, patients with leprosy with leprosy reaction and those without) were comparable (
Table S1).
Discussion
There were more males with leprosy in this study when compared to females. This trend is in consonance with an earlier report [
8]. This trend is likely due to environmental and socio-cultural factors and reflects risk of exposure rather than susceptibility to the disease [
9]. The majority of the subjects with leprosy were either farmers or unemployed. Leprosy is often referred to as a disease of poverty and is mainly endemic in the poorest areas of the world [
10]. However, the causal association between both has remained difficult to show [
10,
11]. All the patients with leprosy that had completed treatment were unemployed. This might not be unconnected to social stigmatization attached to leprosy. Integration and acceptance of treated patients with leprosy (especially those with dermal deformation) in the society is often a herculean task. All the subjects with leprosy enrolled in this study had multibacillary (MB) leprosy. Preponderance of the MB leprosy type over the paucibacillary (PB) type has been well documented [
4,
12]. This is explained by the chronic and more contagious nature of the MB leprosy type [
3].
In the present study, we observed significantly higher total red cell and hemoglobin concentration in the control subjects than in the leprosy group. While the total red cell count was significantly lower in the leprosy group than in controls irrespective of the leprosy category (on MDT or cMDT), the Hb of those who had completed MDT was significantly lower than that of those on MDT. This, together with the high prevalence of anemia seen in the cMDT group is due to protracted use of dapsone-containing MDT. Dapsone-induced hemolytic anemia has been well documented [
13,
14].
Considering the differential white cell counts, significantly higher absolute lymphocyte, neutrophil, monocyte and eosinophil counts were recorded in the leprosy group irrespective of the category, compared to the values of the controls. The production and mobilization of these cells are increased in reaction to the immunological response that accompanies leprosy.
Leprosy reaction occurs as a result of changes in the immune balance between the host and
M. leprae. They may occur during, throughout or after treatment [
15]. We observed leprosy reaction in 40% of the subjects with leprosy infection. This finding is higher than 10.37% reported in Indonesia [
16], but lower than 56.5% and 55.5% reported in Thailand [
17] and Brazil [
18], respectively.
Evaluation of hematological parameters for biomarkers showed increased eosinophils as a biomarker for the onset of leprosy reaction in patients diagnosed with leprosy. The mechanism incorporating elevated eosinophils count with leprosy reaction is not explicit to us. However, histological lesions have shown prominent infiltration of eosinophils together with neutrophils, lymphocytes and plasmocytes lodged inside the deep layers of the dermis and subcutaneous tissue superimposed on chronic multibacillary leprosy [
19]. In the large granules of eosinophils reside four highly toxic arginine-rich proteins tightly related to their function: eosinophils peroxidase (EPO), major basic protein (MBP), eosinophils protein x/eosinophils derived neurotoxin (EPD/EDV) and eosinophils cationic protein (ECP). These are cationic toxins and are capable of mediating tissue damage [
20,
21]. The diagnostic accuracy of eosinophils for leprosy reaction in this study is high, with area under curve of 0.709. This value is higher than <0.7 with low specificity in an earlier evaluation of baseline
Mycobacterium leprae (ML) flow test in predicting leprosy reaction [
18]. However, a previous study has reported neutrophil-to-lymphocyte ratio as a biomarker of onset of leprosy reaction [
4].
In the present study, we found higher eosinophil count and male sex associated with the development of leprosy reaction. This finding on sex corroborates earlier reports [
22,
23]. However, another study has pointed to a genetic background as risk factor [
24]. More so, the presence of infections, use of iodide, bromide, ofloxacin, rifampin or dapsone-based medication, hormonal alterations, pregnancy, postpartum status, breastfeeding, alcohol use, trauma, vaccination, surgical procedures and physical stress have been reported as risk factors for leprosy reactions [
25,
26].
This study has certain limitations. First, we were unable to estimate M. leprae bacterial load, which would have ascertained the persistence of infection. Also, we were not able to sample treatment-naïve subjects as this is in apposition with the hospital’s policy considering the highly contagious nature of the disease. Also, the type of leprosy reaction, time of occurrence of leprosy reaction (before or after MDT) and the clinical classification of leprosy were not documented in the case note where we extracted the diagnosis and clinical details. Although the study matched the subjects with controls, further study may be needed to rule out the interference of bowel parasites in the elevated eosinophil as observed.


