
Feasibility of the Hybrid Use of Chlorella vulgaris Culture with the Conventional Biological Treatment in Urban Wastewater Treatment Plants


Abstract
:
1. Introduction
2. Experimental
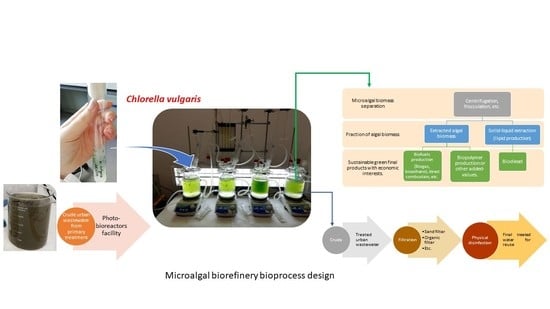
2.1. Microalga Used
2.2. Microalga Culture and Experimental Set-Up
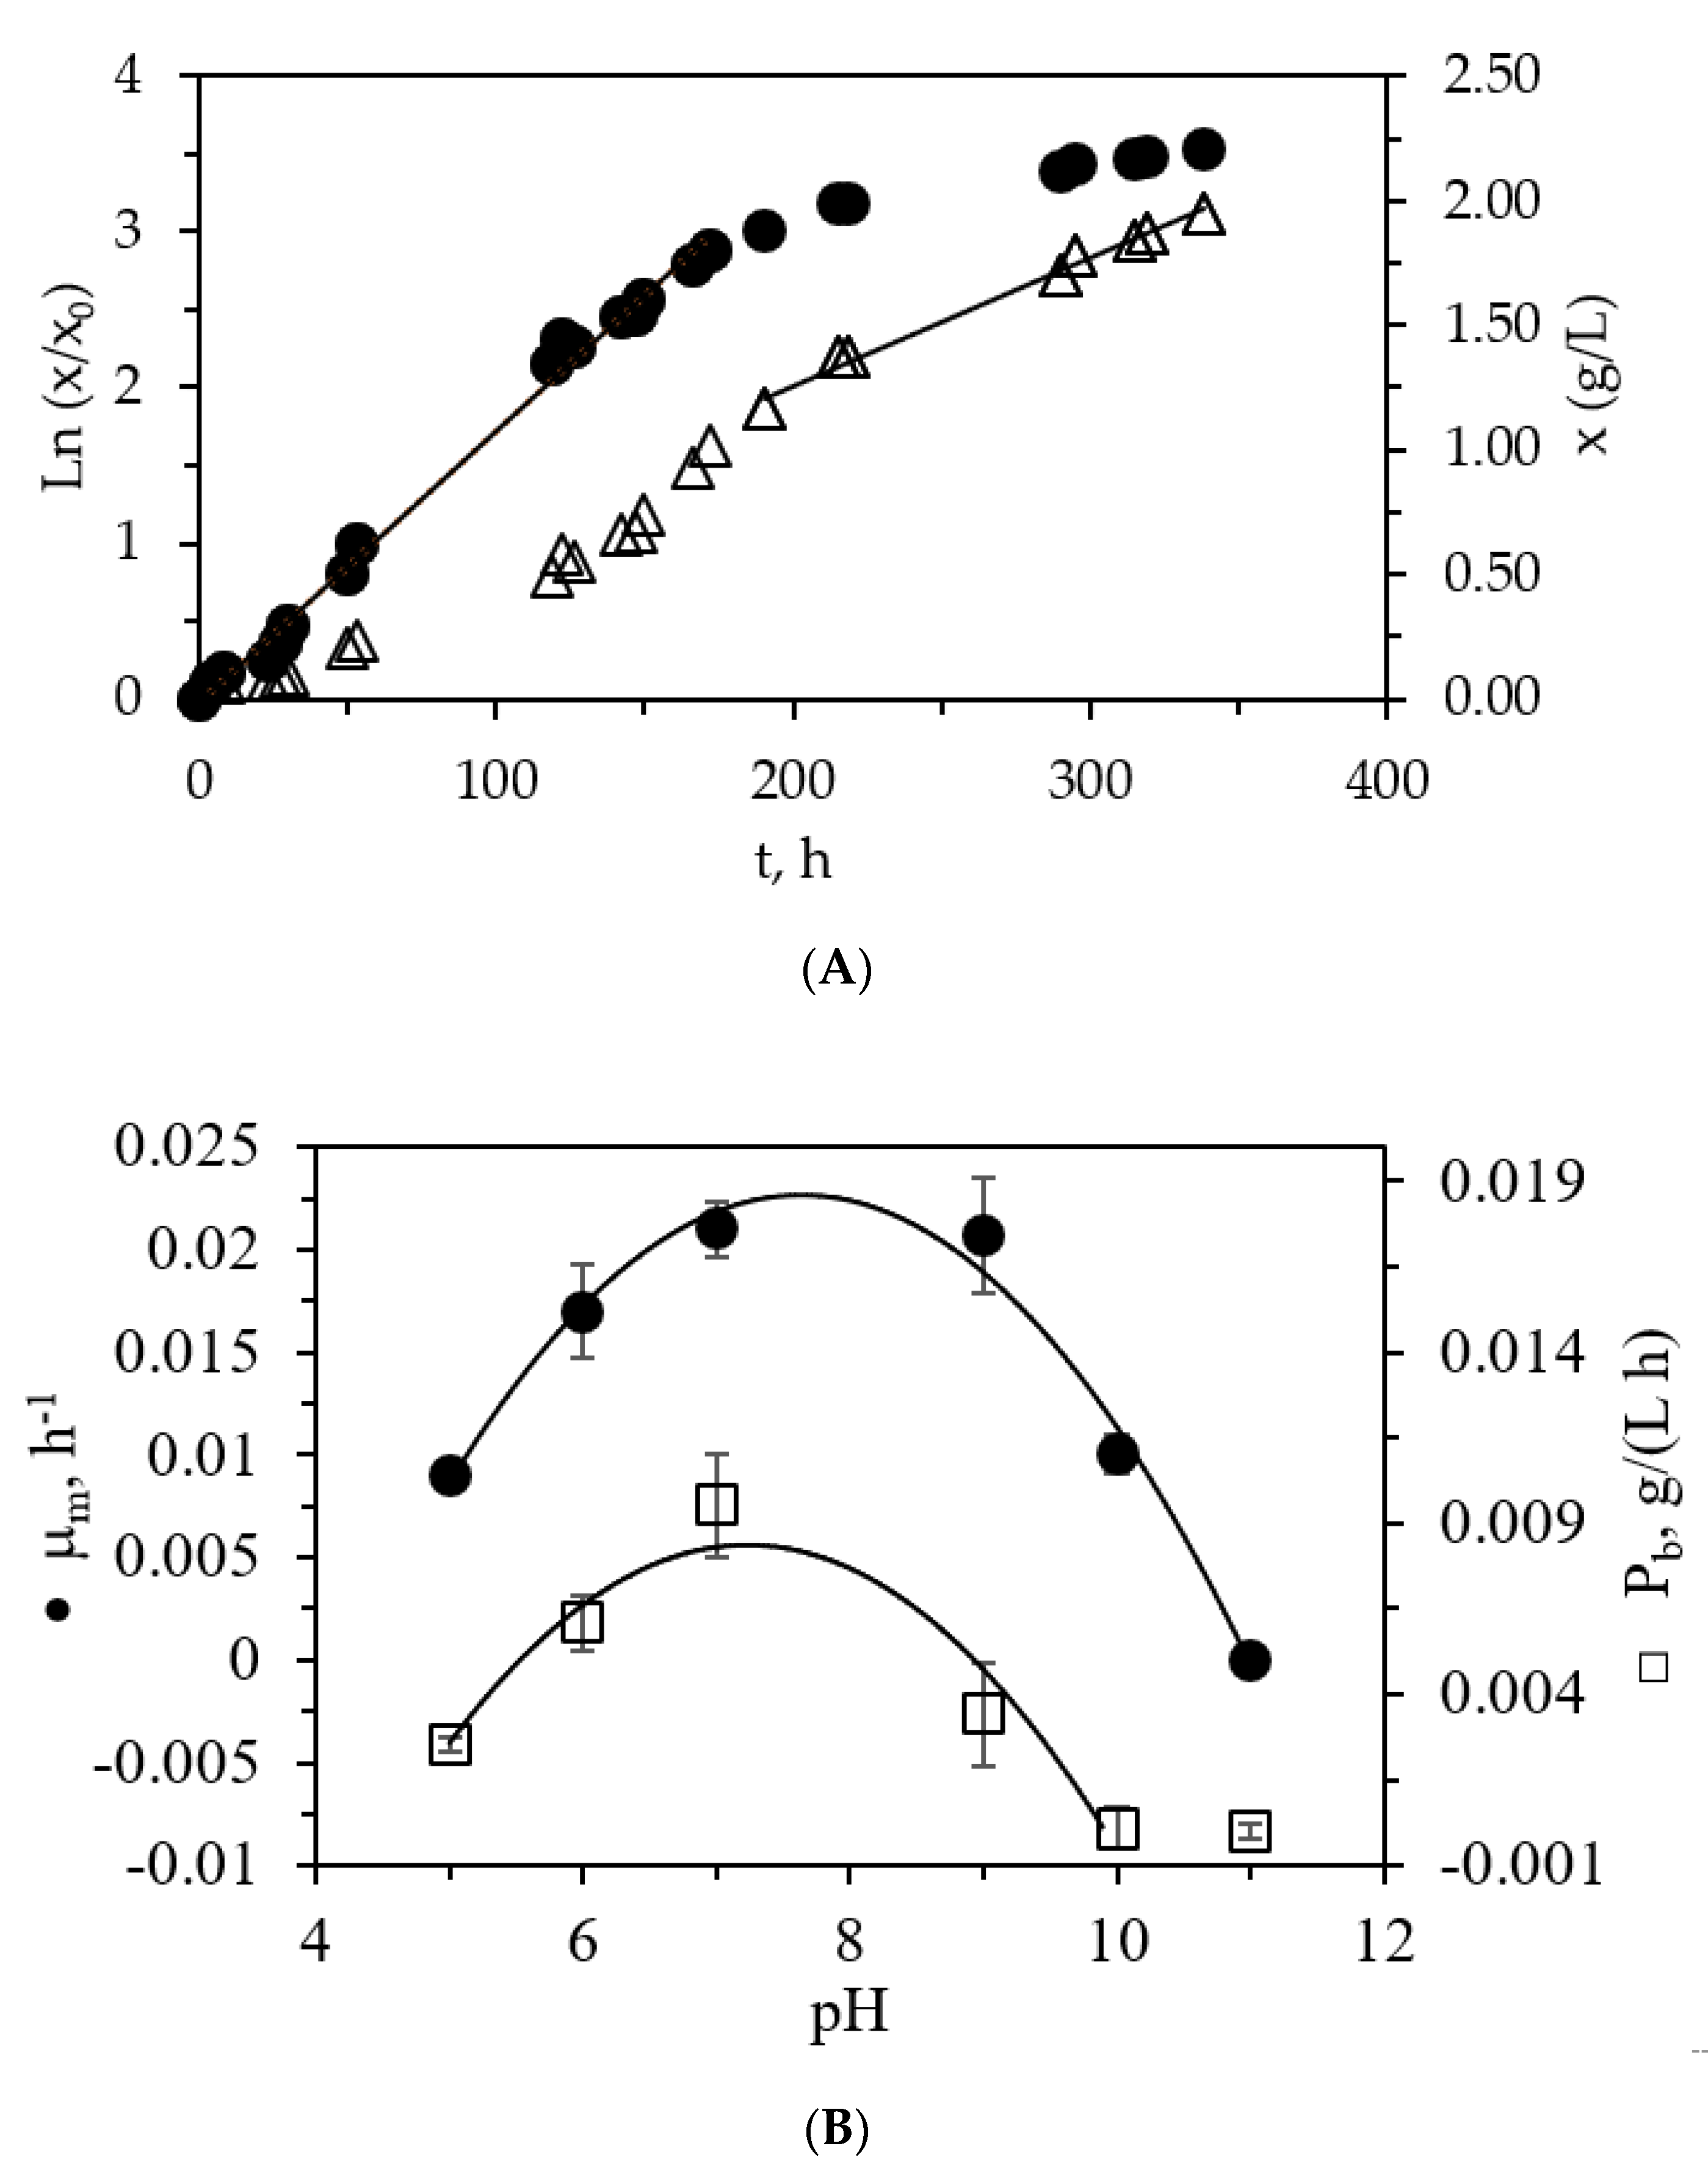
2.3. Kinetic Growth of the Microalga
2.4. Biochemical Composition of the Biomass
2.5. Analytical Methods
2.6. Statistical Analysis Applied
3. Results and Discussion
3.1. Characterization of Primary Urban Wastewater and C. vulgaris Growth
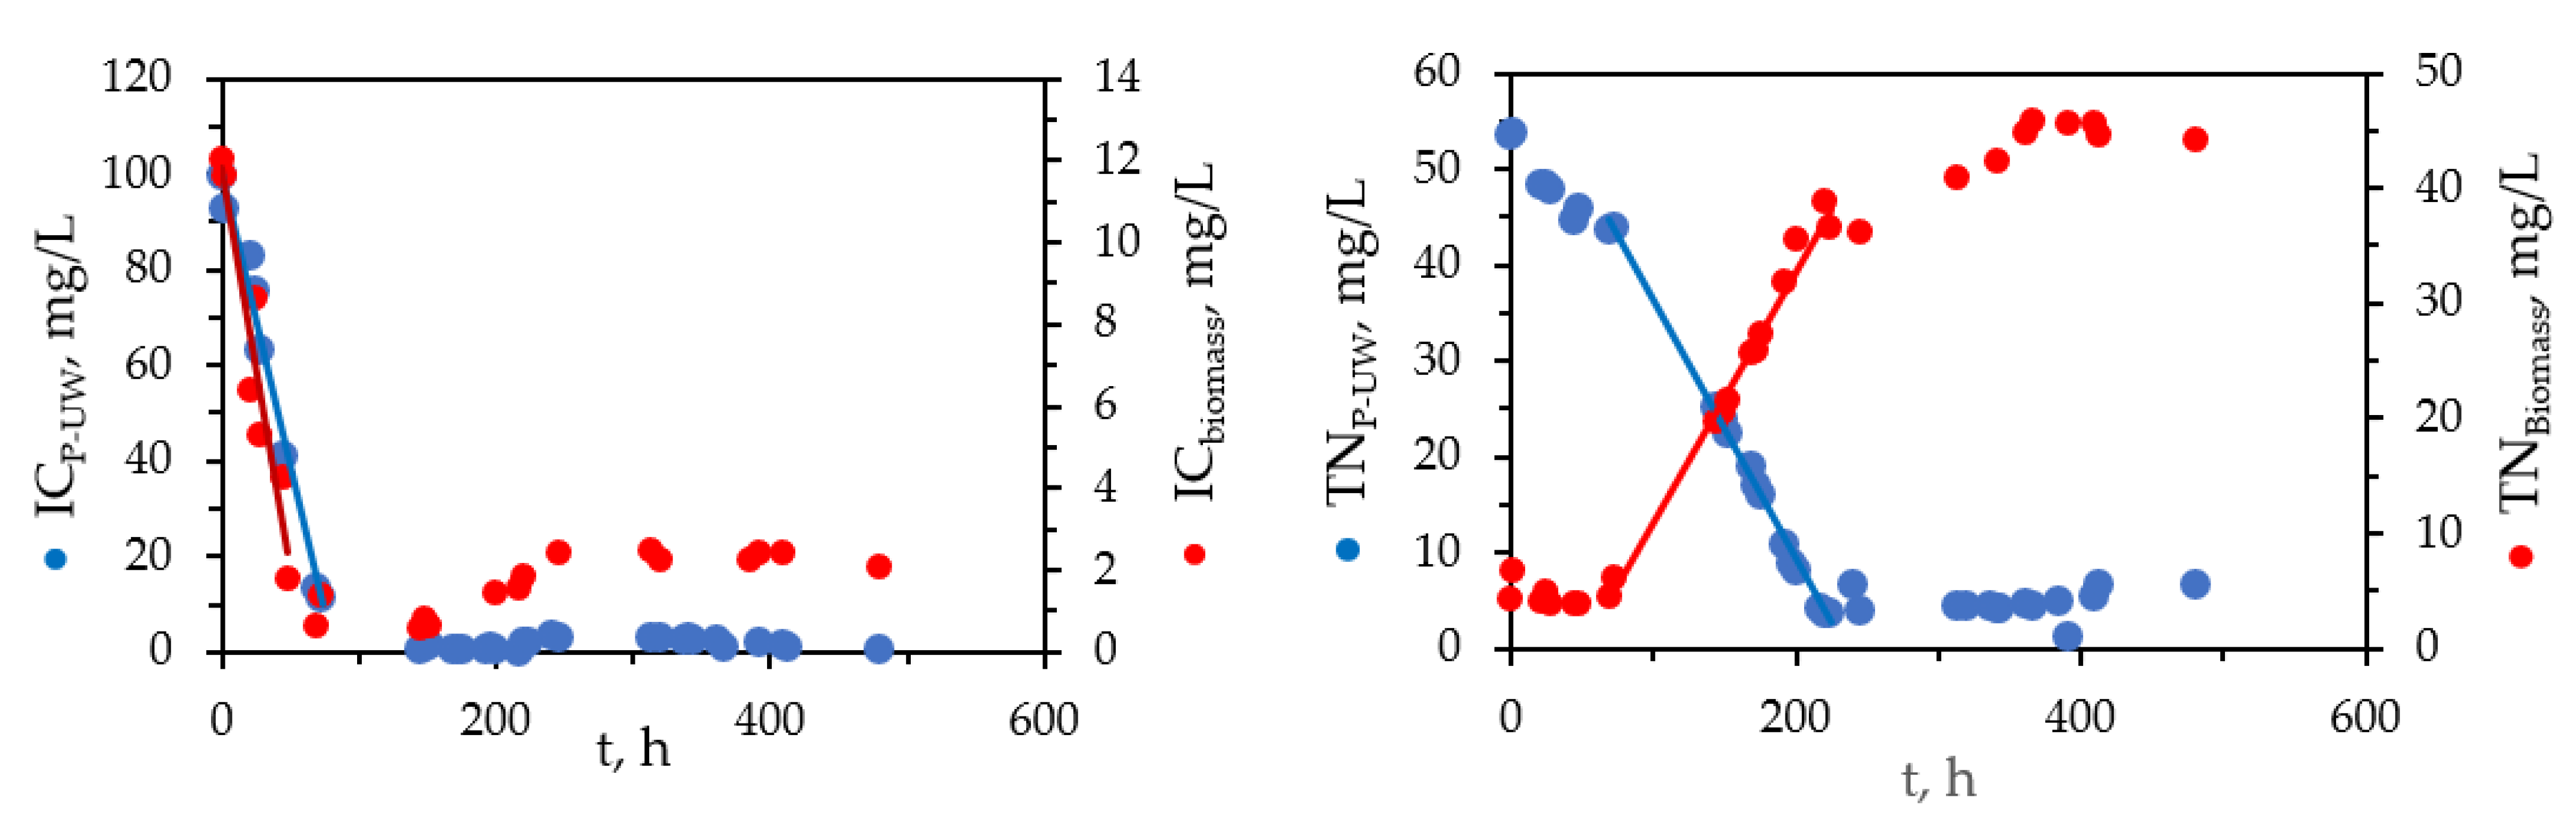
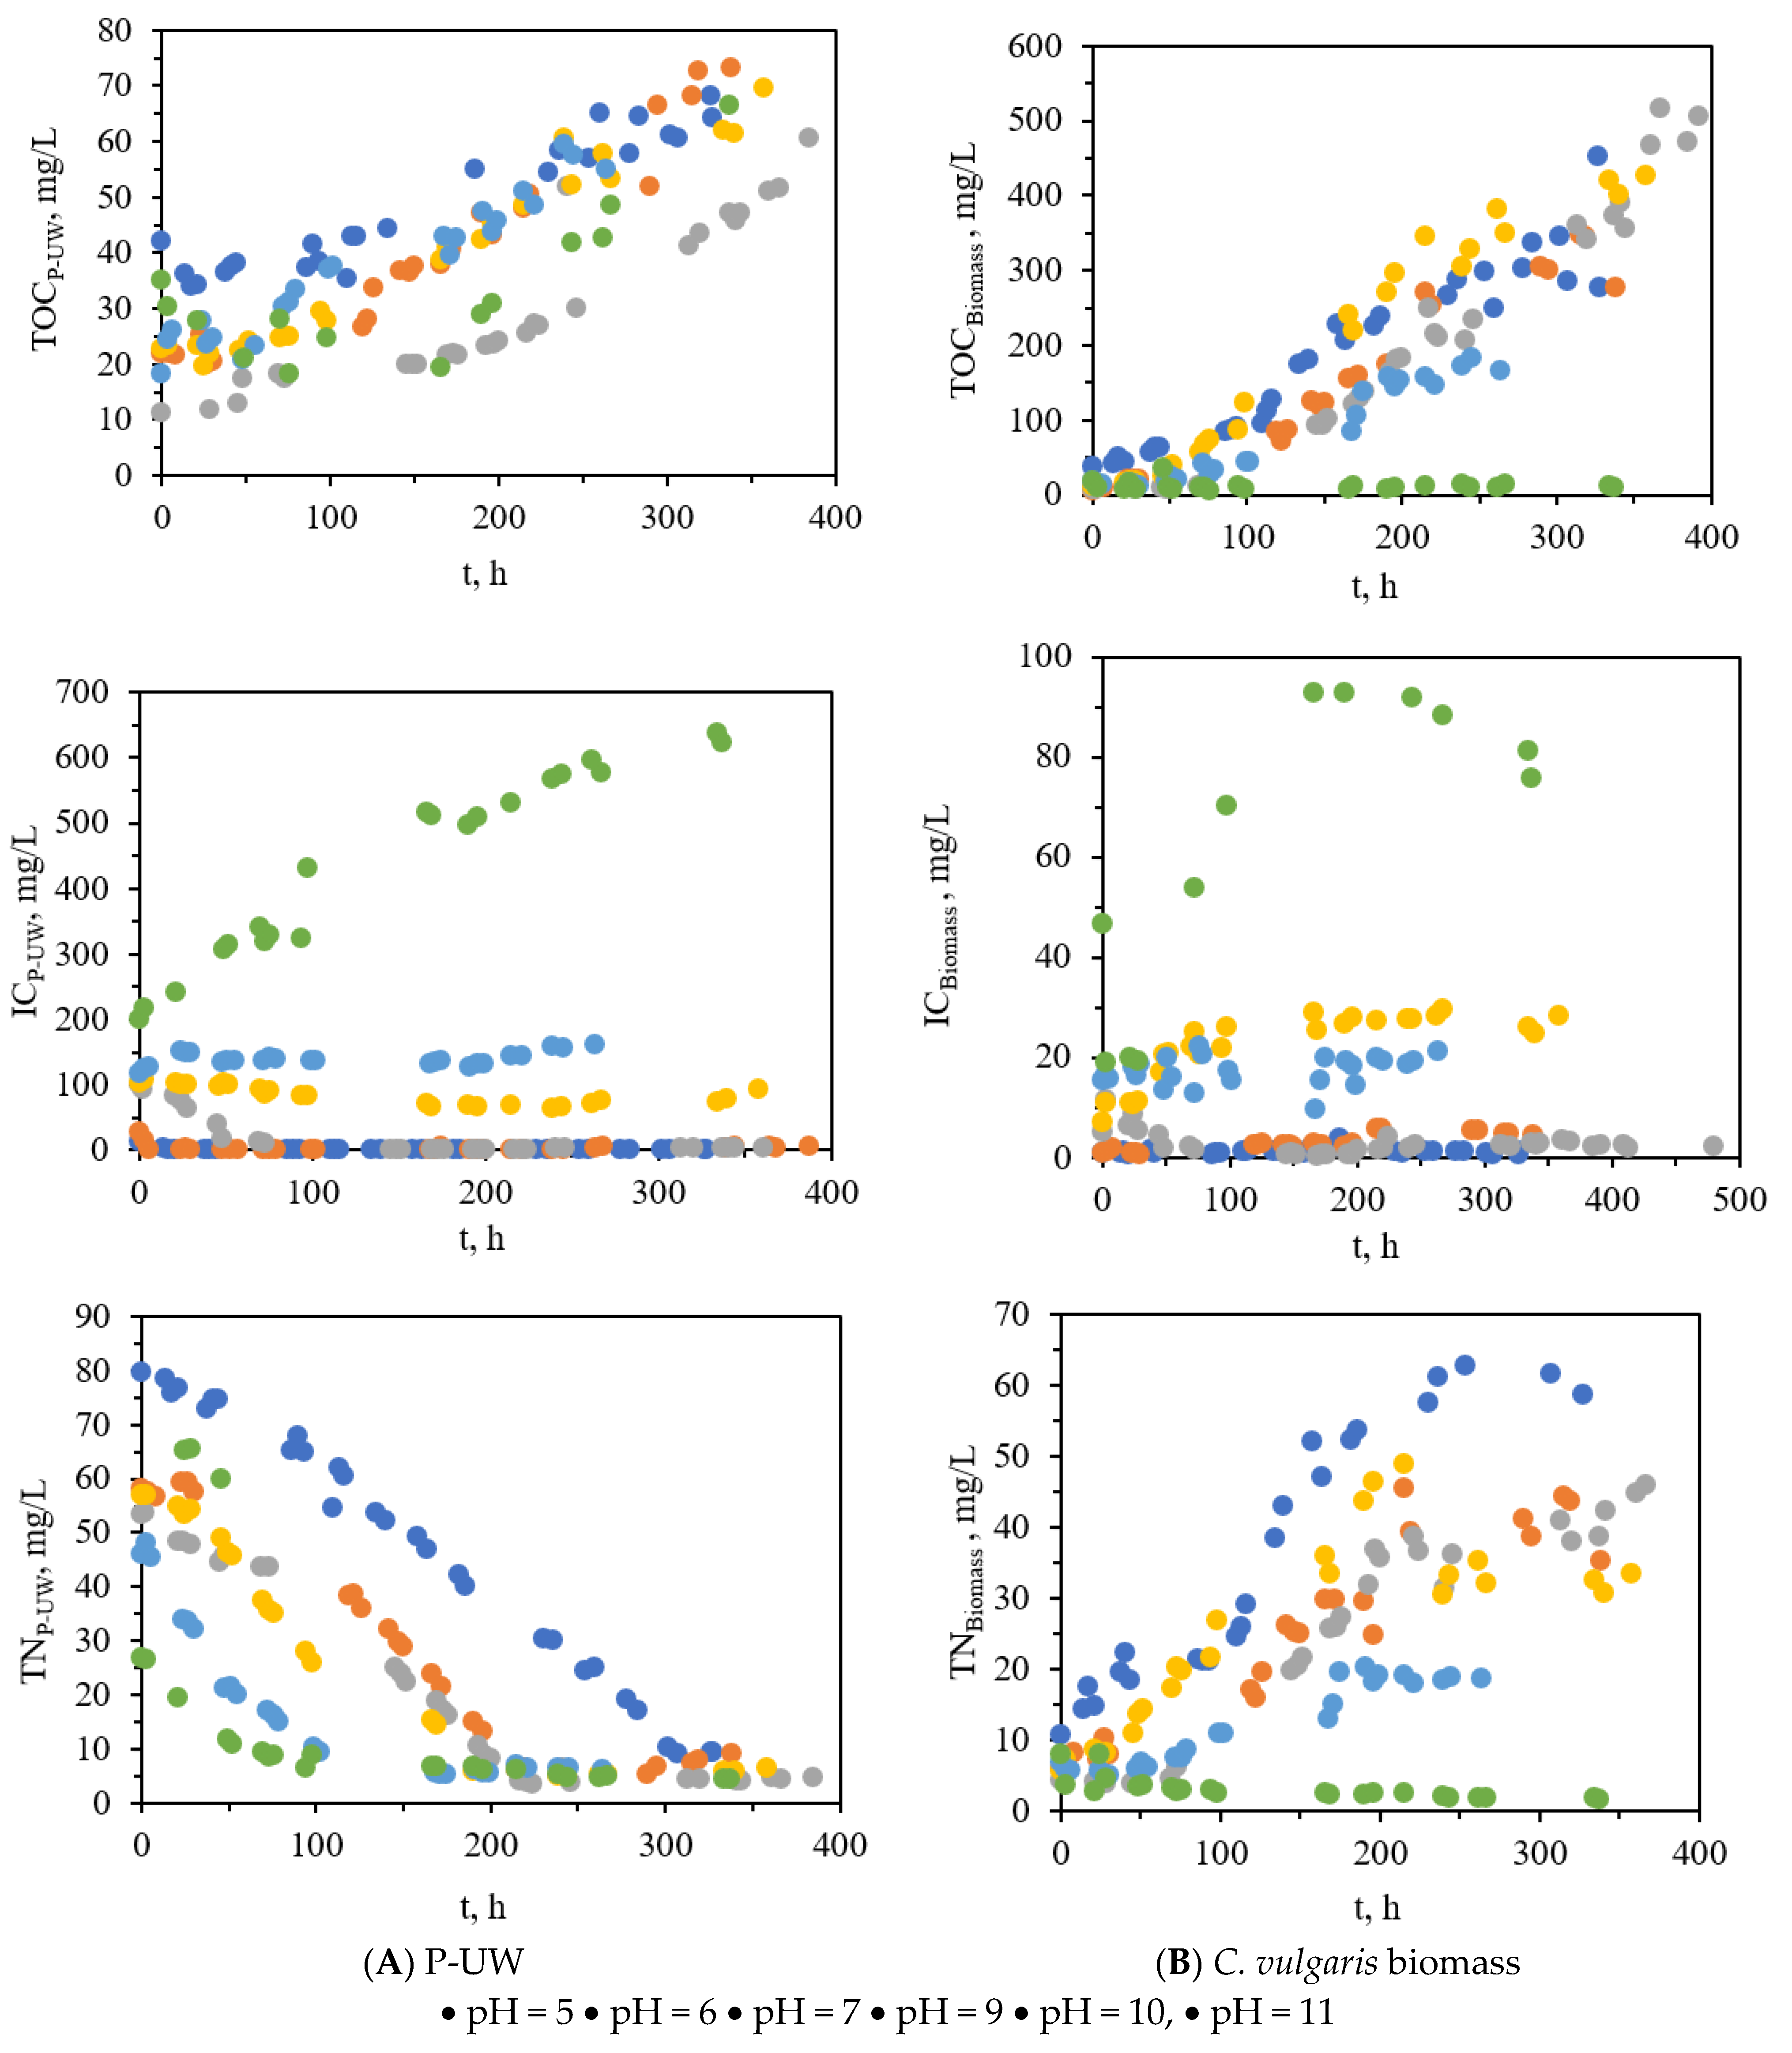
3.2. Carbon and Nitrogen Species Intercation between P-UW and C. vulgaris Biomass
3.3. P-UW Treatment by C. Vulgaris Biomass
3.4. Biochemical Composition of the Harvest Algal Biomass
4. Conclusions
Author Contributions
Funding
Institutional Review Board Statement
Informed Consent Statement
Data Availability Statement
Acknowledgments

Conflicts of Interest
Nomenclature
| A600 | Absorbance of the cell suspension at 600 nm |
| a | Parameter of Equation (1) |
| b | Parameter of Equation (2) |
| BOD5 | Biological oxygen demand during 5 days at 20 °C, mg O2/L |
| COD | Chemical oxygen demand, mg O2/L |
| D.M. | Dry matter |
| %ESE | Percentage of essential fatty acids, C16:3n4, C20:5n3, C22:6n3, C18:2n6, and C18:3n3. |
| IC | Inorganic carbon, mg/L |
| Io | Initial light intensity, µE m−2 s−1 |
| Pb | Volumetric biomass productivity determined at deacceleration phase of growth, g/(L h) |
| T | Temperature, °C |
| TC | Total carbon content, mg/L |
| TN | Total nitrogen content, mg/L |
| TOC | Total organic carbon content, mg/L |
| t | Time, h |
| UW | Urban wastewater |
| P-UW | Wastewater collected at the outlet of the settling tank in the primary treatment |
| WWTPs | Wastewater treatment plants |
| x | Biomass concentration, g/L |
| xo | Initial biomass concentration at the beginning of the experiment t = 0 h, g/L |
| αo | Parameter of Moser model Equation (4) |
| α1 | Parameter of Moser model Equation (4) |
| α2 | Parameter of Moser model Equation (4) |
| µm | Maximum specific growth rate determined at exponential phase of growth, h−1 |
References
- Gosling, S.N.; Arnell, N.W. A global assessment of the impact of climate change on water scarcity. Clim. Chang. 2016, 134, 371–385. [Google Scholar] [CrossRef] [Green Version]
- Mekonnen, M.M.; Hoekstra, A.Y. Four billion people facing severe water scarcity. Sci. Adv. 2016, 2, e1500323. [Google Scholar] [CrossRef] [Green Version]
- Udaiyappan, A.F.M.; Abu Hasan, H.; Takkriff, M.S.; Abdullah, S.R.S. A review of the potentials, challenges and current status of microalgae biomass applications in industrial wastewater treatment. J. Water Process. Eng. 2017, 20, 8–21. [Google Scholar] [CrossRef]
- Hodaifa, G.; Sánchez, S.; Martínez, M.E.; Órpez, R. Biomass production of Scenedesmus obliquus from mixtures of urban and olive-oil mill wastewaters used as culture medium. Appl. Energy 2013, 104, 345–352. [Google Scholar] [CrossRef]
- Henze, M.; Comeau, Y. Wastewater Characteristics. In Biological Wastewater Treatment: Principles, Modelling and Design; Henze, M., Loosdrecht, M.C.M., Ekama, G.A., Brdjanovic, D., Eds.; IWA Publishing: London, UK, 2008; pp. 33–52. [Google Scholar]
- Cai, L.; Zhang, T. Detecting Human Bacterial Pathogens in Wastewater Treatment Plants by a High-Throughput Shotgun Sequencing Technique. Environ. Sci. Technol. 2013, 47, 5433–5441. [Google Scholar] [CrossRef] [PubMed]
- Abdel-Raouf, N.; Al-Homaidan, A.A.; Ibraheem, I.B.M. Microalgae and wastewater treatment. Saudi J. Biol. Sci. 2012, 19, 257–275. [Google Scholar] [CrossRef] [PubMed] [Green Version]
- Salgot, M.; Huertas, E.; Weber, S.; Dott, W.; Hollender, J. Wastewater reuse and risk: Definition of key objectives. Desalination 2006, 187, 29–40. [Google Scholar] [CrossRef]
- EEC. Regulation (EU) (2020/741) of the European Parliament and of the Council of 25 May 2020 on Minimum Requirements for Water Reuse. 2020. Available online: https://eur-lex.europa.eu/legal-content/EN/TXT/PDF/?uri=CELEX:32020R0741&from=EN (accessed on 20 May 2021).
- EEC. Directive 2000/60/EC of the European Parliament and of the Council of 23 October 2000 Establishing a Framework for Community Action in the Field of Water Policy; Official Journal L 327, 22/12/2000 P. 0001-0073. 2000. Available online: https://eur-lex.europa.eu/legal-content/EN/TXT/?uri=CELEX:32000L0060 (accessed on 25 May 2021).
- Mata, T.M.; Martins, A.; Caetano, N. Microalgae for biodiesel production and other applications: A review. Renew. Sustain. Energy Rev. 2010, 14, 217–232. [Google Scholar] [CrossRef] [Green Version]
- Yen, H.W.; Sun, C.H.; Ma, T.W. The comparison of lutein production by Scenesdesmus sp. in the autotrophic and the mixotrophic cultivation. Appl. Biochem. Biotechnol. 2011, 164, 353–361. [Google Scholar] [CrossRef]
- TMR (Transparency Market Research), Web-Page. Available online: https://www.transparencymarketresearch.com/pressrelease/algae-market.htm (accessed on 13 May 2021).
- Arbib, Z.; Ruiz, J.; Álvarez-Díaz, P.; Garrido-Pérez, C.; Barragan, J.; Perales, J.A. Effect of pH control by means of flue gas addition on three different photo-bioreactors treating urban wastewater in long-term Operation. Ecol. Eng. 2013, 57, 226–235. [Google Scholar] [CrossRef]
- Hodaifa, G.; Malvis, A.; Maaitah, M.; Sánchez, S. Combination of physicochemical operations and algal culture as a new bioprocess for olive mill wastewater treatment. Biomass Bioenergy 2020, 138, 105603. [Google Scholar] [CrossRef]
- Malvis, A.; Hodaifa, G.; Halioui, M.; Seyedsalehi, M.; Sánchez, S. Integrated process for olive oil mill wastewater treatment and its revalorization through the generation of high added value algal biomass. Water Res. 2019, 151, 332–342. [Google Scholar] [CrossRef] [PubMed]
- Maaitah, M.; Hodaifa, G.; Malvis, A.; Sánchez, S. Kinetic growth and biochemical composition variability of Chlorella pyrenoidosa in olive oil washing wastewater cultures enriched with urban wastewater. J. Water Proc. Eng. 2020, 35, 101197. [Google Scholar] [CrossRef]
- Goncalves, E.C.; Wilkie, A.C.; Kirst, M.; Rathinasabapathi, B. Metabolic regulation of triacylglycerol accumulation in the green algae: Identification of potential targets for engineering to improve oil yield. Plant Biotechnol. J. 2016, 14, 1–12. [Google Scholar] [CrossRef]
- Spolaore, P.; Cassan, C.J.; Duran, E.; Isambert, A. Commercial application of microalgae. J. Biosci. Bioeng. 2006, 101, 87–96. [Google Scholar] [CrossRef] [Green Version]
- Sakarika, M.; Kornaros, M. Kinetics of growth and lipids accumulation in Chlorella vulgaris during batch heterotrophic cultivation: Effect of different nutrient limitation strategies. Bioresour. Technol. 2017, 243, 356–365. [Google Scholar] [CrossRef]
- Rodríguez-López, M. Influence of the Inoculum and the Medium on the Growth of Chlorella pyrenoidosa. Nature 1964, 203, 666–667. [Google Scholar] [CrossRef]
- Camacho, F.; Martínez, M.E.; Sánchez, S.; Pérez, A.D. Influence of pH on the kinetic and yield parameters of Scenedesmus obliquus heterotrophic growth. Process. Biochem 1989, 40, 133–136. [Google Scholar]
- Jeffrey, S.W.; Humphrey, G.F. New spectrophotometric equations for determining chlorophylls a, b, c1 and c2 in higher plants, algae and natural phytoplankton. Biochem. Physiol. Pflanz. 1975, 167, 191–194. [Google Scholar] [CrossRef]
- Strickland, J.D.H.; Parsons, T.R. A Practical Handbook of Seawater Analysis; Bulletin 167; Fisheries Research Board of Canada: Ottawa, ON, Canada, 1968; p. 311. [Google Scholar]
- Becker, E.W. Microalgae: Biotechnology and Microbiology, 1st ed.; Cambridge University Press: Cambridge, MA, USA; New York, NY, USA, 1994. [Google Scholar]
- Milner, H.W. The chemical composition of algae. In Algal Culture from Laboratory to Pilot Plant; Burlew, J.S., Ed.; Carnegie Institution of Washington Publication 600: Washington, DC, USA, 1953; pp. 285–302. [Google Scholar]
- Lepage, G.; Roy, C.C. Improved recovery of fatty acid through direct transesterification without prior extraction or purification. J. Lipid Res. 1984, 25, 1391–1396. [Google Scholar] [CrossRef]
- ISO 8466-1. Water quality-Calibration and Evaluation of Analytical Methods and Estimation of Performance Characteristics—Part 1: Statistical Evaluation of the Linear Calibration Function; ISO: Genève, Switzerland, 1990. [Google Scholar]
- DIN 38402 A51. German Standard Methods for the Examination of Water, Waste Water and Sludge; General Information (Group A); Calibration of Analytical Methods, Evaluation of Analytical Results and Linear Calibration Functions Used to Determine the Performance Characteristics of Analytical Methods (A 51); Deutsches Institut für Normung (DIN): Berlin, Germany, 1986. [Google Scholar]
- DIN 38409-41. German Standard Methods for Examination of Water, Waste Water and Sludge; Summary Action and Material Characteristic Parameters (Group H); Determination of the Chemical Oxygen Demand (COD) in the Range over 15 mg/l (H41); Deutsches Institut für Normung (DIN): Berlin, Germany, 1980. [Google Scholar]
- Moser, H. The Dynamic of Bacterial Populations Maintained in the Chemostat; Publication 614; The Carnegie Institution: Washington, DC, USA, 1958; p. 136. [Google Scholar]
- Mayo, A.W. Effects of temperature and pH on the kinetic growth of unialga Chlorella vulgaris cultures containing bacteria. Water Environ. Res. 1997, 69, 64–72. [Google Scholar] [CrossRef]
- Rachlin, J.W.; Grosso, A. The effects of pH on the growth of Chlorella vulgaris and Its Interactions with cadmium toxicity. Arch. Environ. Contam. Toxicol. 1991, 20, 505–508. [Google Scholar] [CrossRef]
- Bold, H.C. Morphology of Chlamydomonas chlamydogama sp. Nov. Bull. Torr. Bot. Club 1949, 76, 101–108. [Google Scholar] [CrossRef]
- Blanco, G.C.; Stablein, M.J.; Tommaso, G. Cultivation of Chlorella vulgaris in anaerobically digested gelatin industry wastewater. Water Supply 2021, 21, 1953–1965. [Google Scholar] [CrossRef]
- Stein, J. (Ed.) Handbook of Phycological Methods: Culture Methods and Growth Measurements; Cambridge University Press: London, UK, 1973; p. 448. [Google Scholar]
- Mackie, G.L. Tolerances of five benthic invertebrates to hydrogen ions and metals (Cd, Pb, A1). Arch. Environ. Contam. Toxicol. 1989, 18, 215–223. [Google Scholar] [CrossRef]
- Chen, C.Y.; Yeh, K.L.; Aisyah, R.; Lee, D.J.; Chang, J.S. Cultivation, photobioreactor design and harvesting of microalgae for biodiesel production: A critical review. Bioresour. Technol. 2011, 102, 71–81. [Google Scholar] [CrossRef]
- Chen, F. High cell density culture of microalgae in heterotrophic growth. Trends Biotechnol. 1996, 14, 412–426. [Google Scholar] [CrossRef]
- Perez-Garcia, O.; Escalante, F.M.E.; de-Bashan, L.E.; Bashan, Y. Heterotrophic cultures of microalgae: Metabolism and potential products. Water Res. 2011, 45, 11–36. [Google Scholar] [CrossRef]
- Perez-Garcia, O.; Bashan, Y.; Esther Puente, M. Organic carbon supplementation of sterilized municipal wastewater is essential for heterotrophic growth and removing ammonium by the microalga Chlorella vulgaris. J. Phycol. 2011, 47, 190–199. [Google Scholar] [CrossRef] [PubMed]
- Hu, B.; Min, M.; Zhou, W.; Du, Z.; Mohr, M.; Chen, P.; Zhu, J.; Cheng, Y.; Liu, Y.; Ruan, R. Enhanced mixotrophic growth of microalga Chlorella sp. on pretreated swine manure for simultaneous biofuel feedstock production and nutrient removal. Bioresour. Technol. 2012, 126, 71–79. [Google Scholar] [CrossRef] [PubMed]
- EEC. Council Directive of 21 May 1991 Concerning Urban Waste Water Treatment. (91/271/EEC). No L 135/40. Off. J. Eur. Communitie L 135/40. 30 May 1991. Available online: https://eur-lex.europa.eu/legal-content/EN/TXT/PDF/?uri=CELEX:31991L0271&from=ES (accessed on 4 June 2021).
- Sharma, P.; Slathia, P.S.; Raina, N.; Bhagat, D. Microbial diversity in freshwater ecosystems and its industrial potential. In Freshwater Microbiology Perspectives of Bacterial Dynamics in Lake Ecosystems, 1st ed.; Bandh, S., Ed.; Elsevier: Amsterdam, The Netherlands; Academic Press: London, UK, 2019; pp. 341–392. [Google Scholar] [CrossRef]
- Nakanishi, K.; Deuchi, K. Culture of a high-chlorophyll-producing and halotolerant Chlorella vulgaris. J. Biosci. Bioeng. 2014, 117, 617–619. [Google Scholar] [CrossRef] [PubMed]
- Sakarika, M.; Kornaros, M. Effect of pH on growth and lipid accumulation kinetics of the microalga Chlorella vulgaris grown heterotrophically under sulfur limitation. Bioresour. Technol. 2016, 219, 694–701. [Google Scholar] [CrossRef] [PubMed]


| Parameter | Tap Water | P-UW | UW Treated by Chlorella vulgaris at Different pH Values | Control Experiment | |||||
|---|---|---|---|---|---|---|---|---|---|
| 5 | 6 | 7 | 9 | 10 | 11 | UW-Aeration 1 | |||
| pH | 6.85 | 6.86 | 4.63 | 6.03 | 7.42 | 9.3 | 9.99 | 10.5 | 9.3 |
| Conductivity, µS/cm | 0.00256 | 1505 | 1600 | 1780 | 1956 | 2000 | 1998 | 1990 | 2010 |
| Turbidity, FTU | 1.19 | 69 | 7.7 | 5.59 | 5.48 | 5.57 | 6.07 | 5.93 | 9.71 |
| COD, mg O2/L | 0.00 | 283.8 | 192 | 297 | 204 | 104 | 125 | 3.57 | – 2 |
| BOD5, mgO2/L | ND 3 | 81.5 | 5.34 | 6.84 | 6 | 6.42 | 6.94 | 0.67 | 0.01 |
| Disolved O2, mg O2/L | 8.2 | 3.07 | 8.01 | 8.11 | 7.32 | 8.28 | 8.11 | 7.65 | 7.8 |
| Total solid, % | 0.020 | 0.101 | – | – | – | – | – | – | – |
| Organic matter, % | 0.006 | 0.0368 | – | – | – | – | – | – | – |
| Ash, % | 0.013 | 0.0639 | – | – | – | – | – | – | – |
| TC, mg/L | 24.0 | 256 | 64.6 | 282 | 80.1 | 162.4 | 217 | 690 | 70.7 |
| TOC, mg/L | 1.85 | 135 | 64.2 | 278 | 79.5 | 69.6 | 54.9 | 66.6 | 25.4 |
| IC, mg/L | 22.1 | 121 | 0.47 | 4.39 | 0.59 | 92.8 | 162 | 624 | 45.2 |
| TN, mg/L | 0.51 | 101 | 9.48 | 3.53 | 6.53 | 6.41 | 5.96 | 4.43 | 3.5 |
| NN, mg/L | 0.15 | 0.00 | 0.00 | 0.00 | 0.00 | 0.00 | 0.00 | 0.00 | 0.0 |
| C. vulgaris Biomass | Parameter | Control Experiment | C. vulgaris Cultures at Different pH Values | |||||
|---|---|---|---|---|---|---|---|---|
| 5 | 6 | 7 | 9 | 10 | 11 | |||
| Biochemical composition | Total chlorophylls, % | 0.400 | 0.0552 | 0.0778 | 0.485 | 0.268 | 0.255 | 0.000 |
| Carotenoids, % | 0.130 | 0.0174 | 0.202 | 0.113 | 0.0995 | 0.0876 | 0.000 | |
| Total pigments, % | 0.530 | 0.0726 | 0.280 | 0.598 | 0.368 | 0.343 | 0.000 | |
| Crude Proteins, % * | 8.39 | 20.5 | 13.5 | 8.13 | 10.9 | 21.9 | 17.8 | |
| Carbohydrates, % | 75.8 | 63.6 | 70.6 | 73.4 | 75.0 | 67.6 | 82.8 | |
| Lipids, % | 6.56 | 6.50 | 7.45 | 11.5 | 13.3 | 6.16 | ND | |
| Total biomass composition, % | 91.3 | 90.7 | 91.8 | 93.1 | 99.6 | 96.0 | 100 | |
| Biomass in terms of carbon and nitrogen species | TC, mg/L | 188 | 278 | 282 | 589 | 455 | 187 | 85.8 |
| TOC, mg/L | 175 | 276 | 278 | 587 | 426 | 166 | 10.2 | |
| IC, mg/L | 13.4 | 1.25 | 4.39 | 2.07 | 28.4 | 21.2 | 75.6 | |
| TN, mg/L | 11.9 | 58.7 | 35.3 | 44.1 | 33.4 | 18.6 | 1.48 | |
| IC, mg/L | 13.4 | 1.25 | 4.39 | 2.07 | 28.4 | 21.2 | 75.6 | |
Publisher’s Note: MDPI stays neutral with regard to jurisdictional claims in published maps and institutional affiliations. |
© 2021 by the authors. Licensee MDPI, Basel, Switzerland. This article is an open access article distributed under the terms and conditions of the Creative Commons Attribution (CC BY) license (https://creativecommons.org/licenses/by/4.0/).
Share and Cite
Belaiba, A.; Bouharat, D.; Malvis, A.; Hodaifa, G. Feasibility of the Hybrid Use of Chlorella vulgaris Culture with the Conventional Biological Treatment in Urban Wastewater Treatment Plants. Processes 2021, 9, 1640. https://doi.org/10.3390/pr9091640
Belaiba A, Bouharat D, Malvis A, Hodaifa G. Feasibility of the Hybrid Use of Chlorella vulgaris Culture with the Conventional Biological Treatment in Urban Wastewater Treatment Plants. Processes. 2021; 9(9):1640. https://doi.org/10.3390/pr9091640
Chicago/Turabian StyleBelaiba, Amani, Dorsaf Bouharat, Ana Malvis, and Gassan Hodaifa. 2021. "Feasibility of the Hybrid Use of Chlorella vulgaris Culture with the Conventional Biological Treatment in Urban Wastewater Treatment Plants" Processes 9, no. 9: 1640. https://doi.org/10.3390/pr9091640
APA StyleBelaiba, A., Bouharat, D., Malvis, A., & Hodaifa, G. (2021). Feasibility of the Hybrid Use of Chlorella vulgaris Culture with the Conventional Biological Treatment in Urban Wastewater Treatment Plants. Processes, 9(9), 1640. https://doi.org/10.3390/pr9091640