
Thermal Analysis Technologies for Biomass Feedstocks: A State-of-the-Art Review


Abstract
:1. Introduction
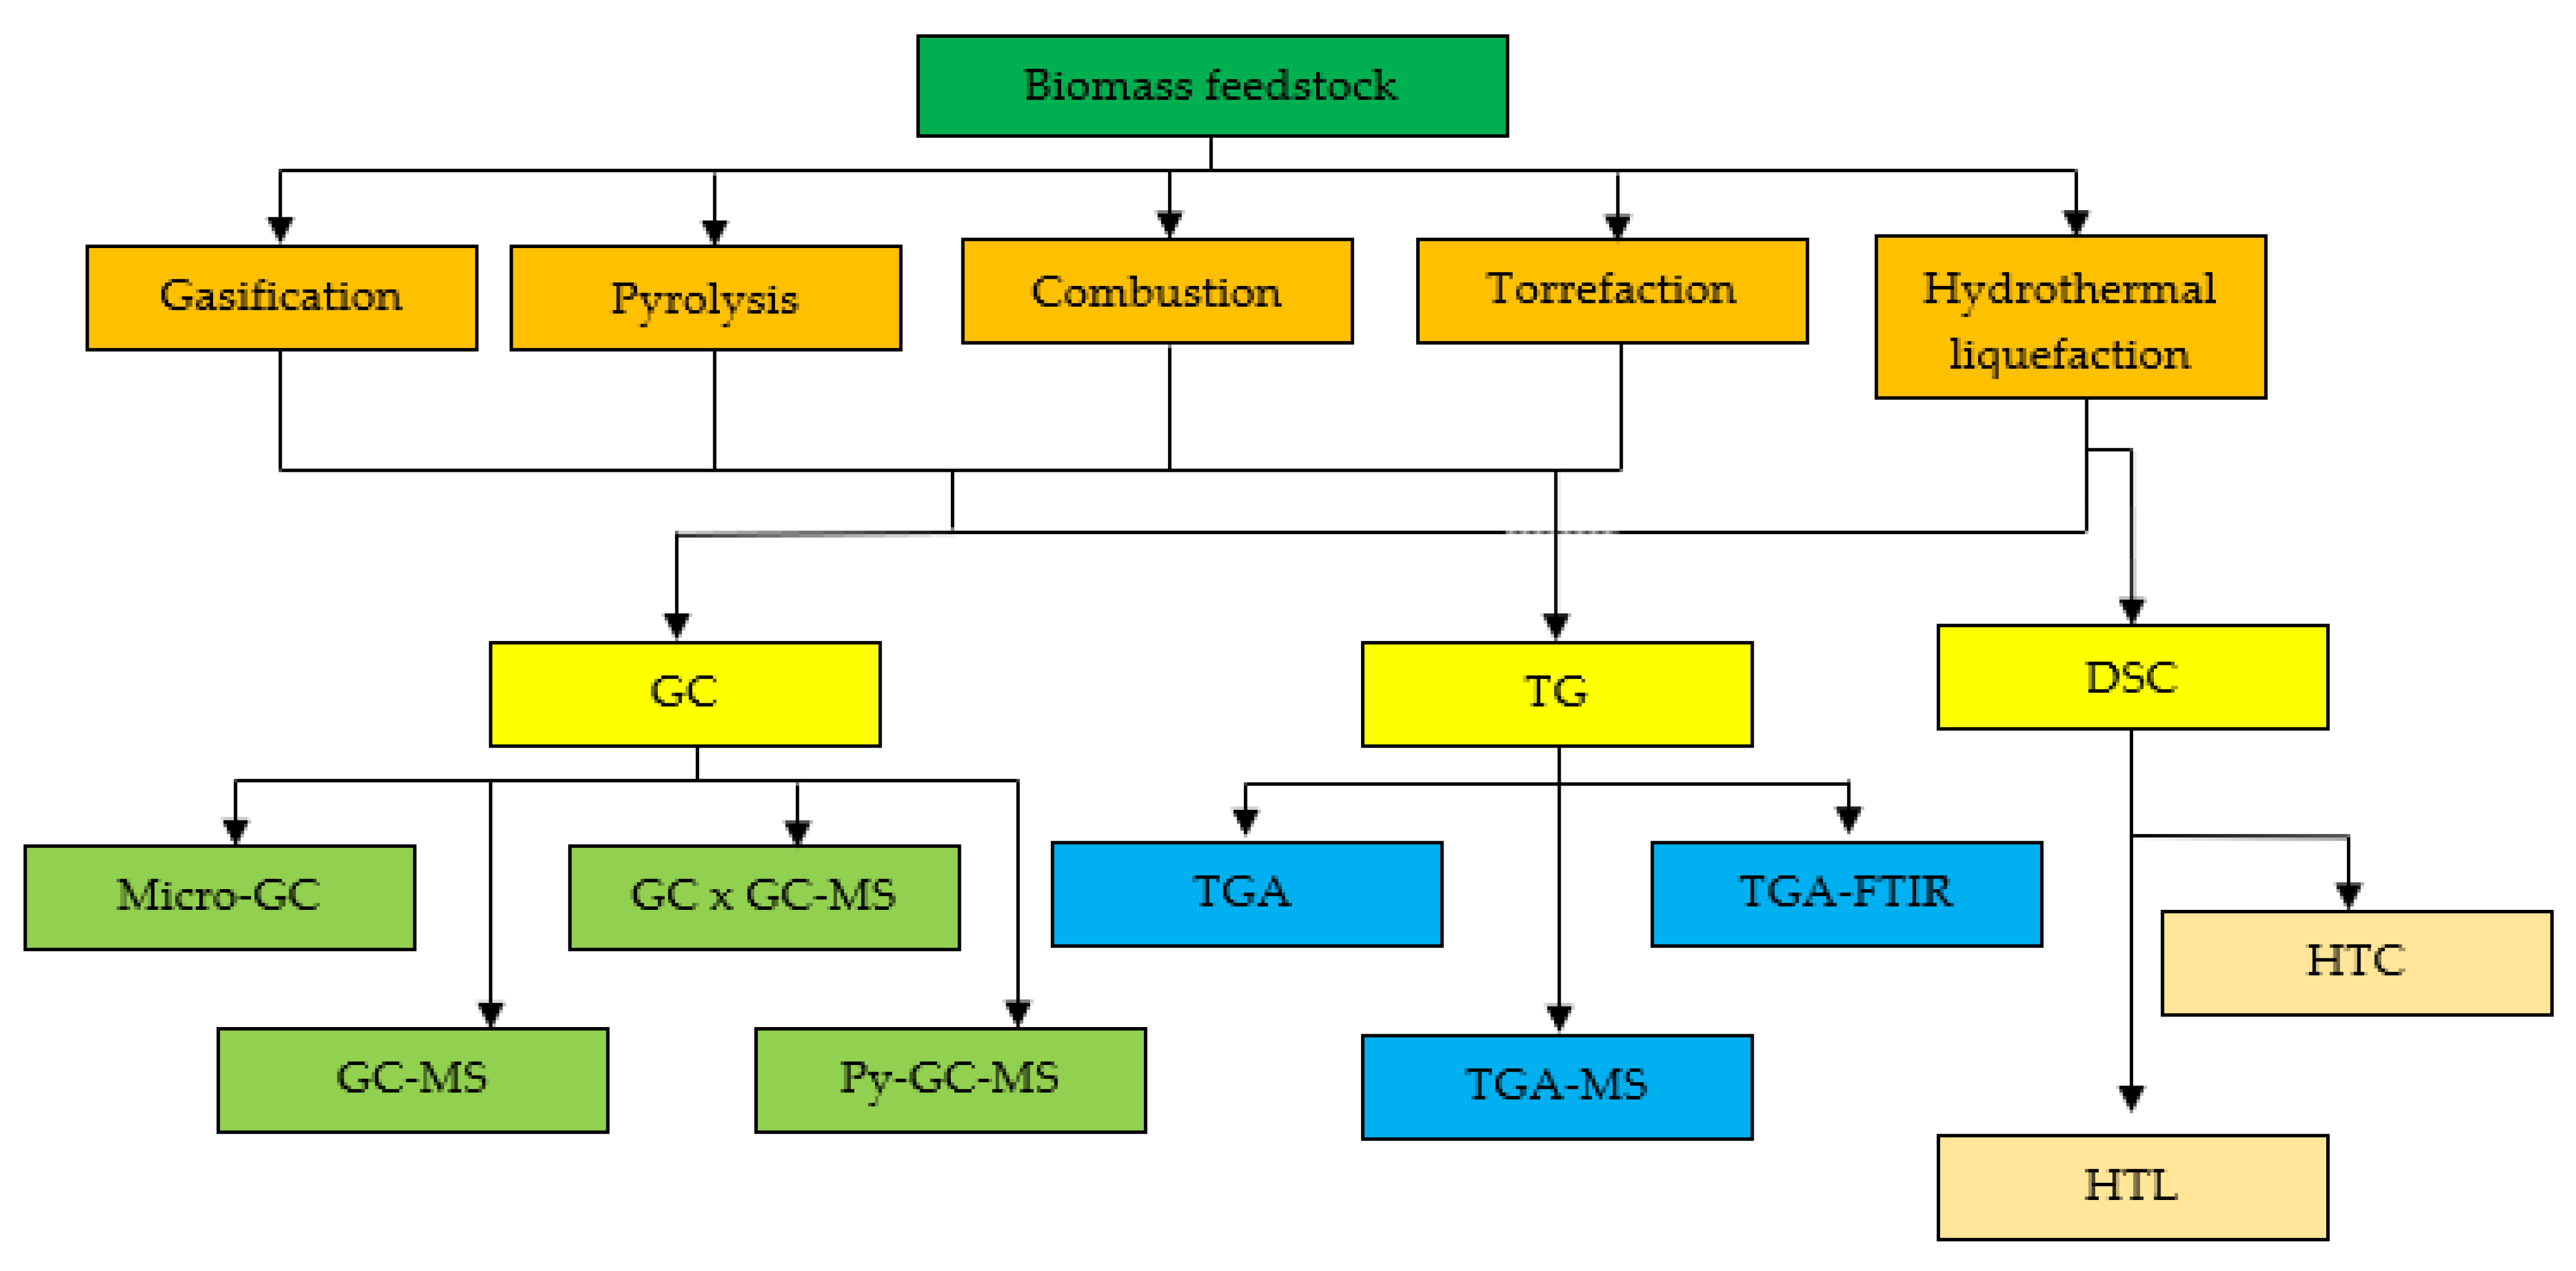
2. Thermochemical Conversion Process
2.1. Gasification
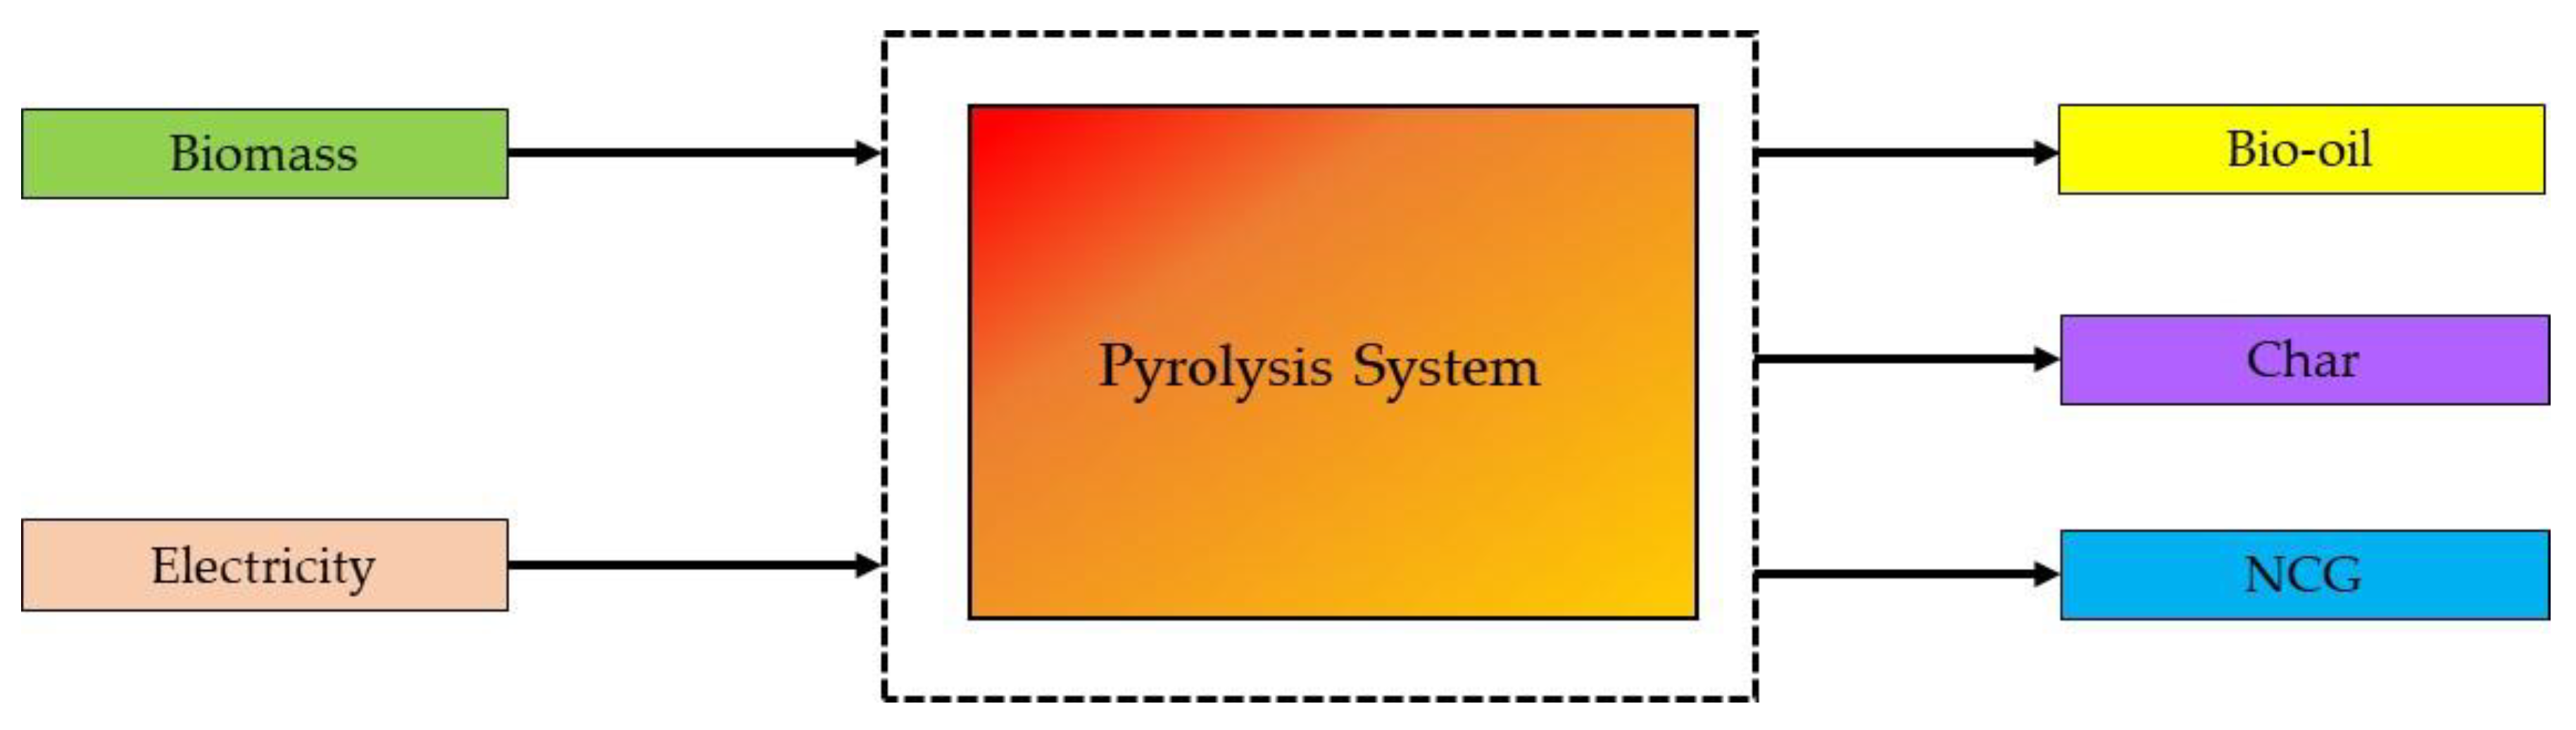
2.2. Pyrolysis
2.3. Combustion
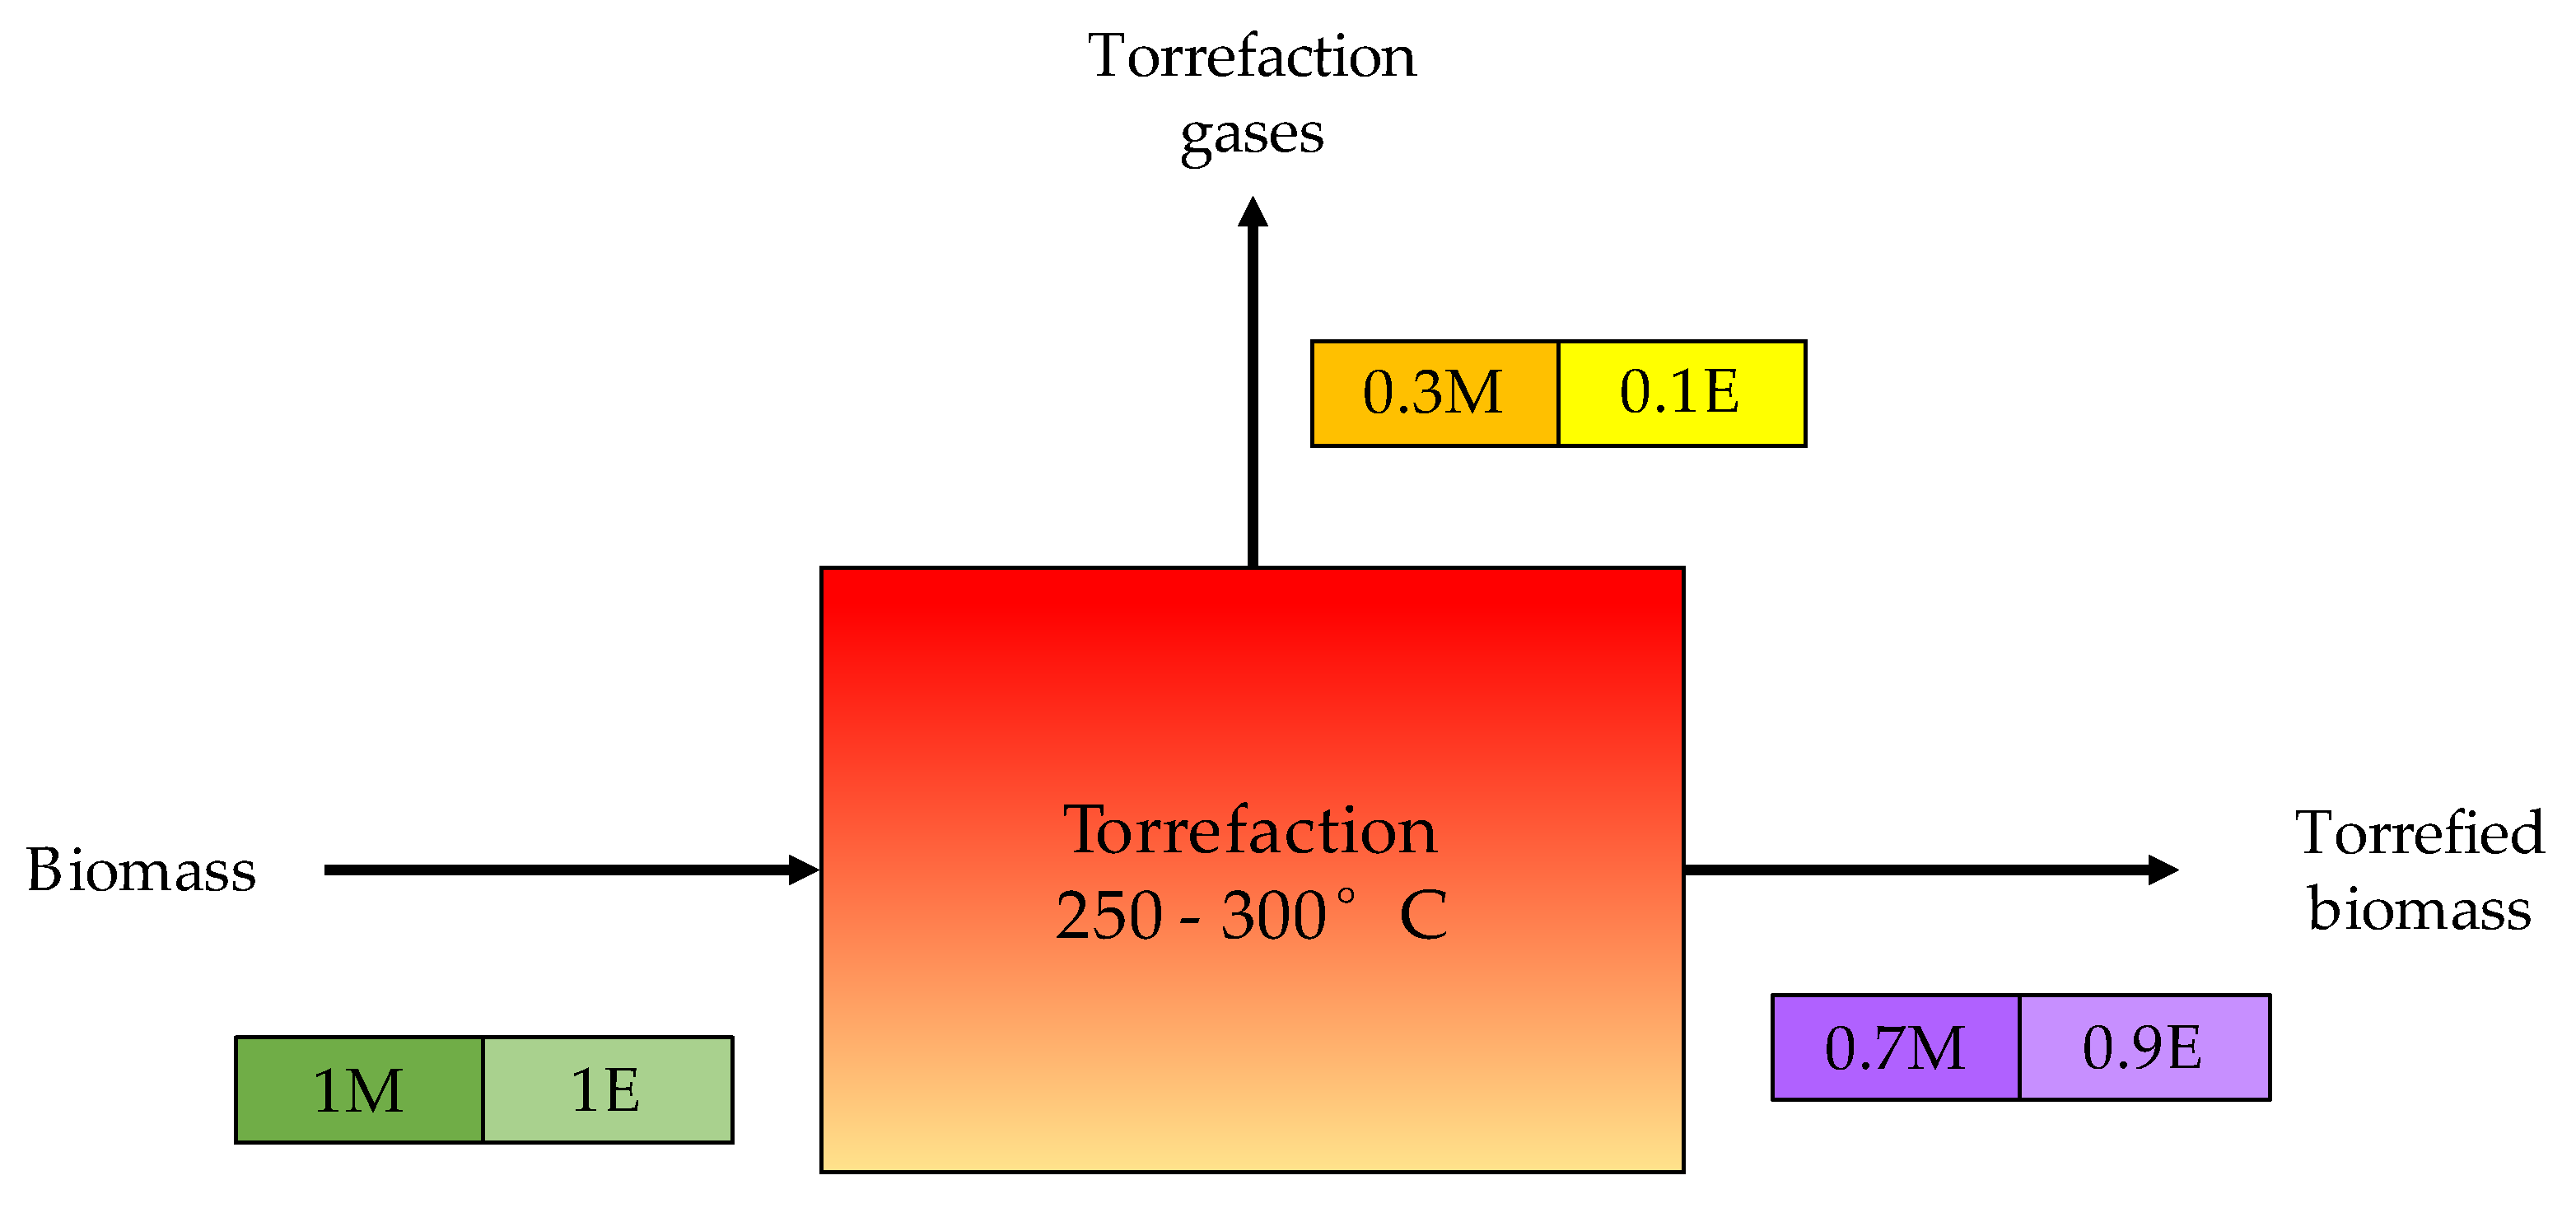
2.4. Torrefaction
2.5. Hydrothermal Liquefaction
2.6. Comparison of Thermal Technologies
3. Thermal Analysis Technologies
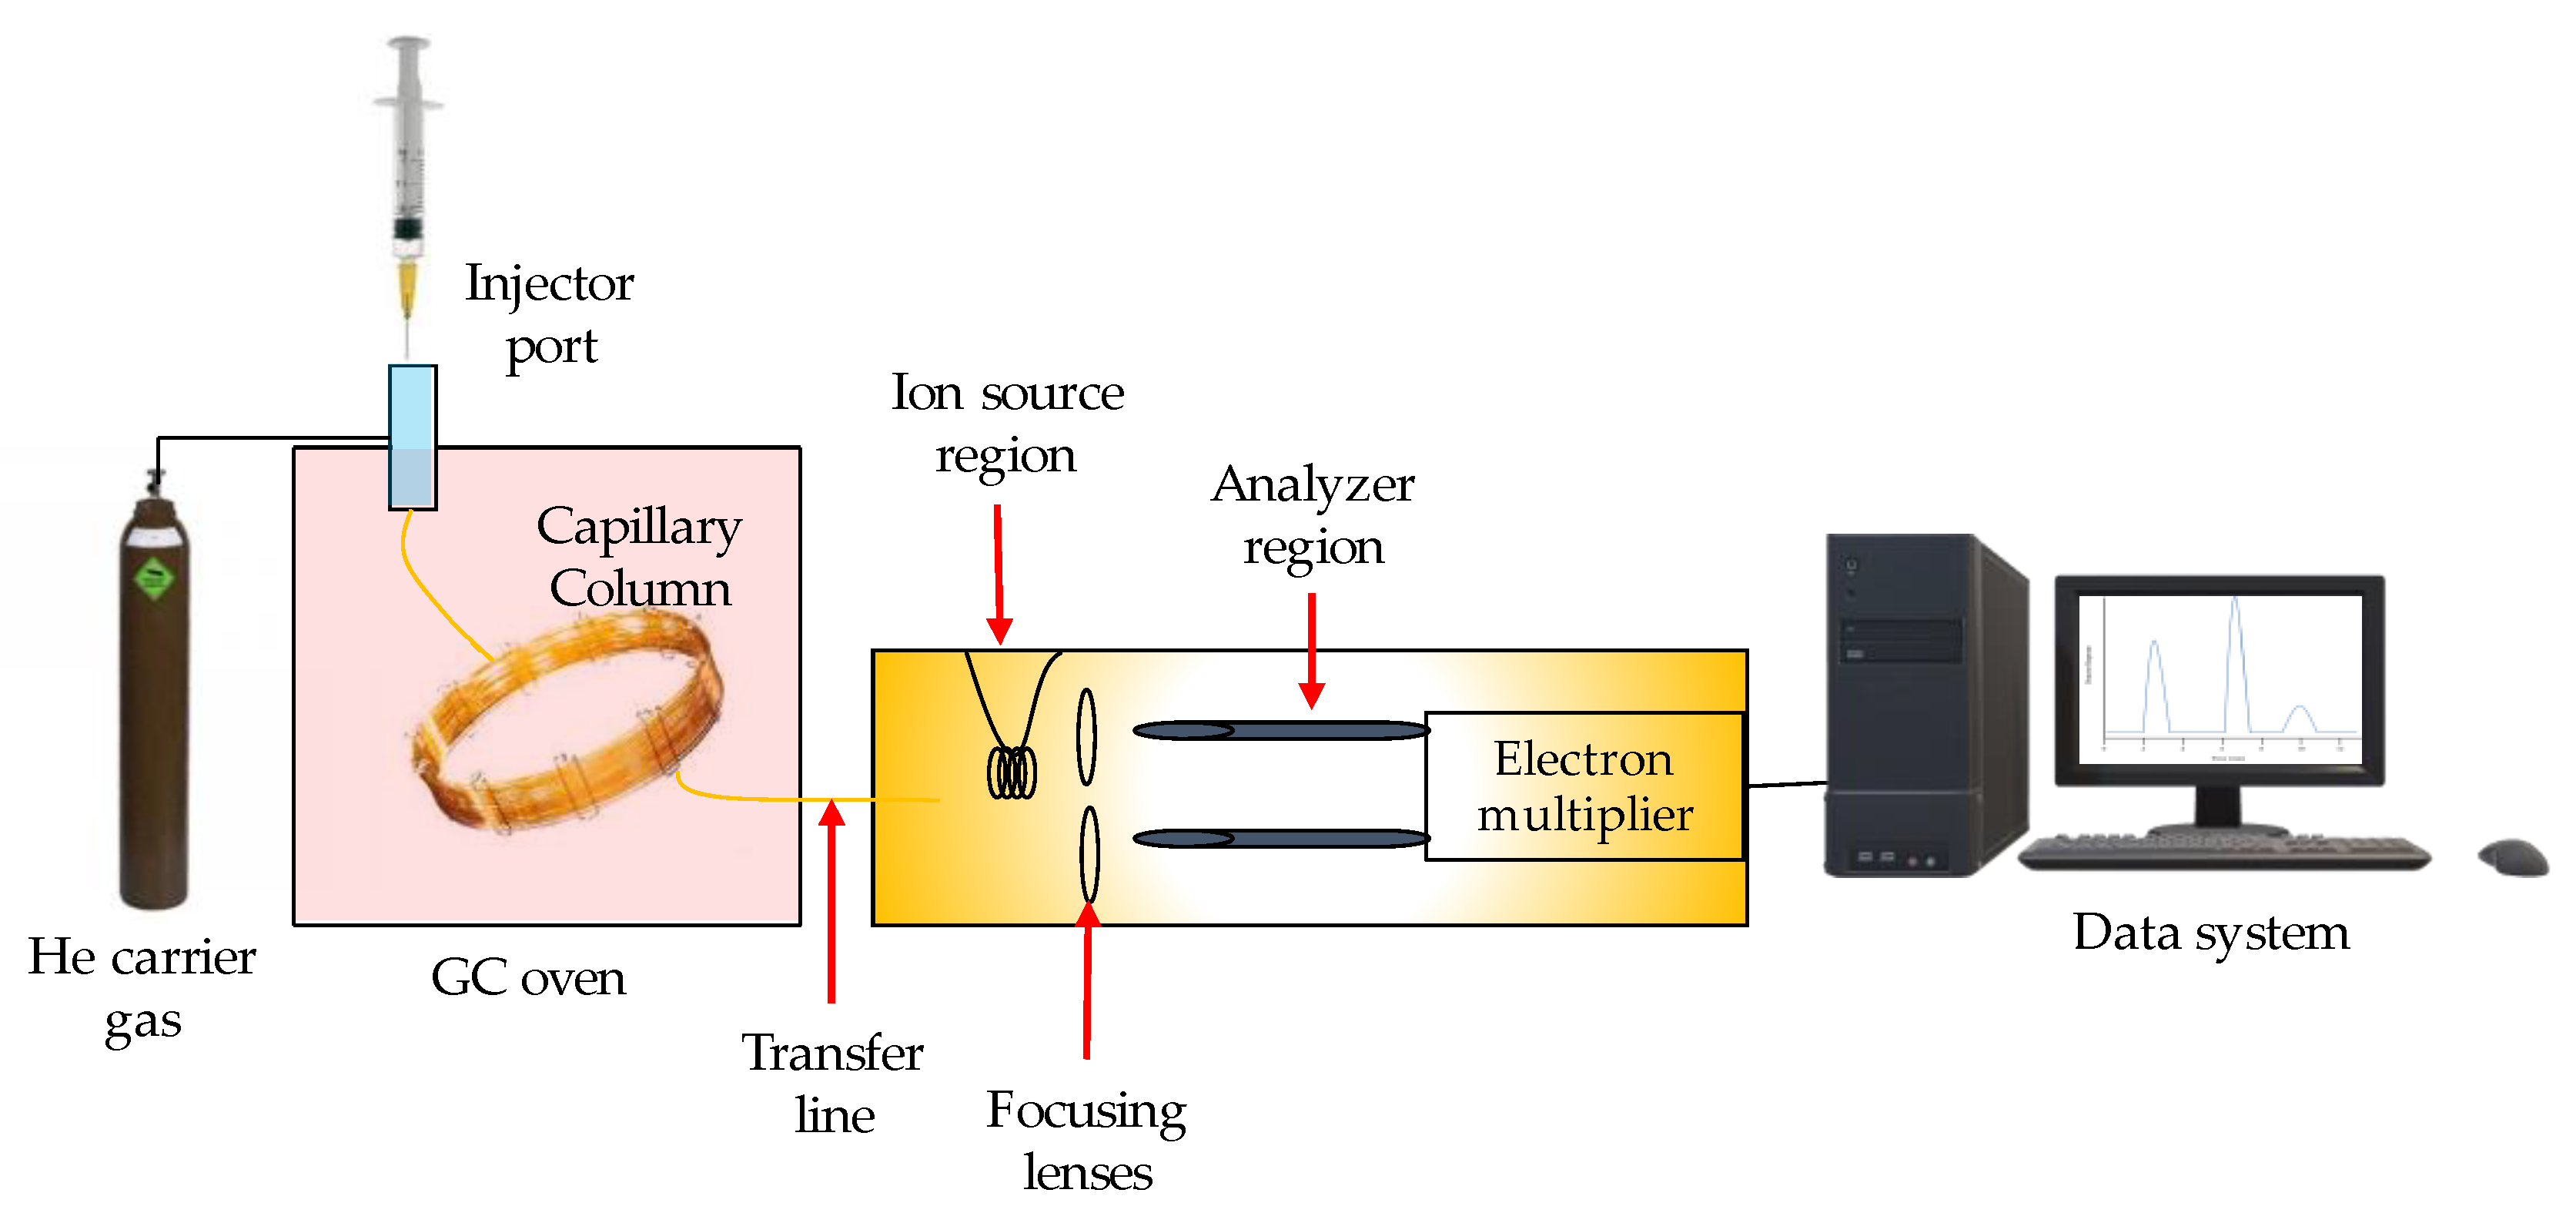
3.1. Gas Chromatography (GC)

| Group | Reference | |||||||||||||
|---|---|---|---|---|---|---|---|---|---|---|---|---|---|---|
| [83] | [84] | [79] | [74] | [80] | [85] | [86] | [87] | [88] | [89] | [90] | [91] | [92] | [6] | |
| Aldehydes | + | + | + | + | + | + | + | + | + | + | + | |||
| Acids | + | + | + | + | + | + | + | + | + | + | + | + | ||
| Alcohols | + | + | + | + | + | + | + | + | + | + | + | + | ||
| Anhydrosugars | + | + | + | + | + | + | ||||||||
| Carbohydrates | + | + | + | + | + | + | + | |||||||
| Ketones | + | + | + | + | + | + | + | + | + | + | + | + | ||
| Hydrocarbons | + | + | + | + | + | + | + | + | + | |||||
| Phenols | + | + | + | + | + | + | + | + | + | + | + | + | + | + |
| Furans | + | + | + | + | + | + | + | + | + | + | ||||
| Esters | + | + | + | + | + | + | + | + | + | |||||
| Ethers | + | + | + | + | + | + | ||||||||
| Pyrans | + | + | + | + | + | + | ||||||||
| N-compounds | + | + | + | + | + | |||||||||
| Others | + | + | + | + | + | + | + | + | + | + | + | + | + | |
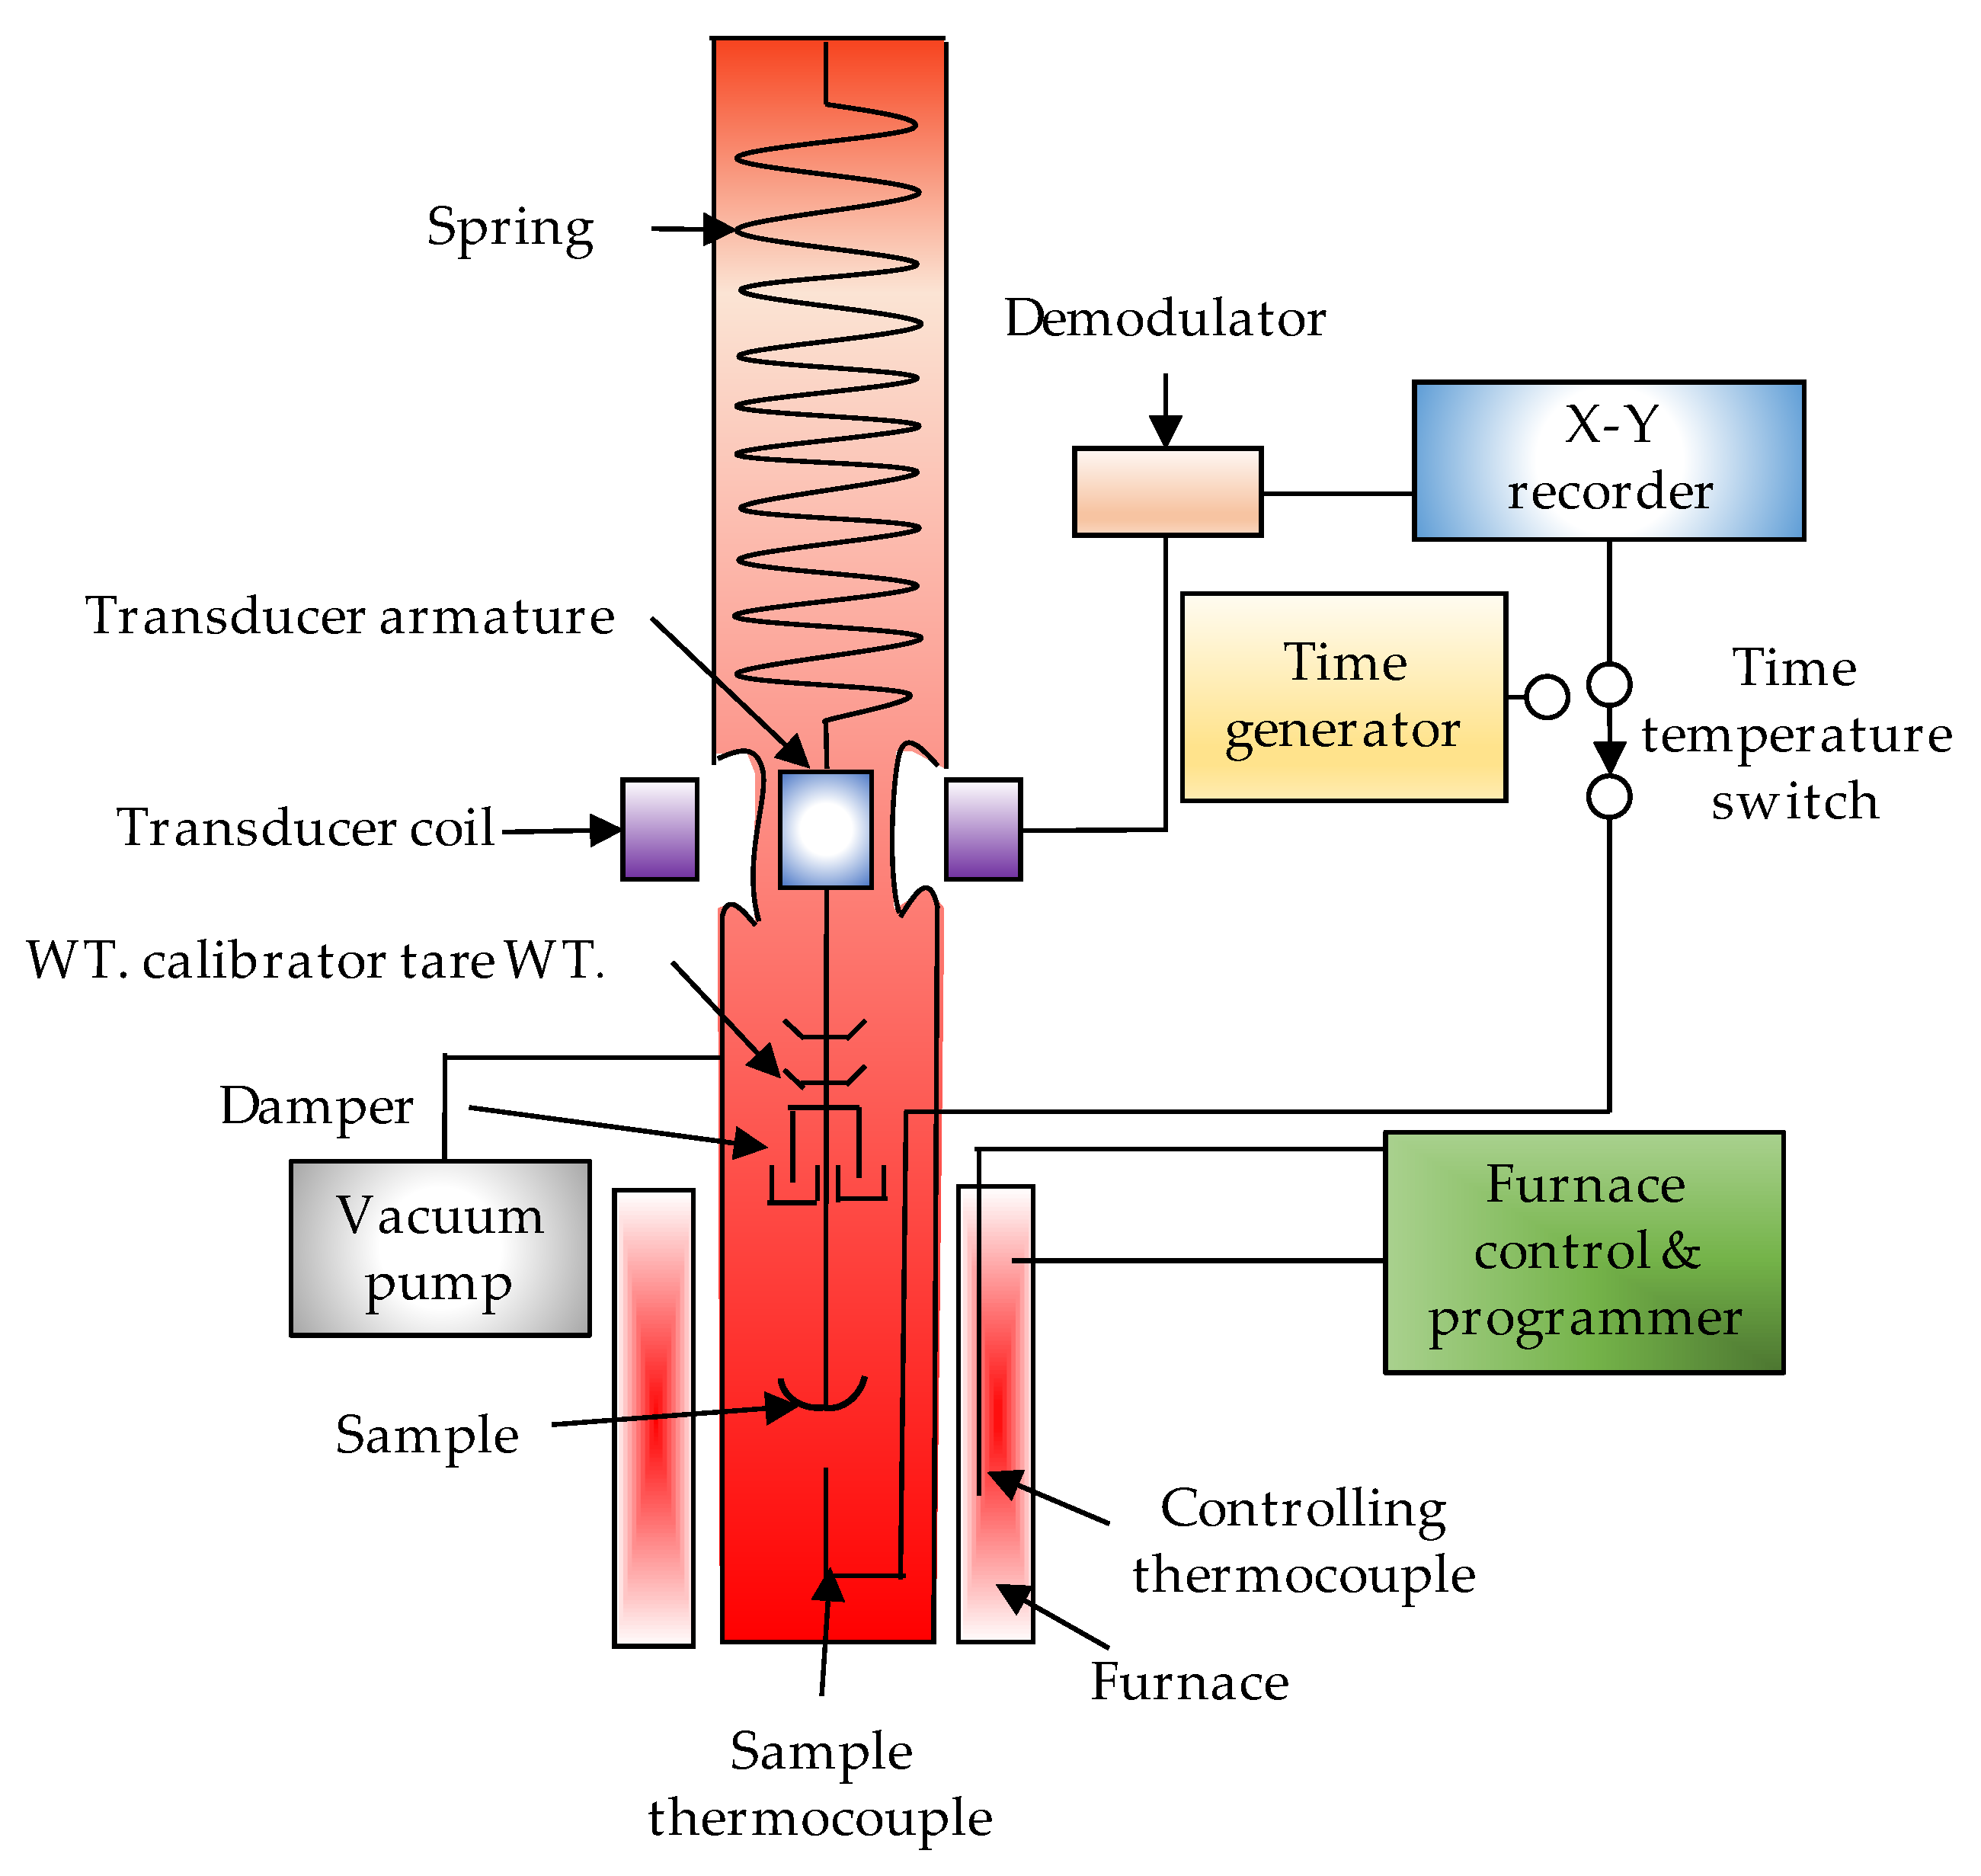
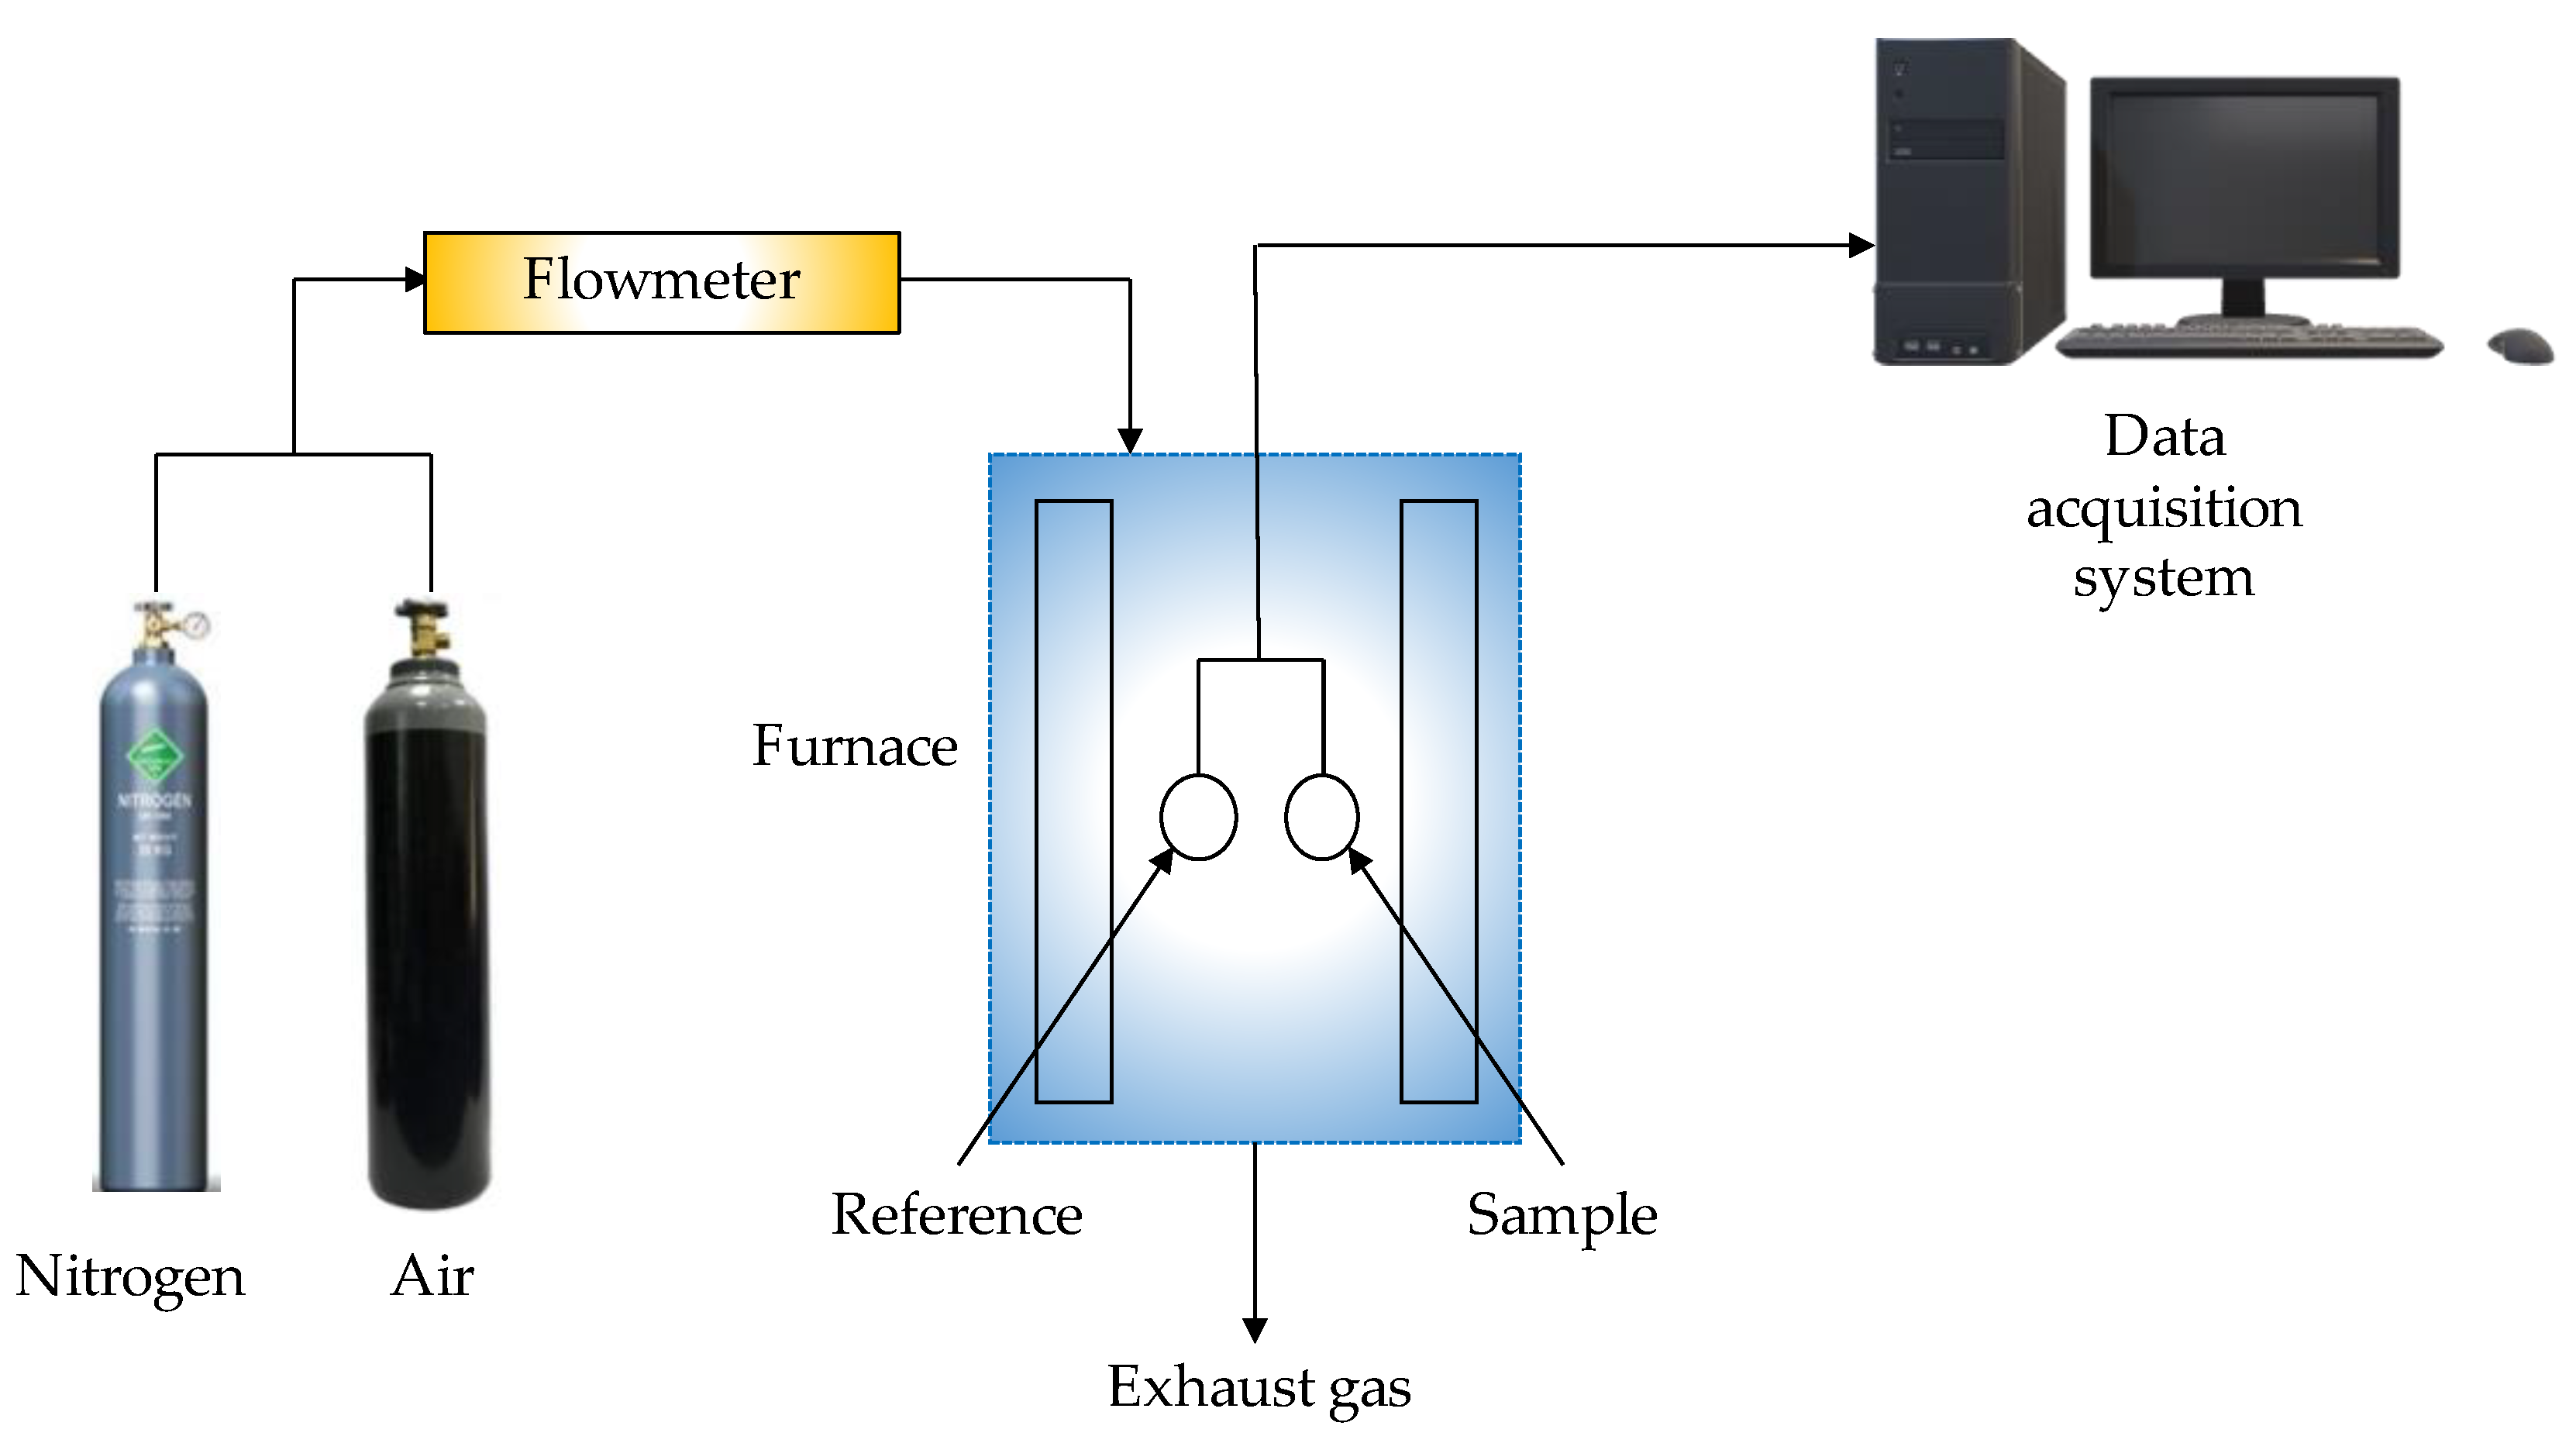
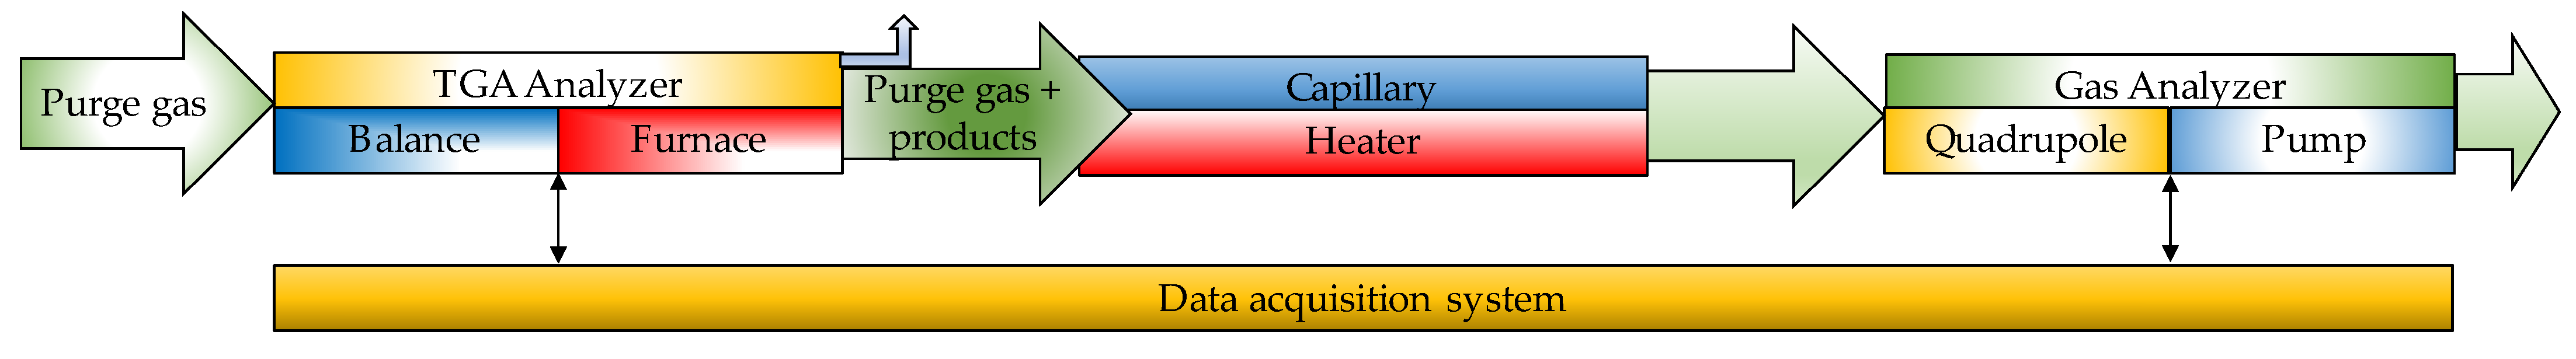
3.2. Thermogravimetric Analysers (TG)
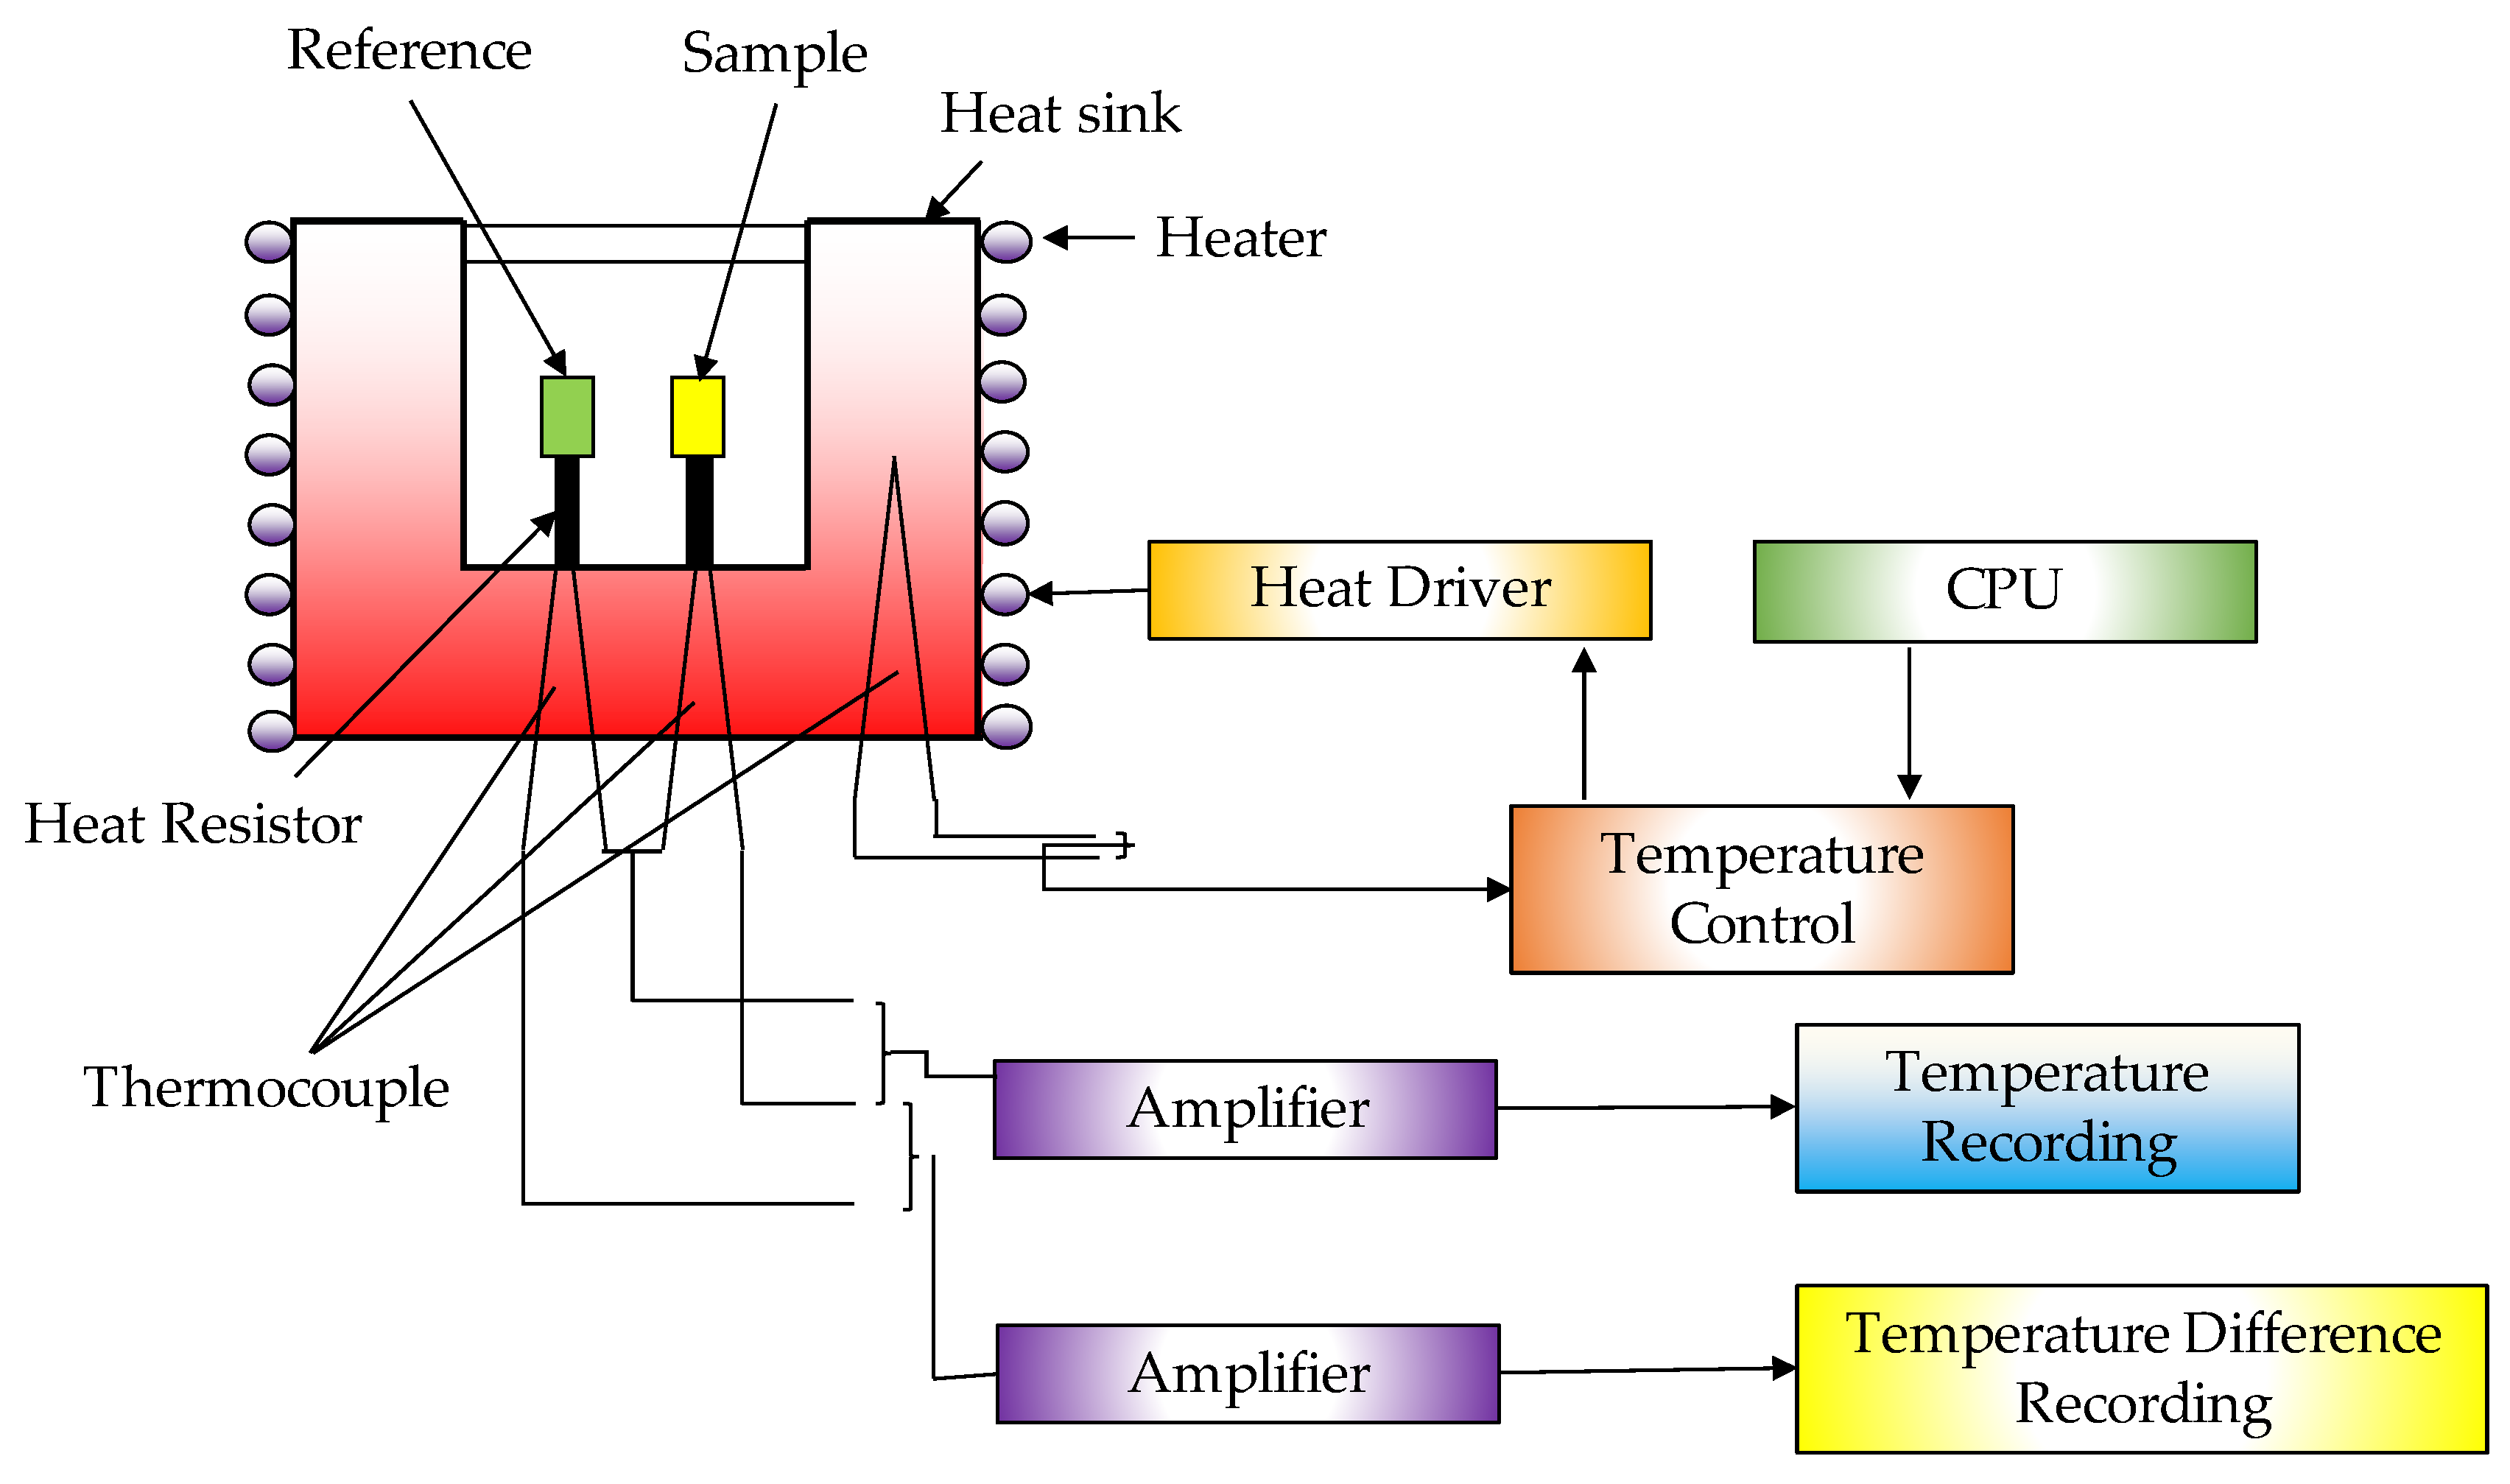
3.3. Differential Scanning Calorimetry (DSC)
4. Comparison of Application on TG, DSC, and GC
5. Conclusions
Author Contributions
Funding
Institutional Review Board Statement
Informed Consent Statement
Data Availability Statement
Acknowledgments
Conflicts of Interest
References
- Abokyi, E.; Appiah-Konadu, P.; Abokyi, F.; Oteng-Abayie, E.F. Industrial growth and emissions of CO2 in Ghana: The role of financial development and fossil fuel consumption. Energy Rep. 2019, 5, 1339–1353. [Google Scholar] [CrossRef]
- Charles Rajesh Kumar, J.; Majid, M.A. Renewable energy for sustainable development in India: Current status, future prospects, challenges, employment, and investment opportunities. Energy Sustain. Soc. 2020, 10, 1–36. [Google Scholar] [CrossRef]
- Chen, W.H.; Peng, J.; Bi, X.T. A state-of-the-art review of biomass torrefaction, densification and applications. Renew. Sustain. Energy Rev. 2015, 44, 847–866. [Google Scholar] [CrossRef]
- Sharma, A.; Jakhete, A.; Sharma, A.; Joshi, J.B.; Pareek, V. Lowering greenhouse gas (GHG) emissions: Techno-economic analysis of biomass conversion to biofuels and value-added chemicals. Greenh. Gases Sci. Technol. 2019, 9, 454–473. [Google Scholar] [CrossRef]
- Pandey, B.; Prajapati, Y.K.; Sheth, P.N. Recent progress in thermochemical techniques to produce hydrogen gas from biomass: A state of the art review. Int. J. Hydrogen Energy 2019, 44, 25384–25415. [Google Scholar] [CrossRef]
- Roman, K.; Barwicki, J.; Hryniewicz, M.; Szadkowska, D.; Szadkowski, J. Production of electricity and heat from biomass wastes using a converted aircraft turbine ai-20. Processes 2021, 9, 364. [Google Scholar] [CrossRef]
- Ong, H.C.; Chen, W.H.; Singh, Y.; Gan, Y.Y.; Chen, C.Y.; Show, P.L. A state-of-the-art review on thermochemical conversion of biomass for biofuel production: A TG-FTIR approach. Energy Convers. Manag. 2020, 209, 112634. [Google Scholar] [CrossRef]
- Bahng, M.K.; Mukarakate, C.; Robichaud, D.J.; Nimlos, M.R. Current technologies for analysis of biomass thermochemical processing: A review. Anal. Chim. Acta 2009, 651, 117–138. [Google Scholar] [CrossRef]
- Pang, S. Advances in thermochemical conversion of woody biomass to energy, fuels and chemicals. Biotechnol. Adv. 2019, 37, 589–597. [Google Scholar] [CrossRef]
- Cai, J.; Xu, D.; Dong, Z.; Yu, X.; Yang, Y.; Banks, S.W.; Bridgwater, A.V. Processing thermogravimetric analysis data for isoconversional kinetic analysis of lignocellulosic biomass pyrolysis: Case study of corn stalk. Renew. Sustain. Energy Rev. 2018, 82, 2705–2715. [Google Scholar] [CrossRef] [Green Version]
- Cai, J.; He, Y.; Yu, X.; Banks, S.W.; Yang, Y.; Zhang, X.; Yu, Y.; Liu, R.; Bridgwater, A.V. Review of physicochemical properties and analytical characterization of lignocellulosic biomass. Renew. Sustain. Energy Rev. 2017, 76, 309–322. [Google Scholar] [CrossRef] [Green Version]
- Niu, S.; Zhou, Y.; Yu, H.; Lu, C.; Han, K. Investigation on thermal degradation properties of oleic acid and its methyl and ethyl esters through TG-FTIR. Energy Convers. Manag. 2017, 149, 495–504. [Google Scholar] [CrossRef]
- Arabi, M.; Ostovan, A.; Bagheri, A.R.; Guo, X.; Wang, L.; Li, J.; Wang, X.; Li, B.; Chen, L. Strategies of Molecular Imprinting-Based Solid-Phase Extraction Prior to Chromatographic Analysis; Elsevier B.V.: Amsterdam, The Netherlands, 2020. [Google Scholar]
- Naik, P. Analytical Techniques in Biochemistry; Springer: New York, NY, USA, 2016; p. 624. [Google Scholar] [CrossRef]
- Chan, Y.H.; Cheah, K.W.; How, B.S.; Loy, A.C.M.; Shahbaz, M.; Singh, H.K.G.; Yusuf, N.R.; Shuhaili, A.F.A.; Yusup, S.; Ghani, W.A.W.A.K.; et al. An overview of biomass thermochemical conversion technologies in Malaysia. Sci. Total Environ. 2019, 680, 105–123. [Google Scholar] [CrossRef] [PubMed]
- Abdulrazik, A.; Elsholkami, M.; Elkamel, A.; Simon, L. Multi-products productions from Malaysian oil palm empty fruit bunch (EFB): Analyzing economic potentials from the optimal biomass supply chain. J. Clean. Prod. 2017, 168, 131–148. [Google Scholar] [CrossRef] [Green Version]
- Rauch, R.; Hrbek, J.; Hofbauer, H. Biomass gasification for synthesis gas production and applications of the syngas. Wiley Interdiscip. Rev. Energy Environ. 2014, 3, 343–362. [Google Scholar] [CrossRef]
- Katsaros, G.; Pandey, D.S.; Horvat, A.; Aranda Almansa, G.; Fryda, L.E.; Leahy, J.J.; Tassou, S.A. Experimental investigation of poultry litter gasification and co-gasification with beech wood in a bubbling fluidised bed reactor—Effect of equivalence ratio on process performance and tar evolution. Fuel 2020, 262, 116660. [Google Scholar] [CrossRef]
- Phillips, D.; Mitchell, E.J.S.; Lea-Langton, A.R.; Parmar, K.R.; Jones, J.M.; Williams, A. The use of conservation biomass feedstocks as potential bioenergy resources in the United Kingdom. Bioresour. Technol. 2016, 212, 271–279. [Google Scholar] [CrossRef]
- Boerrigter, H.; Rauch, R. Review of applications of gases from biomass gasification. ECN Biomass Coal Environ. 2006, 20, 33. [Google Scholar]
- Zhang, Y.; Zhao, Y.; Gao, X.; Li, B.; Huang, J. Energy and exergy analyses of syngas produced from rice husk gasification in an entrained flow reactor. J. Clean. Prod. 2015, 95, 273–280. [Google Scholar] [CrossRef]
- Okolie, J.A.; Nanda, S.; Dalai, A.K.; Berruti, F.; Kozinski, J.A. A review on subcritical and supercritical water gasification of biogenic, polymeric and petroleum wastes to hydrogen-rich synthesis gas. Renew. Sustain. Energy Rev. 2020, 119, 109546. [Google Scholar] [CrossRef]
- Ozturk, M.; Dincer, I. Integrated Gasification Combined Cycles; Comprehensive Energy System: Oshawa, ON, Canada, 2018; pp. 364–473. [Google Scholar] [CrossRef]
- Kamble, A.D.; Saxena, V.K.; Chavan, P.D.; Mendhe, V.A. Co-gasification of coal and biomass an emerging clean energy technology: Status and prospects of development in Indian context. Int. J. Min. Sci. Technol. 2019, 29, 171–186. [Google Scholar] [CrossRef]
- Guan, G.; Kaewpanha, M.; Hao, X.; Abudula, A. Catalytic steam reforming of biomass tar: Prospects and challenges. Renew. Sustain. Energy Rev. 2016, 58, 450–461. [Google Scholar] [CrossRef] [Green Version]
- Ren, J.; Cao, J.P.; Yang, F.L.; Zhao, X.Y.; Tang, W.; Cui, X.; Chen, Q.; Wei, X.Y. Layered uniformly delocalized electronic structure of carbon supported Ni catalyst for catalytic reforming of toluene and biomass tar. Energy Convers. Manag. 2019, 183, 182–192. [Google Scholar] [CrossRef]
- Liu, N.A.; Fan, W.; Dobashi, R.; Huang, L. Kinetic modeling of thermal decomposition of natural cellulosic materials in air atmosphere. J. Anal. Appl. Pyrolysis 2002, 63, 303–325. [Google Scholar] [CrossRef]
- Xu, C.; Hu, S.; Xiang, J.; Zhang, L.; Sun, L.; Shuai, C.; Chen, Q.; He, L.; Edreis, E.M.A. Interaction and kinetic analysis for coal and biomass co-gasification by TG-FTIR. Bioresour. Technol. 2014, 154, 313–321. [Google Scholar] [CrossRef] [PubMed]
- Seo, Y.-C.; Alam, M.T.; Yang, W.-S. Gasification of Municipal Solid Waste. Gasif. Low Grade Feed. 2018. [Google Scholar] [CrossRef] [Green Version]
- Prins, M.J.; Ptasinski, K.J.; Janssen, F.J.J.G. Thermodynamics of gas-char reactions: First and second law analysis. Chem. Eng. Sci. 2003, 58, 1003–1011. [Google Scholar] [CrossRef]
- Ivanova, N.; Gugleva, V.; Dobreva, M.; Pehlivanov, I.; Stefanov, S.; Andonova, V. We are IntechOpen, the World’s Leading Publisher of Open Access Books Built by Scientists, for Scientists TOP 1%; IntechOpen: London, UK, 2016. [Google Scholar]
- Collard, F.X.; Blin, J. A review on pyrolysis of biomass constituents: Mechanisms and composition of the products obtained from the conversion of cellulose, hemicelluloses and lignin. Renew. Sustain. Energy Rev. 2014, 38, 594–608. [Google Scholar] [CrossRef]
- Novak, J.M.; Johnson, M.G. Elemental and Spectroscopic Characterization of Low-Temperature (350 °C) Lignocellulosic-and Manure-based Designer Biochars and Their Use as Soil Amendments; Elsevier Inc.: Amsterdam, The Netherlands, 2018. [Google Scholar]
- Sebastiani, A.; Macrì, D.; Gallucci, K.; Materazzi, M. Steam—oxygen gasification of refuse derived fuel in fluidized beds: Modelling and pilot plant testing. Fuel Process. Technol. 2021, 216, 106783. [Google Scholar] [CrossRef]
- Zhang, Y.; Chen, P.; Liu, S.; Peng, P.; Min, M.; Cheng, Y.; Anderson, E.; Zhou, N.; Fan, L.; Liu, C.; et al. Effects of feedstock characteristics on microwave-assisted pyrolysis—A review. Bioresour. Technol. 2017, 230, 143–151. [Google Scholar] [CrossRef]
- Abnisa, F.; Wan Daud, W.M.A. A review on co-pyrolysis of biomass: An optional technique to obtain a high-grade pyrolysis oil. Energy Convers. Manag. 2014, 87, 71–85. [Google Scholar] [CrossRef]
- Bhoi, P.R.; Ouedraogo, A.S.; Soloiu, V.; Quirino, R. Recent advances on catalysts for improving hydrocarbon compounds in bio-oil of biomass catalytic pyrolysis. Renew. Sustain. Energy Rev. 2020, 121, 109676. [Google Scholar] [CrossRef]
- Wu, Z.; Luo, H. Pyrolysis Characteristics and Kinetic Analysis of Sediment from the Dianchi Lake in China. Int. J. Chem. Eng. 2018, 2018. [Google Scholar] [CrossRef] [Green Version]
- Boateng, A.A.; Mullen, C.A.; Osgood-Jacobs, L.; Carlson, P.; Macken, N. Mass Balance, Energy, and Exergy Analysis of Bio-Oil Production by Fast Pyrolysis. J. Energy Resour. Technol. 2012, 134, 042001. [Google Scholar] [CrossRef]
- Grigiante, M.; Ischia, M.; Baratieri, M.; Maschio, R.D.; Ragazzi, M. Pyrolysis analysis and solid residue stabilization of polymers, waste tyres, spruce sawdust and sewage sludge. Waste Biomass Valorization 2010, 1, 381–393. [Google Scholar] [CrossRef]
- Salimbeni, A. Techno-Economic Assessment of Lignocellulosic Biomass Energy Conversion by Slow Oxidative Pyrolysis. Master’s Thesis, University of Florence, Florence, Italy, 2016. [Google Scholar]
- Zhang, Y.; Cui, Y.; Chen, P.; Liu, S.; Zhou, N.; Ding, K.; Fan, L.; Peng, P.; Min, M.; Cheng, Y.; et al. Gasification Technologies and Their Energy Potentials; Elsevier B.V.: Amsterdam, The Netherlands, 2019. [Google Scholar]
- Dooley, S.; Won, S.H.; Dryer, F.L. Surrogate Fuels and Combustion Characteristics of Liquid Transportation Fuels; Elsevier B.V.: Amsterdam, The Netherlands, 2019. [Google Scholar]
- Westbrook, C.K. Chemical kinetics of hydrocarbon ignition in practical combustion systems. Proc. Combust. Inst. 2000, 28, 1563–1577. [Google Scholar] [CrossRef] [Green Version]
- Caretto, L. Introduction to Combustion Today′s Class; Spring: Long Beach, CA, USA, 2010; pp. 1–22. [Google Scholar]
- Kim, D.; Yoshikawa, K.; Lee, K.; Park, K.Y. Investigation of the combustion characteristics of municipal solid wastes and their hydrothermally treated products via thermogravimetric analysis. J. Mater. Cycles Waste Manag. 2015, 17, 258–265. [Google Scholar] [CrossRef]
- Ribeiro, J.M.C.; Godina, R.; Matias, J.C.D.O.; Nunes, L.J.R. Future perspectives of biomass torrefaction: Review of the current state-of-the-art and research development. Sustainability 2018, 10, 2323. [Google Scholar] [CrossRef] [Green Version]
- Bergman, P.C.A.; Boersma, A.R.; Zwart, R.W.R.; Kiel, J.H. Torrefaction for Biomass Co-Firing in Existing Coal-Fired Power Stations (BIOCOAL); C-05-013; ECN: Petten, The Netherlands, 2005; pp. 1–72. [Google Scholar]
- Bach, Q.V.; Skreiberg, O. Upgrading biomass fuels via wet torrefaction: A review and comparison with dry torrefaction. Renew. Sustain. Energy Rev. 2016, 54, 665–677. [Google Scholar] [CrossRef]
- Yue, Y.; Singh, H.; Singh, B.; Mani, S. Torrefaction of sorghum biomass to improve fuel properties. Bioresour. Technol. 2017, 232, 372–379. [Google Scholar] [CrossRef] [Green Version]
- Tumuluru, J.S.; Sokhansanj, S.; Wright, C.T.; Kremer, T. GC Analysis of Volatiles and Other Products from Biomass Torrefaction Process; IntechOpen: London, UK, 2012. [Google Scholar] [CrossRef] [Green Version]
- Basu, P. Chp. 04: Torrefaction; Biomass Gasification, Pyrolysis and Torrefaction: Halifax, NS, Canada, 2013; pp. 93–154. ISBN 9780128129920. [Google Scholar] [CrossRef]
- White, R.H.; Dietenberger, M.A. Wood Products: Thermal Degradation and Fire. Encycl. Mater. Sci. Technol. 2001, 9712–9716. [Google Scholar] [CrossRef]
- Acharya, B.; Pradhan, R.R.; Dutta, A. Qualitative and kinetic analysis of torrefaction of lignocellulosic biomass using DSC-TGA-FTIR. AIMS Energy 2015, 3, 760–773. [Google Scholar] [CrossRef]
- Karki, S.; Poudel, J.; Oh, S.C. Thermal pre-treatment of sewage sludge in a lab-scale fluidized bed for enhancing its solid fuel properties. Appl. Sci. 2018, 8, 183. [Google Scholar] [CrossRef] [Green Version]
- Minowa, T.; Kondo, T.; Sudirjo, S.T. Thermochemical liquefaction of Indonesian biomass residues. Biomass Bioenergy 1998, 14, 517–524. [Google Scholar] [CrossRef]
- Akhtar, J.; Amin, N.A.S. A review on process conditions for optimum bio-oil yield in hydrothermal liquefaction of biomass. Renew. Sustain. Energy Rev. 2011, 15, 1615–1624. [Google Scholar] [CrossRef]
- Zhou, Y.; Hu, C. Catalytic thermochemical conversion of algae and upgrading of algal oil for the production of high-grade liquid fuel: A review. Catalysts 2020, 10, 145. [Google Scholar] [CrossRef] [Green Version]
- Lv, S.H. High-performance superplasticizer based on chitosan. Biopolym. Biotech. Admix. Eco Effic. Constr. Mater. 2016, 131–150. [Google Scholar] [CrossRef]
- Gartner, E.M.; MacPhee, D.E. A physico-chemical basis for novel cementitious binders. Cem. Concr. Res. 2011, 41, 736–749. [Google Scholar] [CrossRef]
- Weiner, B.; Baskyr, I.; Poerschmann, J.; Kopinke, F.D. Potential of the hydrothermal carbonization process for the degradation of organic pollutants. Chemosphere 2013, 92, 674–680. [Google Scholar] [CrossRef]
- Yoganandham, S.T.; Sathyamoorthy, G.; Renuka, R.R. Emerging Extraction Techniques: Hydrothermal Processing; Elsevier Inc.: Amsterdam, The Netherlands, 2020. [Google Scholar]
- Ischia, G.; Fiori, L. Hydrothermal Carbonization of Organic Waste and Biomass: A Review on Process, Reactor, and Plant Modeling. Waste Biomass Valorization 2021, 12, 2797–2824. [Google Scholar] [CrossRef]
- Chiong, M.C.; Chong, C.T.; Ng, J.H.; Lam, S.S.; Tran, M.V.; Chong, W.W.F.; Mohd Jaafar, M.N.; Valera-Medina, A. Liquid biofuels production and emissions performance in gas turbines: A review. Energy Convers. Manag. 2018, 173, 640–658. [Google Scholar] [CrossRef] [Green Version]
- Bonilla, S.H.; Silva, H.R.O.; da Silva, M.T.; Gonçalves, R.F.; Sacomano, J.B. Industry 4.0 and sustainability implications: A scenario-based analysis of the impacts and challenges. Sustainability 2018, 10, 3740. [Google Scholar] [CrossRef] [Green Version]
- Gassner, M.; Maréchal, F. Thermo-economic optimisation of the polygeneration of synthetic natural gas (SNG), power and heat from lignocellulosic biomass by gasification and methanation. Energy Environ. Sci. 2012, 5, 5768–5789. [Google Scholar] [CrossRef] [Green Version]
- Marriott, P.J.; Chin, S.T.; Nolvachai, Y. Techniques and application in comprehensive multidimensional gas chromatography—mass spectrometry. J. Chromatogr. A 2021, 1636, 461788. [Google Scholar] [CrossRef]
- Shellie, R.A. Gas Chromatography. Encycl. Forensic Sci. Second Ed. 2013, 1, 579–585. [Google Scholar] [CrossRef]
- Asteggiano, A.; Occhipinti, A.; Capuzzo, A.; Mecarelli, E.; Aigotti, R.; Medana, C. Quali-Quantitative Characterization of Volatile and Non-Volatile Compounds in Protium heptaphyllum (Aubl.) Marchand Resin by GC-MS Validated Method, GC-FID and HPLC-HRMS2. Molecules 2021, 26, 1447. [Google Scholar] [CrossRef]
- Modern Practice of Gas Chromatography; International Journal of Agriculture Innovation and Research: Wuxi, China, 2017; Volume 42, ISBN 9786468600.
- Ma, X.M.; Lu, R.; Miyakoshi, T. Application of pyrolysis gas chromatography/mass spectrometry in lacquer research: A review. Polymers 2014, 6, 132–144. [Google Scholar] [CrossRef] [Green Version]
- Grams, J. Chromatographic analysis of bio-oil formed in fast pyrolysis of lignocellulosic biomass. Rev. Anal. Chem. 2020, 39, 65–77. [Google Scholar] [CrossRef]
- Selection, T.; Tech, A.; Instrument, A. Chapter 5. Analytical techniques used with pyrolysis. Tech. Instrum. Anal. Chem. 1998, 20, 97–199. [Google Scholar] [CrossRef]
- González Martínez, M.; Dupont, C.; Thiéry, S.; Meyer, X.M.; Gourdon, C. Impact of biomass diversity on torrefaction: Study of solid conversion and volatile species formation through an innovative TGA-GC/MS apparatus. Biomass Bioenergy 2018, 119, 43–53. [Google Scholar] [CrossRef] [Green Version]
- Netzsch TGA-GC-MS Coupling Thermogravimetry and Evolved Gas Analysis; Netzsch: Selb, Germany, 2012; p. 20.
- Boyron, O.; Marre, T.; Delauzun, A.; Cozic, R.; Boisson, C. An Advanced Technique for Linear Low-Density Polyethylene Composition Determination: TGA–IST16–GC–MS Coupling. Macromol. Chem. Phys. 2019, 220, 1–9. [Google Scholar] [CrossRef]
- Amaral, M.S.S.; Nolvachai, Y.; Marriott, P.J. Comprehensive Two-Dimensional Gas Chromatography Advances in Technology and Applications: Biennial Update. Anal. Chem. 2020, 92, 85–104. [Google Scholar] [CrossRef] [PubMed]
- Kandiyoti, R.; Herod, A.A.; Bartle, K.D. Analytical Techniques for Low Mass Materials: Method Development. Solid Fuels Heavy Hydrocarb. Liq. 2006, 217–260. [Google Scholar] [CrossRef]
- El Hayany, B.; El Fels, L.; Dignac, M.F.; Quenea, K.; Rumpel, C.; Hafidi, M. Pyrolysis-GCMS as a Tool for Maturity Evaluation of Compost from Sewage Sludge and Green Waste. Waste Biomass Valorization 2021, 12, 2639–2652. [Google Scholar] [CrossRef]
- Gupta, J.; Papadikis, K.; Kozhevnikov, I.V.; Konysheva, E.Y. Exploring the potential of red mud and beechwood co-processing for the upgrading of fast pyrolysis vapours. J. Anal. Appl. Pyrolysis 2017, 128, 35–43. [Google Scholar] [CrossRef]
- Schilling, M.R.; Learner, T. Evolved Gas Analysis As a Tool for Characterizing Plastics. In Proceedings of the ICOM-CC 16th Trienn. Conference, Lisbon, Spain, 19–23 September 2011. [Google Scholar]
- Akihiko, H.; Koichi, I.; Ichi, W.; Chuichi, W. Utility of a System Consisting of EGA.PY-3030D and GCMS-QP2010 Ultra, SHIMADZU, C146-E174.
- Pua, F.L.; Zakaria, S.; Chia, C.H.; Fan, S.P.; Rosenau, T.; Potthast, A.; Liebner, F. Solvolytic liquefaction of oil palm empty fruit bunch (EFB) fibres: Analysis of product fractions using FTIR and pyrolysis-GCMS. Sains Malays. 2013, 42, 793–799. [Google Scholar]
- Wei, L.; Liang, S.; Guho, N.M.; Hanson, A.J.; Smith, M.W.; Garcia-Perez, M.; McDonald, A.G. Production and characterization of bio-oil and biochar from the pyrolysis of residual bacterial biomass from a polyhydroxyalkanoate production process. J. Anal. Appl. Pyrolysis 2015, 115, 268–278. [Google Scholar] [CrossRef] [Green Version]
- Branca, C.; Giudicianni, P.; Di Blasi, C. GC/MS characterization of liquids generated from low-temperature pyrolysis of wood. Ind. Eng. Chem. Res. 2003, 42, 3190–3202. [Google Scholar] [CrossRef]
- Ukaew, S.; Schoenborn, J.; Klemetsrud, B.; Shonnard, D.R. Effects of torrefaction temperature and acid pretreatment on the yield and quality of fast pyrolysis bio-oil from rice straw. J. Anal. Appl. Pyrolysis 2018, 129, 112–122. [Google Scholar] [CrossRef]
- Li, W.; Wu, S.; Wu, Y.; Huang, S.; Gao, J. Gasification characteristics of biomass at a high-temperature steam atmosphere. Fuel Process. Technol. 2019, 194, 106090. [Google Scholar] [CrossRef]
- Xu, D.; Xiong, Y.; Ye, J.; Su, Y.; Dong, Q.; Zhang, S. Performances of syngas production and deposited coke regulation during co-gasification of biomass and plastic wastes over Ni/γ-Al2O3 catalyst: Role of biomass to plastic ratio in feedstock. Chem. Eng. J. 2020, 392, 123728. [Google Scholar] [CrossRef]
- Cai, W.; Liu, Q.; Shen, D.; Wang, J. Py-GC/MS analysis on product distribution of two-staged biomass pyrolysis. J. Anal. Appl. Pyrolysis 2019, 138, 62–69. [Google Scholar] [CrossRef]
- Rathsack, P.; Wollmerstaedt, H.; Kuchling, T.; Kureti, S. Analysis of hydrogenation products of biocrude obtained from hydrothermally liquefied algal biomass by comprehensive gas chromatography mass spectrometry (GC×GC-MS). Fuel 2019, 248, 178–188. [Google Scholar] [CrossRef]
- Sun, T.; Li, Z.; Zhang, Z.; Wang, Z.; Yang, S.; Yang, Y.; Wang, X.; Liu, S.; Zhang, Q.; Lei, T. Fast corn stalk pyrolysis and the influence of catalysts on product distribution. Bioresour. Technol. 2020, 301, 122739. [Google Scholar] [CrossRef]
- Zhang, L.; Li, K.; Zhu, X. Study on two-step pyrolysis of soybean stalk by TG-FTIR and Py-GC/MS. J. Anal. Appl. Pyrolysis 2017, 127, 91–98. [Google Scholar] [CrossRef]
- Xu, Q.; Pang, S.; Levi, T. Reaction kinetics and producer gas compositions of steam gasification of coal and biomass blend chars, part 1: Experimental investigation. Chem. Eng. Sci. 2011, 66, 2141–2148. [Google Scholar] [CrossRef]
- Zhu, L.; Zhang, Y.; Lei, H.; Zhang, X.; Wang, L.; Bu, Q.; Wei, Y. Production of hydrocarbons from biomass-derived biochar assisted microwave catalytic pyrolysis. Sustain. Energy Fuels 2018, 2, 1781–1790. [Google Scholar] [CrossRef]
- Pantami, H.A.; Bustamam, M.S.A.; Lee, S.Y.; Ismail, I.S.; Faudzi, S.M.M.; Nakakuni, M.; Shaari, K. Comprehensive GCMS and LC-MS/MS metabolite profiling of chlorella vulgaris. Mar. Drugs 2020, 18, 367. [Google Scholar] [CrossRef] [PubMed]
- Sharma, D.K.; Dhawan, H.; Morgan, T.; Crocker, M. Py-GCMS studies of Indian coals and their solvent extracted products. Fuel 2019, 256, 115981. [Google Scholar] [CrossRef]
- Hidayat, S.; Abu Bakar, M.S.; Yang, Y.; Phusunti, N.; Bridgwater, A.V. Characterisation and Py-GC/MS analysis of Imperata Cylindrica as potential biomass for bio-oil production in Brunei Darussalam. J. Anal. Appl. Pyrolysis 2018, 134, 510–519. [Google Scholar] [CrossRef] [Green Version]
- Zhang, B.; Zhong, Z.P.; Wang, X.B.; Ding, K.; Song, Z.W. Catalytic upgrading of fast pyrolysis biomass vapors over fresh, spent and regenerated ZSM-5 zeolites. Fuel Process. Technol. 2015, 138, 430–434. [Google Scholar] [CrossRef]
- Zhang, S.; Zhu, S.; Zhang, H.; Chen, T.; Xiong, Y. Catalytic fast pyrolysis of rice husk: Effect of coupling leaching with torrefaction pretreatment. J. Anal. Appl. Pyrolysis 2018, 133, 91–96. [Google Scholar] [CrossRef]
- Mattonai, M.; Watanabe, A.; Shiono, A.; Ribechini, E. Degradation of wood by UV light: A study by EGA-MS and Py-GC/MS with on line irradiation system. J. Anal. Appl. Pyrolysis 2019, 139, 224–232. [Google Scholar] [CrossRef]
- Sabatini, F.; Nacci, T.; Degano, I.; Colombini, M.P. Investigating the composition and degradation of wool through EGA/MS and Py-GC/MS. J. Anal. Appl. Pyrolysis 2018, 135, 111–121. [Google Scholar] [CrossRef]
- Merckel, R.D.; Heydenrych, M.D.; Sithole, B.B. Pyrolysis oil composition and catalytic activity estimated by cumulative mass analysis using Py-GC/MS EGA-MS. Energy 2021, 219, 119428. [Google Scholar] [CrossRef]
- Peng, Y.-Y.; Dussan, D.D.; Narain, R. Thermal, mechanical, and electrical properties. Polym. Sci. Nanotechnol. 2020, 179–201. [Google Scholar] [CrossRef]
- Tomoda, B.T.; Yassue-Cordeiro, P.H.; Ernesto, J.V.; Lopes, P.S.; Péres, L.O.; da Silva, C.F.; de Moraes, M.A. Characterization of biopolymer membranes and films: Physicochemical, mechanical, barrier, and biological properties. Biopolym. Membr. Film. 2020, 67–95. [Google Scholar] [CrossRef]
- Ebnesajjad, S. Surface and Material Characterization Techniques; William Andrew Publishing: Norwich, NY, USA, 2014; ISBN 9780323264358. [Google Scholar]
- Schubnell, M. Thermogravimetry and gas analysis, Part 1: Basic principles and overview. Mettler Toledo User Com 2017, 45, 1–9. [Google Scholar]
- Heetderks, B.T.; Wang, X. Thermogravimetric Analysis—Fourier Transfer Infrared Spectroscopy (TGA—FTIR) Services Thermogravimetric Analysis—Fourier Transfer Infrared Spectroscopy ( TGA—FTIR) Services. EAG Appl. Note 2019, M-039719. [Google Scholar]
- Parshetti, G.K.; Quek, A.; Betha, R.; Balasubramanian, R. TGA-FTIR investigation of co-combustion characteristics of blends of hydrothermally carbonized oil palm biomass (EFB) and coal. Fuel Process. Technol. 2014, 118, 228–234. [Google Scholar] [CrossRef]
- Toledo, M. Thermogravimetry and Gas Analysis, Part 2: TGA-MS; METTLER TOLEDO Thermal Analysis UserCom45: Selangor, Malaysia, 2017; pp. 1–5. [Google Scholar]
- Thermal Gravimetric Analysis. Available online: http://mcl-inc.com/instrumentation/thermal/ (accessed on 29 April 2020).
- Wang, X.; Deng, S.; Tan, H.; Adeosun, A.; Vujanović, M.; Yang, F.; Duić, N. Synergetic effect of sewage sludge and biomass co-pyrolysis: A combined study in thermogravimetric analyzer and a fixed bed reactor. Energy Convers. Manag. 2016, 118, 399–405. [Google Scholar] [CrossRef] [Green Version]
- Guo, F.; Li, X.; Wang, Y.; Liu, Y.; Li, T.; Guo, C. Characterization of Zhundong lignite and biomass co-pyrolysis in a thermogravimetric analyzer and a fixed bed reactor. Energy 2017, 141, 2154–2163. [Google Scholar] [CrossRef]
- Jin, Q.; Wang, X.; Li, S.; Mikulčić, H.; Bešenić, T.; Deng, S.; Vujanović, M.; Tan, H.; Kumfer, B.M. Synergistic effects during co-pyrolysis of biomass and plastic: Gas, tar, soot, char products and thermogravimetric study. J. Energy Inst. 2019, 92, 108–117. [Google Scholar] [CrossRef]
- Moya, R.; Rodríguez-Zúñiga, A.; Puente-Urbina, A.; Gaitán-Álvarez, J. Study of light, middle and severe torrefaction and effects of extractives and chemical compositions on torrefaction process by thermogravimetric analysis in five fast-growing plantations of Costa Rica. Energy 2018, 149, 1–10. [Google Scholar] [CrossRef]
- Botelho, T.; Costa, M.; Wilk, M.; Magdziarz, A. Evaluation of the combustion characteristics of raw and torrefied grape pomace in a thermogravimetric analyzer and in a drop tube furnace. Fuel 2018, 212, 95–100. [Google Scholar] [CrossRef]
- Kantová, N.; Holubčík, M.; Jandačka, J.; Čaja, A. Comparison of Particulate Matters Properties from Combustion of Wood Biomass and Brown Coal. Procedia Eng. 2017, 192, 416–420. [Google Scholar] [CrossRef]
- Balasundram, V.; Alias, N.; Ibrahim, N.; Kasmani, R.M.; Isha, R.; Abd. Hamid, M.K.; Hasbullah, H. Thermal Characterization of Malaysian Biomass via Thermogravimetric Analysis. J. Energy Saf. Technol. 2018, 1, 31–38. [Google Scholar] [CrossRef]
- Vuppaladadiyam, A.K.; Antunes, E.; Sanchez, P.B.; Duan, H.; Zhao, M. Influence of microalgae on synergism during co-pyrolysis with organic waste biomass: A thermogravimetric and kinetic analysis. Renew. Energy 2021, 167, 42–55. [Google Scholar] [CrossRef]
- Granados, D.A.; Ruiz, R.A.; Vega, L.Y.; Chejne, F. Study of reactivity reduction in sugarcane bagasse as consequence of a torrefaction process. Energy 2017, 139, 818–827. [Google Scholar] [CrossRef]
- Patrick, D.O.; Yusup, S.; Osman, N.B.; Zabiri, H.; Shahbaz, M. Performance of water-leached coal bottom ash as catalyst in Thermogravimetric Analyser (TGA) biomass gasification. Chem. Eng. Trans. 2017, 61, 1681–1686. [Google Scholar] [CrossRef]
- Gajera, Z.R.; Verma, K.; Tekade, S.P.; Sawarkar, A.N. Kinetics of co-gasification of rice husk biomass and high sulphur petroleum coke with oxygen as gasifying medium via TGA. Bioresour. Technol. Rep. 2020, 11, 100479. [Google Scholar] [CrossRef]
- Yang, X.; Liu, X.; Li, R.; Liu, C.; Qing, T.; Yue, X.; Zhang, S. Co-gasification of thermally pretreated wheat straw with Shengli lignite for hydrogen production. Renew. Energy 2018, 117, 501–508. [Google Scholar] [CrossRef]
- Thengane, S.K.; Gupta, A.; Mahajani, S.M. Co-gasification of high ash biomass and high ash coal in downdraft gasifier. Bioresour. Technol. 2019, 273, 159–168. [Google Scholar] [CrossRef] [PubMed]
- Puig-Gamero, M.; Lara-Díaz, J.; Valverde, J.L.; Sanchez-Silva, L.; Sánchez, P. Dolomite effect on steam co-gasification of olive pomace, coal and petcoke: TGA-MS analysis, reactivity and synergistic effect. Fuel 2018, 234, 142–150. [Google Scholar] [CrossRef]
- Pahla, G.; Ntuli, F.; Muzenda, E. Torrefaction of landfill food waste for possible application in biomass co-firing. Waste Manag. 2018, 71, 512–520. [Google Scholar] [CrossRef]
- Barzegar, R.; Yozgatligil, A.; Olgun, H.; Atimtay, A.T. TGA and kinetic study of different torrefaction conditions of wood biomass under air and oxy-fuel combustion atmospheres. J. Energy Inst. 2020, 93, 889–898. [Google Scholar] [CrossRef]
- Ma, Z.; Wang, J.; Yang, Y.; Zhang, Y.; Zhao, C.; Yu, Y.; Wang, S. Comparison of the Thermal Degradation Behaviors and Kinetics of Palm Oil Waste under Nitrogen and Air Atmosphere in TGA-FTIR with a Complementary Use of Model-Free and Model-Fitting Approaches; Elsevier: Amsterdam, The Netherlands, 2018. [Google Scholar]
- Kanca, A. Investigation on pyrolysis and combustion characteristics of low quality lignite, cotton waste, and their blends by TGA-FTIR. Fuel 2020, 263, 116517. [Google Scholar] [CrossRef]
- Halder, P.; Kundu, S.; Patel, S.; Parthasarathy, R.; Pramanik, B.; Paz-Ferreiro, J.; Shah, K. TGA-FTIR study on the slow pyrolysis of lignin and cellulose-rich fractions derived from imidazolium-based ionic liquid pre-treatment of sugarcane straw. Energy Convers. Manag. 2019, 200, 112067. [Google Scholar] [CrossRef]
- Wang, S.; Uzoejinwa, B.B.; Abomohra, A.E.F.; Wang, Q.; He, Z.; Feng, Y.; Zhang, B.; Hui, C.W. Characterization and pyrolysis behavior of the green microalga Micractinium conductrix grown in lab-scale tubular photobioreactor using Py-GC/MS and TGA/MS. J. Anal. Appl. Pyrolysis 2018, 135, 340–349. [Google Scholar] [CrossRef]
- Manić, N.G.; Janković, B.Ž.; Stojiljković, D.D.; Jovanović, V.V.; Radojević, M.B. Tga-Dsc-Ms Analysis of Pyrolysis Process. Therm. Sci. 2019, 23, 1457–1472. [Google Scholar] [CrossRef]
- Sindhu, R.; Binod, P.; Pandey, A. Microbial Poly-3-Hydroxybutyrate and Related Copolymers; Elsevier B.V.: Amsterdam, The Netherlands, 2015. [Google Scholar]
- Stark, W.; Bohmeyer, W. Non-Destructive Evaluation (NDE) of Composites: Using Ultrasound to Monitor the Curing of Composites; Woodhead Publishing: Sawston, UK, 2013. [Google Scholar]
- Wang, S.; Yu, S.; Siedler, M.; Ihnat, P.M.; Filoti, D.I.; Lu, M.; Zuo, L. A power compensated differential scanning calorimeter for protein stability characterization. Sens. Actuators B Chem. 2018, 256, 946–952. [Google Scholar] [CrossRef]
- Pecchi, M.; Patuzzi, F.; Basso, D.; Baratieri, M. Enthalpy change during hydrothermal carbonization of biomass: A critical review. J. Therm. Anal. Calorim. 2020, 141, 1251–1262. [Google Scholar] [CrossRef]
- Pecchi, M.; Patuzzi, F.; Benedetti, V.; Di Maggio, R.; Baratieri, M. Thermodynamics of hydrothermal carbonization: Assessment of the heat release profile and process enthalpy change. Fuel Process. Technol. 2020, 197, 106206. [Google Scholar] [CrossRef]
- Pecchi, M.; Patuzzi, F.; Benedetti, V.; Di Maggio, R.; Baratieri, M. Kinetic analysis of hydrothermal carbonization using high-pressure differential scanning calorimetry applied to biomass. Appl. Energy 2020, 265, 114810. [Google Scholar] [CrossRef]
- Pecchi, M.; Patuzzi, F.; Benedetti, V.; Basso, D.; Baratieri, M. Evaluation of the overall reaction enthalpy change of hydrothermal carbonization process by means of differential scanning calorimetry at high pressure. Eur. Biomass Conf. Exhib. Proc. 2019, 1160–1163. [Google Scholar] [CrossRef]
- Funke, A.; Ziegler, F. Propagation of uncertainties and systematic errors in the measurements of long-lasting heat flows using differential scanning calorimetry. J. Therm. Anal. Calorim. 2012, 108, 1317–1324. [Google Scholar] [CrossRef]
- Ibbett, R.; Gaddipati, S.; Tucker, G. In-situ studies of hydrothermal reactions of lignocellulosic biomass using high-pressure differential scanning calorimetry. Biomass Bioenergy 2019, 121, 48–55. [Google Scholar] [CrossRef]
- Benefits Thermogravimetric Gas Chromatography Mass Spectrometry. Available online: https://www.chromatographyonline.com/view/benefits-thermogravimetric-gas-chromatography-mass-spectrometry (accessed on 1 May 2020).
- Lin, X.; Sui, S.; Tan, S.; Pittman, C.U.; Sun, J.; Zhang, Z. Fast pyrolysis of four lignins from different isolation processes using Py-GC/MS. Energies 2015, 8, 5107–5121. [Google Scholar] [CrossRef] [Green Version]


| Thermochemical Process | Temperature (°C) | Pressure (MPa) | Gas Products | Pollutants | Purpose | Advantages |
|---|---|---|---|---|---|---|
| Gasification | 500 to 1300 | ≥0.1 | CO2, H2, CO2, H2O, and CH4 | H2S, NH3, tar, and dust | Converting biomass to high HV gas | Production of a wide range of chemical products and the ability to adapt to changing market conditions. |
| Pyrolysis | 300 to 1000 | 0.1 to 0.5 | CO, H2, CH4, and other hydrocarbons | H2S, NH3, tar, and dust | Converting biomass to biochar and bio-oil | Liquid fuels are produced directly, and after appropriate treatment, it can be directly treated in conventional refineries. |
| Combustion | 700 to 1000 | ≥0.1 | CO2 and H2O | SOxy, NOxy, polycyclic aromatic hydrocarbons (PAHs), and dust | Converting biomass to heat and electricity | The procedure is straightforward. Co-combustion of biomass and coal does not necessitate any changes to existing power plants. |
| Torrefaction | 200 to 300 | ≥0.1 | CO2, CO, and CH4 | H2S, COS, CS2, NH3, and HCN | Converting biomass into coal-like material | Moisture reduction, energy density increase, O/C ratio reduction, and improved ignitability and reactivity of the processed fuel. |
| Hydrothermal liquefaction | 250 to 550 | 5 to 25 | H2, CO, CO2, and CH4 | Polypropylene (PE), polypropene (PP), and nylon-6 (NY) | Converting wet biomass into crude-like oil | Process is environmentally friendly. The energy efficiency of the HTL process is very high. |
| Process | Composition of Biomass Feedstock | Reference |
|---|---|---|
| Solvolytic liquefaction of oil palm empty fruit bunch | phenolics—phenol, 2,6-dimethoxyphenol (syringol), phenol,2,6-dimethoxy-4[2-propenyl]-, 2,6-dimethoxyphenol (syringol),1,2,3-trimethoxy-5-methyl, phenol cyclopentanones—3-methyl-cyclopentene-1,2-dione, 2-hydroxy-3methyl-cyclopent-2-en-1-one, 2,3,3,4,7-pentamethyl-2,3-dihydro-benzofuran ethanol compounds—2-[4-methoxyphenoxy] ethanol, ethanol,2,2′-oxybis-, ethanol,2, -[4-ethylphenoxy]-, ethanol,2-[2-phenoxyethanoxy] | [83] |
| Pyrolysis of residual bacterial biomass from polyhydroxyalkanoate production | phenolics—phenol, 2-methylphenol, 3-methylphenol cyclopentanones—3-methyl-1,2-cyclopentanedione, 2,3-dimethyl-2-cyclopentanedione pyrrole compounds- 1,2.5-trimethylpyrrole, 3-ethyl-2,4-dimethyl-pyrrole | [84] |
| Maturity evaluation of compost from sewage sludge and green waste | phenolics—phenol,4-methoxy, phenol, phenol,4-methyl, 2-methoxy-4-vinylphenol, phenol,3-ethyl, 4-vinylphenol benzenes—benzene, ethyl benzene, dimethylbenzene, benzene, (1-methylethyl), benzene propyl, benzene,1-ethyl-2-methyl, benzene,1,2,4-trimethyl, benzene, propenyl, benzene,1-methyl-2-propyl, benzene, butyl, benzene,2-ethenyl-1,3-dimethyl, benzene, methyl (methylethenyl), benzene, hexyl, benzene, heptyl cyclopentanones—2-cyclopeneten-1-one, 2-cyclopeneten-1-one,2-methyl, 2-cyclopenten-1-one,3-methyl, 2-cyclopenten-1-one,2,3-dimethyl, 2-cyclopenten-1-one,2-hydroxy,3-methyl furans— 2-furancarboxaldehyde, 2-furancarboxaldehyde,5-methyl | [79] |
| Impact of biomass diversity on torrefaction | phenolics—phenol, phenol, 2-methoxy (guaiacol), phenol, 2,6-dimethoxy- (syringol), 2-methoxy-4-vinylphenol, cathecol, isoeugenol (cis + trans), eugenol, vanillin, phenol, 2-methoxy-4-methyl- (creosol), phenol,4-ethyl-2-methoxy, P-propylguaiacol furans—furan, 3-furaldehyde, furfural, 2-furanmethanol, acetylfuran, 2(5H)-furanone, furan, 2-methyl-, 2-furancarboxylic acid, methyl ester, 2-furancarboxaldehyde, 5-methyl-, 2,5-furandione, 3-methyl-, ethenone, 1-(3-hydroxy-2-furanyl)- (Isomaltol) cyclopentanones—4-cyclopentene-1,3-dione, 1,2-cyclopentanedione, 2-cyclopenten-1-one, 2-hydroxy-3-methyl- | [74] |
| Fast pyrolysis of beechwood | phenolics—2-methylphenol, 2-methoxyphenol, 2-methoxy-4-methylphenol, 4-ethyl-2-methoxyphenol, 4-ethenyl-2-methoxyphenol, 2,6-dimethoxyphenol, 4-methoxy-3-(methoxymethyl) phenol, 2-methoxy-4-propenylphenol, (+)-s-2-phenethanamine,1-methyl-n-vanillyl, 4-allyl-2,6-dimethoxyphenol aldehydes—acetaldehyde, succinaldehyde, 2,3-dihydroxybenzaldehyde, 4-hydroxy-3-methoxybenzaldehyde, 4-hydroxy-3,5-dimethoxybenzaldehyde, 3,5-dimethoxy-4-hydroxycinnamaldehyde ketones—1-hydroxy-2-propanone, 3-amino-2-oxazolidinone, 5-hexen-2-one, 3-hydroxycyclohexanone, 2(5h)-furanone, 1,2-cyclopentanedione, 3-methyl-1,2-cyclopentanedione, 4-hydroxy-3-methoxyacetophenone, 3′,5′-dimethoxyacetophenone, 1-(4-hydroxy-3,5-dimethoxyphenyl) ethenone, desaspinidol | [80] |
| Biomass Feedstock | Technologies/Instrument | Chromatographic Analysis Conditions | Main Findings | Reference |
|---|---|---|---|---|
| Raw wood, and wood char | Micro-GC | Temperature: 850, 900, and 950 °C Ratio feedstock to biomass: (0:100, 20:80, 50:50, 80:20, and 100:0) | The gasification rate rises to optimum values, which differ according to the coal-to-biomass ratio. The average reactivity of the blended coal–biomass char decreases as the proportion of coal in the blend increases, and the impact of the coal appears to be decreased at higher gasification temperatures. | [93] |
| Sawdust pellets | Micro-GC (INFICON, 3000) | Temperature: 480 °C Ratio feedstock to biomass: (10, 20, 40, 80, and 100%) | The average heating at about 100 °C/min. The biochar catalyst loading ratio to feedstock has an important impact on product yields | [94] |
| Beech wood | GC-MS (Fison GC 8000/MD 800 system) | Column: DB-1701 capillary column (60 m × 0.25 mm × 0.25 mm) Temperature: 45 to 245 °C Gas: 1.0 mL/min MS: m/z 30 to 300 | Based on the initial dry wood mass, the yield of char, total liquids, water, and gas were reported. Total liquid yields range from 40 to 55% of dry wood. It quantifies the amount of tar at around 40 to 43%. | [85] |
| EFB | Py-GC-MS (GC 6890 and MSD 5973) | Column: fused silica HP-5 ms column (30 m × 0.25 mm × 25 µm) Temperature: 250 °C Gas: 1.0 mL/min MS: no data | The HHV of EFB at around 18.69 MJ/kg. Phenolic compounds are the most common compounds found in EFB. | [83] |
| Residual bacterial biomass | Py-GC-MS | Column: RTx-5MS capillary column (30 m × 0.25 mm × Restek) Temperature: 40 to 250 °C Gas: no data MS: no data | There were 32 pyrolysis compounds found, with carbon dioxide being the most common, followed by acetic acid (9.8%), docosenamide (10.9%), and acetaldehyde (9.1%). Compounds extracted from carbohydrates (including acetic acid) accounted for 20%. The pyrolysis products were N-containing compounds derived from protein, which accounted for around 36%. | [84] |
| Chrorella vulgaris | GC-MS (GC, HP 6890), (MS, 5973) | Column: ZB-WAX column (30 m × 0.25 mm × 0.25 µm) Temperature: 220 °C Gas: 1.0 mL/min MS: m/z 20 to 450 | The 20 fatty acids were reported, with omega-6 being the most prevalent and having a higher percentage of unsaturation. A total of 48 lipids have been identified and putatively annotated in the major clusters. | [95] |
| Five Indian coals | Py-GC-MS (Agilent 7890 GC, Agilent 5975C MS) | Column: DB1701 (60 m × 0.25 mm × 0.25 µm) Temperature: 300 °C Gas: 1.0 mL/min MS: no data | It is most suitable at temperature of 650 °C because of the maximum breakdown of coal structure associations. In comparison with the OCs, the SCCs showed the low region of the n-alkanes and alkenes. | [96] |
| Sewage sludge, and green waste | Py-GC-MS (Hewlett Packard HP-6890) | Column: Sol Gel Wax column (60 m × 0.32 mm × 0.5 µm) Temperature: 280 °C Gas: 1.0 mL/min MS: m/z 40 to 700 | The concentration of lipid in sewage sludge (58 mg/g) is higher than that in green waste (16 mg/g). The total peak area of nitrogenous compounds in sewage sludge was 334%, compared to just 93% in green waste. | [79] |
| 14 types of European biomasses | TGA-GC-MS (TGA, 92-16.18 SETARAM TGA 92) | Column: three-plate crucible (10 mm × 2 mm) Temperature: 200 to 300 °C Gas: 50 mL/min MS: no data | The final solid mass loss at the end of the dynamic stage is between 20 to 26%, and between 33 and 58% during the isothermal stage. After torrefaction, the hydrogen content remained low and had little impact. At temperature below 300 °C, furfural’s production profiles are at the peak. | [74] |
| Rice husk, chicken manure, wood chip, coconut fibre, maize straw, cotton straw, and rice straw | GC-MS (7890-5975C, Agilent technologies) | Column: HP-5MS chromatographic column Temperature: 60 to 300 °C Gas: 0.6 mL/min MS: m/z 30 to 500 | Cotton straw has the highest gasification activity, and the reaction takes 5 min to complete. At temperature of 900 °C, the gas composition of biomass full gasification. The amount of hydrogen is the highest, the amount of methane is the lowest. | [87] |
| Rice husk and PE pellets | GC (Agilent, Micro GC, 300A) | - | The oxygenated compounds in biomass raw tars become more difficult to crack as PE is added to the feedstock. The total gas of hydrogen and carbon monoxide yields, particularly for a PE proportion of 50 and 75%. | [88] |
| Imperata cylindica | Py-GC-MS (CDS 5200 micro pyrolser close-coupled), (PerkinElmer Clarus 680 GC), and (Clarus 600S MS) | Column: PerkinElmer Elite-1701 column (30 m × 0.25 mm × 0.25 mm) Temperature: 250 °C Gas: 50 mL/min, and a split ratio of 50:1 MS: no data | The optimum number of components detected and the percentage peak area are at 500 °C. For 400 to 600 °C, the gas product increases from 31.44 to 35.96% as the temperature increases. If the temperature rises, the release of volatile matter and secondary decomposition of bio-oil will increase. | [97] |
| Rice straw, cedar wood, and dalbergia wood | Py-GC-MS (Frontier Laboratories LTD, PY-3030D, Japan) | Column: DB-WAX (30 m × 0.25 mm × 0.25 µm) Temperature: 270 °C Gas: a split ratio of 1:40 MS: m/z 35 to 450 | Rice straw’s high concentration of hemicellulose and cellulose resulted in a large number of acids and saccharides when pyrolysis at 270 °C. The content of levoglucosan of rice husk decreased as the temperature increase. The concentration of alcohols in cedar wood decreased as the temperature increased. Dalbergia wood has the highest lignin content compared to two other types of biomasses. | [89] |
| Algae biomass | GC × GC-MS (Pegasus 4D System from Leco), and (Agilent 7890GC) | Column: Rxi- 17SilMS (Restek; 30 m × 0.25 mm × 0.25 µm) and SLB-5MS (Supelco; 1.5 m × 0.1 mm × 0.1 µm) Temperature: 280 °C Gas: 1.2 mL/min and a split ratio of 1:25 MS: no data | The carbon and hydrogen content increase slightly with proceeding hydrogenation (increasing temperature and/or residence time). Hydrogen compounds classes are increases significantly, while heteroatomic compounds classes decrease. Using a traditional NiMo/Al2O3 refinery catalyst, oxygen and nitrogen were reduced at temperatures ranging from 340 to 400 °C and pressures ranging from 238 to 253 bar. | [90] |
| Corn stalk | GC-MS (GCMS-QP2010 Ultra; Shimadzu) | Column: RTX-5MS capillary column (Restek; 30 m × 0.25 mm × 0.25 µm) Temperature: 50 to 260 °C Gas: 1.27 mL/min and a split ratio of 100:1 MS: m/z 35 to 500 | The temperature of the pyrolysis reaction influences the types and yields of compounds formed by catalytic pyrolysis of biomass. Total peak area increases as the pyrolysis temperature increased from 285 to 600 °C; then, it dropped sharply at 700 °C. | [91] |
| Corn Stover | Py-GC-MS (Agilent 7890A/5975C) | Column: HP-5MS capillary column (30 m × 0.25 mm × 0.25 µm) Temperature: no data Gas: He- 1 mL/min and a split ratio of 1:80 MS: m/z 35 to 550 | The coke yields of FZ, SZ, and RZ were followed by (FZ > RZ > SZ). RZ slightly promoted the production of phenols while SZ reduced the relative content of phenols | [98] |
| Soybean | Py-GC-MS (CDS pyroprobe 5250 pyrolyzer), and (Trace DSQII, Thermo Scientific, USA) | Column: TG-5MS capillary column (30 m × 0.25 mm × 0.25 µm) Temperature: 40 to 280 °C Gas: He—1 mL/min and a split ratio of 1:40 MS: m/z 45 to 650 | Two-step pyrolysis’s overall peak areas were all smaller than those of one-step pyrolysis. The volatile yield of one-step pyrolysis was increased by using a higher pyrolysis temperature for a longer time. | [92] |
| Beechwood | Py-GC-MS (CDS pyroprobe 5200 pyrolyser), and (Agilent 7890/5975C) | Column: HP5MS capillary column (30 m × 0.25 mm) Temperature: 50 to 300 °C Gas: He—1 mL/min and a split ratio of 1:500 MS: m/z 35 to 400 | Beechwood contains 45.8% cellulose, 31.8% hemicellulose, and 21.9% lignin. The amount of carbon dioxide removed from pyrolysis products decreases as the calcination temperature of red mud catalyst increases. For beechwood pyrolysis vapours, thermal pre-treatment of red mud at 950 °C was found to be effective. | [80] |
| Rice straw | GCMS (GC, K8880181 by ThermoFisher), (MS, DSQII by Thermo Scientific), and autosampler (ThermoFisher AI 1310) | Column: Rxi-5ms (30 m × 0.25 mm × 0.25 µm) Temperature: 35 to 275 °C Gas: no data MS: no data | When the temperature of the torrefaction process increase, the amount of pyrolysis bio-oil, gas, and water decreased, as did the amount of char. The torrefaction process helps in the improvement of pyrolysis bio-oil production. To optimise pyrolysis bio-oil recovery from rice straw, a torrefaction temperature of 225 °C with a pyrolysis temperature of 550 °C was suggested as the optimum condition. | [86] |
| Rice husk | Py-GC-MS (Agilent 7890GC/5975MS), and commercialised pyrolyser (no.5200, CDS Analytics Inc.) | Column: HO-5MS capillary column (30 m × 0.25 mm × 0.25 µm) Temperature: 35 to 275 °C Gas: He—1 mL/min and a split ratio of 1:80 MS: no data | As the severity of torrefaction improved, the carbon content increased, but the hydrogen and oxygen contents decreased. HHV were obtained as the carbon content of the torrefied sample was increased. | [99] |
| Sunflower husk, oat husk, wheat straw, miscanthus, hay, wood chips, willow and poplar | Py-GC-MS (Shimadzu GC-2010), and (GC/MS-QP2010) | Column: HO-5MS capillary column (30 m × 0.25 mm × 0.25 µm) Temperature: 85 to 145 °C Gas: 0.97 mL/min MS: no data | Different outcomes are obtained when wheat straw is burned at temperatures ranging from 350 to 450 °C. There are five chemicals produced when a greater burning temperature (450 °C) is used. There were just nine substances in the situation of combustion at a lower temperature (350 °C). | [6] |
| Fir and chestnut | EGA/PY-3030D microfurnace pyrolyser, equipped with an UV-1047Xe micro-UV-irradiator | Column: Ultra ALLOY capillary column (30 m × 0.25 mm × 0.5 µm) Temperature: 280 to 550 °C Gas: no data MS: m/z 50 to 600 | A shift in the relative intensities of holocellulose’s m/z signals. The signals at m/z 60 and 73 increased, which is typical of levoglucosan, the main pyrolysis product of cellulose. The primary process produces anhydro sugars by depolymerising holocellulose. Fir wood showed significant changes, including an increase in the H/L ratio and higher yields of both small molecules and anhydro sugars. | [100] |
| Wool | Multi-Shot Pyrolyser EGA/Py-3030D micro-furnace coupled to 6890 GC Agilent Technologies | Column: silica pre-column (2 m × 0.32 mm i.d., Agilent J&W, USA) and HP-5MS fused capillary column (30 m × 0.25 mm i.d., Hewlett Packard, USA) Temperature: 230 to 500 °C Gas: no data MS: m/z 50 to 600 | The presence of alkenes is caused by the radical breaking of the esters found in iso- and anteiso- fatty acids, which is caused by thermal degradation. Working at low temperatures (290 °C) resulted in a pyro gram rich in diketopiperazines. | [101] |
| Pyrolysis oil | Pyrolysis-GCMS using a Shimadzu multi-functional pyrolyser EGA/PY- 3030D | Column: polydimethylsiloxane, UA1 (30 m × 0.25 mm i.d., 2 µm) Temperature: 300 to 500 °C Gas: He—50 mL/min MS: m/z 50 to 650 | An increase in the amount of hydrogen in the pyrolysis oil and a decrease in the amount of oxygen. Mg-Al-LDO has the highest deoxygenation rate compared to all catalysts. | [102] |
| Technologies | Advantages | Limitations | Typical Applications |
|---|---|---|---|
| MS | Using online technology, the average resolution is 2 °C. Dynamic susceptibility is high (>5 decades). It is important to do a quantitative analysis. | 300 amu is the maximum mass. Data interpretation necessitates prior knowledge of the dataset. Big molecules will obstruct the gas inlet (condensation). The format of the data is incompatible with that of other databases. | Small molecule detection. Active pharmaceutical products and residual solvents. |
| FTIR | Online technology with a standard temperature resolution of 2 °C. IT can also be used to analyse solids, but a Fourier transform infrared (ATR) accessory is needed (only iS50). It also contains information on the composition of the gases observed. | Dynamic sensitivity is about 3 decades (DTGS detector). Quantitative assessment can be challenging. Interpretation IR data necessitates prior knowledge of the survey and familiarity with it. Not as responsive as MS or GC-MS. | Clear and complicated compound detection. Active pharmaceutical products and residual solvents. |
| Biomass Feedstock | Process/Technologies | Experimental Condition | Main Finding | Reference |
|---|---|---|---|---|
| Sewage sludge and wheat straw | Co-pyrolysis (TGA) | Final temperature: 1000 °C Heating rate: 20 °C/min | The yield of gas and liquid has increased, while the yield of solid residue has decreased. When the temperature increases, the gas yield increases, but the liquid and char yields decrease. Wheat straw percentages have a major impact on gas composition and synergetic influence. | [111] |
| Zhundong lignite and pine sawdust | Co-pyrolysis (TGA) | Final temperature: 900 °C Heating rate: 10, 20, 30, and 40 °C/min | Gas products increase while tar and char yield decreased. The condensable tar and non-condensable gases increased gradually with the increasing temperature. | [112] |
| Wheat straw and plastic | Co-pyrolysis (TGA) | Final temperature: 1100 °C Heating rate: 20 °C/min | With the temperature increase, the content of all carbon-containing gas species normally decreases, while the hydrogen content increases. When char yield rises in non-sooty conditions, tar yield falls. Under sooty conditions, tar yields increase, and it will affect soot particle size distribution. | [113] |
| Woody biomass | Torrefaction (TGA) | Temperature: 225–300 °C Holding time: 20, 30, and 40 min | For light, mild, and severe torrefaction, the maximum devolatilisation rates were 4.16, 1.80, and 0.70%/min, respectively. | [114] |
| Grape pomace | Torrefaction (TGA) | Temperature: 800 °C Heating rate: 10 °C/min | The energy values of raw and torrefied grape pomace have 84.9 and 85.2 kJ/mol in devolatilisation stage. Torrefied grape pomace has higher nitrogen content than raw biomass. Torrefied grape pomace has a lower volatile content and a higher fixed carbon content than raw biomass. | [115] |
| Wood biomass and brown coal | Combustion (TGA) | Temperature: 1350 °C | Density of particulate matter (PM) from wood biomass higher than brown coal. Content of sulphur in PM brown coal at around 0.398%. PM size distribution in dimensions between 20 and 100 µm. | [116] |
| Empty fruit bunch, rice husk, coconut pulp, saw dust, coconut shell, and sugar cane bagasse | Pyrolysis (TGA) | Final temperature: 700 °C Heating rate: 80 °C/min | The moisture content of saw dust is higher 9.55 wt % than five biomass samples. Saw dust has a lower HHV of 17.03 MJ/kg than other five biomass samples. Sugarcane bagasse has high thermal degradation rate of 0.0523 mg/s. | [117] |
| Biomass wastes and digested biomass wastes | Co-pyrolysis (TGA) | Final temperature: 850 °C Heating rate: 10, 15, and 20 °C/min | Increases in the proportion of microalgae in the blends resulted in a decrease in activation energy value and a rise in gas yields. With an increase in the proposition of microalgae, the evolution of carbon monoxide and carbon dioxide decreased. | [118] |
| Sugarcane Bagasse | Torrefaction (TGA-FTIR) | Temperature: 230, 290 °C Holding time: 30 min | Reduction in the functionalities of hydrogen and oxygen in the char as well as a 30% rise in HHV. When the temperature increases, the mass decreases; at a temperature of 290 °C, the maximum mass loss was 2.6 times faster. | [119] |
| Palm kernel shell with coal bottom ash (CBA) | Gasification (TGA) | Temperature: 22.38, 30, 45, 60, and 66.20 °C Gasifying agent: CO2 | When CBA was used as a catalyst in the TGA gasification of palm kernel shell, it produced 40.78 vol % hydrogen. The highest syngas composition at 70.94 vol % was obtained when using CBA at 45 °C for 6.5 h with an L/s ratio of 2.59. | [120] |
| Rice husk and petroleum coke | Co-gasification (TGA) | Temperature: 360–545 °C Gasifying agent: CO2 and O2 | The TGA curves change towards higher temperatures as the heating rate is increased from 10 °C/min to 20 and 30 °C/min, but the overall form is retained. With increasing the heating temperature, the pyrolysis stage of the rice husk is slightly more sensitive than the char gasification stage. The maximum rate of degradation increased by 7.66% with an increase in the heating rate from 10 to 30 °C/min. | [121] |
| Wheat straw | Co-gasification (TGA-FTIR) | Temperature: 1050 °C Gasifying agent: CO2 | The maximum gasification rate changes as pre-treated with varying temperatures. | [122] |
| Garden waste pellet and coal | Co-gasification (TGA) | Temperature: 690–900 °C Gasifying agent: CO2 | The reactivity of the gasification rate depends on the biomass ratio. The addition of biomass to coal steadily increased the overall reactivity until the biomass ratio reached 0.5. | [123] |
| Coal, pet coke, and olive pomace | Co-gasification (TGA-MS) | Temperature: 105–1000 °C Heating rate: 40 °C/min Gasifying agent: CO2 | The binary blend containing dolomite has the highest hydrogen per carbon monoxide ratio, the lowest hydrogen sulphide, nitrogen oxide, and sulphur dioxide emissions, and the highest synergetic influence. | [124] |
| Food waste | Torrefaction (TGA-FTIR) | Temperature: 225, 275, and 300 °C Holding time: 40min | A rise in the rate of weight loss, with the maximum peak at 300 °C. Torrefied food waste had a carbon content just 5% lower than bituminous coal. The lack of hydrogen due to the release of H2O explains the decrease in hydrogen content. | [125] |
| Pine wood chips | Torrefaction (TGA) | Temperature: 250, 300, and 350 °C Heating rate: 10, 20, and 40 °C/min Holding time: 5, 15, and 30 min | The temperature and residence time increase, which results in the volatile matter decreasing and the fixed carbon increasing. The atomic ratio of O/C and H/C decreased as biomass was torrefied. The average activation energy for 300 °C with 30 min biomass was 183.40 kJ/mol, while the lowest value was 72.93 kJ/mol for 350 °C with 15 min biomass. | [126] |
| Palm kernel shell | Pyrolysis (TGA-FTIR) | Final temperature: 800 °C Heating rate: 10, 30, and 50 °C/min | Since the heating rate was raised from 10, 30, and 50 °C/min, the apparent activation energy increased. The devolatilisation of cellulose and hemicellulose played a major role in the weight loss. The weight loss rate increased as the heating rate increased at the same temperature. | [127] |
| Cotton waste | Pyrolysis (TGA-FTIR) | Final temperature: 1000 °C Heating rate: 20 °C/min | The destruction of hemicellulose, cellulose, and lignin occurs in increasing order of temperature during the thermal decomposition of biomass. At a temperature of 311 °C, the highest peak indicates the fastest rate of weight loss. | [128] |
| Sugarcane straw | Slow pyrolysis (TGA-FTIR) | Final temperature: 700 °C Heating rate: 10, 15, and 20 °C/min | During the pre-treatment period, approximately 6.4% of the mass of untreated SCS was lost. As the heating rate increases, the peak corresponding to the maximum decomposition of the samples changes towards higher temperature. When compared to untreated SCS pyrolysis, the concentration of CH4 released by RCRM pyrolysis was higher. | [129] |
| Micactinium conductrix | Pyrolysis (TGA-MS) | Final temperature: 900 °C Heating rate: 20 °C/min | With the lowest residual solid products, biomass harvested at MEP and LEP showed a higher degree of conversion or mass loss reaction through thermal degradation. The thermal breaking of weak bonds in the polymetric structure is responsible for the maximum weight loss. | [130] |
| Corn brakes, wheat straw, and hazelnut shell | Pyrolysis (TGA-MS) | Final temperature: 550 °C Heating rate: 5, 10, and 20 °C/min | When the heating rises, the intensity of the ion current rises as well, resulting in a higher rate of gas product release. When changing the heating rate from the lowest to the maximum rate of heating, the CO evolution profile of HS pyrolysis shows a significant deviation from DTG maxima. | [131] |
| Biomass Feedstocks | Technologies/Instrument | DSC Analysis Conditions | Main Findings | Reference |
|---|---|---|---|---|
| Cellulose, wood, and digestate | Maia 200 F3 heat-flux DSC | Crucible: High-pressure titanium crucible (100 µL capacity, 100 bar maximum pressure) Temperature: 156 to 476 °C Gas: 100 mL/min Heating rate: 5 °C/min | For wood and digestate, the heat release was highest at the beginning, whereas for cellulose, it was highest after 50 min, and then all three curves converged to zero with time. The most energy was released by cellulose, owing to the exothermic carboxylation reaction. | [136] |
| Digestate and sludge | Maia 200 F3 heat-flux DSC | Crucible: High-pressure titanium crucible (100 µL capacity, 100 bar maximum pressure) Temperature: 190 to 250 °C Gas: 50 and 100 mL/min Heating rate: 5 °C/min | Regarding the quantity and nature of the products created during the first run, the higher the HTC process temperature, the more gas is produced, resulting in a bigger endothermic effect on heat flow ES. The activation energies for digestate and sludge are 139.16 and 161.68 kJ/mol, respectively. | [137] |
| Cellulose, wood, and digestate | Maia 200F3, NETZSCH | Crucible: High-pressure titanium crucible (100 µL capacity, 100 bar maximum pressure) Temperature: 156 to 476 °C Gas: No data Heating rate: 5 °C/min | The presence of hemicellulose in wood, HTC enthalpy emission in wood, and digestate began at a lower temperature. The decreased activity of lignin at 250 °C accounts for the lower enthalpy of wood in comparison to cellulose. | [138] |
| Glucose, microcrystalline cellulose powder, and wood | PerkinElmer (DSC-7) | Crucible: Pressure capsules (30 µL) Temperature: 105 °C Gas: No data Heating rate: No data | Most of the heat is dissipated between 30 and 40 min for cellulose and wood, while it takes longer for cellulose. At a pH of 3, adding acetic and formic acid had no effect on the kinetics of the heat effects. | [139] |
| Wheat straw, Miscanthus, and willow biomass species | Mettler-Toledo DSC 823 | Crucible: High-pressure DSC pan Temperature: 50 to 320 °C Gas: No data Heating rate: No data | A temperature scan of totally dry wheat straw revealed two separate exotherm peaks at 250 and 280 °C. The hemicellulose exotherm shifts downward as a result of hydration. | [140] |
| Phenomenon/Property | Technologies | |
|---|---|---|
| DSC | TG | |
| Melting | + | − |
| Glass transition | + | − |
| Crystallisation | + | − |
| Reaction (Curing/Polymerisation) | + | + |
| Sublimation/Evaporation/Dehydration | + | + |
| Thermal decomposition | + | + |
| Thermal history | + | − |
| Specific heat capacity | + | − |
| Property | Enthalpy | Mass |
| Technologies | Applications |
|---|---|
| Micro-GC | A gas detector collection was used to assess the permanent gas composition. |
| GC-MS | The analysis of metabolites. Lipophilic compounds are detected. Aromatic amines that are biologically essential are examined. Application to human dosimetry. Acidic phytohormones and associated compounds are analysed in a single-run sensitive and quantitative manner. Detection of a toxic compound. Pyrethroid residues in vegetable samples need to be determined. Pesticides in foodstuffs are investigated. Applications in the environment and forensics unclassified. |
| Py-GC-MS | Most materials, such as insoluble and complex materials, can be characterised at trace levels without any sample pre-treatment. Investigate the structure of difficult-to-solve polymer compounds, investigate resin, degradation, and study volatile additives. |
| GC × GC-MS | Illicit products, forensic toxicology, fire ash, fossil research, environmental investigations, and explosives are the major areas. |
| TGA | The assessment of degradation patterns and the composition of reaction kinetics was used to characterise products. Moisture content, volatile matter, ash content, and fixed carbon content are all measured using proximate analysis. Since each component’s thermal decomposition temperature is different, it can quantitatively overcome complex mixtures. Identifying the amount of water or residual solvents in a substance. |
| TGA-FTIR | Determine the compounds and the functional groups of substances that characterise them. This method is suitable for measuring compounds with medium to high infrared absorption. |
| TGA-MS | To detect very tiny quantities of substances. This method is suitable for determining the properties of volatile compounds. |
| DSC | To calculate enthalpy changes as a function of temperature or time owing to changes in a material’s physical and chemical characteristics. DSC is quick, accurate, and simple to use. |
Publisher’s Note: MDPI stays neutral with regard to jurisdictional claims in published maps and institutional affiliations. |
© 2021 by the authors. Licensee MDPI, Basel, Switzerland. This article is an open access article distributed under the terms and conditions of the Creative Commons Attribution (CC BY) license (https://creativecommons.org/licenses/by/4.0/).
Share and Cite
Teh, J.S.; Teoh, Y.H.; How, H.G.; Sher, F. Thermal Analysis Technologies for Biomass Feedstocks: A State-of-the-Art Review. Processes 2021, 9, 1610. https://doi.org/10.3390/pr9091610
Teh JS, Teoh YH, How HG, Sher F. Thermal Analysis Technologies for Biomass Feedstocks: A State-of-the-Art Review. Processes. 2021; 9(9):1610. https://doi.org/10.3390/pr9091610
Chicago/Turabian StyleTeh, Jun Sheng, Yew Heng Teoh, Heoy Geok How, and Farooq Sher. 2021. "Thermal Analysis Technologies for Biomass Feedstocks: A State-of-the-Art Review" Processes 9, no. 9: 1610. https://doi.org/10.3390/pr9091610
APA StyleTeh, J. S., Teoh, Y. H., How, H. G., & Sher, F. (2021). Thermal Analysis Technologies for Biomass Feedstocks: A State-of-the-Art Review. Processes, 9(9), 1610. https://doi.org/10.3390/pr9091610