Article

Optimization of Process Parameters for Friction Materials Using Multi-Criteria Decision Making: A Comparative Analysis

1
Research and Development Department, Elecon Engineering Co., Ltd., V. V. Nagar 388120, India
2
Division of Machine and Metal Technologies, Kocaeli University, İzmit 41001, Turkey
3
Department of Mechanical Engineering, Vel Tech Rangarajan Dr. Sagunthala R & D Institute of Science and Technology, Chennai 600062, India
4
Department of Production Engineering, Jadavpur University, Kolkata 700032, India
5
School of Computing, University of Eastern Finland, 70210 Kuopio, Finland
*
Authors to whom correspondence should be addressed.
Processes 2021, 9(9), 1570; https://doi.org/10.3390/pr9091570
Submission received: 4 August 2021 / Revised: 28 August 2021 / Accepted: 29 August 2021 / Published: 1 September 2021
(This article belongs to the Special Issue Design and Optimization in Process Engineering)

Abstract

:
Friction materials, mainly made of reinforced composites, should possess excellent physical and tribological properties, such as a higher coefficient of friction, minimum wear, adequate surface hardness, and higher porosity for various automotive brake applications. Attainment of those properties greatly depends on the settings of different input parameters, such as molding pressure, temperature and time, temperature and time of heat treatment/sintering, etc., during the processing of friction materials. In this article, four multi-criteria decision-making (MCDM) tools, i.e., technique for order of preference by similarity to ideal solution (TOPSIS), evaluation based on distance from average solution (EDAS), VlseKriterijumska Optimizacija I Kompromisno Resenje (VIKOR), and multi-objective optimization on the basis of ratio analysis (MOORA) are applied to identify the optimal parametric combinations for two different friction materials. A comparative analysis of the derived results suggests the same optimal parametric mixes for all the MCDM techniques for both case studies. Thus, for the considered case studies, the optimal parametric combinations as molding time = 8 min, molding temperature = 175 °C, molding pressure = 27 MPa, sintering time = 10 h and sintering temperature = 225 °C, and molding pressure = 27.90 MPa, molding temperature = 170 °C, curing time = 8 min, and heat treatment time = 1 h, respectively, would help in attaining the most desired properties of friction materials. Improvements in the predicted response values prove the efficacy of the adopted MCDM techniques in determining the optimal combinations of various process parameters for friction materials.

1. Introduction

Friction materials are usually made of composites, having large varieties of powders and fibrous ingredients as reinforcements. These materials should have a high coefficient of friction, minimum wear, adequate surface hardness, and high porosity for different automotive brake applications. A high coefficient of friction ensures the requirement of a strong force between two surfaces to slip. Its higher value also assures that less fluid pressure, i.e., a lighter push of the brake pedal, is required to create a higher braking force. Higher lining hardness has a beneficial effect on wear resistance and strength improvement [1]. Higher porosity is also desired as it decreases the noise propensity during brake applications [2].
In the existent literature, there are several studies with respect to the characterization of ceramic-reinforced and polymer-reinforced brake pad composite materials. Krenkel and Langhof [3] examined the development, production, and use of ceramic matrix composite friction materials in diverse, high-performance applications. Hee and Filip [4] investigated the influences of potassium titanate as an additive on the performance of ceramic-enhanced phenolic matrix brake lining materials in automotive brake applications. Han et al. [5] developed ceramic-based composites using nine different types of friction materials along with four brake pad compositions while varying the amount of ceramic fiber ingredient in those materials. The effect of the addition of ceramic powder on the friction-wear performance and wear mechanism was also examined. However, there was no evaluation on the use of brake pad composites under real-time environmental conditions. Saffar and Shojaei [6] investigated the influences of the type of polymeric binder (i.e., resin or rubber) on the frictional behavior of brake materials. Fan et al. [7] developed ceramic-reinforced brake pad composites using Al2O3 along with two other similar ceramic powders. The most suitable friction coefficient (0.45) was obtained by examining the tribological behavior of the brake pads. The effect of Al2O3 powder on the metallurgical structure of the composites was also studied using SEM images. Verma et al. [8] examined the tribological behavior of brake pad materials tested under dry slip conditions against a cast iron with pin-on-disc and surface disc. Langhof et al. [9] evaluated the tribological behavior of carbon short fiber reinforced ceramics on a laboratory scale and also in a full-scale test rig. The lower hardness obtained in mechanical tests would indicate the “softening effect” of the coke. The potential for further improvement in the properties of carbon fiber reinforced ceramic brake pads compared to the conventional friction materials was also highlighted. Kumar and Bijwe [10] propounded that the overall friction and wear performance of composites would increase with the use of metal content. It was noticed that copper-containing composites would exhibit the best friction and wear behavior after brass, while iron powder-based composites would have moderate performance. Organic dusts were also added as an ingredient in friction brake pad materials for their enhanced performance [11]. It is thus revealed that the composition of friction materials and their evaluation at different testing conditions would become crucial for different brake pad applications. The past researchers [12,13] also endeavored to optimize the compositions of brake pad friction materials.
A hot compression molding process is generally employed for the preparation of friction materials, which consists of thorough mixing of all the constituents, molding at controlled pressure and temperature, followed by sintering. During this production process, optimal levels of several input parameters need to be critically selected in order to achieve the desired physical and tribological properties of friction materials, which is a difficult task to achieve due to the involvement of multiple conflicting objectives. Aleksendric and Senatore [14] attempted to optimize the manufacturing process parameters for friction materials (such as molding pressure, temperature and time, sintering temperature and time) using a neuro-genetic optimization tool. The classical Taguchi methodology was also employed by many researchers [15,16] for the identification of the optimal manufacturing process parameters for friction materials.
Referring to the literature, it can be noticed that plenty of research works have already been undergone toward the development and characterization of different friction materials based on various testing methodologies. Determination of the optimal manufacturing process parameters for friction materials is a challenging task as it helps in attaining their most desired physical and tribological properties. The application of different mathematical tools, specially multi-criteria decision-making (MCDM) techniques, is really scarce in this direction. Thus, this article presents the applications for four popular MCDM techniques, i.e., technique for order of preference by similarity to ideal solution (TOPSIS), evaluation based on distance from average solution (EDAS), Vlse Kriterijumska Optimizacija I Kompromisno Resenje (VIKOR), and multi-objective optimization on the basis of ratio analysis (MOORA) for identification of the optimal settings of different process parameters for two different friction materials. At the derived optimal parametric combinations, there are improvements in the considered physical and tribological properties of friction materials as compared to those obtained by past researchers. The ranking performance of the four MCDM techniques is finally contrasted using Spearman’s rank correlation coefficients.
The rest of the article is organized in the following way: the next section (i.e., Section 2) contains a brief description regarding the recent use of MCDM techniques on similar research problems. For the benefit of the readers, some prominent and relevant research works from the past few years are also presented in that section. The problem statement is detailed in Section 3.1. The entropy method, which is used for the allocation of criteria weights, is explained in Section 3.2. The mathematical backgrounds of the four MCDM techniques employed in this research are presented in subsequent portions of Section 3. Two case studies are solved, analyzed, and critically discussed in Section 4. The crux and future scope of this article are presented in Section 5.

2. Multi-Criteria Decision Making

The MCDM techniques mainly help in the identification of the best alternative/course of action in the presence of a set of evaluation criteria. In the manufacturing/machining domain, they can be effectively deployed to single out the best combination of different process parameters leading to the attainment of the most desired product characteristics. In this direction, they can act as multi-objective optimization tools where different experimental trials consisting of varying combinations of process parameters are treated as the candidate alternatives, and the measured response values (often conflicting in nature) are considered as the evaluation criteria. To date, more than 20 different types of MCDM techniques have evolved out, having their own strengths and weaknesses. Among them, TOPSIS [17] has become the most popular one due to its ability to identify the best alternative that is closest to the ideal solution and farthest from the anti-ideal solution. The EDAS method [18,19], which overcomes some of the limitations of TOPSIS, identifies the best alternative while computing the distance of each alternative from the average solution. The VIKOR method [20] attempts to solve MCDM problems having conflicting and non-commensurable criteria with an aim to identify the compromise solution that is closest to the ideal solution. The MOORA method [21,22] has the simplest computational steps, which make it a well-accepted MCDM tool in the manufacturing domain. With respect to the application of MCDM methods, Mahale et al. [23] adopted the MOORA method in effectively ranking different friction materials and proved its superiority over the techniques based on an extension evaluation method. Satapathy et al. [24] employed an outranking-based MCDM method for the optimization of composite friction materials. Carbon fiber-based composites and cellulose fiber-based composites evolved out as the best and the worst friction materials, respectively. Öktem and Shinde [25] evaluated the tribological performance of brake friction materials using genetic algorithm and MCDM approaches. Raju et al. [26] used TOPSIS and MOORA to evaluate the mechanical and tribological performance of several aluminum composites manufactured by the stir casting process. Khan and Dey [27] employed gray relation analysis to select the optimal process parameters for wear performance improvement of aluminum composites. Jeganmohan et al. [28] developed palm seed powder reinforced brake pad friction composite materials and evaluated their performance applying the preference selection index method. Singh et al. [29] ranked various brake pad composite materials made out of banana, pineapple, and hemp fibers. They relied on the application of elimination and choice translating priority II method. In another similar work, Singh [30] adopted inter-criteria correlation (CRITIC) and multiplicative exponent weighting (MEW) for the optimal design of fabricated natural fiber reinforced automotive brake friction composites. In this article, the application potentialities of four MCDM techniques, i.e., TOPSIS, EDAS, VIKOR, and MOORA, are explored while solving two different parametric optimization problems for friction materials in automotive brake applications.

3. Material and Methods

3.1. Problem Statement

A friction brake material is manufactured by high-pressure hot compression molding and subsequent sintering/heat-treatment process. The molding is normally undertaken for 10 to 15 min at a pressure ranging between 5 and 7 Bars, and the sintering process is performed for 4 to 7 h without any pressure. Sintering ensures improved currying reducing the chances of thermal distortion during brake applications. The friction brake materials should have a high coefficient of friction for minimal fluid pressure, minimum wear, and other favorable physical and tribological properties. The large-scale manufacturing process of friction brake materials, consisting of three stages, is exhibited in Figure 1. It has already been observed that molding pressure, temperature and time, and sintering temperature and time play critical roles during the manufacturing of friction materials. Appropriate settings of those process parameters not only help in achieving the desired characteristics of the end products but also save manufacturing time and cost. Applications of MCDM tools would significantly help the process engineers to identify the optimal parametric mixes during the cost-effective manufacturing of friction brake materials.

3.2. Criteria Weight Measurement Using Entropy Method

While solving any decision-making problem using any of the MCDM techniques, it is first required to formulate the related decision matrix (X) with m alternatives and n criteria.
X = x 11 x 12 x 1 n x 21 x 22 x 2 n x m 1 x m 2 x m n
where x ij   represents the performance of ith alternative (experimental trial) against jth criterion (response). While selecting the best alternative for a given problem, weights assigned to different evaluation criteria have important roles. The entropy method [31], established on discrete probability distribution, estimates criteria weights based on the dispersion/randomness of the data elements in the decision matrix.
e j = 1 ln ( m ) i = 1 m r i j × ln ( r i j )
where r ij is the normalized value of x ij . The degree of diversity (d) retained by the individual criterion is estimated as below:
dj = 1 − ej (j = 1, 2, ..., n)
Finally, the relative weight for each criterion is calculated using the following expression:
w j = d j j = 1 n d j
where w j is the weight assigned to jth criterion.

3.3. TOPSIS

TOPSIS is a robust and widely accepted MCDM technique that identifies the best alternative to be positioned nearest to the ideal solution and farthest from the anti-ideal solution based on the Euclidean distance scale. The alternatives under consideration are subsequently ranked in descending order of their closeness coefficient values (relative closeness of a particular alternative to the ideal solution). Before application of any of the MCDM techniques, it is essential to normalize the initial decision matrix to make all of its elements dimensionless and comparable. For normalization, the following vector normalization procedure is adopted.
r i j = x i j i = 1 m x i j 2   ( j = 1 , 2 , , n )
The procedural steps of TOPSIS are highlighted as below:
Step 1: Using the elements of the normalized decision matrix and criteria weights, develop the weighted normalized decision matrix.
N i j = r i j × w j   ( i = 1 , 2 , . . . , m ;   j = 1 , 2 , . . . , n )
Step 2: Estimate the ideal (best) and anti-ideal (worst) solutions using Equations (7) and (8), respectively.
A j + = Max   N i j   j B Min   N i j   j C
A j = Min   N i j   j B Max N i j   j C
where B is the set of beneficial criteria (requiring higher values) and C is the set of cost criteria (requiring lower values).
Step 3: Calculate the separation measures and closeness coefficient values.
In TOPSIS, the distance between each alternative and the ideal (best) solution is calculated applying Equation (9).
S i + = j = 1 n N i j A j + 2   ( i = 1 , 2 , . . . , m ;   j = 1 , 2 , . . . , n )
Similarly, the distance between each alternative and the anti-ideal (worst) solution is estimated employing Equation (10).
S i = j = 1 n N i j A j 2   ( i = 1 , 2 , . . . , m ;   j = 1 , 2 , . . . , n )
Finally, the corresponding closeness coefficient ( C C i ) for the ith alternative is computed using Equation (11).
C C i = S i S i + + S i   ( 0  ≤  C C i  ≤  1 ;   i = 1 , 2 , . . . , m )
Step 4: Rank the alternatives in decreasing order of their C C i values. The best alternative should have the maximum C C i value.

3.4. EDAS Method

Unlike TOPSIS, the EDAS method evaluates the candidate alternatives with respect to their distances from the average solution. The arithmetic mean of the performance values of the alternatives is considered as the average solution. It performs better than TOPSIS in the case of rank reversals. The application steps of this method are presented as below:
Step 1: From the initial decision matrix representing the performance of the alternatives against the evaluation criteria, calculate the average solution (AV) with respect to all the criteria.
A V j = i = 1 m x i j m   ( j = 1 , 2 , , n )
Step 2: Compute the positive distance from the average (PDA) and negative distance from the average (NDA) depending on the type of criterion (beneficial or cost).
P D A i j = Max 0 , x i j A V j A V j j B Max 0 , A V j x i j A V j j C
N D A i j = Max 0 , A V j x i j A V j j B Max 0 ,   x i j A V j A V j j C
Step 3: Calculate the weighted sums of PDA (SP) and NDA (SN) for all the considered alternatives.
S P i = j = 1 n w j × P D A i j
S N i = j = 1 n w j × N D A i j
Step 4: Normalize the values of SP and SN for all the alternatives.
N S P i = S P i Max i S P i
N S N i = 1 S N i Max i S N i
Step 5: Calculate the appraisal score (AS) for each of the alternatives.
A S i = 1 2 N S P i + N S N i
where 0 A S i 1 .
Step 6: Rank the alternatives under consideration from the best to the worst based on the decreasing values of AS.

3.5. VIKOR Method

This method is based on the determination of a compromise solution from the given set of alternatives. Its procedural steps are enumerated as below:
Step 1: From the initial decision matrix, identify the best, x i j m a x and the worst, x i j m i n values for all the criteria.
Step 2: Calculate   S i and R i values.
S i = j = 1 n w j x i j m a x x i j x i j m a x x i j m i n
R i = M a x j = 1 n w j x i j m a x x i j x i j m a x x i j m i n
It is worthwhile to mention here that Equation (20) is only applicable for beneficial criteria. For non-beneficial criteria, the term x i j m a x x i j in Equation (20), is to be replaced by x i j x i j m i n .
Step 3: Calculate Q i value.
Q i = ν S i S i m i n S i m a x S i m i n 1 ν R i R i m i n R i m a x R i m i n
where S i m a x and   S i m i n represent are the maximum and minimum values of S i respectively, R i m a x and R i m i n denote the maximum and minimum values of R i respectively, ν is the weight assigned for the strategy of maximum group utility, and 1 ν   is the weight of the individual regret. The default value of ν   is taken as 0.5.
Step 4: Rank the alternatives in ascending order of their Q i   values. Thus, the best alternative should have the minimum Q i value.

3.6. MOORA Method

The MOORA method is based on simple ratio analysis and has easily comprehensible calculation steps. Its application involves the following steps:
Step 1: From the vector normalized decision matrix, calculate the corresponding normalized assessment value (yi) for each of the alternatives.
y i = j = 1 g w j × r i j j = g + 1 n w j × r i j
where g is the number of criteria to be maximized.
Step 2: Arrange all the alternatives from the best to the worst based on the descending order of their normalized assessment values.

4. Parametric Optimization for Friction Materials Using MCDM Techniques

It has already been mentioned that this article deals with the applications of TOPSIS, EDAS, VIKOR, and MOORA methods for the identification of the best combinations of manufacturing process parameters for two different friction materials.

4.1. Case Study 1

While treating molding time, molding temperature, molding pressure, heat treatment time, and heat treatment temperature as the input parameters, and surface hardness, porosity, and specific wear rate as the quality characteristics (responses) of brake lining materials, Kim et al. [15] conducted 16 experimental trials based on Taguchi’s orthogonal array design plan. Those friction materials were of non-asbestos organic type, mainly made of phenolic resin, reinforcing fibers, solid lubricants, abrasives, fillers, and friction modifiers. During the experiments, each of those input parameters was varied at four different operating levels. Surface hardness, porosity, and specific wear rate were respectively measured using Rockwell hardness tester, mercury porosity meter, and pad-on-disc tribometer. The experimental design plan and the measured response values are provided in Table 1. It is worthwhile to mention here that among the considered responses, surface harness and porosity are beneficial attributes requiring their higher values, while specific wear rate is the sole non-beneficial attribute always preferred with its lower values. Using the entropy method, the weights of surface hardness, porosity, and specific wear rate are determined as 0.019, 0.171, and 0.810, which would be employed later for MCDM method-based analyses in order to determine the optimal combination of different process parameters for the considered brake lining material. Applications of these MCDM techniques under consideration would basically help in the ranking of the alternative experimental trials from the best to the worst leading to the attainment of the most desired quality characteristics of the brake lining material.
While solving a given MCDM problem using TOPSIS and MOORA methods, it is recommended to vector normalize the initial decision matrix using Equation (5). From the normalized decision matrix, the corresponding weighted normalized matrix is developed. The normalized and weighted normalized decision matrixes are provided in Table 2.
Figure 2 exhibits the Euclidean distances of each alternative experimental trial from the ideal and anti-ideal solutions, as calculated using Equations (9) and (10) respectively in the TOPSIS method. For the best experimental trial with the optimal parametric combination, its Euclidean distance from the ideal solution should be the minimum, and the corresponding Euclidean distance from the anti-ideal solution should be the maximum. It indicates that the best alternative is nearest to the ideal solution but farthest from the anti-ideal solution. It can be noticed from Figure 2 that both trial numbers 6 and 16 are positioned farthest away from the anti-ideal solution, but trial number 6 is nearest to the ideal solution. The closeness coefficient values in TOPSIS, estimated applying Equation (11) and provided in Figure 3, are subsequently used to rank the alternative trials from the best to the worst. It can be revealed from Figure 3 that experimental trial number 6 having the maximum closeness coefficient provides the optimal intermix of the process parameters for the considered brake lining material.
While solving the same problem using the EDAS method, Figure 4 depicts the positive distance from the average (PDA) and negative distance from the average (NDA), as computed using Equations (13) and (14), respectively. For the best alternative, values of both PDA and NDA should be the maximum. In Figure 4, trial numbers 10 and 11 have the maximum NDA values, and trial number 6 has the maximum PDA value. The normalized weighted sums of PDA (NSP) and NDA (NSN) are now computed employing Equations (17) and (18), respectively, as portrayed in Figure 5. The corresponding appraisal scores (AS) for all the experimental trials are finally estimated using Equation (19). When these scores are plotted in Figure 6, it identifies trial number 6 as the optimal parametric combination for this case study.
In order to identify the optimal parametric combination for manufacturing brake lining materials using the VIKOR method, the corresponding values of Ri and Qi indexes are calculated using Equations (21) and (22), respectively, for all the experimental trials. These values of Ri and Qi are exhibited in Figure 7.
When all the trials are ranked based on their Qi indexes, it can be unveiled that trial number 6 evolves out as the optimal combination of manufacturing process parameters for brake lining material. Finally, the normalized assessment values in the MOORA method are computed applying Equation (23). When these values are plotted in Figure 8, trial number 6 provides the optimal parametric intermix for this case study.
The rankings of the alternative trials derived using the four MCDM techniques are compared in Figure 9.
It can be interestingly noticed that for all these techniques, trial number 6 exhibits the optimal combination of different process parameters for brake lining material. There are minor variations in the intermediate rankings of the alternative trials, which may be attributed to the difference in mathematical treatments of the considered MCDM techniques. Table 3 provides Spearman’s rank correlation coefficients between these MCDM methods. This table reveals that the ranking performance of all the MCDM techniques is almost comparable. Thus, it can be concluded that an optimal combination of manufacturing process parameters as molding time = 8 min, molding temperature = 175 °C, molding pressure = 27 MPa, sintering time = 10 h, and sintering temperature = 225 °C would help in attaining the desired physical and tribological properties of the brake lining material. On the other hand, Kim et al. [15] observed a parametric combination of molding time = 6 min, molding temperature = 225 °C, molding pressure = 27 MPa, sintering time = 6 h, and sintering temperature = 200 °C for this case study. However, these settings do not exist among the conducted experimental trials, and no experimental values for this setting are reported in Kim et al. [15]. For the sake of comparison of the derived optimal predictions with those of Kim et al. [15], two different imputation approaches (linear regression and mean of means) are considered here to compute the responses based on the settings of Kim et al. [15]. At first, a linear regression is employed, and the values of surface hardness, porosity, and specific wear rate are found to be 80.62 HRs, 19.69%, and 7.729 × 10⁻⁶ mm3/Nm, respectively, for the combination reported in Kim et al. [15]. The optimal solutions derived using the considered MCDM techniques are approximately 7% poorer for surface hardness and 3% and 47% better for porosity and specific wear rate, respectively. Similarly, when contrasted using the mean of means approach, the surface hardness, porosity, and specific wear rate are found to be 83.45 HRs, 17.102%, and 9.504×10⁻⁶ mm3/Nm, respectively for the combination reported in Kim et al. [15]. The present optimal solutions are approximately 18% and 57% better for porosity and specific wear rate, respectively, but 10% poorer for surface hardness. Thus, it is clear that the current optimal solutions are significantly better than those of Kim et al. [15] for at least two of the responses.

4.2. Case Study 2

In this case study, the experiments conducted by Ibhadode and Dagwa [16] are considered to explore the influences of molding pressure, molding temperature, curing time, and heat treatment time on three different properties (surface hardness, coefficient of friction, and wear/application) of a non-asbestos friction material in the form of palm kernel shell for use as automobile disk brake pads. Based on Taguchi’s L9 orthogonal array, nine experiments were performed while varying each of the process parameters at three different levels. Rockwell hardness tester, dynamometer, and a dedicated test rig were respectively employed to measure surface hardness, coefficient of friction, and wear/application of the considered friction materials. Table 4 depicts the design matrix along with the measured output characteristics. Among the responses, surface hardness and coefficient of friction are beneficial attributes, and wear/application is the only non-beneficial attribute. The importance weights of these three responses are calculated as 0.0093, 0.0087, and 0.9820, respectively, using the entropy method. Now, this parametric optimization problem for disk brake pads is solved using TOPSIS, EDAS, VIKOR, and MOORA methods.
In order to derive the rankings of the alternative experimental trials using TOPSIS and MOORA methods, the initial decision matrix of Table 4 is first normalized and then weighted normalized. These two matrixes are provided in Table 5.
Based on the formulations of the considered MCDM methods, for this case study too, the closeness coefficients in TOPSIS method, appraisal scores in EDAS method, Qi values in VIKOR method, and normalized assessment values in MOORA method are subsequently calculated, as shown in Figure 10.
Figure 11 compares the rankings of all the experimental trials as derived using these MCDM techniques.
In all the four MCDM techniques, trial number 9 evolves out as the optimal setting for optimization of the manufacturing process for these disk brake pad materials. Thus, it is recommended to operate the process at an optimal parametric mix as molding pressure = 27.90 MPa, molding temperature = 170 °C, curing time = 8 min, and heat treatment time = 1 h so as to achieve the most favorable values of all the responses. Based on Taguchi’s methodology, Ibhadode and Dagwa [16] derived the settings of those process parameters as molding pressure = 16.74 MPa, molding temperature = 160 °C, curing time = 8 min, and heat treatment time = 2 h for these friction materials. It is observed that the adopted MCDM-based approaches yield 23.44%, 13.16%, and 90% better results for surface hardness, coefficient of friction, and wear/application, respectively, as compared to Ibhadode and Dagwa [16]. Table 6, which depicts the calculated values of Spearman’s rank correlation coefficients, proves the similarity of ranking results obtained using TOPSIS, EDAS, and MOORA methods. There is a slight variation in the ranking results derived using the VIKOR method, which may be due to the involvement of an additional parameter (v) in its calculation steps.

5. Conclusions

This article deals with the applications of four popular MCDM techniques, i.e., TOPSIS, EDAS, VIKOR, and MOORA methods for determining the optimal settings of manufacturing process parameters for two friction materials used in automotive brakes. Based on the derived results, the following conclusions can be drawn:
(a)
All the considered MCDM techniques appear to be quite suitable for solving these types of multi-objective parametric optimization problems for friction materials having conflicting physical as well as tribological properties.
(b)
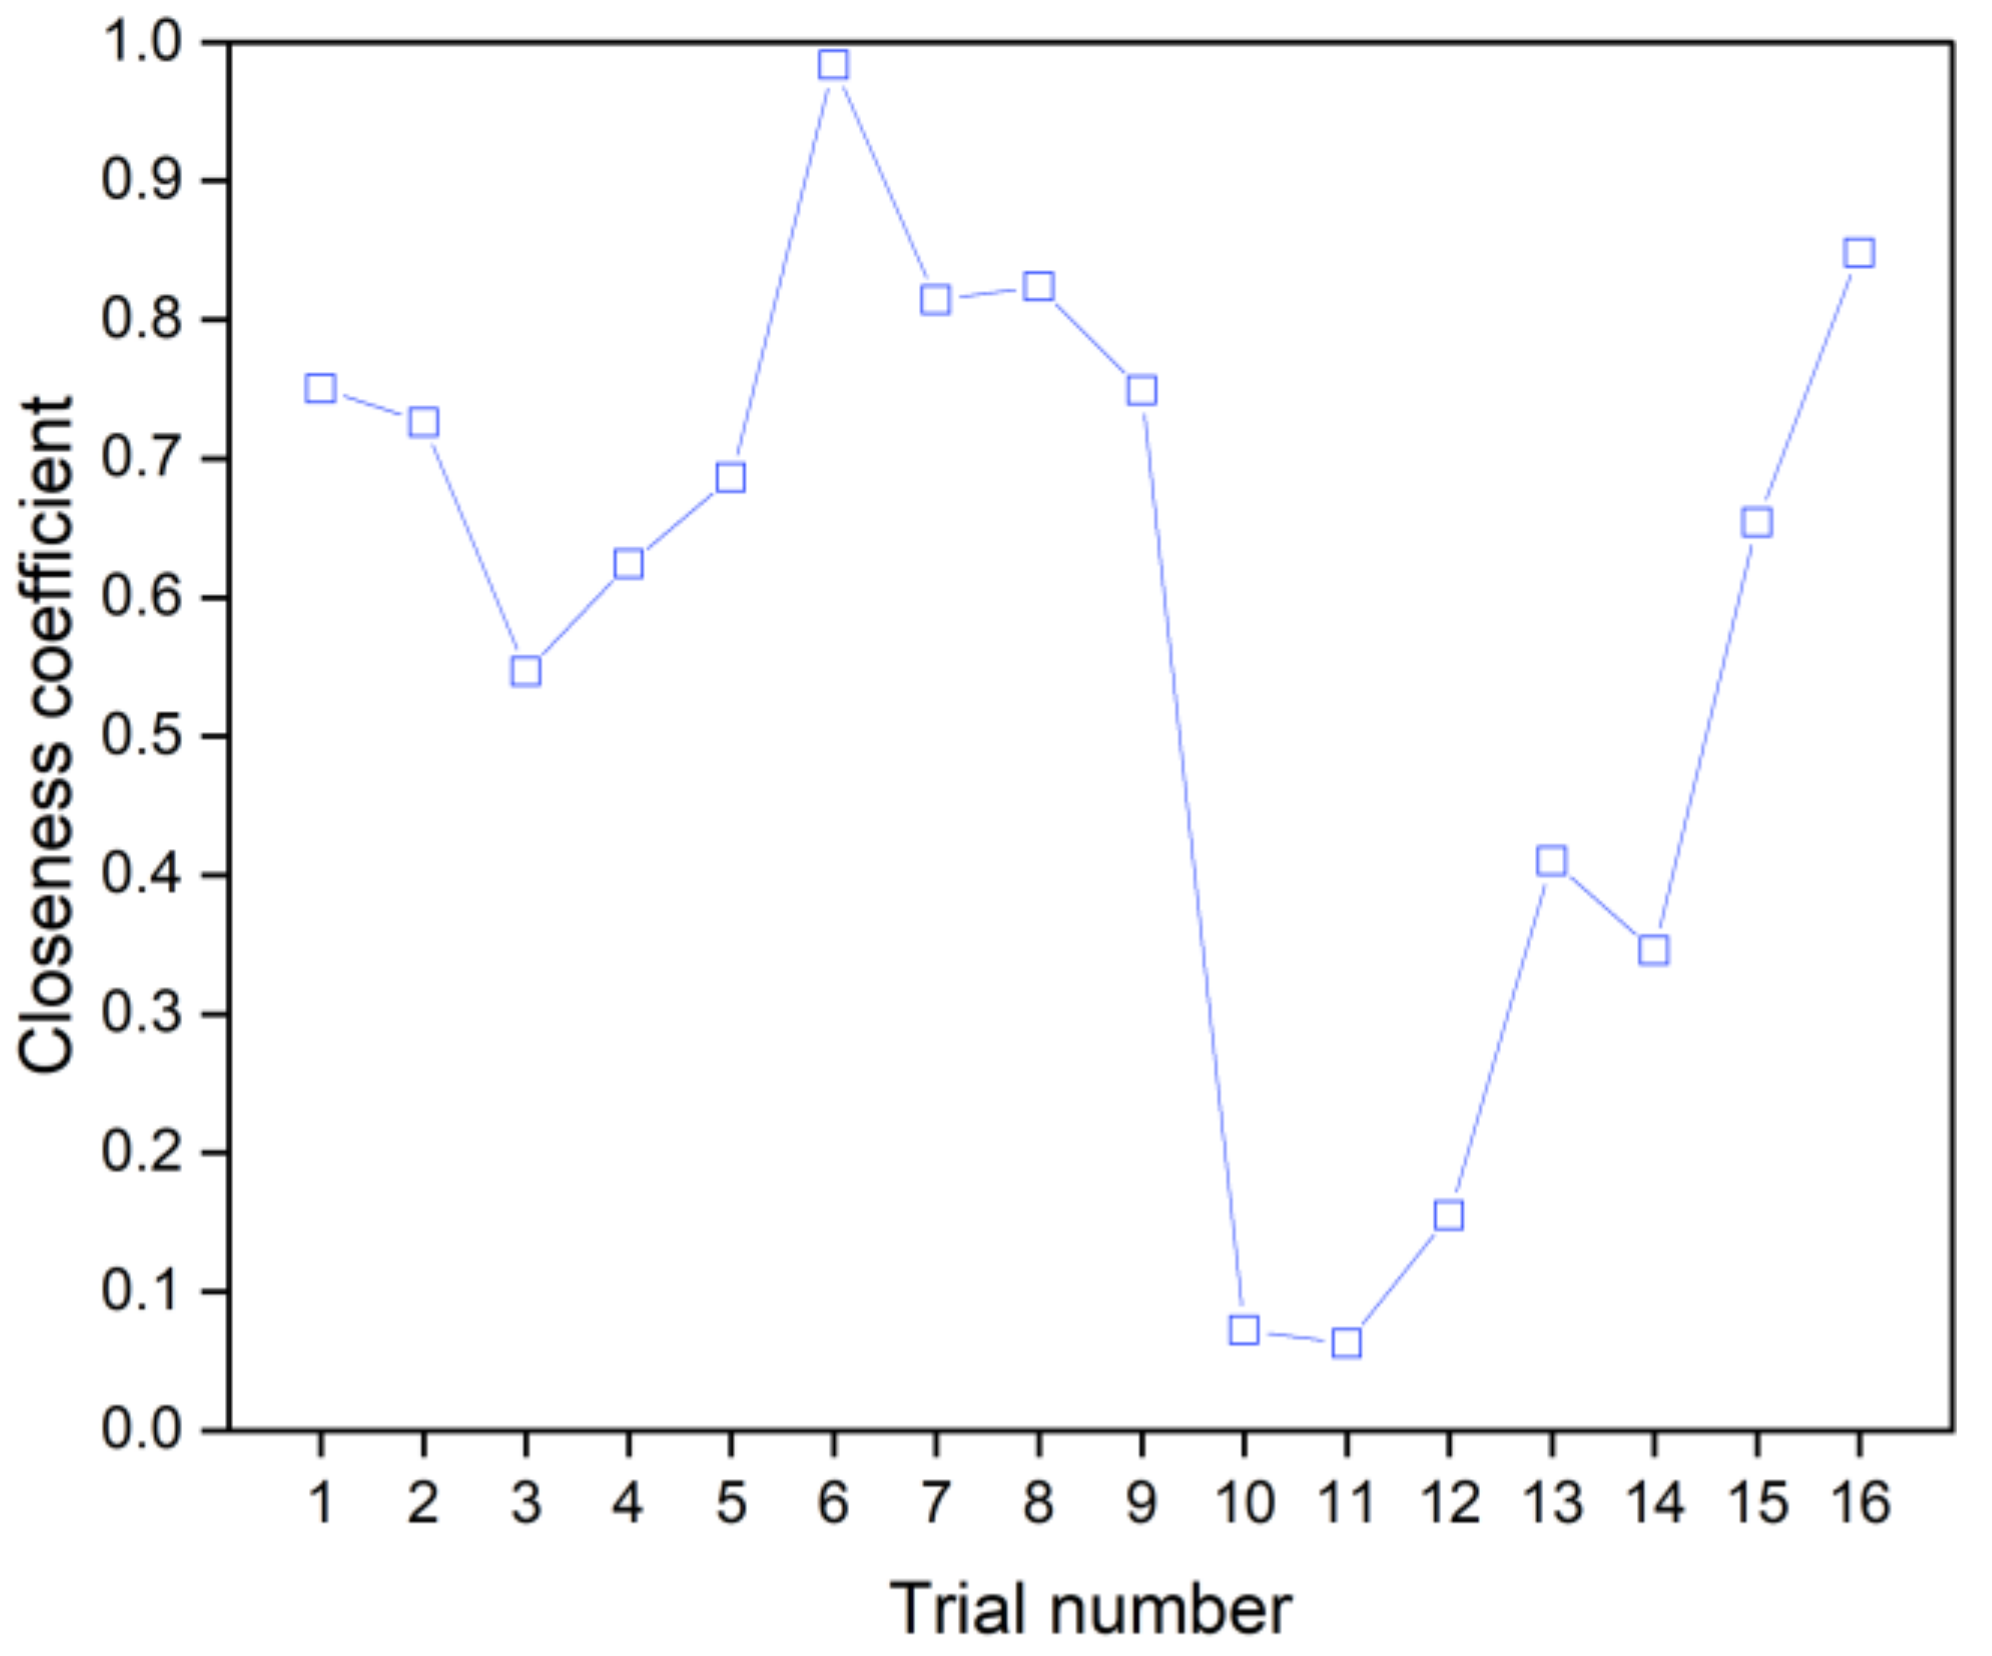
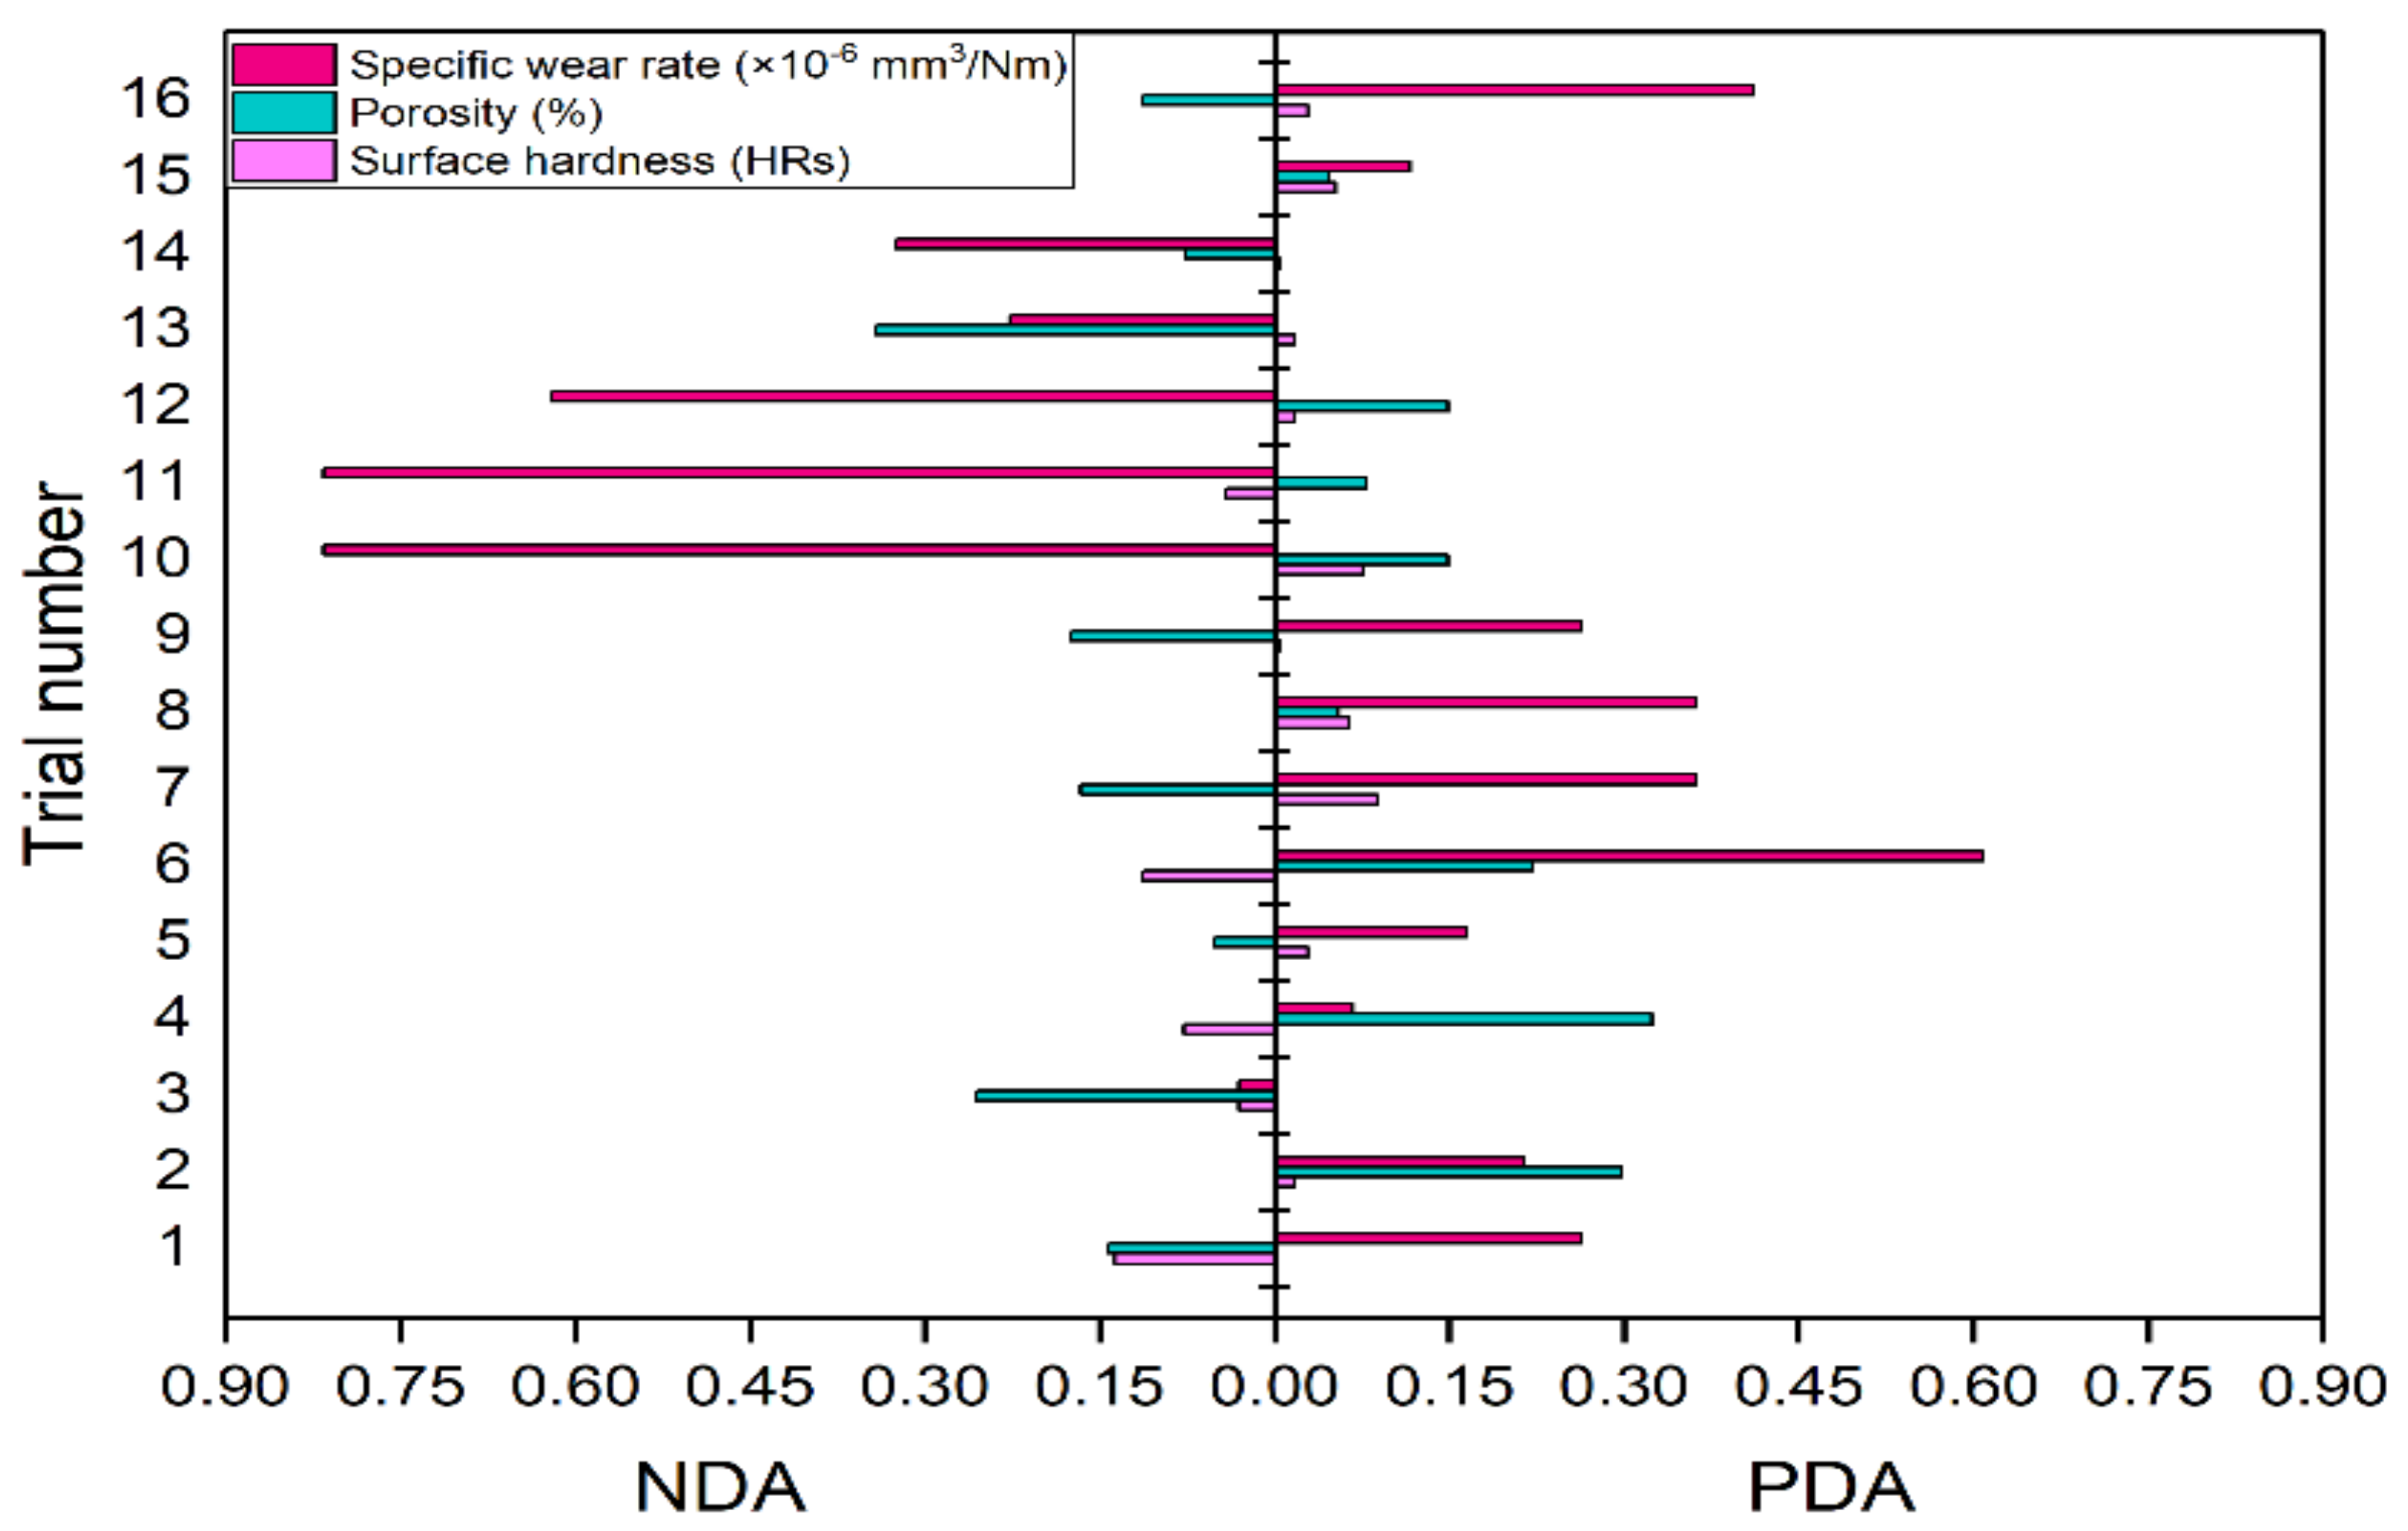
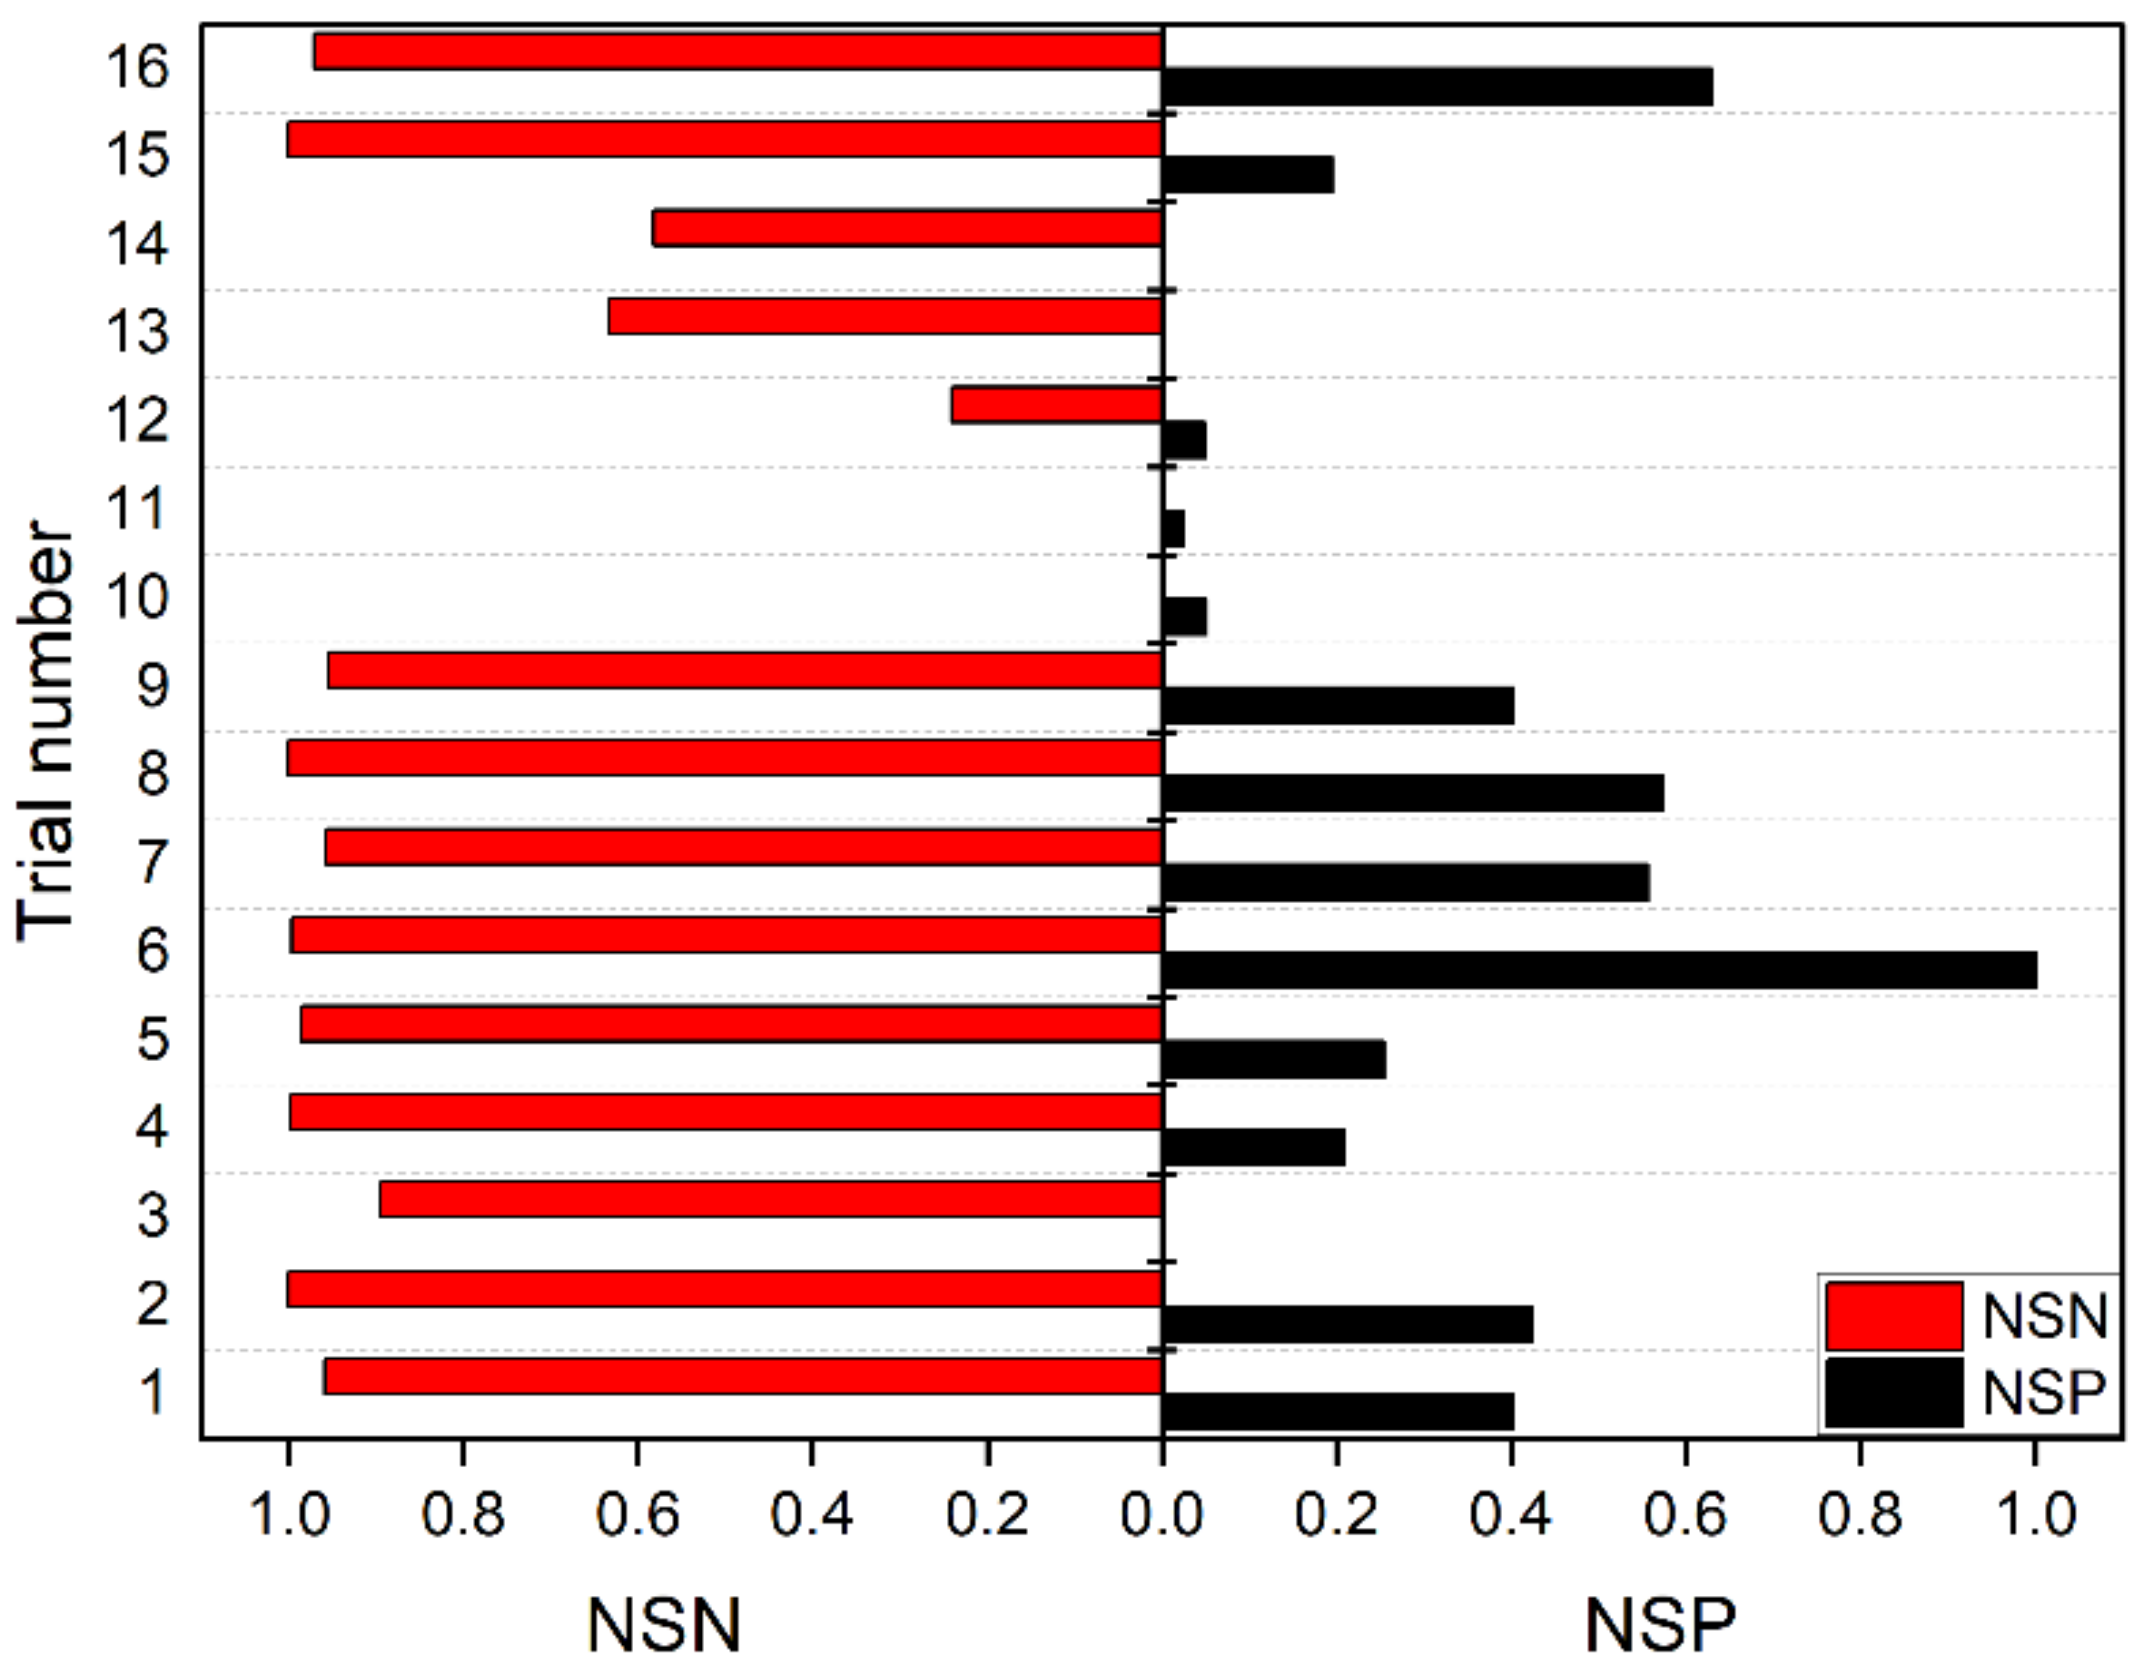
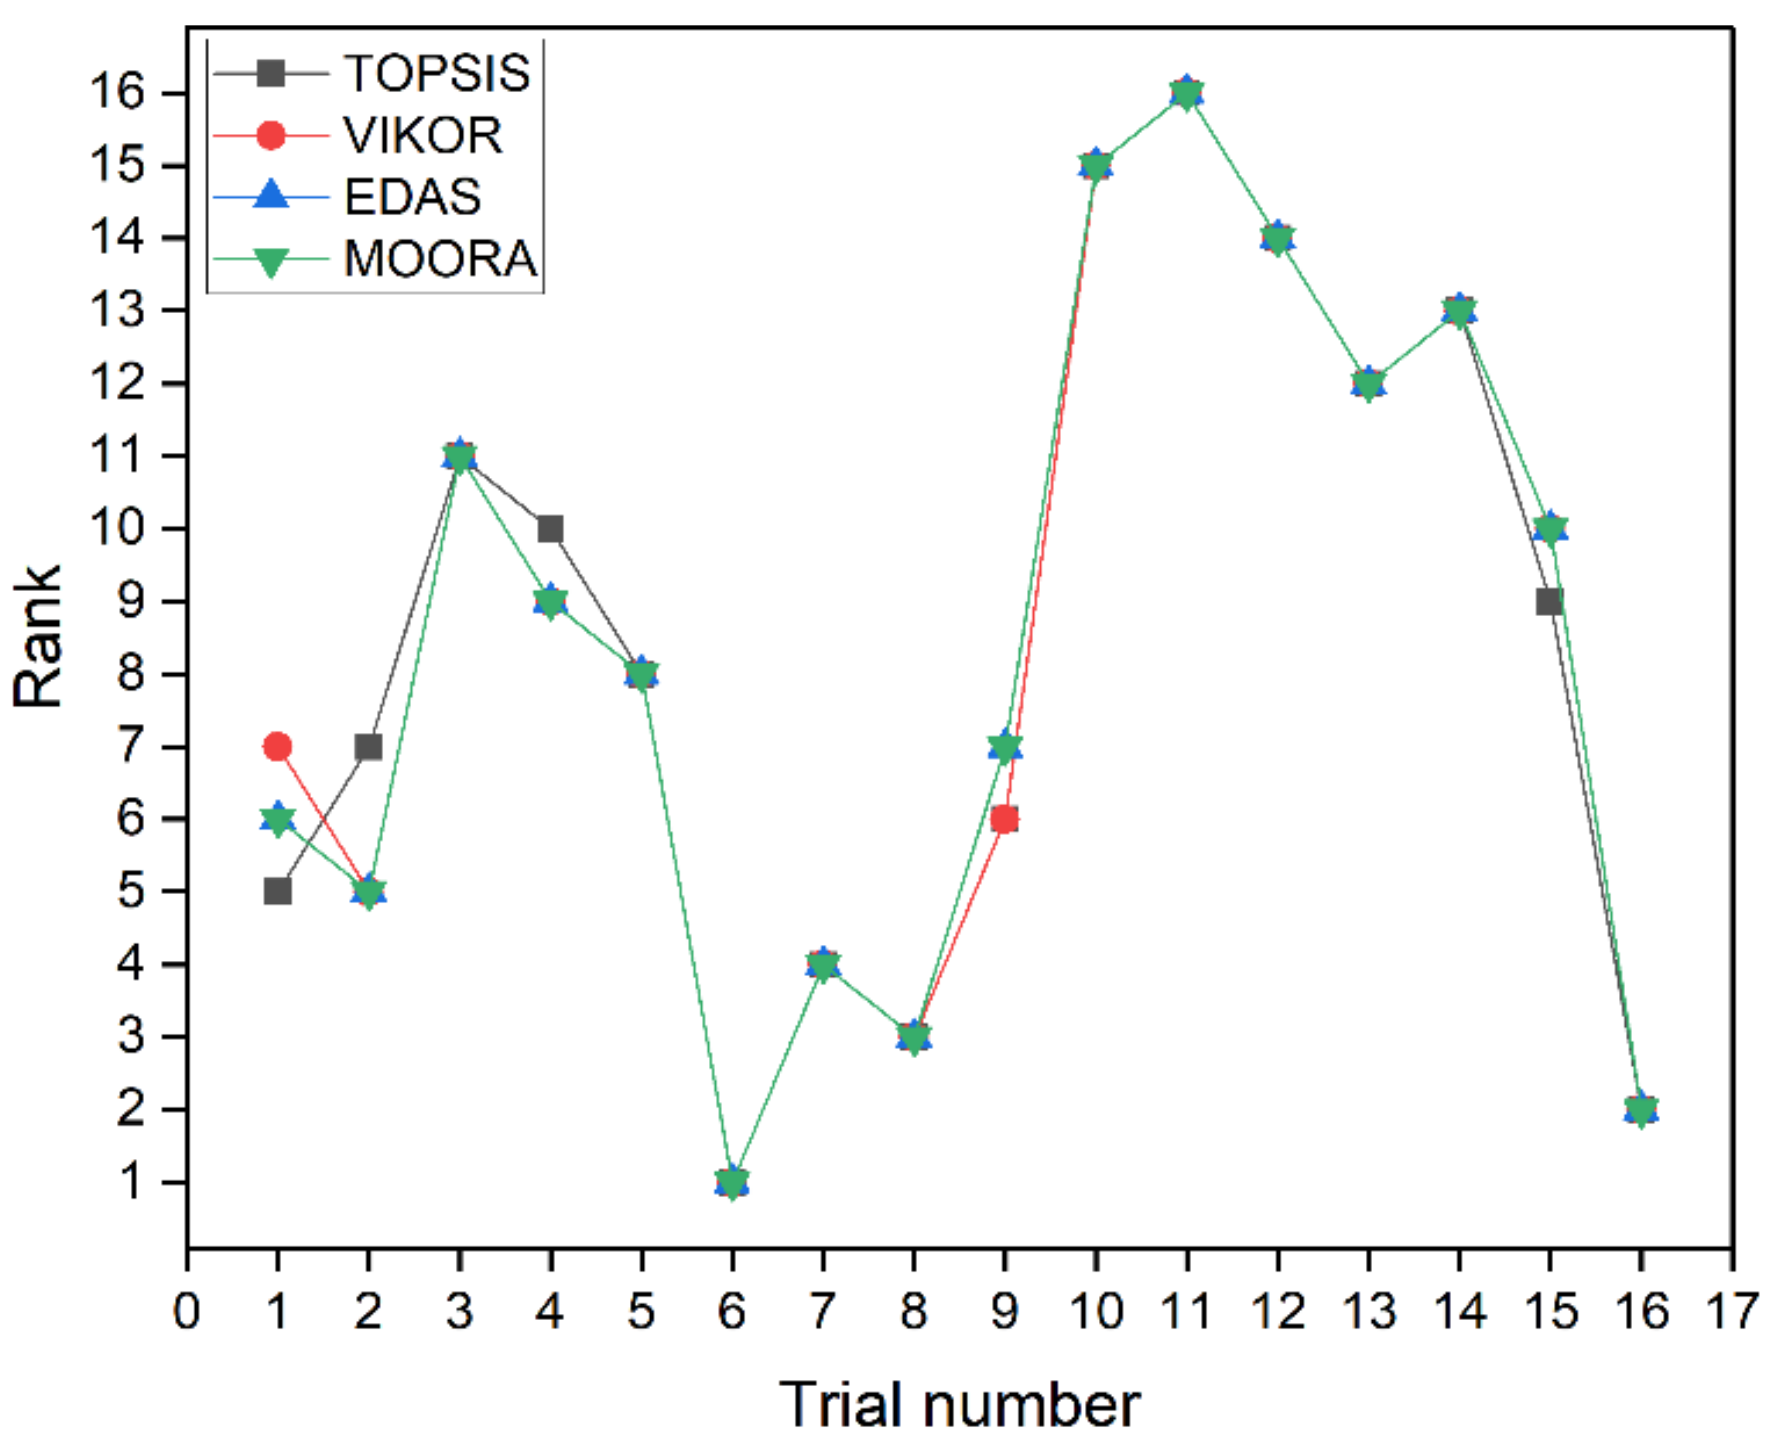
For the first case study, all the MCDM techniques identify experimental trial number 6 with parametric intermix as molding time = 8 min, molding temperature = 175 °C, molding pressure = 27 MPa, sintering time = 10 h, and sintering temperature = 225 °C for attaining the favorable values of surface hardness, porosity and specific wear rate.
(c)
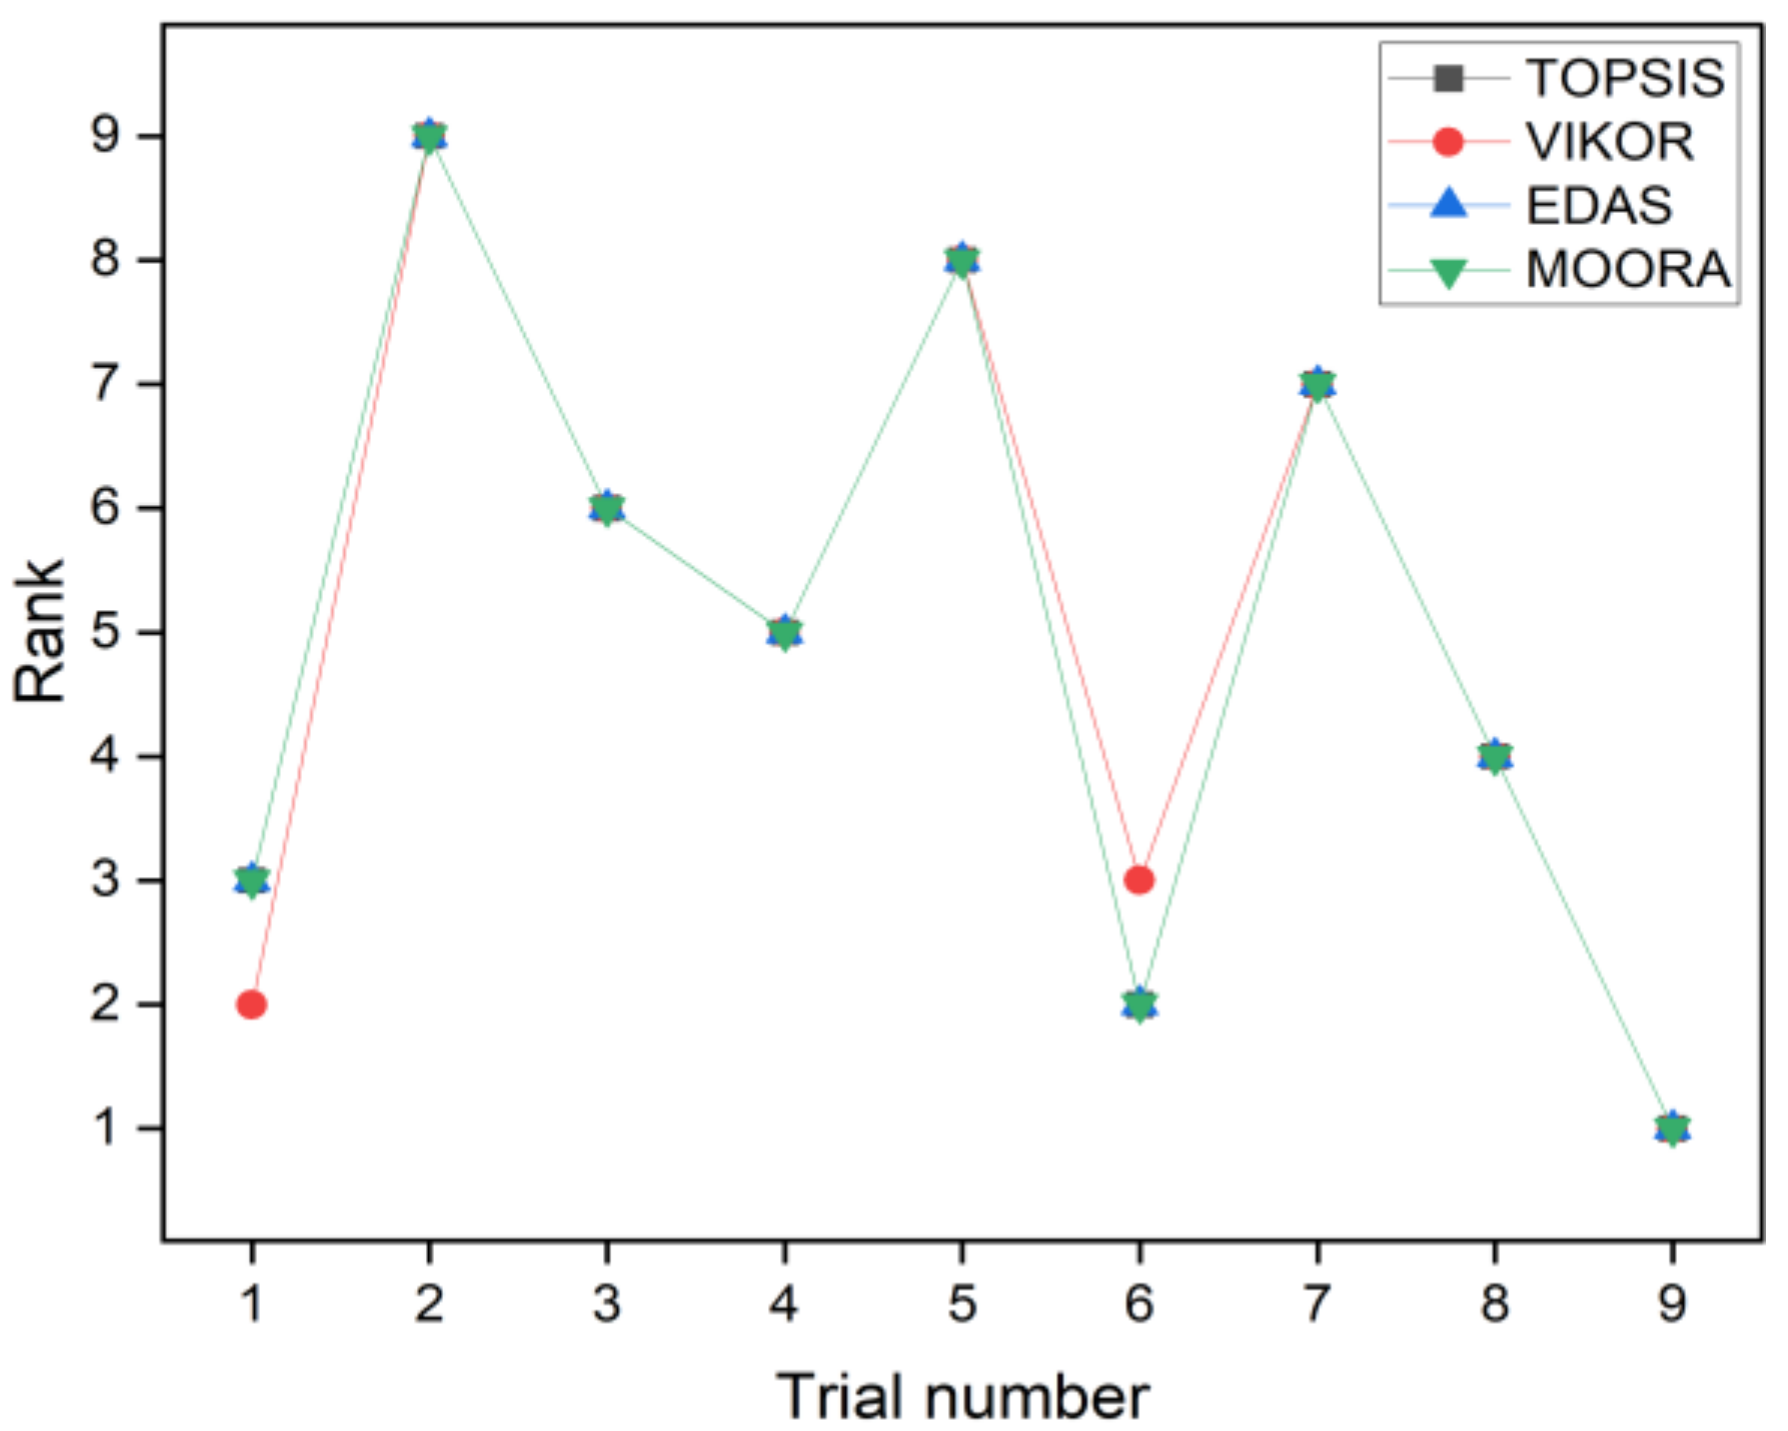
In the second case study, to achieve the most desired values of surface hardness, coefficient of friction, and wear/application, trial number 9 with the parametric setting as molding pressure = 27.90 MPa, molding temperature = 170 °C, curing time = 8 min and sintering time = 1 h is identified as the optimal combination by the considered MCDM techniques.
(d)
Based on Spearman’s rank correlation coefficients, it is noticed that the ranking performance of TOPSIS, EDAS, and MOORA methods is quite comparable for both the case studies. There are minor variations in the rankings for the VIKOR method.
(e)
For case study 1, the past researchers derived the best combination of the process parameters that did not at all exist among the considered experimental trials (outside the scope of the experimental plan). The response values at that combination are imputed by linear regression and mean of means approaches. Based on the linear regression approach, the present solutions for porosity and specific wear rate achieve 3% and 47% improvements, respectively, as compared to those obtained by the past researchers, whereas the improvements are 18% and 57%, respectively, based on the mean of means approach. There are 7% and 10% degradations in surface hardness with respect to the previous observations for linear regression and mean of means imputed solutions, respectively.
(f)
In case study 2, the past researchers identified trial number 2 as the best parametric combination. However, trial number 9, identified as the optimal parametric intermix by all the considered MCDM techniques, achieves 23.44%, 13.16%, and 90% improvements in the values of surface hardness, coefficient of friction, and wear/application, respectively.
Thus, it can be concluded that MCDM techniques can be effectively deployed for finding out the optimal mix of manufacturing process parameters for friction materials. As a future scope, the application potentialities of other yet to be popular MCDM techniques, such as multi-attributive border approximation area comparison (MABAC), multi-attributive real-ideal comparative analysis (MARICA), measurement alternatives and ranking according to compromise solution (MARCOS), combined compromise solution (CoCoSo), etc., can be explored for multi-objective optimization of manufacturing processes for friction materials as automotive brake pads.

Author Contributions

Conceptualization, D.S., H.Ö., K.K., S.C. and X.-Z.G.; methodology, D.S., H.Ö., K.K., S.C. and X.-Z.G.; software, D.S., H.Ö. and K.K.; validation, D.S., H.Ö., K.K. and S.C.; formal analysis, D.S. and K.K.; investigation, D.S. and K.K.; resources, D.S., H.Ö., K.K., S.C. and X.-Z.G.; data curation, D.S. and K.K.; writing—original draft preparation, D.S. and K.K.; writing—review and editing, K.K., S.C. and X.-Z.G.; visualization, D.S. and K.K. All authors have read and agreed to the published version of the manuscript.

Funding

This research received no external funding.

Institutional Review Board Statement

Not applicable.

Informed Consent Statement

Not applicable.

Data Availability Statement

The data presented in this study are available in the article.

Conflicts of Interest

The authors declare no conflict of interest.

References

  1. Chen, T.F. Relationship between Formulation and Noise of Phenolic Resin Matrix Friction Lining Tested in Acoustic Chamber on Automotive Brake Dynamometer. Ph.D. Thesis, Southern Illinois University, Carbondale, IL, USA, 2008. [Google Scholar]
  2. American National Standards Institute. Friction Coefficient Identification System for Brake Linings: SAE Recommended Practice; Society of Automotive Engineers: Warrendale, PA, USA, 1986. [Google Scholar]
  3. Krenkel, W.; Langhof, N. Ceramic matrix composites for high performance friction applications. In Proceedings of the IV Advanced Ceramics and Applications Conference, Belgrade, Serbia, 17 January 2017; pp. 13–28. [Google Scholar]
  4. Hee, K.W.; Filip, P. Performance of ceramic enhanced phenolic matrix brake lining materials for automotive brake linings. Wear 2005, 259, 1088–1096. [Google Scholar] [CrossRef]
  5. Han, Y.; Tian, X.; Yin, Y. Effects of ceramic fiber on the friction performance of automotive brake lining materials. Tribol. Trans. 2008, 51, 779–783. [Google Scholar] [CrossRef]
  6. Saffar, A.; Shojaei, A. Effect of rubber component on the performance of brake friction materials. Wear 2012, 274, 286–297. [Google Scholar] [CrossRef]
  7. Fan, Y.; Matějka, V.; Kratošová, G.; Lu, Y. Role of Al2O3 in semi-metallic friction materials and its effects on friction and wear performance. Tribol. Trans. 2008, 51, 771–778. [Google Scholar] [CrossRef]
  8. Verma, P.C.; Ciudin, R.; Bonfanti, A.; Aswath, P.; Straffelini, G.; Gialanella, S. Role of the friction layer in the high-temperature pin-on-disc study of a brake material. Wear 2016, 346, 56–65. [Google Scholar] [CrossRef]
  9. Langhof, N.; Rabenstein, M.; Rosenlöcher, J.; Hackenschmidt, R.; Krenkel, W.; Rieg, F. Full-ceramic brake systems for high performance friction applications. J. Eur. Ceram. Soc. 2016, 36, 3823–3832. [Google Scholar] [CrossRef]
  10. Kumar, M.; Bijwe, J. Studies on reduced scale tribometer to investigate the effects of metal additives on friction coefficient—Temperature sensitivity in brake materials. Wear 2010, 269, 838–846. [Google Scholar] [CrossRef]
  11. Öktem, H.; Uygur, İ.; Akıncıoğlu, G.; Kır, D.; Karakaş, H. Evaluation of non-asbestos high performance brake pads produced with organic dusts. In Proceedings of the 24th International Conference on Metallurgy and Materials, Brno, Czech Republic, 3–5 June 2015; pp. 3–5. [Google Scholar]
  12. Han, L.; Huang, L.; Zhang, J.; Lu, Y. Optimization of ceramic friction materials. Compos. Sci. Technol. 2006, 66, 2895–2906. [Google Scholar] [CrossRef]
  13. Cai, P.; Wang, T.; Wang, Q. Formulation optimization of friction material with golden section approach. Tribol. Trans. 2016, 59, 28–32. [Google Scholar] [CrossRef]
  14. Aleksendrić, D.; Senatore, A. Optimization of manufacturing process effects on brake friction material wear. J. Compos. Mater. 2012, 46, 2777–2791. [Google Scholar] [CrossRef]
  15. Kim, S.J.; Kim, K.S.; Jang, H. Optimization of manufacturing parameters for a brake lining using Taguchi method. J. Mater. Process. Technol. 2003, 136, 202–208. [Google Scholar] [CrossRef]
  16. Ibhadode, A.O.; Dagwa, I.M. Development of asbestos-free friction lining material from palm kernel shell. J. Braz. Soc. Mech. Sci. Eng. 2008, 30, 166–173. [Google Scholar] [CrossRef] [Green Version]
  17. Behzadian, M.; Otaghsara, S.K.; Yazdani, M.; Ignatius, J. A state-of the-art survey of TOPSIS applications. Expert Syst. Appl. 2012, 39, 13051–13069. [Google Scholar] [CrossRef]
  18. Keshavarz, G.M.; Zavadskas, E.K.; Olfat, L.; Turskis, Z. Multi-criteria inventory classification using a new method of evaluation based on distance from average solution (EDAS). Informatica 2015, 26, 435–451. [Google Scholar] [CrossRef]
  19. Chatterjee, P.; Banerjee, A.; Mondal, S.; Boral, S.; Chakraborty, S. Development of a hybrid meta-model for material selection using design of experiments and EDAS method. Eng. Trans. 2018, 66, 187–207. [Google Scholar]
  20. Opricovic, S.; Tzeng, G.-H. Extended VIKOR method in comparison with outranking methods. Eur. J. Oper. Res. 2007, 178, 514–529. [Google Scholar] [CrossRef]
  21. Brauers, W.K.; Zavadskas, E.K. The MOORA method and its application to privatization in a transition economy. Control Cybern. 2006, 35, 445–469. [Google Scholar]
  22. Chakraborty, S. Applications of the MOORA method for decision making in manufacturing environment. Int. J. Adv. Manuf. Technol. 2011, 54, 1155–1166. [Google Scholar] [CrossRef]
  23. Mahale, V.; Bijwe, J.; Sinha, S. Application and comparative study of new optimization method for performance ranking of friction materials. Proc. Inst. Mech. Eng. Part J J. Eng. Tribol. 2018, 232, 143–154. [Google Scholar] [CrossRef]
  24. Satapathy, B.K.; Bijwe, J. Performance of friction materials based on variation in nature of organic fibres: Part II. Optimisation by balancing and ranking using multiple criteria decision model (MCDM). Wear 2004, 257, 585–589. [Google Scholar]
  25. Öktem, H.; Shinde, D. Tribological performance evaluation on brake friction material by using multi-objective optimization methods. Ind. Lubr. Tribol. 2021. [Google Scholar] [CrossRef]
  26. Raju, S.S.; Murali, G.B.; Patnaik, P.K. Ranking of Al-CSA composite by MCDM approach using AHP-TOPSIS and MOORA methods. J. Reinf. Plast. Compos. 2020, 39, 721–732. [Google Scholar] [CrossRef]
  27. Khan, M.M.; Dey, A. Selection of optimal processing condition during abrasive wear of in-situ ZA-37/TiCp composites using MCDM technique. Ceram. Int. 2021, 47, 20090–20107. [Google Scholar] [CrossRef]
  28. Jeganmohan, S.; Sugozu, B.; Kumar, M.; Selvam, D.R. Experimental investigation on the friction and wear characteristics of palm seed powder reinforced brake pad friction composites. J. Inst. Eng. India Ser. D 2020, 101, 61–69. [Google Scholar] [CrossRef]
  29. Singh, T.; Pattnaik, P.; Pruncu, C.I.; Tiwari, A.; Fekete, G. Selection of natural fibers based brake friction composites using hybrid ELECTRE-entropy optimization technique. Polym. Test. 2020, 89, 106614. [Google Scholar] [CrossRef]
  30. Singh, T. Optimum design based on fabricated natural fiber reinforced automotive brake friction composites using hybrid CRITIC-MEW approach. J. Mater. Res. Technol. 2021, 14, 81–92. [Google Scholar] [CrossRef]
  31. Shannon, C.E. A mathematical theory of communication. ACM Mob. Comput. Commun. Rev. 2001, 5, 3–55. [Google Scholar] [CrossRef]
Figure 1. Manufacturing process of friction brake materials along with the corresponding input parameters.
Processes 09 01570 g001
Figure 2. Euclidean distances of the alternative trials from ideal and anti-ideal solutions in TOPSIS for case study 1.
Processes 09 01570 g002
Figure 3. Closeness coefficients of the alternatives in TOPSIS for case study 1.
Processes 09 01570 g003
Figure 4. PDA and NDA values in EDAS method for case study 1.
Processes 09 01570 g004
Figure 5. NSN and NSP values in EDAS method for case study 1.
Processes 09 01570 g005
Figure 6. Appraisal scores in EDAS method for case study 1.
Processes 09 01570 g006
Figure 7. (a) Ri and (b) Qi values in VIKOR method for case study 1.
Processes 09 01570 g007
Figure 8. Normalized assessment values in MOORA method for case study 1.
Processes 09 01570 g008
Figure 9. Comparison of rankings derived by MCDM techniques for case study 1.
Processes 09 01570 g009
Figure 10. Derived ranking results using MCDM techniques for case study 2 (a) closeness coefficients in TOPSIS, (b) appraisal scores in EDAS, (c) Qi values in VIKOR, and (d) normalized assessment values in MOORA.
Processes 09 01570 g010
Figure 11. Comparison of ranking results for case study 2.
Processes 09 01570 g011
Table 1. Experimental design plan along with the measured responses for case study 1 [15].
Exp. No.Manufacturing Process ParameterResponse
Molding Time (min)Molding Temp. (°C)Molding Pressure (MPa)Heat Treatment Time (h)Heat Treatment Temp. (°C)Surface Hardness (HRs)Porosity (%)Specific Wear Rate (× 10−6 mm3/Nm)
161502741757314.227.706
2617529.562008621.538.219
362003282258212.3410.788
4622534.5102507821.979.761
5815029.582508715.738.733
6817527102257520.264.110
7820034.542009213.846.678
882253261759017.506.678
91015032102008513.697.706
101017534.581759119.0619.007
11102002762508117.9019.007
121022529.542258619.0616.953
131215034.562258610.9212.843
14121753242508515.3213.870
151220029.5101758917.389.247
16122252782008714.726.165
Table 2. Normalized and weighted normalized decision matrixes for case study 1.
Exp. No.Normalized MatrixWeighted Normalized Matrix
Surface HardnessPorositySp. Wear RateSurface HardnessPorositySp. Wear Rate
10.2153920.2105000.1693280.0040520.0360670.137130
20.2537490.3187100.1806010.0047740.0546070.146259
30.2419470.1826700.2370510.0045520.0312980.191975
40.2301450.3252230.2144840.0043300.0557230.173699
50.2567000.2328520.1918950.0048300.0398960.155406
60.2212930.2999100.0903110.0041630.0513860.073138
70.2714530.2048740.1467390.0051070.0351030.118837
80.2655510.2590540.1467390.0049960.0443860.118837
90.2507990.2026540.1693280.0047190.0347220.137130
100.2685020.2821460.4176510.0050520.0483420.338234
110.2389960.2649750.4176510.0044960.0454000.338234
120.2537490.2821460.3725180.0047740.0483420.301683
130.2537490.1616490.2822060.0047740.0276970.228544
140.2507990.2267830.3047730.0047190.0388570.246820
150.2626010.2572770.2031890.0049410.0440810.164553
160.2567000.2179010.1354670.0048300.0373350.109708
Table 3. Spearman’s rank correlation coefficients between MCDM methods for case study 1.
MCDMTOPSISEDASVIKORMOORA
TOPSIS10.98820.98530.9882
EDAS0.988210.99711
VIKOR0.98530.997110.9971
MOORA0.988210.99711
Table 4. Experimental design plan and responses for case study 2 [16].
Exp. No.Molding Pressure (MPa)Molding Temperature (°C)Curing Time (min)Heat Treatment Time (h)Surface Hardness (Scale B)Coefficient of FrictionWear/Application (g)
116.7415061840.440.023
216.7416082640.380.170
316.74170103810.390.037
423.3215083790.410.027
522.32160101800.350.043
622.3217062890.420.023
727.90150102810.350.037
827.9016063820.410.023
927.9017081790.430.017
Table 5. Normalized and weighted normalized decision matrixes for case study 2.
Exp. No.Normalized MatrixWeighted Normalized Matrix
Surface HardnessCoefficient of FrictionWear/ApplicationSurface HardnessCoefficient of FrictionWear/Application
10.3493910.3676120.1210660.0032610.0031840.118887
20.2662030.3174830.8948360.0024840.0027500.878733
30.3369130.3258380.1947580.0031440.0028220.191254
40.3285940.3425480.1421210.0030670.0029670.139564
50.3327530.2924190.2263410.0031060.0025330.222268
60.3701880.3509030.1210660.0034550.0030400.118887
70.3369130.2924190.1947580.0031440.0025330.191254
80.3410720.3425480.1210660.0031830.0029670.118887
90.3285940.3592580.0894840.0030670.0031120.087873
Table 6. Spearman’s rank correlation coefficients for case study 2.
MCDMTOPSISEDASVIKORMOORA
TOPSIS110.983331
EDAS110.983331
VIKOR0.983330.9833310.98333
MOORA110.983331
Publisher’s Note: MDPI stays neutral with regard to jurisdictional claims in published maps and institutional affiliations.

