Article

Effect of Tip Clearance Size on Tubular Turbine Leakage Characteristics

1
Key Laboratory of Fluid and Power Machinery, Ministry of Education, Xihua University, Chengdu 610039, China
2
State Key Laboratory of Hydroscience and Engineering, Tsinghua University, Beijing 100084, China
3
AVIC Chengdu CAIC Electronics Co., Ltd., Chengdu 610091, China
*
Author to whom correspondence should be addressed.
Processes 2021, 9(9), 1481; https://doi.org/10.3390/pr9091481
Submission received: 18 July 2021 / Revised: 20 August 2021 / Accepted: 22 August 2021 / Published: 24 August 2021
(This article belongs to the Special Issue CFD Modelling and Simulation of Water Turbines)

Abstract

:
To study the effect of tip clearance on unsteady flow in a tubular turbine, a full-channel numerical calculation was carried out based on the SST kω turbulence model using a power-plant prototype as the research object. Tip leakage flow characteristics of three clearance δ schemes were compared. The results show that the clearance value is directly proportional to the axial velocity, momentum, and flow sum of the leakage flow but inversely proportional to turbulent kinetic energy. At approximately 35–50% of the flow direction, velocity and turbulent kinetic energy of the leakage flow show the trough and peak variation law, respectively. The leakage vortex includes a primary tip leakage vortex (PTLV) and a secondary tip leakage vortex (STLV). Increasing clearance increases the vortex strength of both parts, as the STLV vortex core overlaps Core A of PTLV, and Core B of PTLV becomes the main part of the tip leakage vortex. A “right angle effect” causes flow separation on the pressure side of the tip, and a local low-pressure area subsequently generates a separation vortex. Increasing the gap strengthens the separation vortex, intensifying the flow instability. Tip clearance should therefore be maximally reduced in tubular turbines, barring other considerations.

1. Introduction

As energy consumption increases, pollution and its reduction are urgent challenges faced by human society. As a resource for sustainable development, green energy has attracted increasing attention from researchers and industries [1,2,3]. Therefore, in recent years, the trend of developing renewable and clean energy has been increasing, with hydropower playing an important role and developing at an unprecedented rate [4,5,6]. Among them, the tubular turbine has the advantages of a short construction period, small investment, large excess flow, high efficiency, good cavitation performance, and fewer blades. Thus, it is widely used in the development of low-head water resources [7,8,9].
In the turbine design process, a small clearance, as shown in Figure 1, is needed between the blade tip and the shroud to avoid interference between them. The fluid in the clearance forms a leakage flow because of the pressure difference between the blade pressure side and suction side, accompanied by the generation of vortices. Leakage flow is an irregular fluid movement with complex boundary conditions and high turbulence intensity, and seriously affects the stable operation of the turbine and reduces the effective head and efficiency [10,11,12]. Therefore, it is necessary to study and understand the tip leakage characteristics to predict the power generation and structural load to assess the applicability and economy of a power station before deployment. Presently, many scholars have studied the formation mechanism and geometric influence of the tip leakage vortex (TLV) through numerical calculations and experimental methods [13,14,15,16]. Taha et al. [17] studied the performance of a Wells turbine under different tip clearances using the computational fluid dynamics method. The results showed that although the performance of a turbine with non-uniform tip clearance was similar to that of a turbine with uniform tip clearance in terms of torque coefficient, input power coefficient, and efficiency, a turbine with uneven tip clearance seemed to provide better overall performance. Guenette et al. [18] analyzed and studied tubular turbines with tip, hub, and no clearance and found that the influence of hub clearance on runner performance was much smaller than that of tip clearance at the outer edge of the blade. Zhang et al. [19] used a combination of numerical simulation and high-speed photography to study the TLV structure of axial flow pumps based on different tip clearances. The results show that the starting point of the TLV appears near the leading edge under low-flow conditions. Under high flow conditions, the starting point of the TLV shifts to the middle of the blade chord, and the direction is parallel to the blade wing. As the blade tip size was increased, the starting point of the TLV trajectory moved towards the center of the blade chord, and the minimum pressure in the vortex core gradually decreased. Xiao et al. [20] measured the distribution of pressure, velocity, and runner loss in an experimental study of an axial runner. Studies have found that the action of suction on the vortex increases the load near the blade tip. Total pressure loss, as well as reduction of total pressure, occurred in the clearance leakage vortex region. Lemay et al. [21] used laser Doppler velocimetry (LDV) technology to find two vortices with opposite rotation directions in the area near the blade tip of the suction surface.
The above studies are focused on a fixed gap or small gap size, and there are few studies on the tip leakage flow characteristics in large gap size. In this study, based on the SST kω turbulence model, the full-channel unsteady numerical calculation of a tubular turbine with one normal and two large clearances is carried out under the rated flow condition. The leakage flow characteristics in the clearance were analyzed, and the distribution and intensity of the leakage vortex were analyzed using the Q criterion vortex-dynamics method. The influence of the TLV on the energy conversion characteristics of the tubular turbine under a large clearance structure is revealed, providing a basis for the design optimization of tubular turbines.

2. Numerical Model

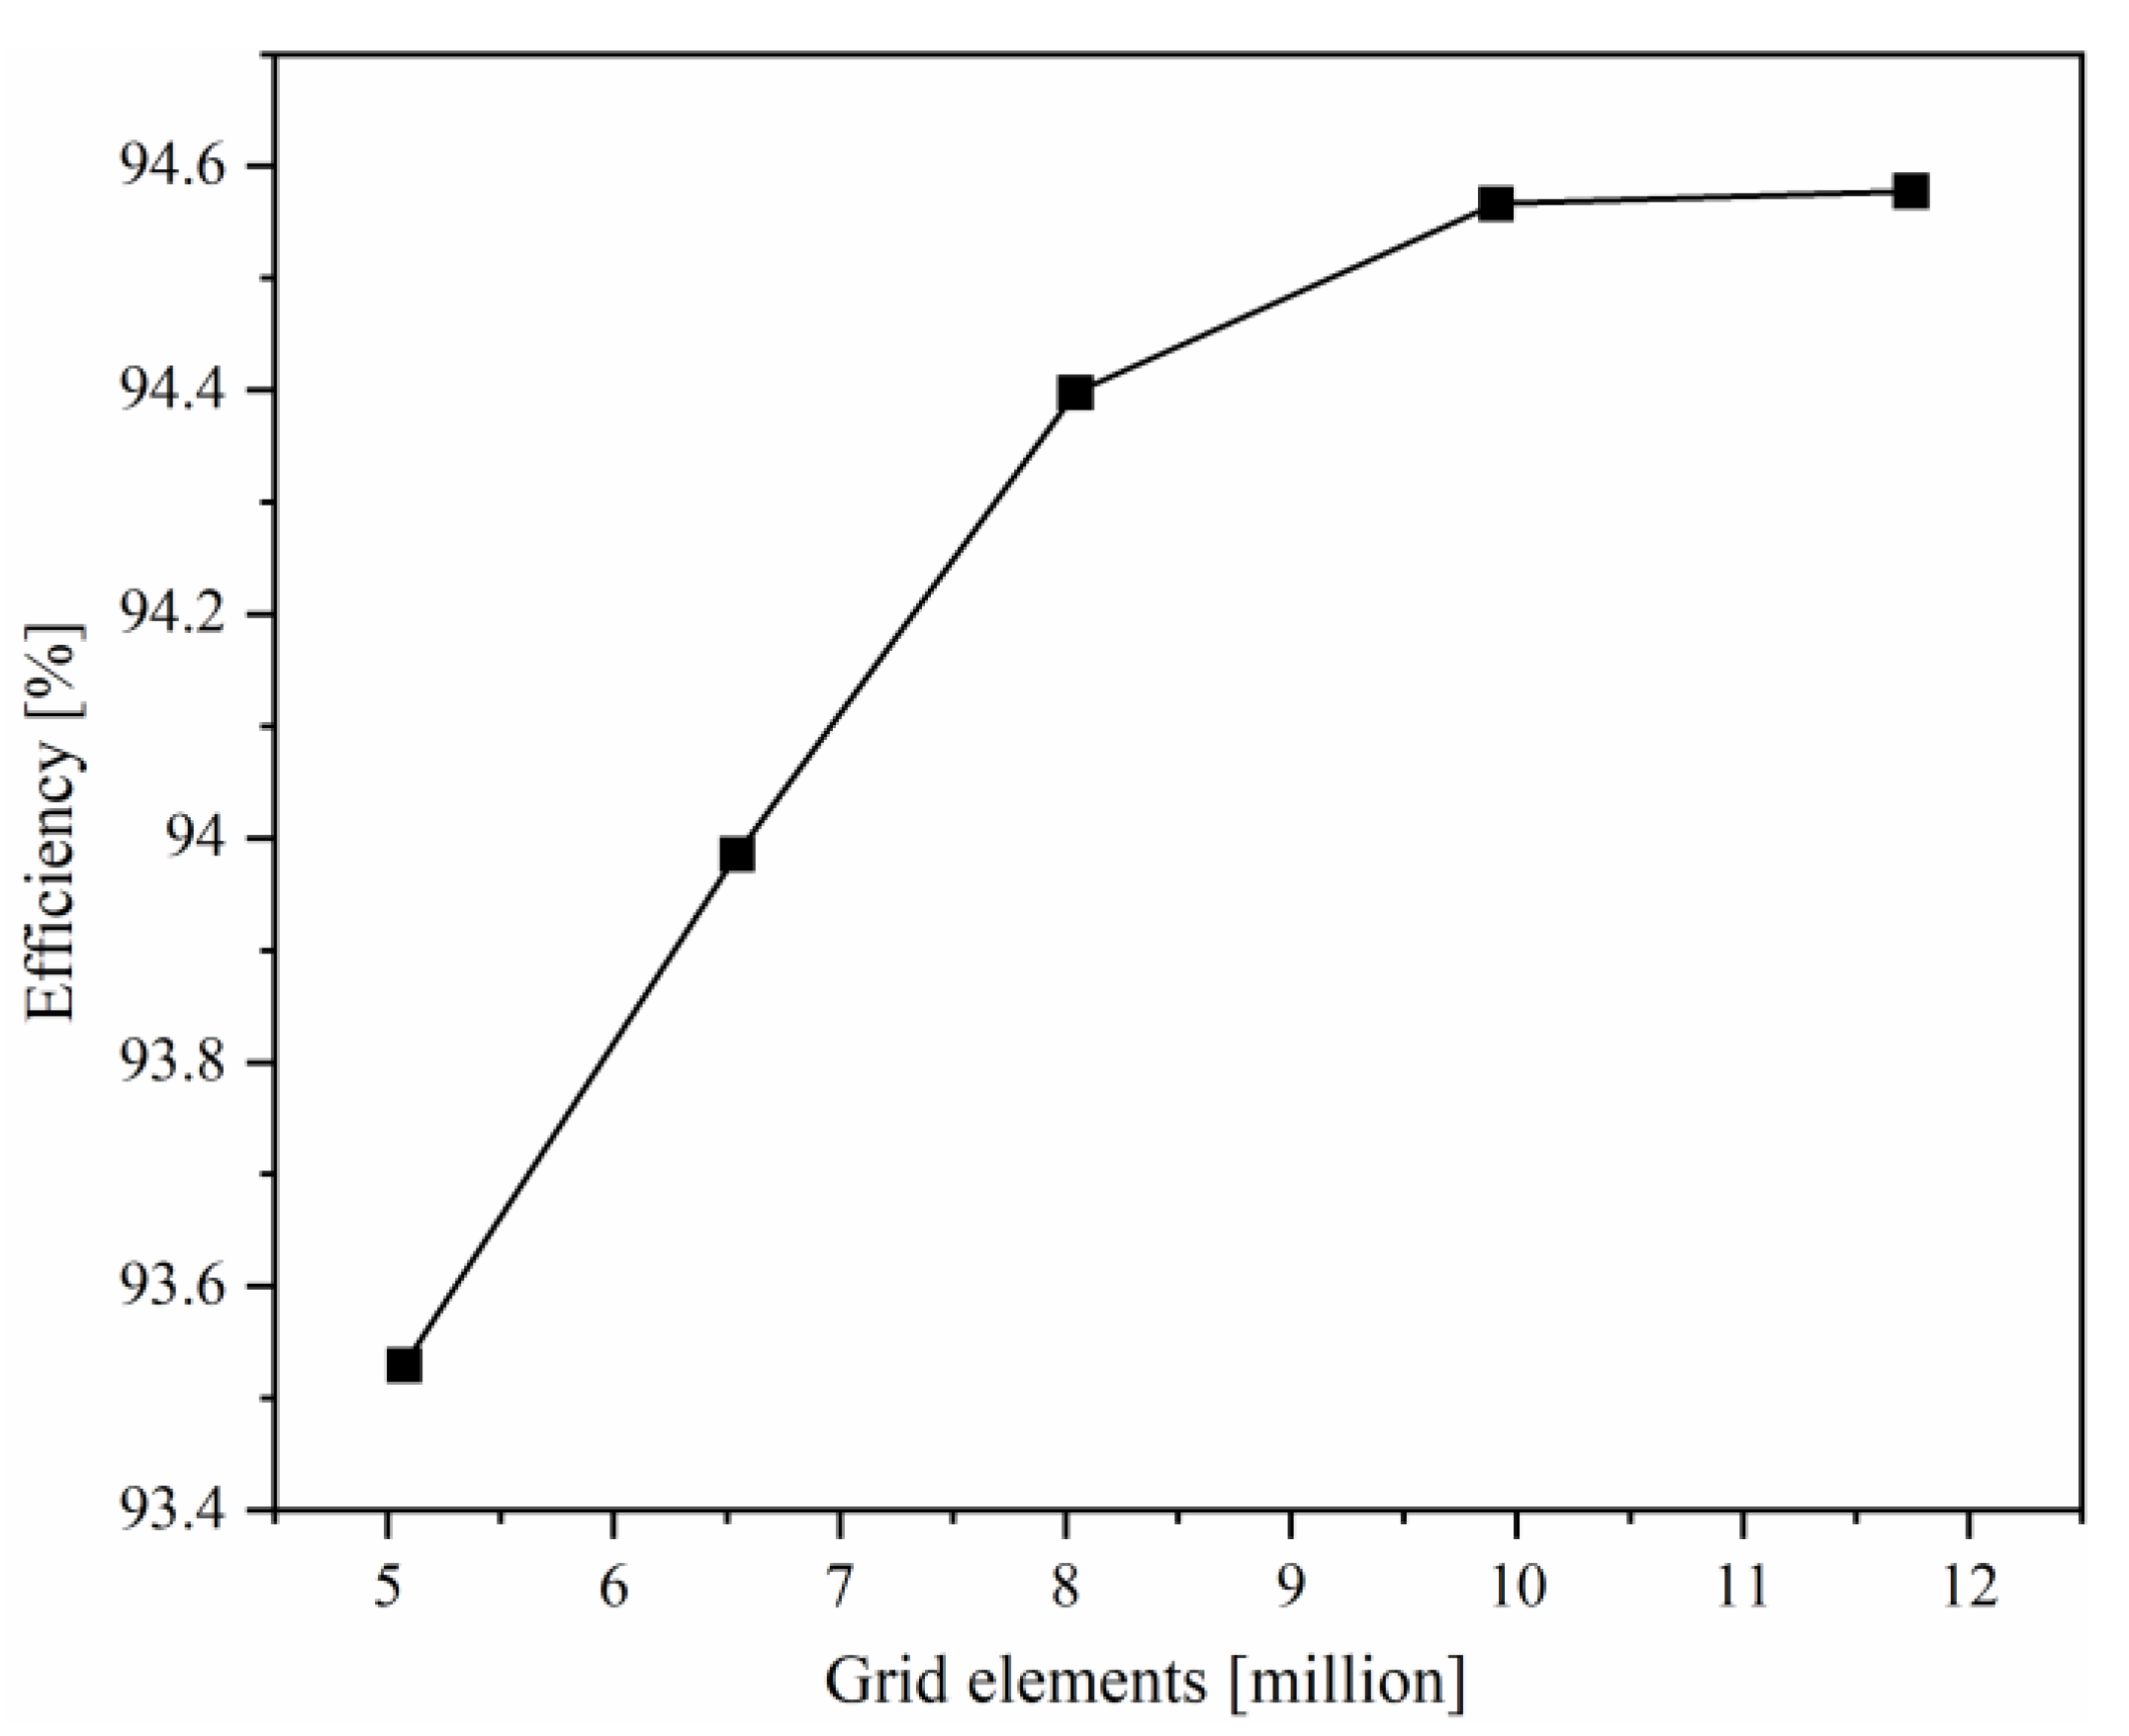
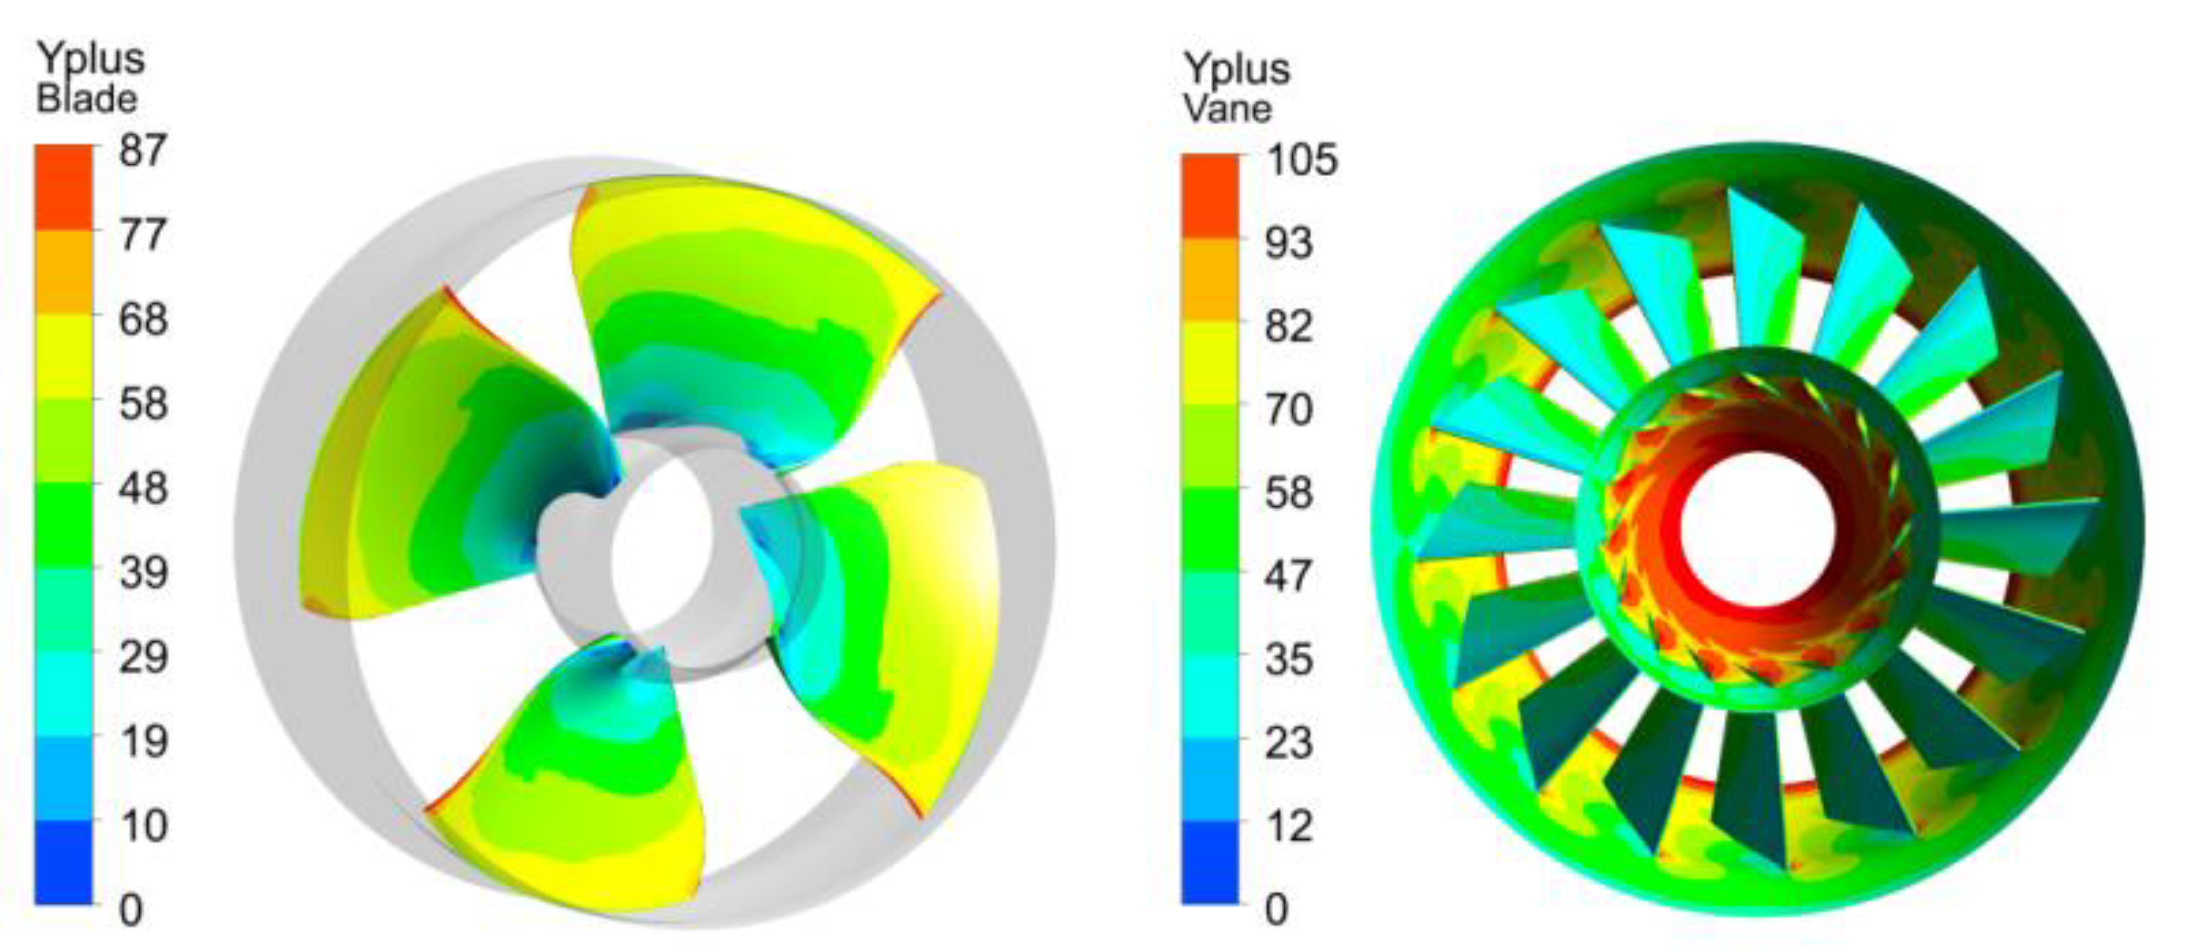
2.1. Computational Method

In this study, the governing equations include the continuity equation of an incompressible fluid and the Reynolds-averaged Navier-Stokes (RANS) equation.
ρ t + ( ρ u i ) x i = 0
( ρ u i ) t + ( ρ u i u j ) x i = p x i + x j [ μ e f f ( u i x j + u j x i ) ]
The ANSYS CFX 17.0 commercial computational fluid dynamics software was used to solve the three-dimensional unsteady flow in a hydraulic turbine. The discretization of the control equation is based on the finite volume method, and a control volume composed of internal unit nodes was considered. The SST kω model was chosen as the turbulence model to capture the separated flow near the tip clearance more accurately [22]. Compared with the standard kε and RNG kε models, this model considers the viscosity of the inner wall of the model and has better turbulent shear stress transmission. The algorithm is more stable and has a better simulation performance for flow in a narrow space [23]. The corresponding turbulent kinetic energy and frequency equations are as follows [24]:
( ρ k ) t + ( ρ u i k ) x i = x i [ ( μ + σ k μ k ) k x i ] + P ˜ k 0.09 ρ k ω
( ρ ω ) t + ( ρ u i ω ) x i = x i [ ( μ + σ ω μ t ) ω x i ] + ( 1 F 1 ) ρ σ ω 2 1 ω k x i ω x i + [ 5 9 F 1 + 0.44 ( 1 F 1 ) ] 1 ν P ˜ k t β ρ ω 2

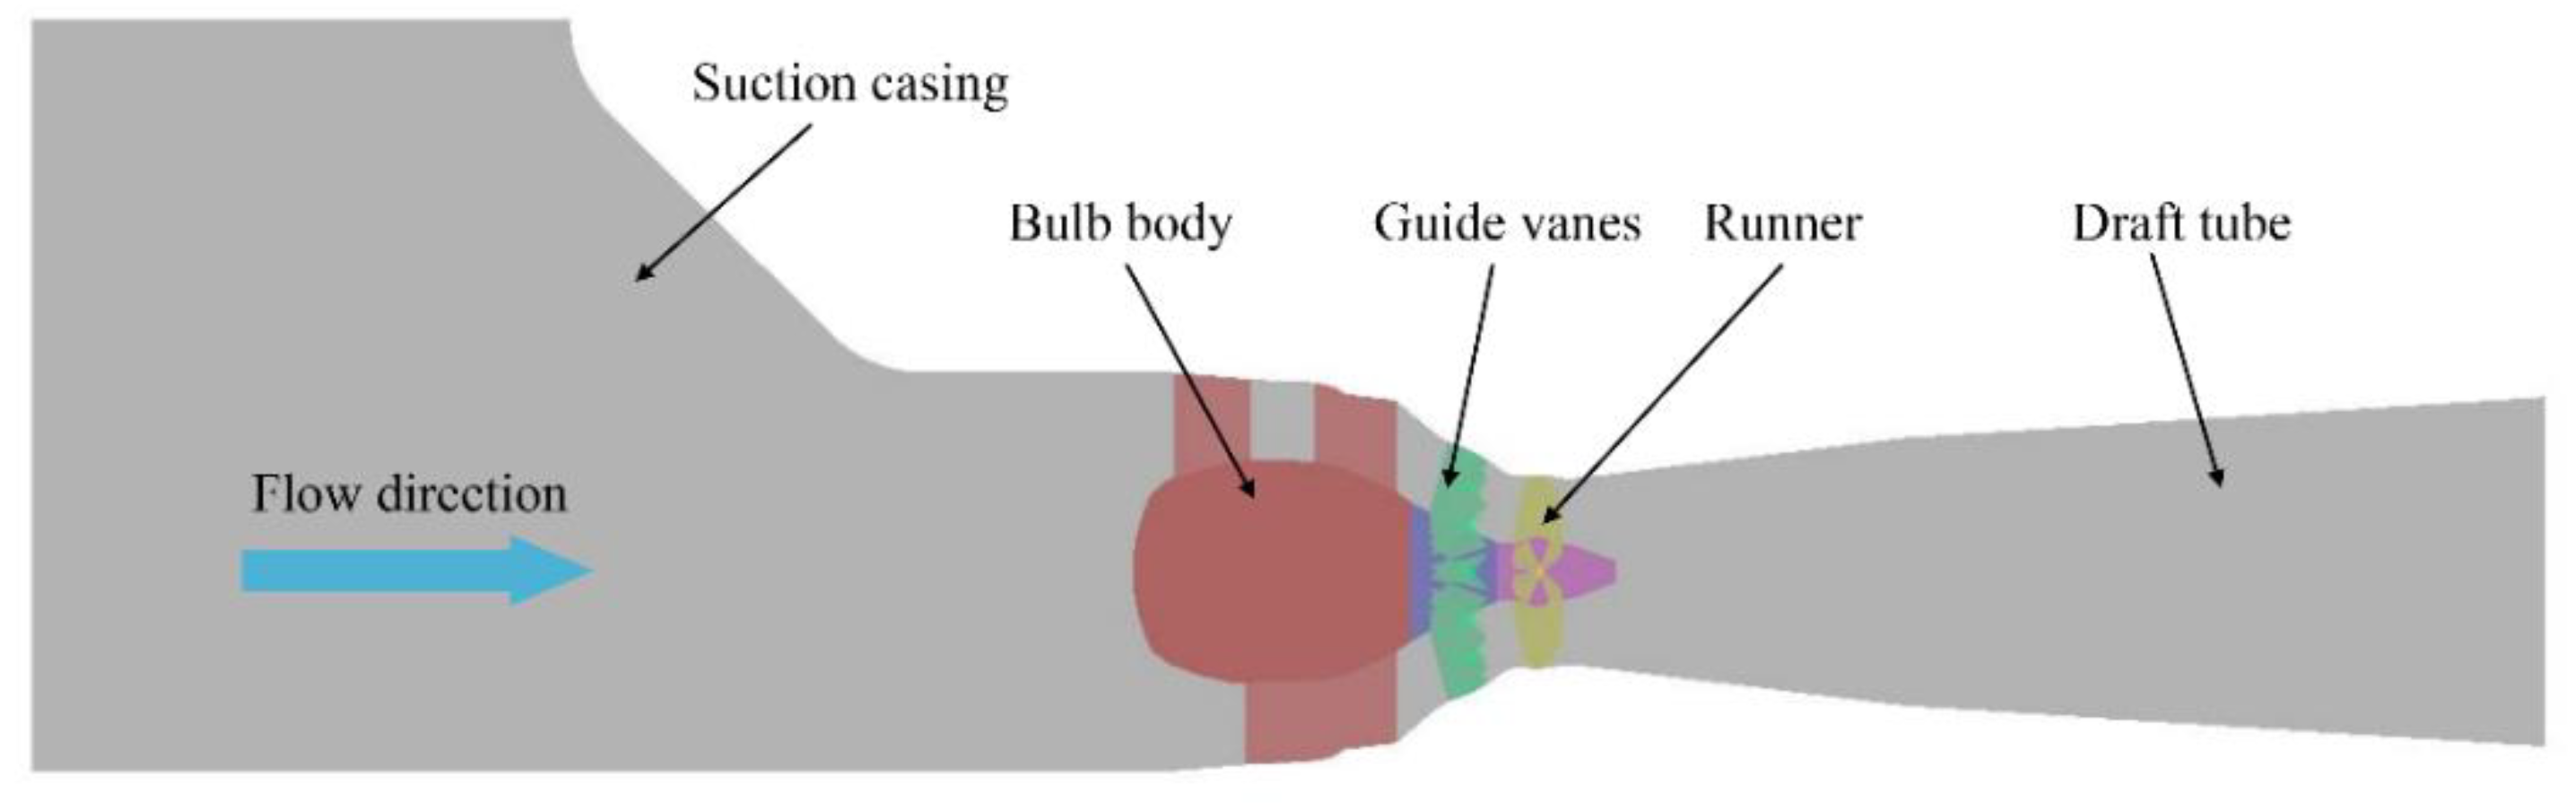
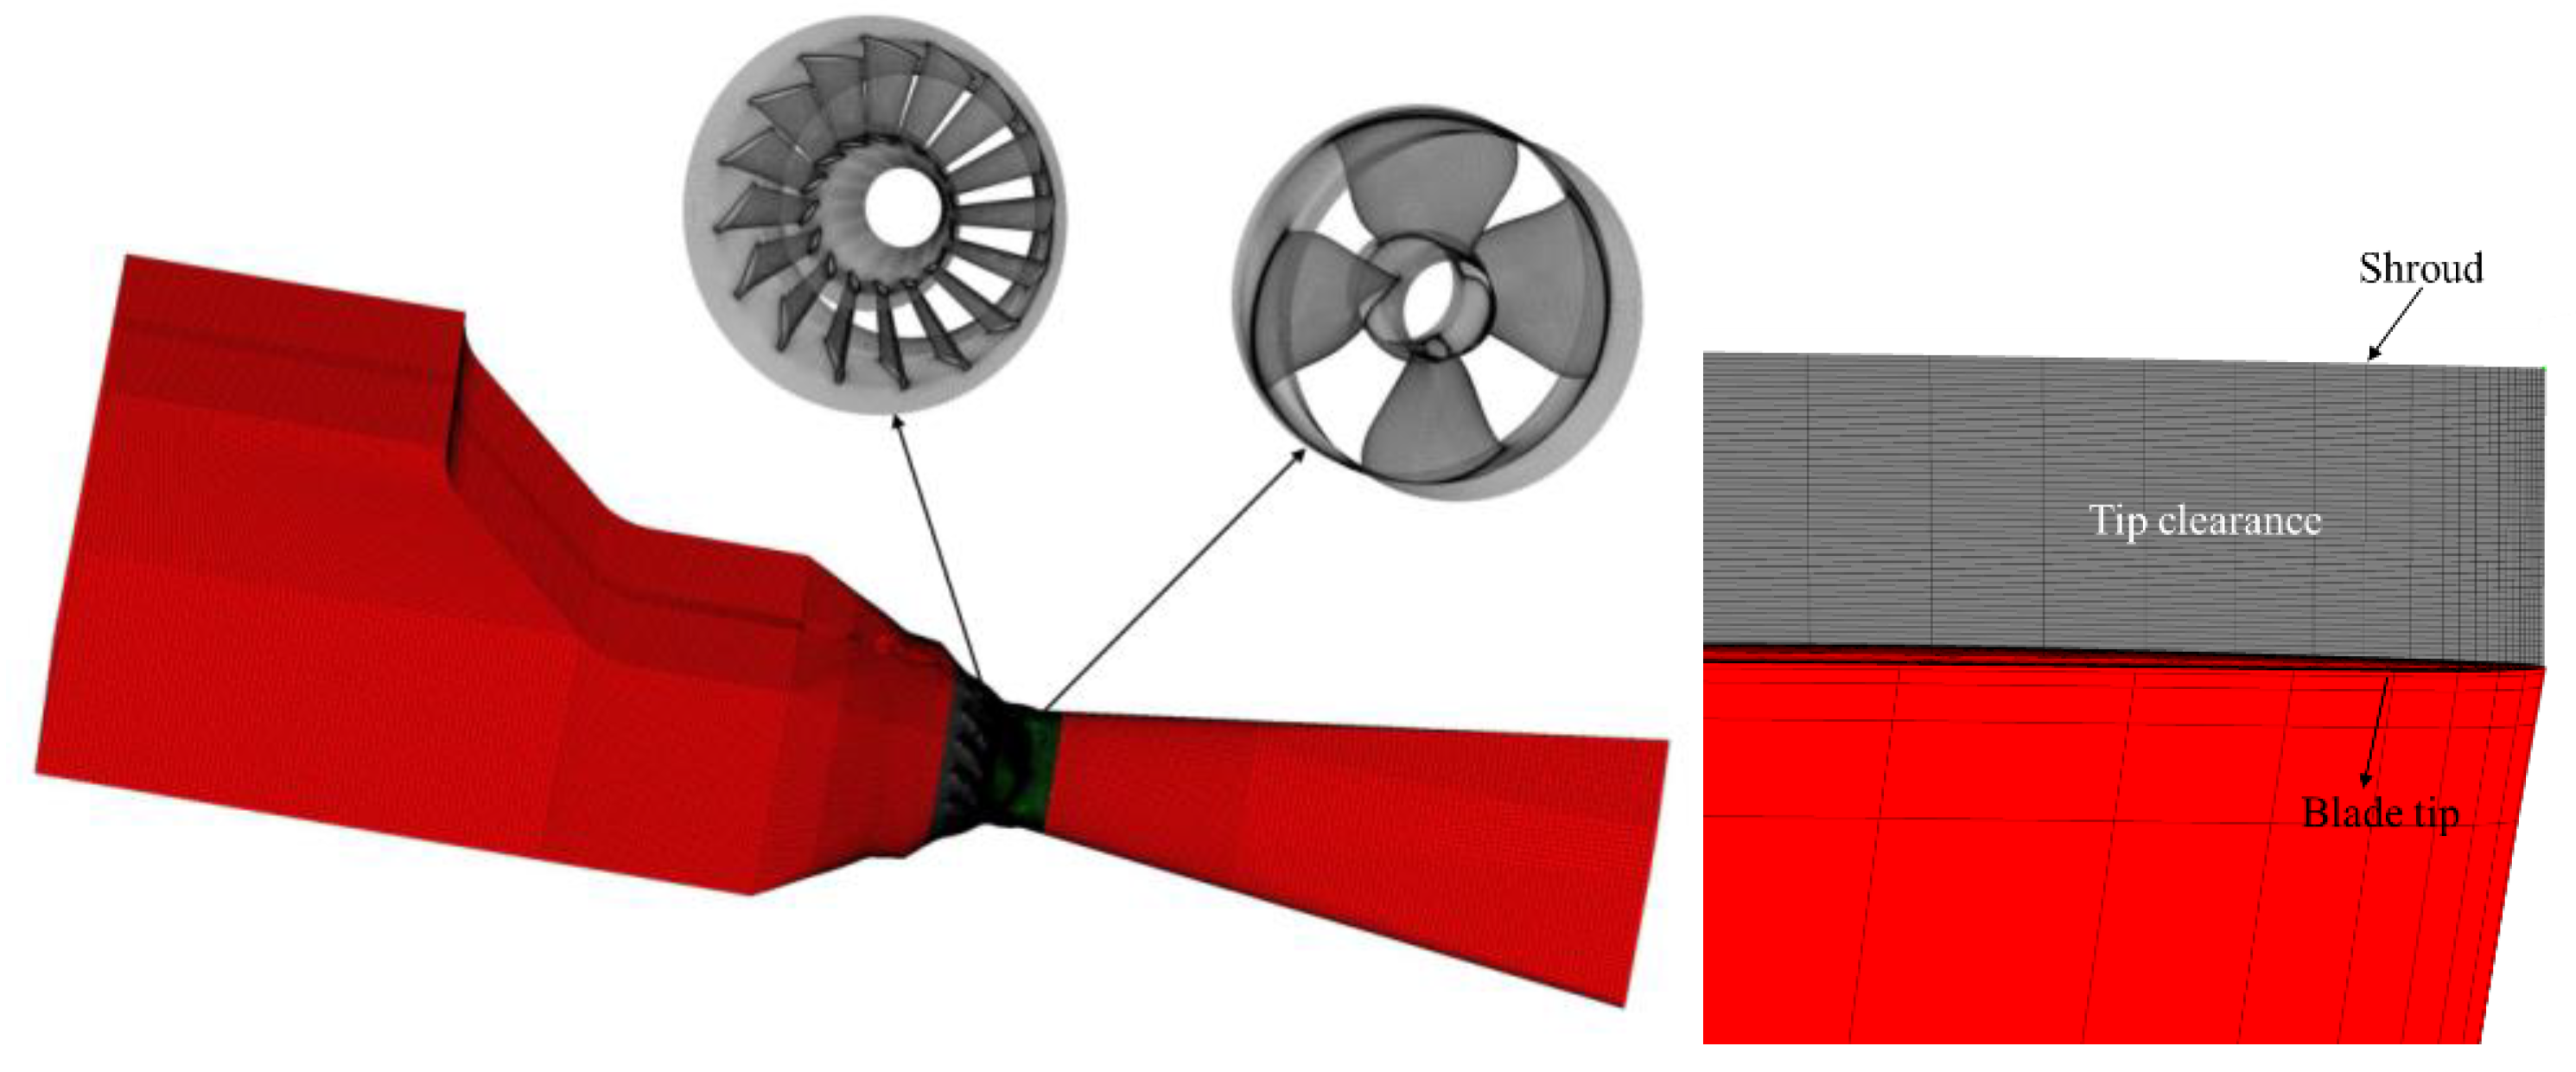
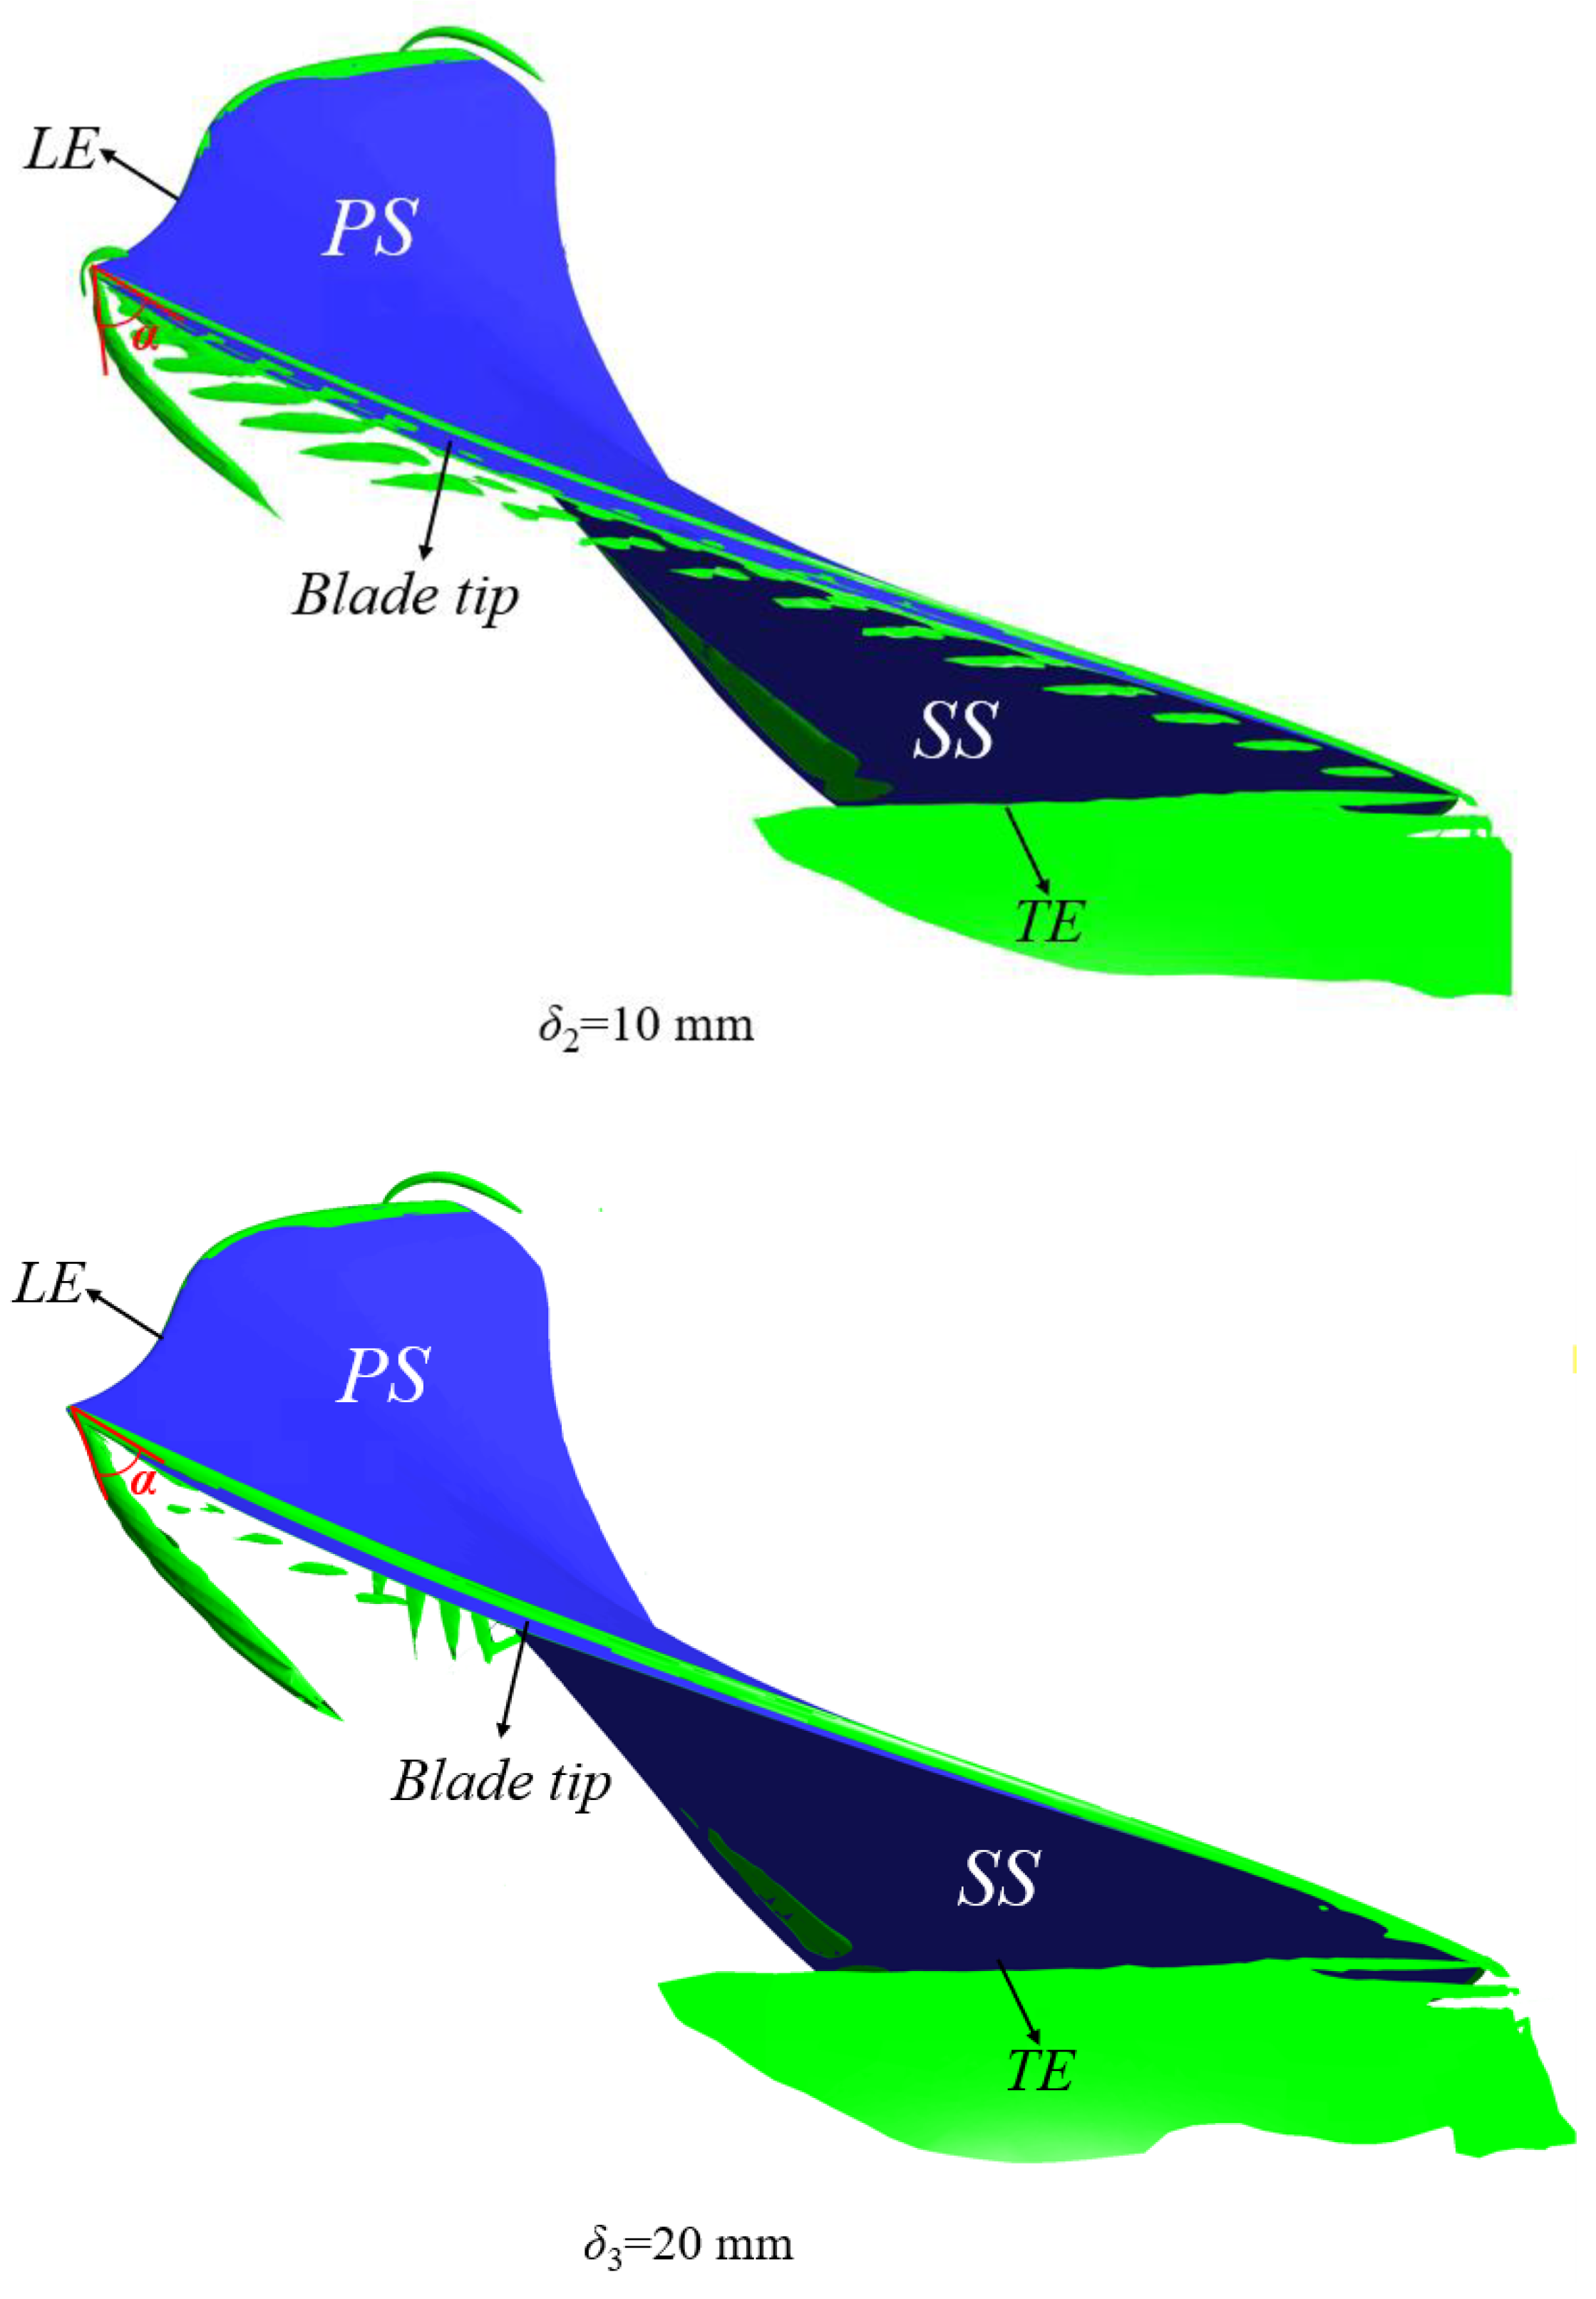
2.2. Computational Model

To improve the reliability of the numerical results, this study considers the tubular turbine of a power station as the research object and uses UG NX 12.0 commercial software to complete the model design. The main design parameters are listed in Table 1. The calculation domain mainly includes four components, namely, the water inlet section, water guide mechanism, impeller, and draft tube, as shown in Figure 2.
Considering the platform configuration (Intel Xeon E5-2650 @ 2.3 processor with 64 GB of RAM) and the entire channel structure, this study used the commercial software, ICEM CFD 17.0, to mesh the computational domain. Parts with narrow geometric structure, such as the guide vane, impeller, and tip clearance, were locally encrypted with an “O-shaped” grid to ensure the uniform transition between the tip clearance and the grids of other parts, and to accurately capture the complex flow details around the tip clearance. The entire flow passage and local grid are shown in Figure 3. To ensure grid quality, grid independence verification analysis was carried out, and five schemes with different grid numbers were verified and analyzed with turbine efficiency as the judgment standard. The results are presented in Figure 4. It can be seen from Figure 4 that when the number of grids increases from 9.3 to 11.73 million, the efficiency increment of the hydraulic turbine is less than 0.01%, which fulfills the requirement of grid independence. Finally, the scheme with 9,379,600 grids was selected for the numerical calculation. The number of grids for the inlet section, the movable guide vane, the runner and the draft tube were 1,760,634; 3,762,800; 2,849,380 and 1,006,787, respectively. The y+ distribution near the blade and guide vane is shown in Figure 5, which meets the requirements of the SST kω near-wall turbulence model [25].
The corresponding boundary conditions were set according to operating conditions. In this study, the inlet was set as the mass flow, the outlet as the static pressure, and the wall as a non-slip wall. The turbulent flow on the wall of each flow component was determined using the standard wall function. The static reference coordinate was selected as the internal flow coordinate of the fixed part, and the rotating reference coordinate as the internal flow coordinate of the rotating part. Because the SST kω turbulence model was used to solve the flow state at the gap, a high-resolution mode was selected. The time step of the steady numerical calculation was set to 1/ω, that is, the reciprocal of the rotational angular velocity and the dynamic and static interface was set to the frozen rotor interface. For unsteady numerical calculation, to further improve the solution accuracy, high resolution and second-order backward Euler were selected. The measurement of the time step was set as each rotation by the runner by 2° (0.004889 s), and the total calculated time was 15.84 s, which accounted for 18 rotation cycles. The static-dynamic interface was set as the transient rotor/stator interface. The interfaces between the various flow components are shown in Figure 6, where 1 is the interface between the water inlet section and movable guide vane, 2 is the interface between the movable guide vane and runner, 3 is the interface between the runner and draft tube, and 2 and 3 are rotary interfaces.

3. Numerical Results and Discussion

To study the leakage flow and leakage vortex characteristics of the hydraulic turbine under different tip clearances, the unsteady numerical calculation results of three structures with tip clearance δ1 = 5 mm, δ2 = 10 mm, and δ3 = 20 mm were analyzed under the rated flow condition Qr (guide vane opening 55.6° and slurry vane opening 20°).

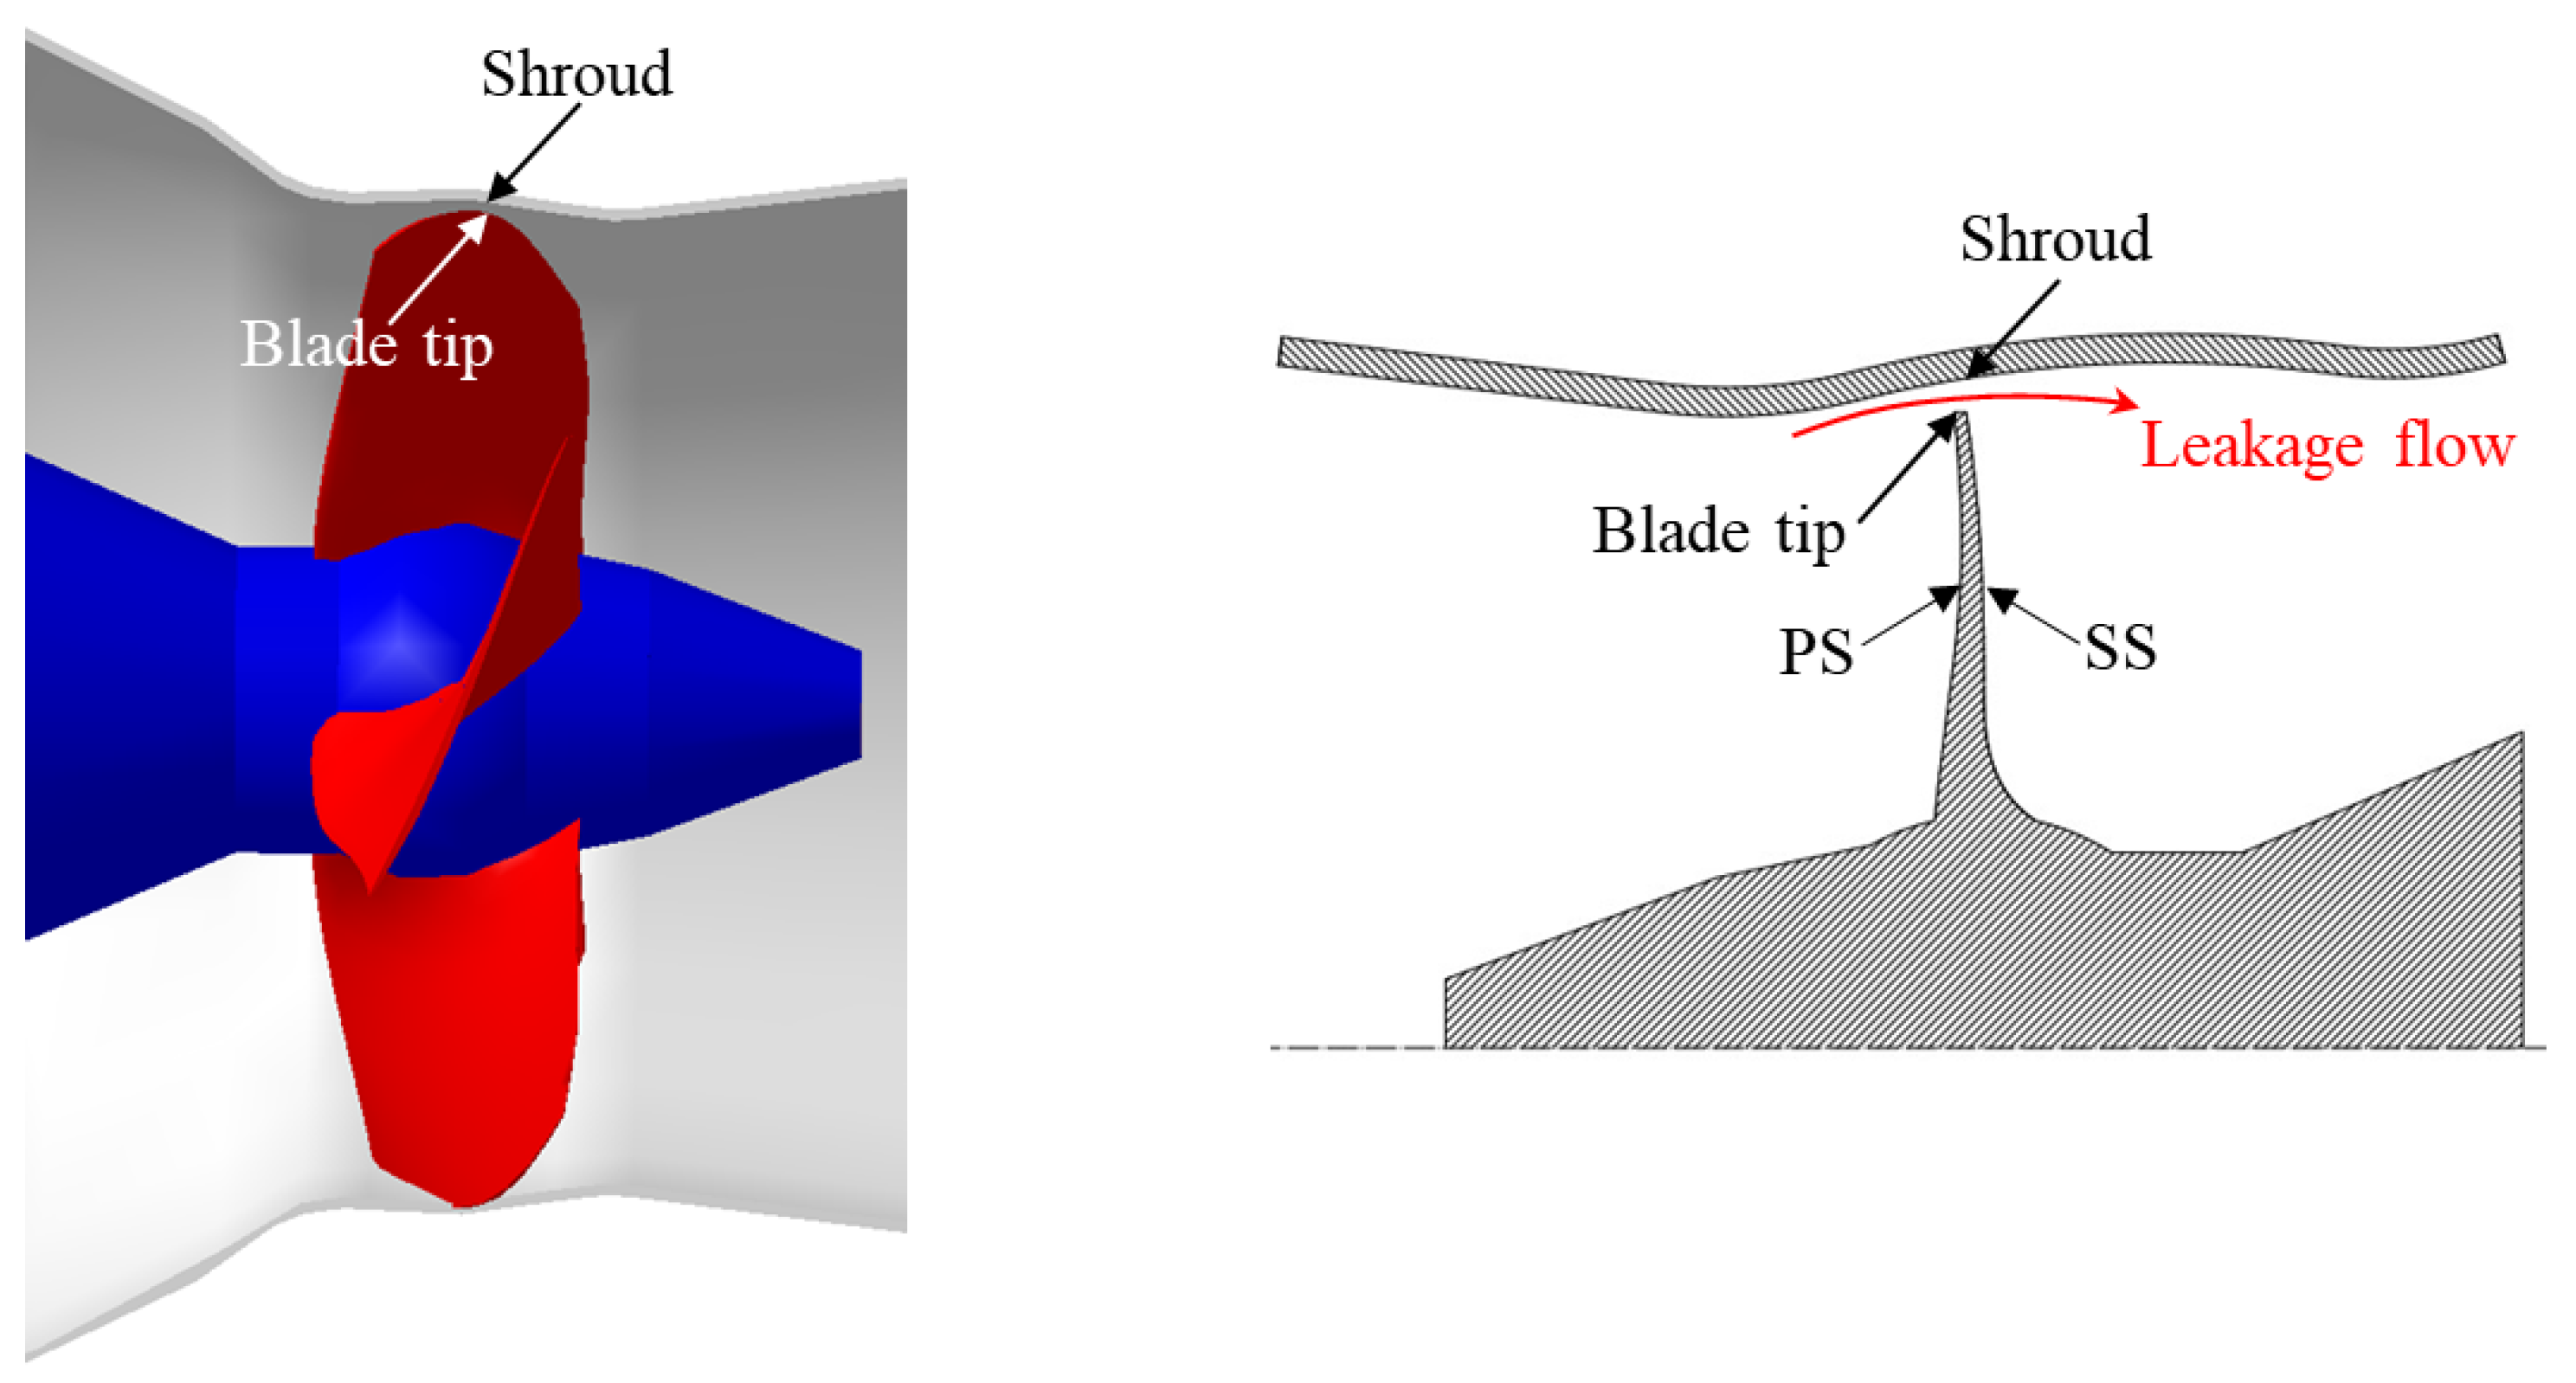
3.1. Tip Leakage Flow Characteristics

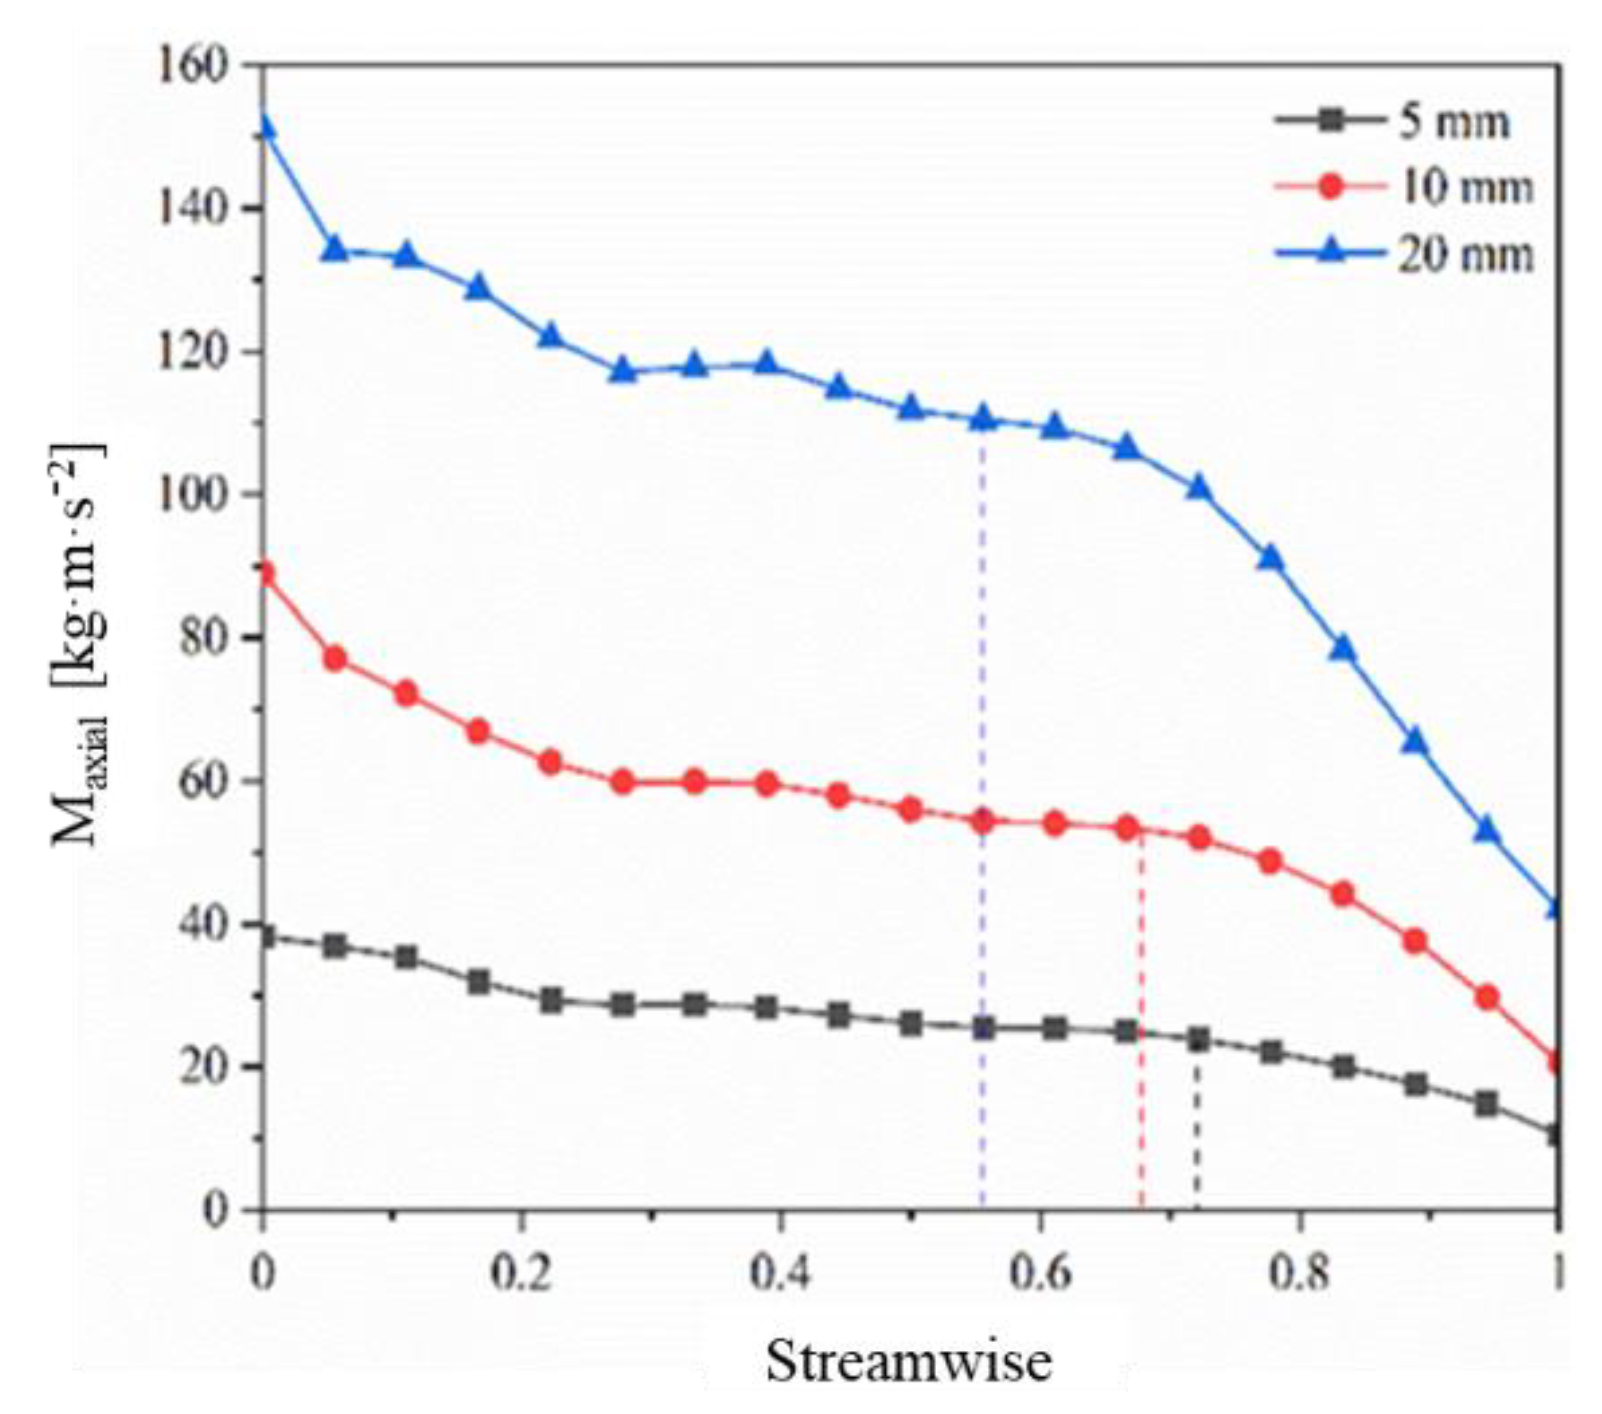
3.1.1. Axial Momentum and Flow

The tip leakage flow was formed under the pressure difference between the blade pressure side and suction side, as shown in Figure 1, and the axial momentum of the leakage flow can be used to describe the intensity of the tip leakage flow. An axial momentum balance existed between the main flow and tip leakage flow [26]. Under a certain clearance, the cumulative axial momentum of the tip leakage flow is defined as follows [27]:
M axial = 0 z 0 δ ρ ( v n ) w d r d z ,
where z is the axial distance along the blade chord, δ is the tip clearance height, v is the velocity vector, n is the unit vector normal to the blade, and w is the axial velocity.
To study the axial momentum and flow rate of the leakage flow under different tip clearances, a section from the leading edge to the trailing edge of the blade was set in the clearance channel between the tip and the runner chamber, which was divided into 19 parts along the flow direction. The axial momentum and leakage flow were calculated for the 19 small sections, and the results are shown in Figure 7 and Figure 8. It can be observed from Figure 7 that the axial momentum is maximum at the leading edge of the blade, decreases gradually along the flow direction, and reaches a minimum at the trailing edge; this is due to the maximum pressure difference between the pressure side and the suction side near the leading edge of the blade, which results in the maximum leakage flow velocity. With an increase in clearance, the axial momentum increases as a whole. The axial momentum difference at the leading-edge position of the blade was the largest, and that at the trailing edge position was the smallest under different clearances. It can be predicted that the influence of the tip clearance on the leakage flow is the strongest near the leading edge and weakest near the trailing edge of the blade. The axial momentum suddenly drops by approximately 60% in the flow direction when the tip clearance is δ3 = 20 mm, and drops by approximately 65% and 70% when the clearance is δ2 = 10 mm and δ1 = 5 mm, respectively. Especially in a small gap (δ1 = 5 mm), the axial momentum is almost linearly changing. It can be seen that the axial momentum of the tip leakage flow decreases significantly at a certain point along the flow direction, and the turning point will be closer to the middle position of the tip when the gap is larger. Figure 8 shows the leakage flow across the gap surface under different gaps, and the change rule is almost the same as the axial momentum. The leakage vortex is formed by the interaction between the leakage flow and the main flow. It is inferred from the above analysis that the TLV is mainly formed from the leading edge to the middle of the blade, and the leakage vortex generated near the trailing edge is weak.

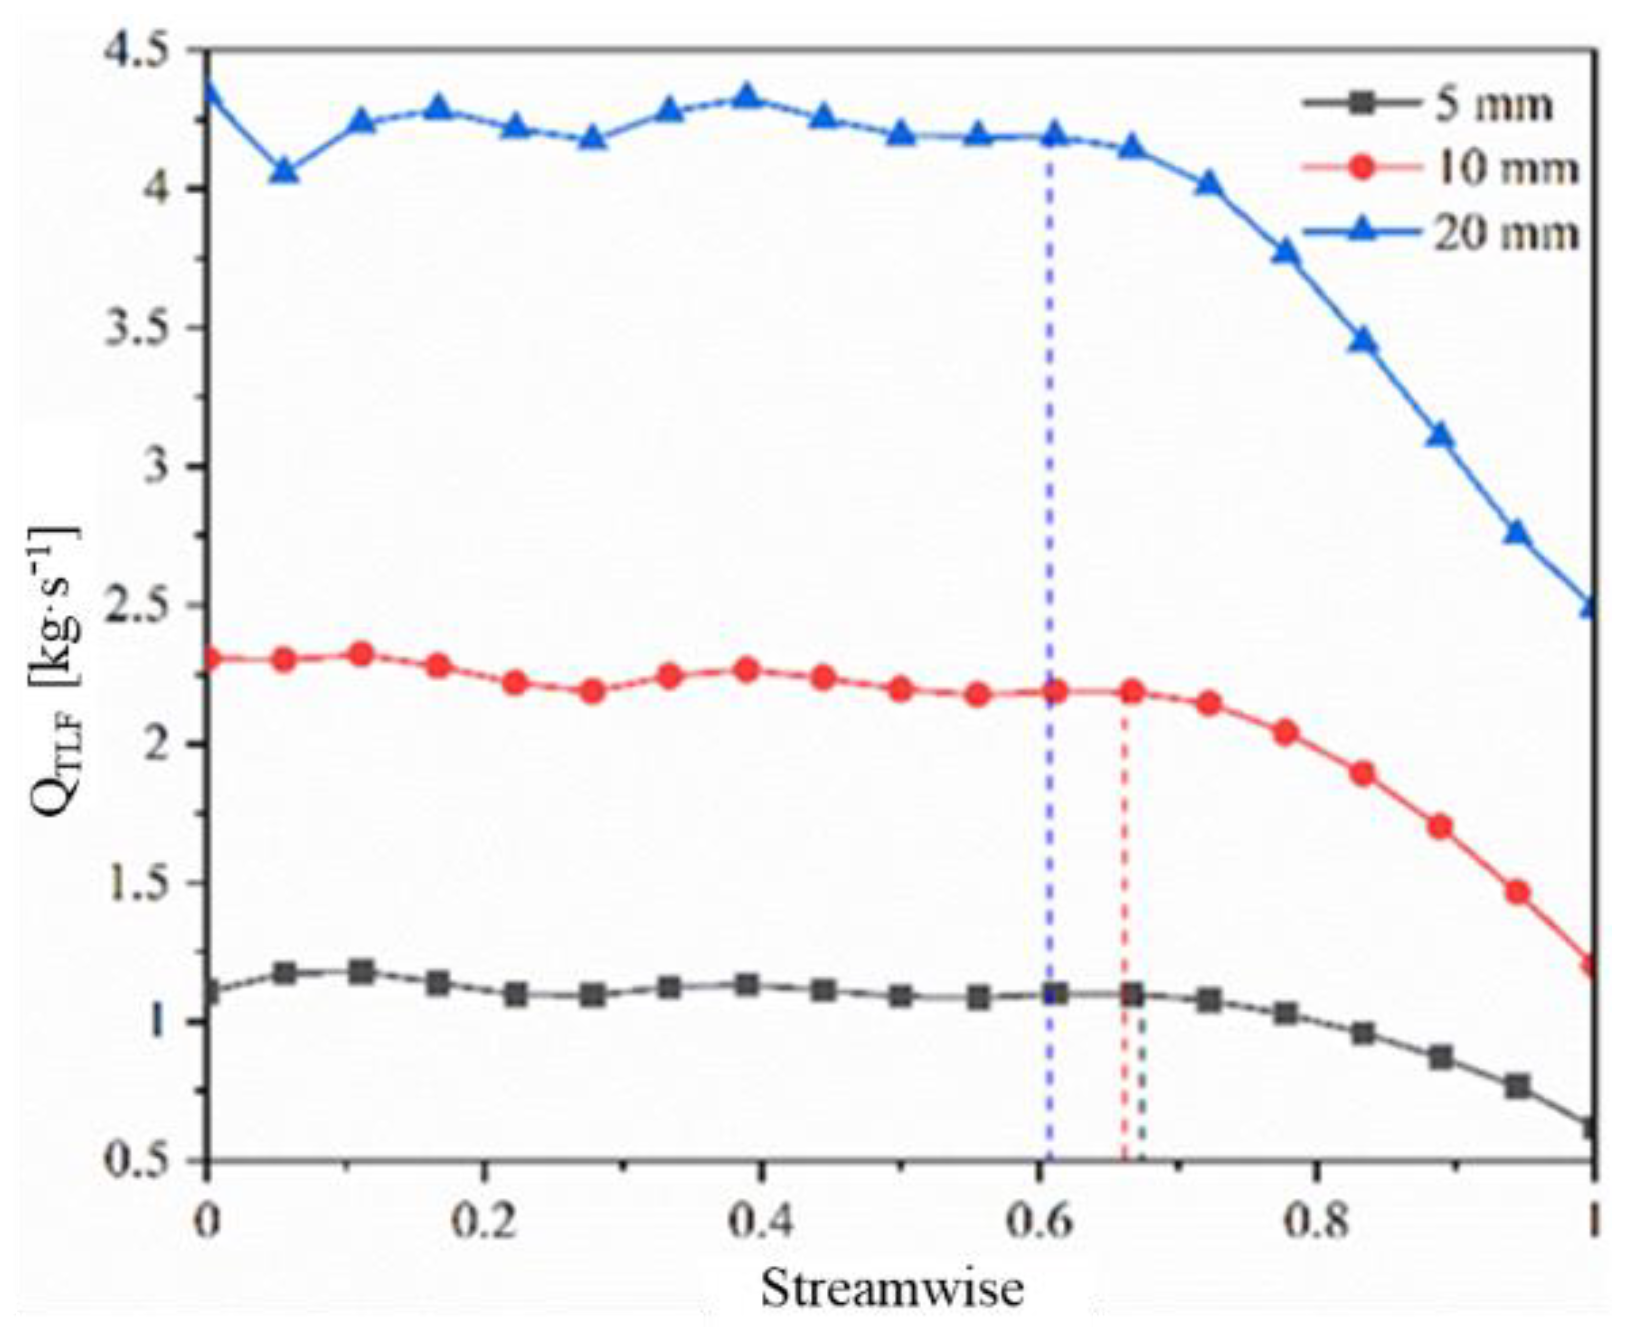
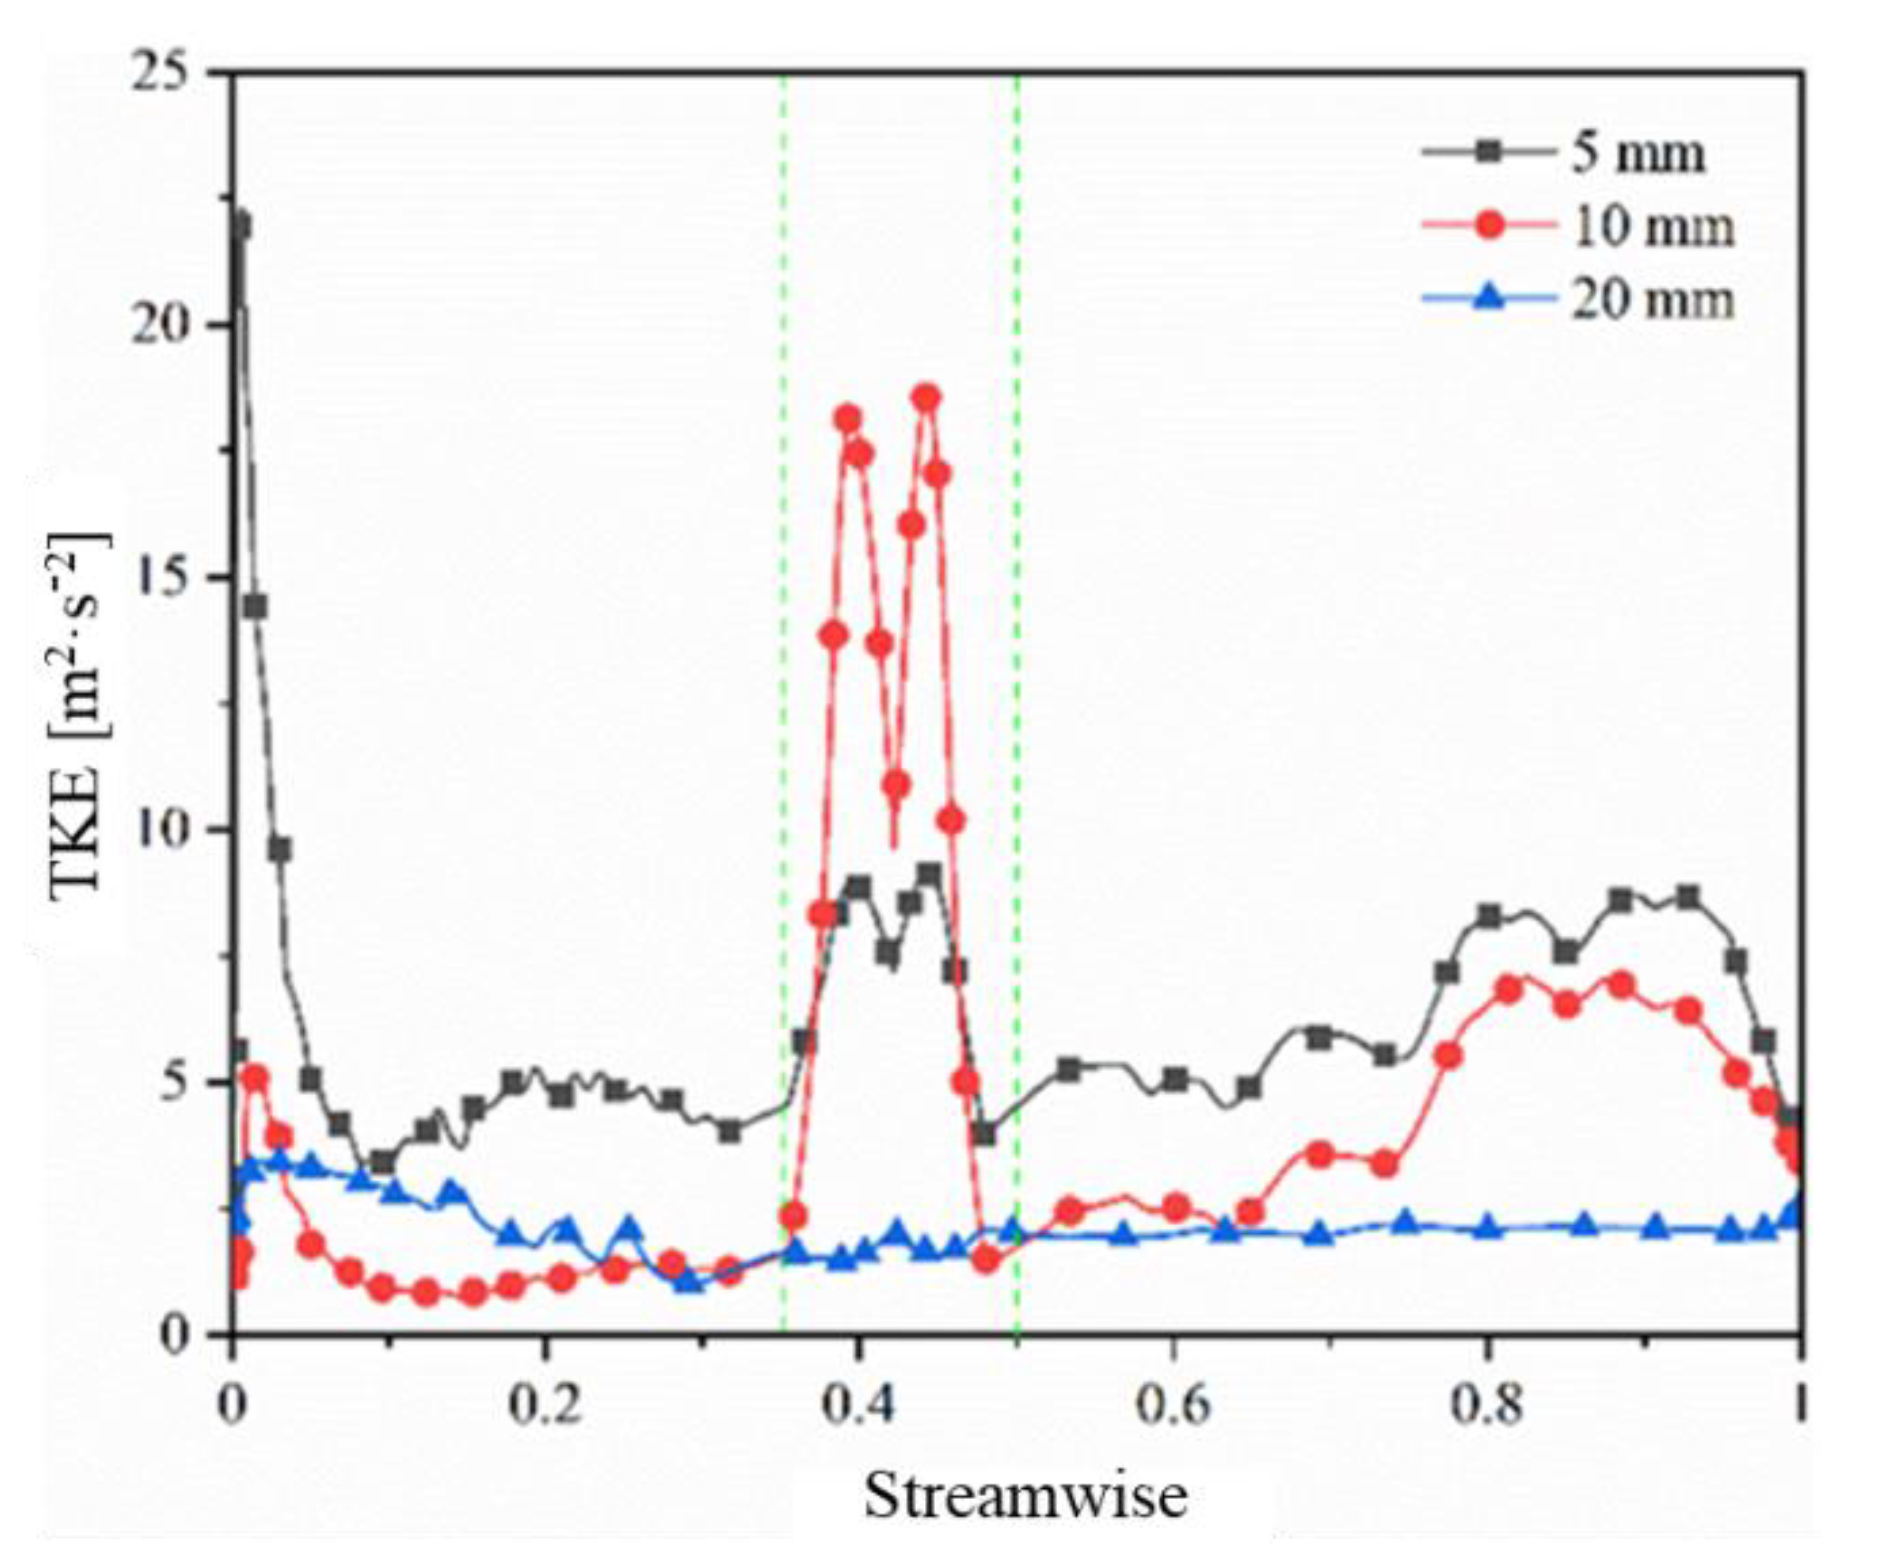
3.1.2. Leakage Velocity and Turbulent Kinetic Energy

The tip leakage flowed out from the suction side of the blade and then met with the main flow in the flow channel, interacting with each other to form a leakage vortex. The velocity of the leakage flow differs from that of the leakage vortex produced by the mainstream impact; therefore, the velocity of the leakage flow is also a vital index for measuring the TLV intensity. Figure 9 shows the velocity distribution of the leakage flow for different gaps. It can be seen that the leakage velocity decreases along the flow direction and increases with the increase in the gap, but there are differences in the velocity distribution at the leading edge, trailing edge, and middle position. Specifically, the maximum leakage velocity near the leading edge of the blade (the reason mentioned in Section 3.1.1) is due to the maximum pressure difference between the pressure side and suction side of the blade at the inlet position. Moreover, near the leading edge, the leakage flow velocity of small gap size (δ1 = 5 mm) is the largest, while that of large gap size (δ3 = 20 mm) is the smallest because, under certain pressure, the “jet” velocity increases with the gap size. The leakage velocity near the trailing edge of the blade is the smallest, and the gap size has little effect on the leakage velocity. This is because the flow in the flow channel tends to be stable along the flow direction, and the pressure difference between the two sides of the blade reaches the minimum, that is, the power source that produces the tip leakage flow is the weakest. Within the range 35–50% along the flow direction (within the green dotted line box in Figure 9), it can be clearly seen that the change in leakage velocity presents a trough shape and reaches a minimum value, which is inversely proportional to the gap size; that is, the larger the gap size, the smaller the leakage velocity. This phenomenon may be caused by the twisted blade structure. The curvature of the blade changes significantly near the range 35–50% along the flow direction, whereas the flow always follows the tangential direction of the blade. This leads to a greater tendency for the main flow to break away from the blade on the pressure side, thus reducing the leakage velocity accordingly. Overall, the distribution law of leakage velocity and the variation law of leakage volume are similar in that they always decrease along the flow direction. Figure 10 depicts the variation law of the turbulent kinetic energy of the leakage flow in the gap. Compared with the leakage velocity curve, it can be seen that the turbulent kinetic energy of the leakage flow is inversely proportional to the gap size, which is contrary to the change law of leakage velocity that the larger the gap size, the weaker the turbulent kinetic energy. Similarly, in the range 35–50% along the flow direction (within the green dotted line in Figure 10), the turbulent kinetic energy changes locally, and the maximum turbulent kinetic energy occurs in the 10 mm gap size. In addition, in the 20 mm gap size, the turbulent kinetic energy of the gap-flow changes almost linearly along the flow direction.

3.2. Tip Leakage Vortex Characteristics

The leakage flow in the tip clearance enters the impeller passage, interacts with the main flow, and finally evolves into a TLV, which complicates the flow pattern near the tip clearance. The Q criterion, proposed by Hunt et al. [28], defines a vortex as the region where the magnitude of the vortex is greater than the shear strain rate, which is also called the region where the second invariant of the velocity gradient tensor is positive. Compared with the vorticity criterion, it can identify the local low-pressure region more effectively. To show the vortex at the gap more accurately, this study uses the Q criterion to analyze the LTV structure and evolution law, and its expression is as follows:
Q = Ω 2 S 2 ,
where Ω is vorticity and S is the deformation rate tensor.

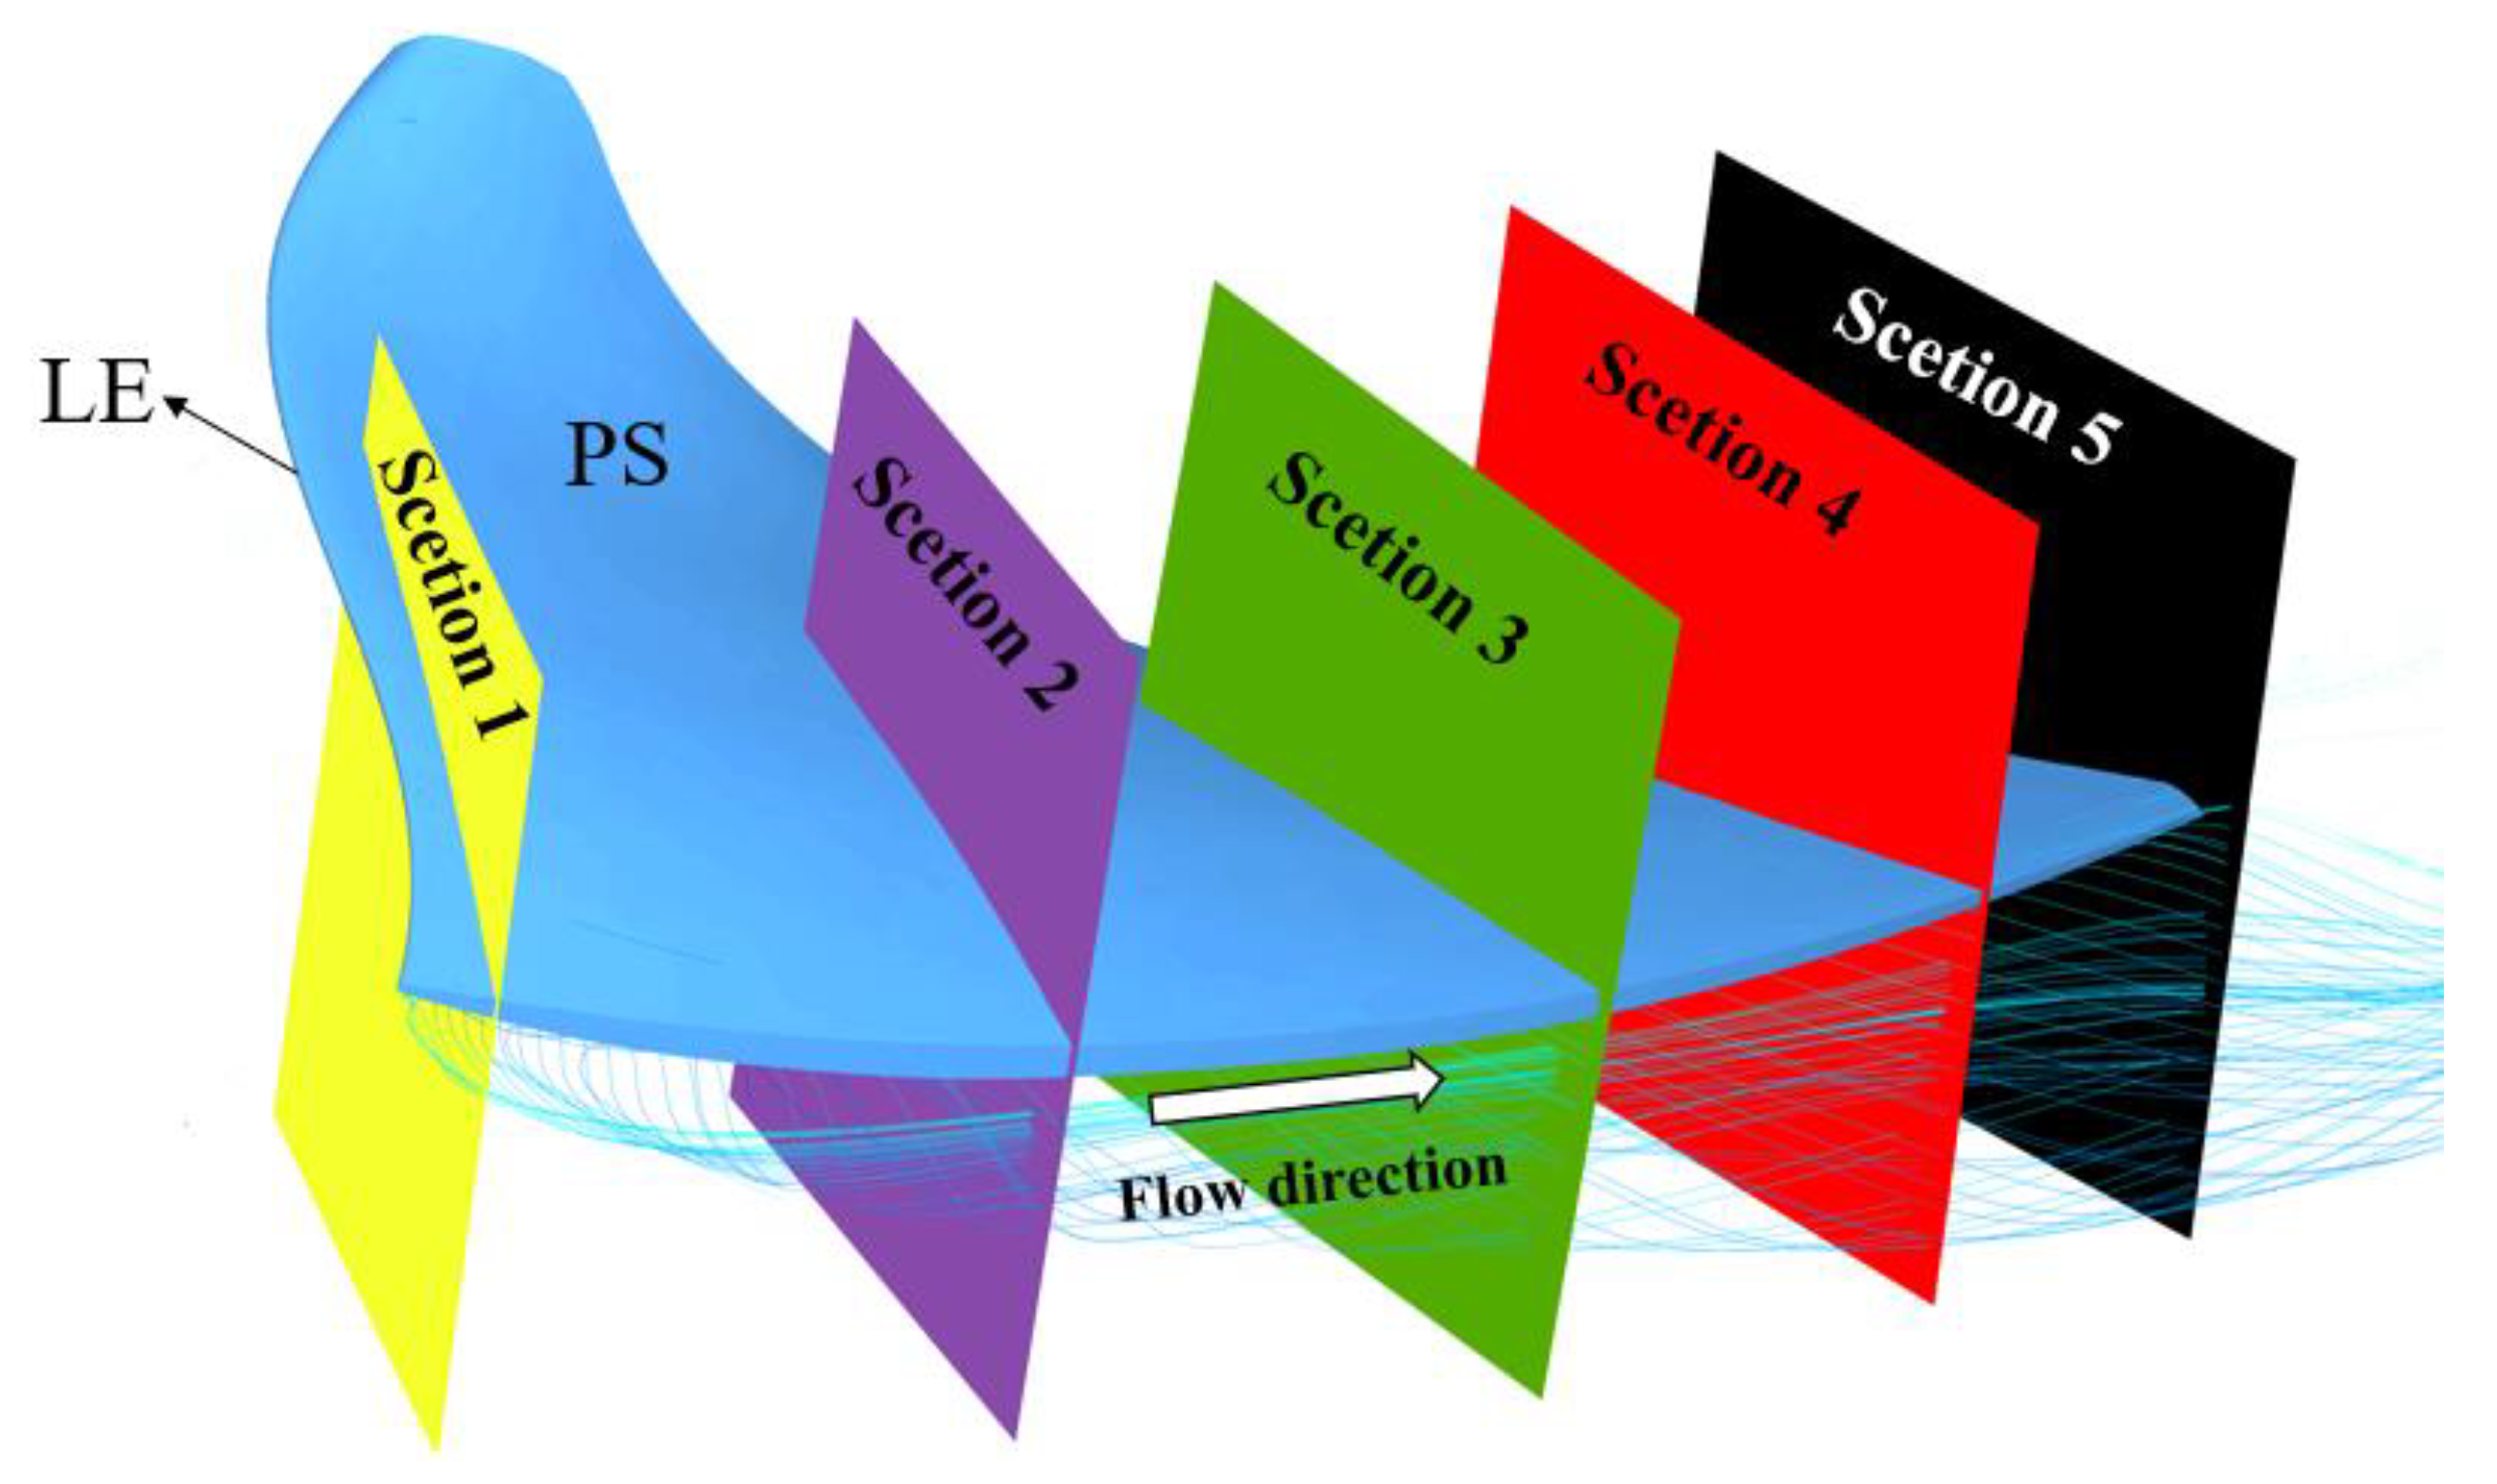
3.2.1. TLV Structure

Figure 11 shows a schematic of the TLV structure generated at the blade tip. It can be seen that TLV is generated at the leading edge (LE) of the blade tip, extends to the trailing edge (TE), and is mainly distributed on the suction side. The vortex on the suction side is divided into two parts, which are called the primary tip leakage vortex (PTLV) and secondary tip leakage vortex (STLV) by Tan et al. [5], corresponding to the green and blue parts in Figure 10. A continuous sheet STLV was attached to the suction side of the tip and extended from the leading edge to the trailing edge, while a columnar PTLV extended along the flow direction in the flow channel. In Figure 11, x represents the distance from the separation point of the PTLV on the suction side to the leading edge of the blade, and α represents the separation angle. Figure 12 shows the TLV distribution under the three tip clearances. It can be seen that when the clearance is δ1 = 5 mm, TLV is generated on both the pressure side) and the suction side and separated at the leading edge, and the distribution is consistent with that described in Figure 11. When the clearance increased to δ2 = 10 mm, the cylindrical vortex band on the suction side grew, and the separation point was still at the leading-edge position, but the separation angle α decreased. In addition, the STLV separates from the blade surface along the blade tip from the leading edge to the trailing edge under the clearance. When the gap was further increased to δ3 = 20 mm, the vortex band on the pressure side disappeared, while the columnar vortex band on the suction side continued to grow. The separation point shifts to x away from the leading edge of the blade, and the separation angle α further decreases. Under this gap, the STLV separates from the blade surface and exits in the flow passage. With an increase in the gap size, the leakage vortex intensity increases, and the vortex intensity decreases along the flow direction in a specific gap size. This can be explained by the axial momentum and leakage velocity mentioned earlier, that is, the axial momentum and velocity of the leakage flow decreases continuously along the flow direction, and the disturbance effect caused by the action of the main stream gradually weakens; thus, the strength of the leakage vortex decreases continuously.

3.2.2. TLV Strength under Different Gaps

It can be inferred from the above results that the tip clearance has a significant influence on the TLV under the rated flow conditions. To further study the evolution law of the TLV under different gap sizes, five sections perpendicular to the streamline were uniformly set along the flow direction from the leading to the trailing edge of the blade, as shown in Figure 13.
Figure 14 shows the distribution law of vortex intensity on five characteristic sections under three blade tip clearances. When the tip leakage flow enters the impeller runner, the flow velocity slows down and interacts with the main flow in the runner to form a TLV. The TLV was mainly distributed near the tip of the suction side and inside the runner, as shown by the dashed box in Figure 14, which corresponds to STLV and PTLV, shown in Figure 11. Furthermore, PTLV has two core areas in the flow channel, corresponding to the areas indicated by the two black dots, A and B in Figure 14. Overall, the leakage vortex intensity decreases along the flow direction, and the gap size is proportional to the leakage vortex intensity in the same section; that is, the leakage intensity is significant in the impeller structure with a large gap. From Section 1 to Section 5, the core area of the PTLV vortex decreases continuously, and the distance between Cores A and B and the blade tip increases, which evolves into the flow channel. The STLV extends along the inner wall of the runner chamber to the inside of the runner. The vortex core reaches its maximum in Section 3, decreases in Section 4, and effectively disappears in Section 5. In addition, it can be clearly seen that with the increase in the gap, Core A of PTLV gradually approaches the STLV and almost overlaps along the flow direction. In Section 1, that is, the inlet position, with the increase in clearance, PTLV approaches the suction side of the tip, while STLV gradually disappears. The reason for this phenomenon may be that at the inlet end, part of the high-pressure fluid directly enters the tip clearance without passing through the runner, and the local high-pressure zone formed by the high-pressure fluid flows with the pressure and suction side, respectively, which hinders the leakage flow from the pressure side to the suction side. Overall, with the increase in clearance, more leakage flows pass through the tip clearance, the leakage vortex becomes stronger, and the leakage vortex disturbs the inner flow of the runner more strongly, which makes the inner streamline of the runner chaotic, thereby increasing the pressure fluctuation in the runner.

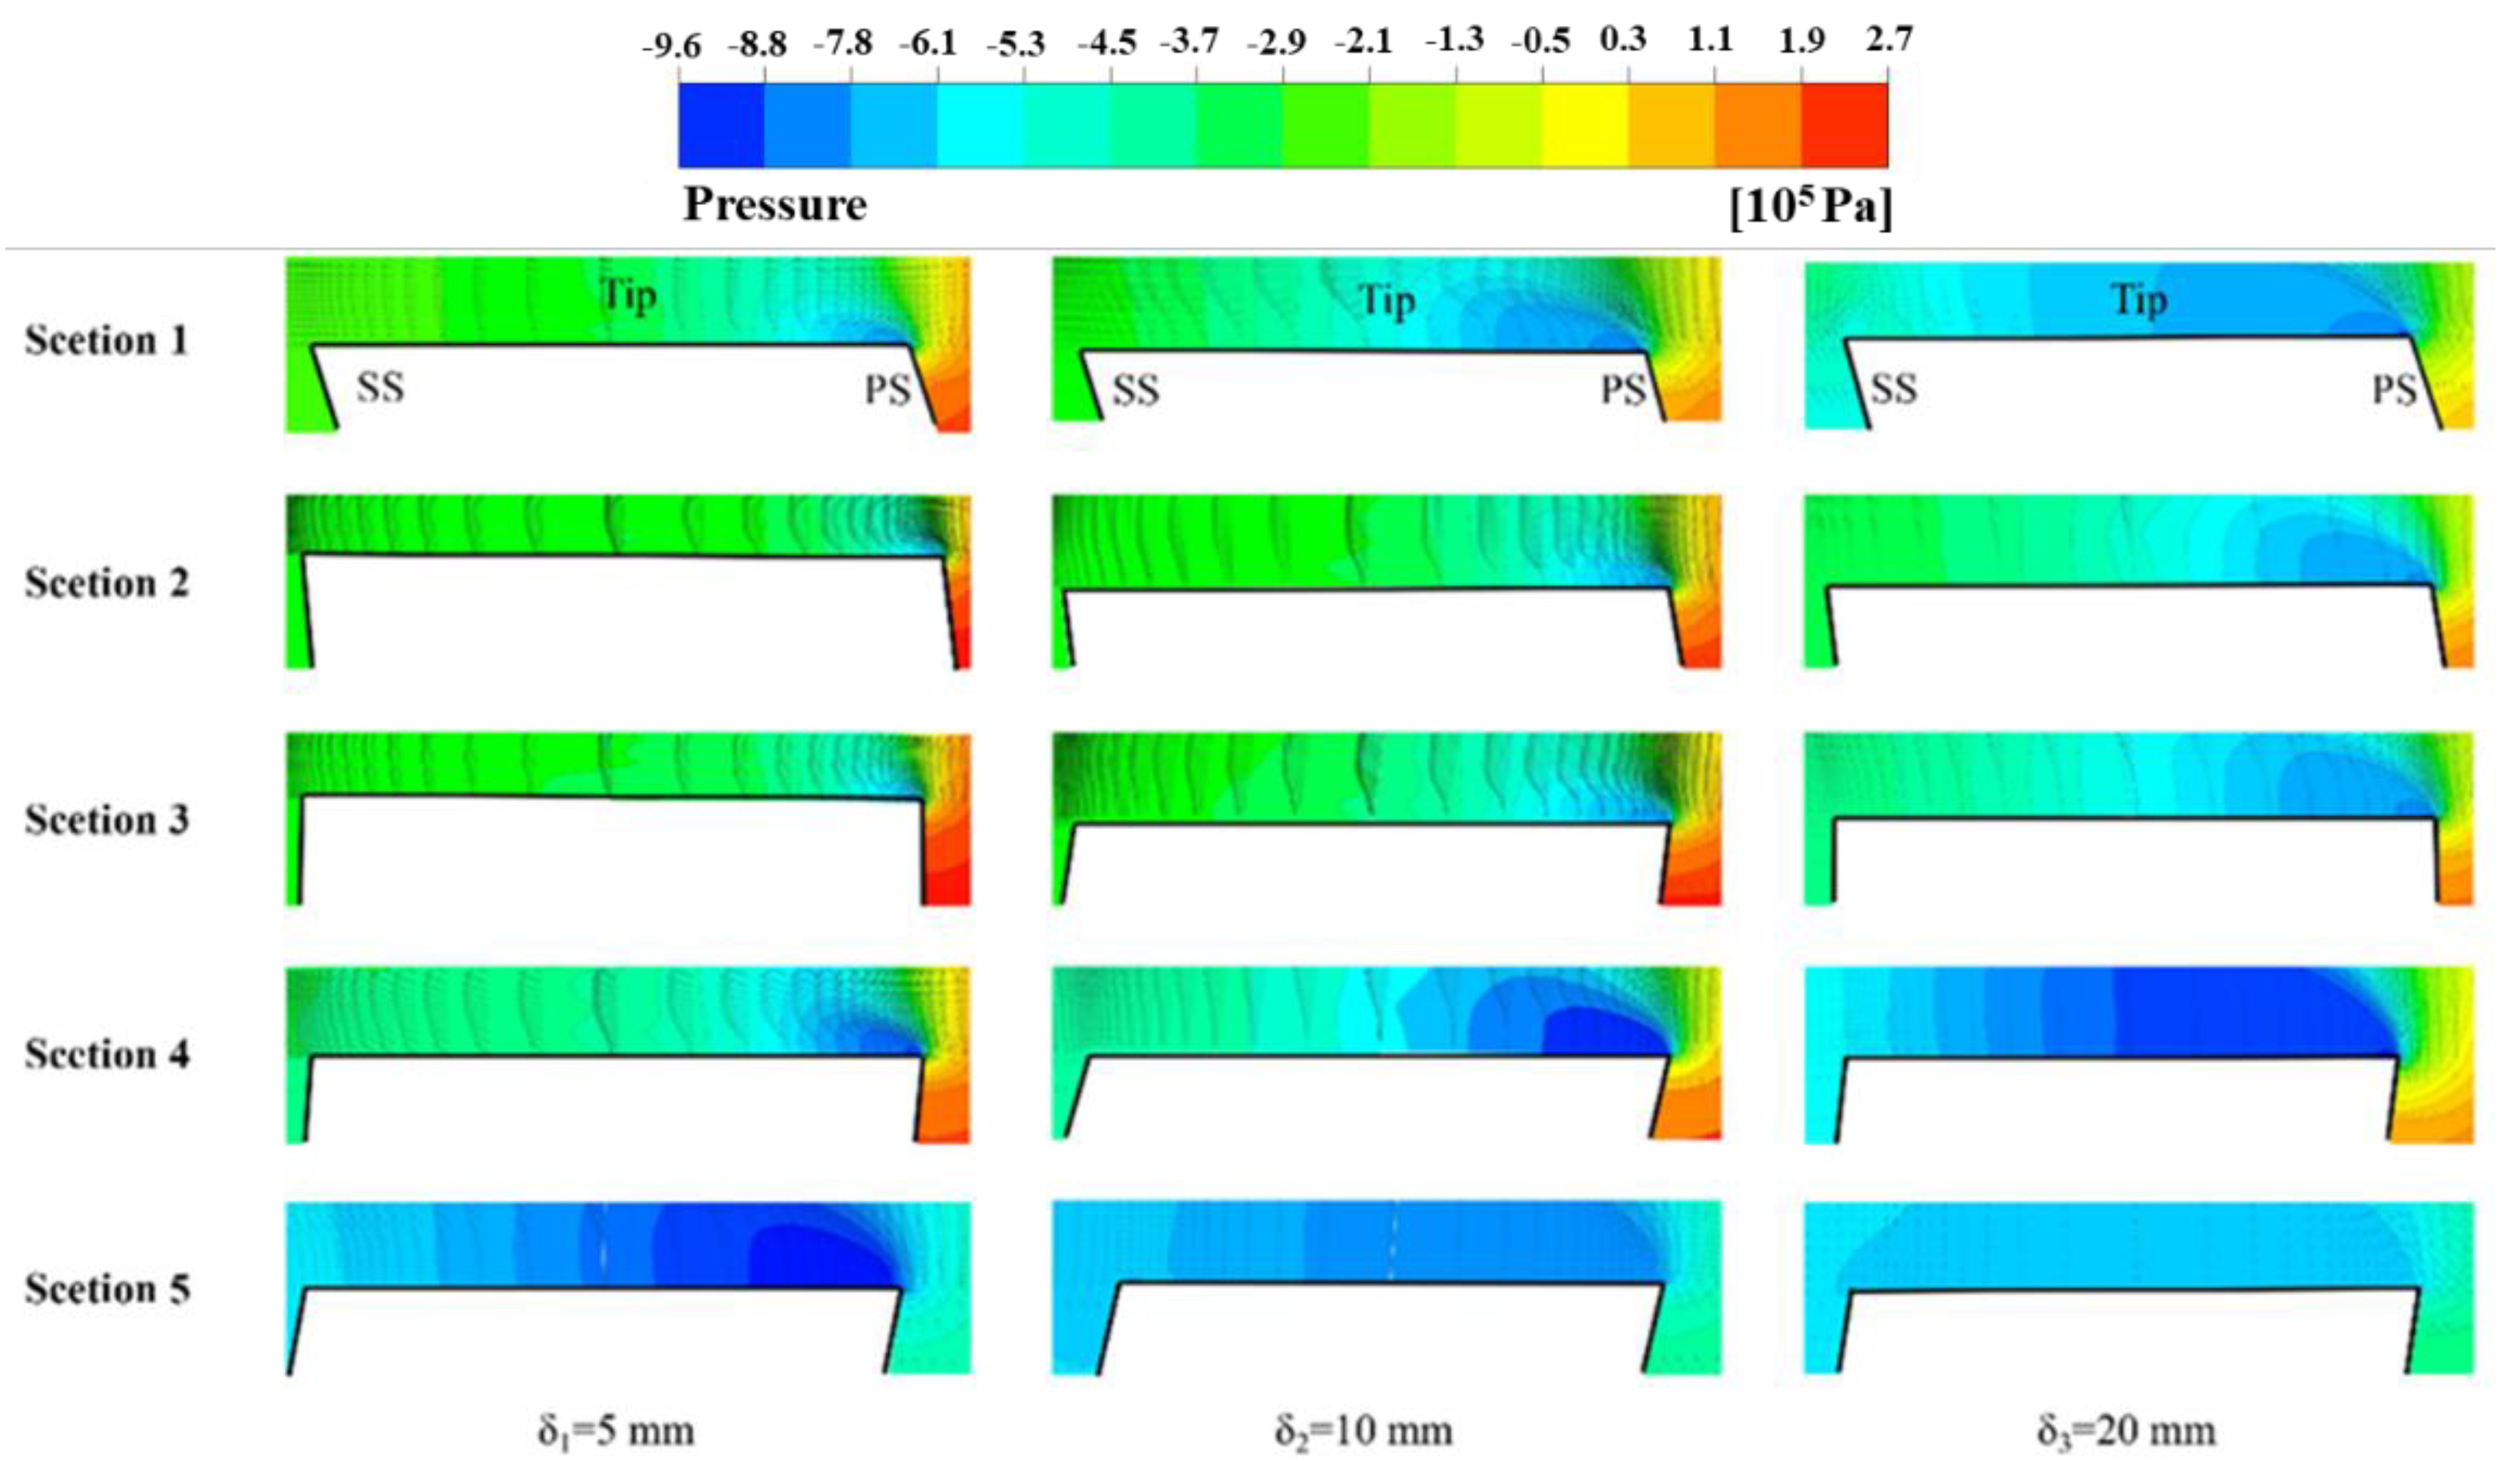
3.2.3. Flow Characteristics in Gaps

Figure 15 shows the pressure and velocity vector distribution nephograms of the flow field at different tip gaps under rated-flow conditions. Because there is a pressure difference between the pressure and suction side of the blade, the flow on the pressure side of the blade is pulled into the narrow channel and leaked. When the leakage flow enters the tip clearance, owing to the right-angle tip geometry, the flow separates at a right angle near the pressure side of the blade, resulting in a local low-pressure area near the pressure side in the clearance. In this area, the reverse pressure gradient reduces the velocity of the fluid particles near the separation point, and finally, the reverse flow of the fluid particles forms the tip separation vortex, which increases the possibility of cavitation in the clearance. To eliminate the corner separation vortex generated there, the tip of the pressure side can be rounded [29]. The leakage flow flows out of the gap channel on the suction side and interacts with the main flow to generate a leakage vortex. The influence of the gap on the TLV intensity has been analyzed in Section 3.2.2, so it is not repeated here. Along the flow direction, from Section 1 to Section 5, the proportion of the low-pressure area in the tip clearance near the blade pressure side gradually expands, and the separation vortex moves toward the blade suction side in the clearance. This expansion further enlarges the disturbance range to the surrounding basin, which explains the flow disorder in the tip clearance near the blade working face. In particular, the low-pressure zone in the gap in Section 5 fills half of the gap flow channel, and a large-scale flow separation occurs. With an increase in the tip clearance, the range of the low-pressure area near the pressure side in the same cross-section clearance increases, therefore, the large clearance structure is more likely to promote the generation of a separation vortex and complicate the flow in the flow and leakage channel. Considering the previous analysis of the TLV, the separation vortex in the gap and the leakage vortex in the flow passage can be effectively reduced by minimizing the tip clearance when the design conditions permit.

4. Conclusions

In this study, the SST kω turbulence model was used to study the leakage flow and leakage vortex characteristics of a low-head tubular turbine under the blade tip clearance. Based on the numerical results, the main conclusions are as follows:
(1)
The gap size is proportional to the axial momentum and flow rate of the leakage flow. With an increase in the gap size, both the axial momentum and leakage amount increase. The gap size is proportional to the leakage flow velocity and inversely proportional to the turbulent kinetic energy. The variation of velocity and turbulent kinetic energy at 35–50% of the flow direction shows the law of trough and peak, respectively.
(2)
The leakage vortex is divided into two parts: the PTLV and STLV. The vortex intensities of these two parts increase with an increase in clearance. However, for a large clearance structure (δ3 = 20 mm), the vortex core of the STLV overlaps with Core A of the PTLV, and Core B of the PTLV becomes the main part of the TLV.
(3)
The existence of the “right angle effect” of the blade tip causes the flow separation phenomenon near the pressure side of the blade tip, resulting in a local low-pressure zone, thus generating a local separation vortex at this position. With an increase in the clearance, the strength of the separation vortex also increased, which aggravated the flow instability.

Author Contributions

Conceptualization, B.Z. and Z.L.; writing—original draft preparation and methodology, X.L.; writing—review and editing, W.W.; supervision, Z.L. All authors have read and agreed to the published version of the manuscript.

Funding

This research was funded by the National Natural Science Foundation of China (Grant No. 52079118), National Key R&D Program of China (Grant No. 2018YFE0128500) and International Cooperation Project of Sichuan Science and Technology Department (Grant No. 2020YFH0135).

Institutional Review Board Statement

Not applicable.

Informed Consent Statement

Not applicable.

Data Availability Statement

Data from this study can be made available upon request.

Acknowledgments

The authors would like to thank all staff of the treatment plants for making the data available. Useful suggestions given by Rameshwar Adhikari from Applied Science and Technology Research Center, Tribhuvan University, Nepal.

Conflicts of Interest

The authors declare no conflict of interest.

References

  1. Weitemeyer, S.; Kleinhans, D.; Vogt, T.; Agert, C. Integration of renewable energy sources in future power systems: The role of storage. Renw. Energy 2015, 75, 14–20. [Google Scholar] [CrossRef] [Green Version]
  2. Guney, M.S. Solar power and application methods. Renew. Sustain. Energy Rev. 2016, 57, 776–785. [Google Scholar] [CrossRef]
  3. Giannuzzi, A.; Diolaiti, E.; Lombini, M.; Rosa, A.; Marano, B. Enhancing the efficiency of solar concentrators by controlled optical aberrations: Method and photovoltaic application. Appl. Energy 2015, 145, 211–222. [Google Scholar] [CrossRef]
  4. Yang, C.X.; Lu, M.T.; Zheng, Y.; Tian, Q.X.; Zhang, Y.Q. Inlet passage’s development and optimization of new tidal unit-shaft tubular turbine. Appl. Mech. Mater. 2014, 607, 312–316. [Google Scholar] [CrossRef]
  5. Liu, Y.B.; Han, Y.D.; Tan, L.; Wang, Y.M. Blade rotation angle on energy performance and tip leakage vortex in a mixed flow pump as turbine at pump mode. Energy 2020, 206, 118084. [Google Scholar] [CrossRef]
  6. Chang, X.L.; Liu, X.H.; Zhou, W. Hydropower in China at present and its further development. Energy 2010, 35, 4400–4406. [Google Scholar] [CrossRef]
  7. Elbatran, A.H.; Yaakob, O.B.; Ahmed, Y.M.; Shabara, H.M. Operation, performance and economic analysis of low head micro-hydropower turbines for rural and remote areas: A review. Renew. Sustain. Energy Rev. 2015, 43, 40–50. [Google Scholar] [CrossRef]
  8. Behrouzi, F.; Nakisa, M.; Maimun, A.; Ahmed, Y.M. Global renewable energy and its potential in Malaysia: A review of Hydrokinetic turbine technology. Renew. Sustain. Energy Rev. 2016, 62, 1270–1281. [Google Scholar] [CrossRef]
  9. Kramer, M.; Wieprecht, S.; Terheiden, K. Minimizing the air demand of micro-hydro impulse turbines in counter pressure operation. Energy 2017, 133, 1027–1034. [Google Scholar] [CrossRef]
  10. Denton, J.D. The 1993 IGTI scholar lecture: Loss mechanisms in turbomachines. Turbomach 1993, 115, 621–656. [Google Scholar] [CrossRef]
  11. Thapa, B.S.; Dahlhaug, O.G.; Thapa, B. Sediment erosion induced leakage flow from guide vane clearance gap in a low specific speed Francis turbine. Renew. Energy 2017, 107, 253–261. [Google Scholar] [CrossRef]
  12. You, D.H.; Wang, M.; Moin, P.; Mittal, R. Vortex dynamics and low-pressure fluctuations in the tip-clearance flow. Fluids Eng. 2007, 129, 1002–1014. [Google Scholar] [CrossRef]
  13. Cheng, H.Y.; Bai, X.B.; Long, X.P.; Ji, B.; Peng, X.X.; Farhat, M. Large Eddy Simulation of the Tip-leakage Cavitating flow with an insight on how cavitation influences vorticity and turbulence. Appl. Math. Model. 2019, 77, 788–809. [Google Scholar] [CrossRef]
  14. Shi, L.; Zhang, D.S.; Zhao, R.J.; Shi, W.D.; Jin, Y.X. Effect of blade tip geometry on tip leakage vortex dynamics and cavitation pattern in axial-flow pump. Sci. China Technol. Sci. 2017, 60, 1480–1493. [Google Scholar] [CrossRef]
  15. Guo, Q.; Zhou, L.; Wang, Z. Numerical evaluation of the clearance geometries effect on the flow field and performance of a hydrofoil. Renew. Energy 2016, 99, 390–397. [Google Scholar] [CrossRef]
  16. Liu, Y.B.; Tan, L. Influence of C groove on suppressing vortex and cavitation for a NACA0009 hydrofoil with tip clearance in tidal energy. Renew. Energy 2020, 148, 907–922. [Google Scholar] [CrossRef]
  17. Taha, Z.; Sugiyono; Tuan Ya, T.M.Y.S.; Sawada, T. Numerical investigation on the performance of Wells turbine with non-uniform tip clearance for wave energy conversion. Appl. Ocean Res. 2011, 33, 321–331. [Google Scholar] [CrossRef]
  18. Guénette, V.; Houde, S.; Ciocan, D.; Dumas, J.; Deschênes, C. Numerical prediction of a bulb turbine performance hill chart through RANS simulations. IOP Conf. Ser. Earth Environ. Sci. 2012, 15, 032007. [Google Scholar] [CrossRef]
  19. Zhang, D.S.; Shi, W.D.; Wu, S.Q.; Pan, D.Z. Numerical and experimental investigation of tip leakage vortex trajectory and dynamics in an axial flow pump. Comput. Fluids 2013, 112, 61–71. [Google Scholar] [CrossRef]
  20. Xiao, X.W.; McCarter, A.A.; Lakshminarayana, B. Tip Clearance Effects in a Turbine Rotor: Part I—Pressure Field and Loss. J. Turbomach. 2001, 123, 296–304. [Google Scholar] [CrossRef]
  21. Lemay, S.; Aeschlimann, V.; Fraser, R.; Ciocan, G.D.; Deschenes, C. Velocity field investigation inside a bulb turbine runner using endoscopic PIV measurements. Exp. Fluids 2015, 56, 120. [Google Scholar] [CrossRef]
  22. Shi, G.T.; Liu, Z.K.; Xiao, Y.X.; Yang, H.; Li, H.L.; Liu, X.B. Effect of the inlet gas void fraction on the tip leakage vortex in a multiphase pump. Renew. Energy 2020, 150, 46–57. [Google Scholar] [CrossRef]
  23. Menter, F.R.; Rumsey, C.L. Assessment of Two-Equation Turbulence Models for Transonic Flows. AIAA 1994, 94, 2343. [Google Scholar]
  24. Ding, A.; Ren, X.; Li, X.; Gu, C. Numerical investigation of turbulence models for a superlaminar journal bearing. Adv. Tribol. 2018, 2018, 2841303. [Google Scholar] [CrossRef] [Green Version]
  25. Erler, E.; Vo, H.D.; Yu, H. Desensitization of axial compressor performance and stability to tip clearance zize. J. Turbomach. 2015, 138, 031006. [Google Scholar] [CrossRef]
  26. Menter, F.R. Review of the shear-stress transport turbulence model experience from an industrial perspective. Int. J. Comput. Fluid Dyn. 2009, 23, 305–316. [Google Scholar] [CrossRef]
  27. Han, Y.D.; Tan, L. Influence of rotating speed on tip leakage vortex in a mixed flow pump as turbine at pump mode. Renew. Energy 2020, 162, 144–150. [Google Scholar] [CrossRef]
  28. Hunt, J.C.R.; Wray, A.A.; Moin, P. Eddies, streams, and convergence zones in turbulent flows. Stud. Turbul. Using Numer. Simul. Databases 1988, 1, 193–208. [Google Scholar]
  29. Laborde, R.; Chantrel, P.; Mory, M. Tip clearance and tip vortex cavitation in an axial flow pump. J. Fluids Eng. 1997, 119, 680–685. [Google Scholar] [CrossRef]
Figure 1. Clearance between blade tip and shroud.
Processes 09 01481 g001
Figure 2. Schematic of full channel of tubular turbine.
Processes 09 01481 g002
Figure 3. Computational domain grid.
Processes 09 01481 g003
Figure 4. Grid independence verification.
Processes 09 01481 g004
Figure 5. y+ distribution on blade and guide vane surface.
Processes 09 01481 g005
Figure 6. Interface between overcurrent components.
Processes 09 01481 g006
Figure 7. Axial momentum of leakage flow.
Processes 09 01481 g007
Figure 8. Leakage flow.
Processes 09 01481 g008
Figure 9. Leakage speed.
Processes 09 01481 g009
Figure 10. Turbulent kinetic energy of leakage flow.
Processes 09 01481 g010
Figure 11. TLV structure diagram.
Processes 09 01481 g011
Figure 12. TLV structure under different gaps.
Processes 09 01481 g012aProcesses 09 01481 g012b
Figure 13. Schematic cross-sectional view along the flow direction.
Processes 09 01481 g013
Figure 14. Vortex intensity distribution at each section under different gaps.
Processes 09 01481 g014
Figure 15. Vector distribution of pressure and velocity in gap.
Processes 09 01481 g015
Table 1. Main design parameters of research objects.
ParameterUnitValue
Rated speed (Nr)r/min68.18
Rated flow (Qr)m3/s375.2
Maximum head (Hmax)m11
Minimum head (Hmin)m2.6
Rated head (Hr)m7.8
Runner diameter (D1)m7.25
Blade (Z)4
Guide vane (Z0)16
Publisher’s Note: MDPI stays neutral with regard to jurisdictional claims in published maps and institutional affiliations.

