1. Introduction
The ironmaking blast furnace (BF) is responsible for 73% of pig iron production in North America and represents the largest consumer of energy in the entire mill [
1]. Given the scale of the operation, minor improvements in the efficiency of the BF can result in significant reductions in operating expenses and carbon emissions. The BF is a counter-current packed bed chemical reactor, where iron ore and coke are charged into the top of the furnace in alternating layers, with the heated air—known as hot blast (HB)—and any auxiliary fuels—such as natural gas (NG) or pulverized coal (PCI)—are blown into the furnace through ports known as tuyeres. The hot blast forms a void space in the coke bed surrounding the tuyeres known as the raceway through the combination of HB gas momentum displacing coke and coke consumption in reactions with HB-supplied oxygen.
One of the earliest techniques developed to reduce the amount of coke needed to process iron ore was the introduction of hot blast. Heating the blast supplies additional sensible heat to the furnace to fuel reduction reactions, reducing the need for coke combustion to supply energy. Later developments included the introduction of auxiliary fuels injected through the tuyeres, supplementing the reducing gas generated by coke combustion with alternative forms of carbon and hydrogen. This alternate supply of reducing gases can reduce the amount of coke required to smelt the iron ore; however, it also influences BF operation in key ways, including by altering the reaction kinetics in the shaft region. The introduction of hydrogen gas in addition to carbon monoxide, for instance, can improve productivity in the furnace [
2].
In North America, NG injection has seen wide adoption due the low fuel cost and ease of handling compared with PCI injection. This has the benefit of increasing the amount of hydrogen in the BF, thus reducing the overall emissions of CO
2 when compared against a PCI or coke only furnace. One significant limitation to the injection of NG is the quenching effect that it has on gas temperatures in the raceway, commonly defined by the Raceway Adiabatic Flame Temperature (RAFT). This quenching is typically countered by increasing the oxygen enrichment in the hot blast to raise the RAFT again [
3]. This, however, presents its own set of issues, as increasing oxygen enrichment lowers the top gas temperature (TGT). Additionally, for a furnace operating at high natural gas injection rates, the limited gas residence time in the raceway can result in the inability to combust all injected NG. This un-combusted fuel then enters the coke bed and decomposes into carbon and hydrogen in a high-temperature and low-oxygen environment, further quenching gas temperatures.
These competing factors limit the range of potentially viable operating conditions defining what will be referred to in this work as the ‘operating window.’ This window represents the range of possible combinations of injected fuel rates and oxygen enrichment levels that will satisfy the limitations of RAFT and TGT under a particular set of wind conditions. As the injection rate of auxiliary fuels increases, temperatures in the raceway will decrease due to quenching effects. This is typically countered by an increase in hot blast oxygen which will boost raceway temperatures at the expense of lowering top gas temperatures.
Devising new methods to expand the operating window would provide blast furnace operators with a wider range of potential operating conditions and more flexible operation, potentially reducing operating costs. One of the most common existing methods used to expand the operating window is to increase the supply of sensible heat to the furnace, usually in the form of increasing hot blast temperature (HBT). However, many industrial furnaces already operate at their maximum possible HBT with their existing hot stove designs. One potential method of increasing the sensible heat entering the furnace is to preheat the natural gas prior to injection. This would have the additional benefit of decreasing the density of the natural gas, resulting in higher injection velocities, which would in turn lead to improved mixing and combustion, and potentially improved heat release [
4,
5,
6].
Due to the high velocities in the tuyere and raceway region, the residence time for injected fuels is limited. When the plume of gaseous fuel reaches the coke bed it decomposes due to the high temperature, depositing soot and releasing H
2, which is an endothermic reaction for NG. This phenomenon is partially responsible for the quenching effect caused by NG injection [
6].
A theoretical limit on the feasibility of natural gas preheating is reached at an injection temperature of approximately 900 °C due to the likelihood of inducing gas cracking and the subsequent deposition of carbon in the heat exchangers and supply lines [
7]. One potential method to overcome this is to pre-combust the natural gas or other potential feedstock gases to create syngas. This resulting hot mixture (which primarily consists of CO and H
2) can then be injected into the BF. Syngas injection also serves to address the issue of low residence time in the raceway, as a syngas generation reactor would allow for sufficient residence time to allow the near complete combustion of the feedstock.
Given the increasing prevalence of carbon taxes and additional regulations on carbon emission which may be imposed in attempts to control climate change, there is growing industrial interest in the injection of hydrogen-rich fuels into the BF. Typically, in a modern BF, hydrogen only enters as water vapor in the HB either from ambient humidity, or from steam injection, or from the injected fuels. Thyssenkrupp in Germany has already began operating a BF only using hydrogen as the injected fuel to reduce carbon emissions, with all of the CO in the furnace generated by coke combustion in the raceway [
8]. Similarly, syngas injection would adjust the balance of H
2 to carbon in the injected fuel, resulting in a similar, if less pronounced, impact on the H
2/CO ratio in the bosh gas. While syngas injection still introduces additional carbon to the furnace, it represents a more moderate step that may be easier to control and implement for standard blast furnace operations which currently utilize NG as an injected fuel.
Blast furnace modeling and research techniques fall into four broad categories, namely experimentation with full size industrial furnaces; experimentation with small-scale furnaces; heat and mass balance models; and finally, computational fluid dynamics (CFD). Experimentation with industrial furnaces is an expensive and potentially dangerous process that can interfere with the normal operation of the furnace and potentially cause periods of decreased productivity—for this reason, it is rarely used today. Small-scale experimental furnaces are cheaper than full-scale furnaces, but are still expensive when compared with the two modeling methods. Experimental furnaces also suffer from some issues with scaling results due to larger furnaces due to their smaller size, and reduced output. Heat and mass balance models have long been the staple method of BF analysis, as they are computationally simple and can provide insight into the overall thermodynamic behavior of the furnace [
9]. These models must make assumptions about the efficiency of certain reactions and certain chemical equilibriums thorough the furnace. Because of this, certain data from actual operation are needed to calculate accurate predictions; however, with operational furnaces for which historic data are available, heat and mass balance models are useful for online control due to their speed.
CFD presents a method of capturing more complicated physics than the simple heat and mass balance models at the cost of increased model complexity, increased computational expense, and increased solution time. This limits the applicability of CFD for online control applications but makes it a valuable tool for investigating potential changes to BF operation that would be prohibitively expensive, or geometry changes that would require significant rebuilding efforts [
10,
11,
12,
13,
14,
15,
16,
17,
18]. Because of this added complexity over simple heat and mass balance models, better details of the internal state, and the reaction pathways that lead there can be evaluated. CFD also allows the prediction of other flow phenomena not captured in heat and mass balance models, such as the migration of high temperature regions.
Work previously undertaken at CIVS has led to the development of validated CFD models that permit the exploration of impacts in the furnace from the tuyere through the shaft region. Details of this modeling work have previously been published [
6,
18,
19,
20,
21,
22,
23,
24,
25,
26,
27,
28,
29,
30,
31,
32,
33,
34,
35]. Previous work has indicated the potential for natural gas preheating as a potential method to reduce the coke rate of the blast furnace [
4,
5,
6].
2. Methodology, Operating Conditions, and Geometry
To limit the number of operating conditions that could be varied, as well as to focus on modern BF design and reduce reliance on carbon in the iron making process, a natural gas-only furnace was chosen for this work. The Stelco Lake Erie Works (LEW) furnace is located on the north shore of Lake Erie. Constructed in 1980 and relined in 2020, it is a typically sized blast furnace, only utilizing NG as its injected auxiliary fuel. This study focuses on the impacts of syngas use in a single-lance operation at similar mass flow rates to allow for a direct comparison between NG and syngas injection.
Four sub-models were utilized in this study, namely a kinetics-based model for estimating the temperature and composition of syngas generated via various ratios of oxygen and feedstock gases; a CFD model using ANSYS Fluent to simulate hot blast and injected fuel combustion in the BF tuyere; an in-house CFD model to simulate combustion and chemical reactions in the BF raceway; and an in-house CFD model to simulate reduction reactions, cohesive zone formation, and outputs such as coke rate in the BF shaft. The syngas model provides syngas properties to be used as boundary conditions for the tuyere CFD model. Similarly, the tuyere CFD model provides gas temperature and species distributions to be used as inlet boundary conditions for the raceway CFD model, and the raceway model provides this information to be used as inlet boundary conditions for the shaft CFD model.
Figure 1 indicates the flow of information between these four models in this research, and further description of these models is provided in the sections below.
3. Syngas Reactor Modeling
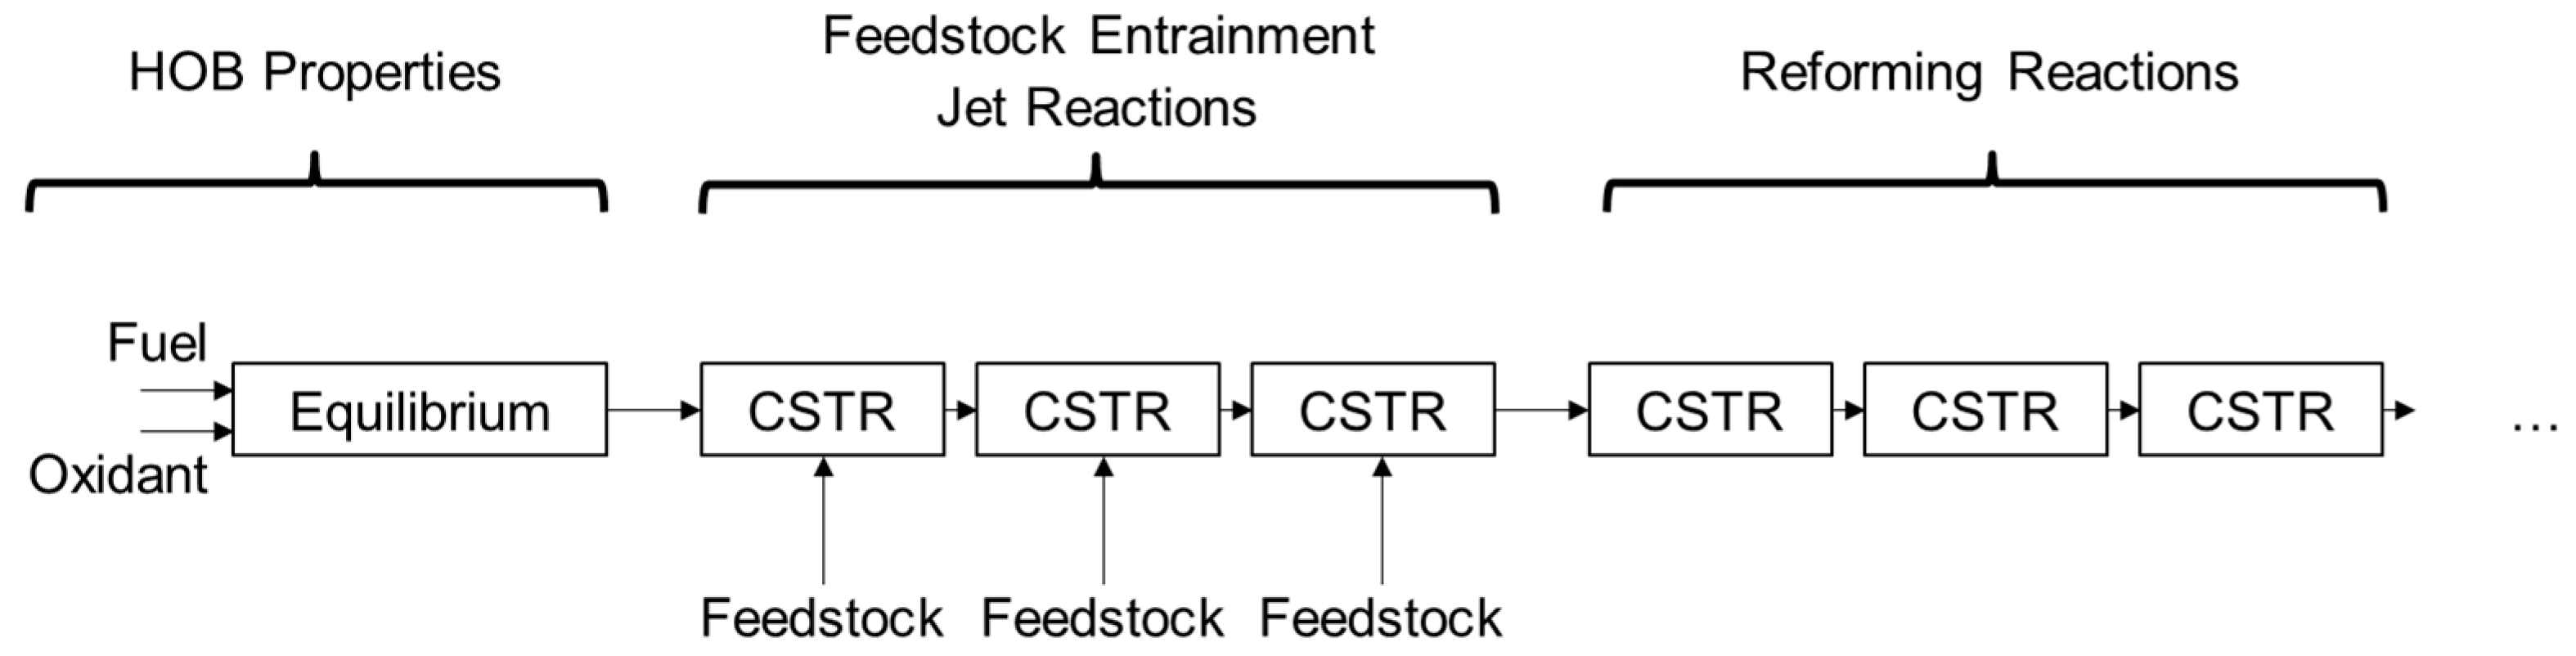
Linde’s hot oxygen burner (HOB) is a proprietary technology that generates hot oxygen by combusting a small amount of fuel with an excess of oxygen (
Figure 2). This hot gas is then accelerated through a nozzle to generate a highly reactive, high momentum jet. The hot oxygen jet can be used to gasify hydrocarbon feedstocks (for example, natural gas) to generate syngas or to provide further reforming in syngas streams containing tars or other hydrocarbons [
36]. The ratio of feedstock and oxygen are adjusted to generate syngas of varying composition and temperature.
A kinetically based model was developed to estimate the syngas temperature and composition generated from gaseous fuels such as natural gas, coke oven gas and tar and hydrocarbon laden syngas streams derived from various biomass sources. The results of this model were experimentally validated using data from lab and pilot scale HOB systems. The model separates the physical system into three processes and integrates them together in a reactor network model.
The following details the general functionality of the model:
Hot oxygen jet properties such as temperature and composition are predicted assuming equilibrium conditions.
Feedstock entrainment into the hot jet is predicted using standard free jet correlations corrected for heat release [
37]:
Assumes the entrainment rate is constant with axial distance;
A series of continuously stirred reactors (CSTRs, also commonly referred to as perfectly stirred reactors) is used to mix the feedstock into the jet. Each jet reactor in the model accepts the same amount of feedstock.
1D—all jet material and feedstock are perfectly mixed in the reactor
The partial oxidation (POx) reactor is represented by another series of CSTRs to allow reforming reactions to continue to the correct residence time.
The following assumptions apply to both the Jet Entrainment and the Reforming Reaction portions of the model:
The GRI-Mech 3.0 mechanism (developed by the Gas Research Institute) for describing the chemical reactions in natural gas combustion was used for detailed kinetics: 354 reactions and 53 species were considered, and no adjustment of mechanism was performed to fit the data;
Entrainment and reaction modeling do not rely on equilibrium or the approach to equilibrium methods.
The model produces reactor profile information such as flowrate, composition, temperature, etc. The model was run for several potential operating parameters to generate syngas compositions and exit temperature data from the different feedstocks used. Natural gas and coke oven gas were used as the feedstocks for the purpose of this study. The syngas compositions generated at varying feedstock to oxygen ratios were then fed to the blast furnace model as a tuyere injectant.
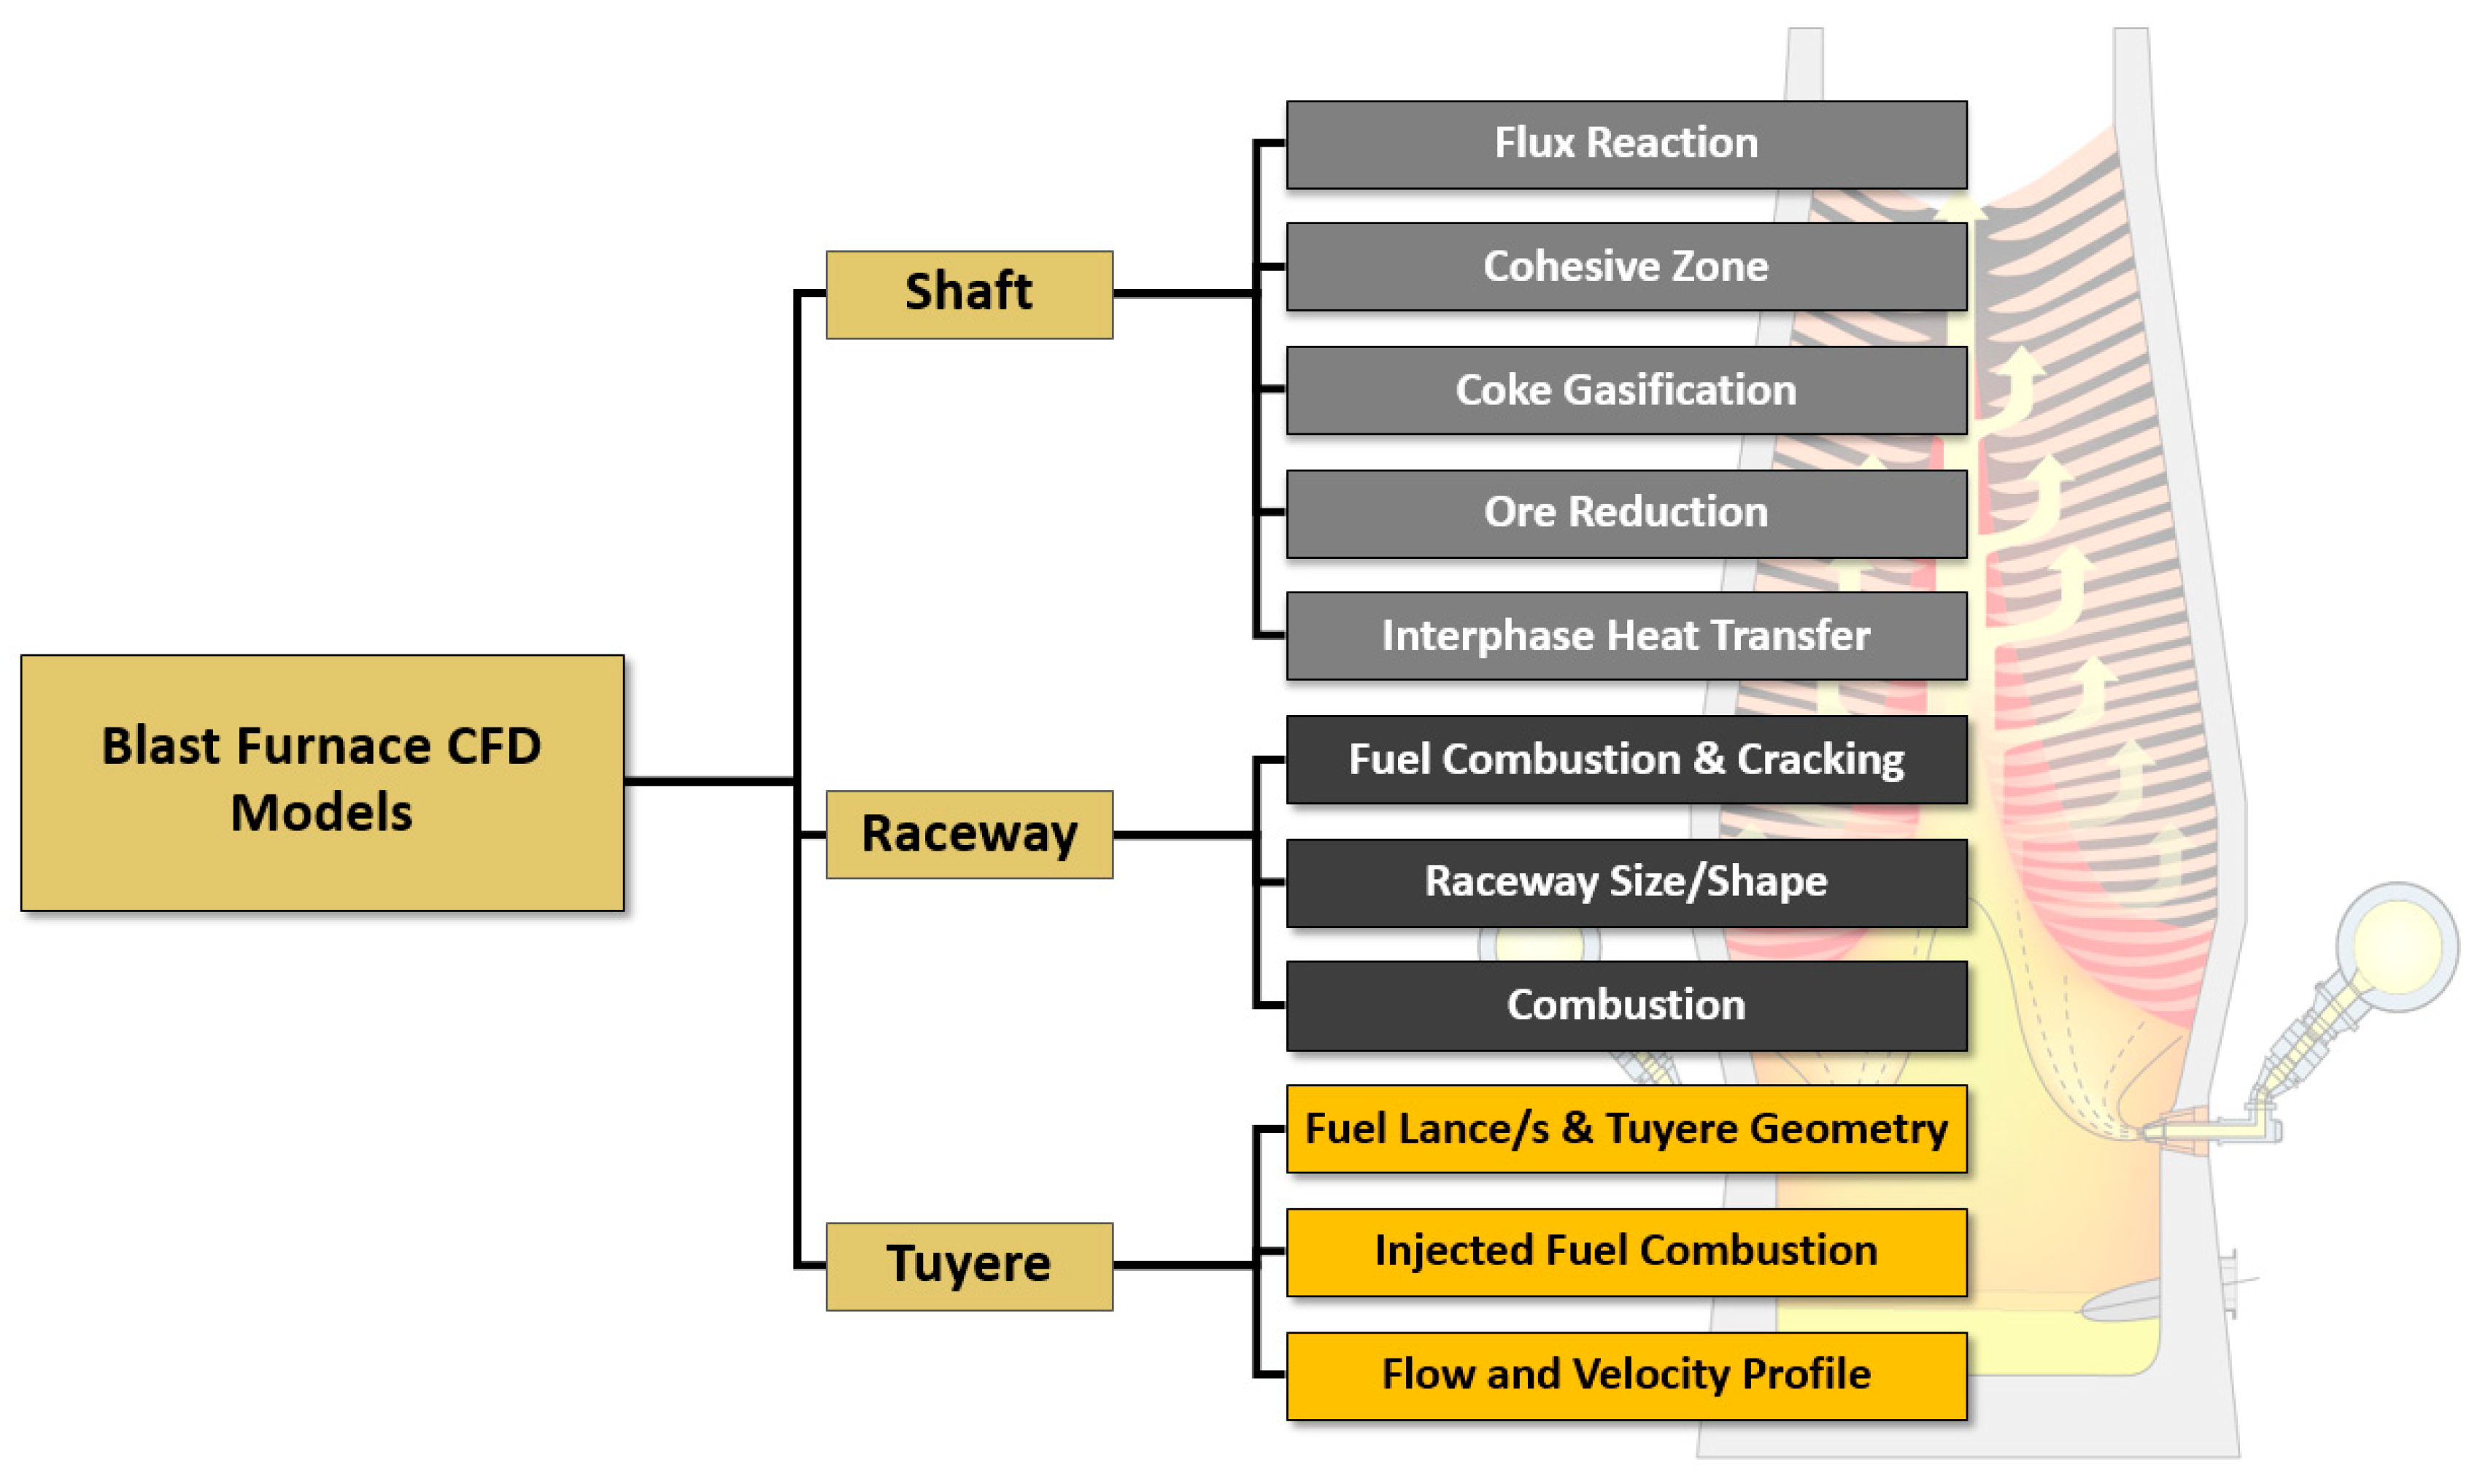
4. CFD Models
To capture the complexity and varied physics in the blast furnace the furnace was split into three segments to allow modeling to only focus on the relevant physics and phenomenon. These three regions would cascade from one to the other, with one-way coupling, to feed data into the next step of the modeling process. The particulars of this modeling approach have been covered in previously published work in far greater detail [
19,
20,
21,
22,
23,
24,
25,
26,
27,
28,
29,
30,
31,
32,
33,
34,
35], but a short overview will be provided here. The furnace was discretized into three distinct regions, namely the tuyere, raceway, and shaft regions to enable key elements of the modeling approach. In the tuyere region, the commercial CFD code is applied in order to maintain flexibility for faster geometry modifications. In the raceway, an in-house CFD code is applied to simulate the combustion of coke and natural gas, with the capability to also handle coal combustion. In the shaft region, another in-house CFD code is applied to simulate reduction reactions of the BF burden, the location of the cohesive zone, and the coke consumption rate in the furnace.
Figure 3 below shows a breakdown of the CFD component models and a brief summary of their key features.
As the BF is periodically symmetrical, only a single tuyere is modeled in this approach. The tuyere and raceway are modeled as a 3D domain to capture the asymmetry of the fuel injection. Given the azimuthal symmetry of the gas flow by the upper domain of the raceway region, the shaft region is modeled as an axisymmetric 2D domain to reduce computational cost.
To further reduce the computational cost of modeling, several foundational assumptions were made. Firstly, that the time sales of the gas and solid flow in the furnace are different enough, separated by approximately four orders of magnitude that the solid phase can be assumed fixed, and modeling can focus primarily on the motion of the gas. With this approach, the solid phase forms a fixed porous bed that is able to participate in chemical reactions, heat transfer, and flow interactions with the surrounding gas phase. Secondly, the furnace is assumed to be operating under steady state conditions where stability has been reached. Lastly, that all tuyeres and injection lances supply the furnace at identical flow rates, with no variation around the furnace.
The tuyere region was modeled using the commercial CFD code FLUENT™. This decision allows for rapid geometry changes for modifications to the lance design and position while capturing the relatively simple physics in the tuyere region. The primary physics that are of interest in the tuyere region are the mixing of the fuel and hot blast, and the reactions between the fuel plume and hot blast. This is accomplished with using the standard Navier–Stokes equations using the semi-implicit method for pressure linked equations (SIMPLE) scheme for pressure coupling, with the k-ε turbulence model used to address the effects of turbulence, the species transport model with the eddy dissipation concept model and a two-step methane combustion mechanism to model reactions and mixing, and the discrete ordinates method for radiation heat transfer.
The raceway region is modeled using a combined approach which applies both the existing in-house CFD code and commercial CFD code. This model makes use of a two-step process to model the formation and subsequent combustion in the raceway. The first step is to use a transient interpenetrating two-phase Eulerian–Eulerian multiphase model in the commercial CFD code FLUENT™ to perform a cold flow simulation which provides a prediction of the size and shape of the raceway cavity. The flow time for the final raceway shape result varies depending on operating conditions, with the selection point defined as the latest timestep in which the raceway cavity in the fluidized coke bed remains attached to the tuyere nose.
The coke phase distribution is then exported and used in the in-house code to provide a fixed porosity distribution that defines the raceway. Reactions in this region are modeled using a combination of the eddy breakup model and a simple Arrhenius rate model with the lowest rate of reaction between the two being used as the limiting reaction rate in the model. The coke bed is modeled as an infinite amount of carbon in the regions outside the raceway. This approximation is based on the quasi-steady state nature of the raceway. Although the raceway is constantly changing as coke is consumed by the combustion with the oxygen in the hot blast and there is a functionally unlimited amount of coke above the raceway that can replace any consumed coke, functionally resulting in a quasi-steady state raceway shape. Further details of this raceway model can be found in previously published work [
21,
22,
23,
24,
25,
26]. Details of the chemical kinetics and reaction rates used in the raceway combustion model can be found in
Table 1 below.
Using the temperature-dependent density distributions and mass transfer to the gas phase from coke bed the Eulerian–Eulerian multiphase model is then used with these two new source terms. This effectively includes the impact of increasing gas volume due to coke combustion and the changes in gas momentum as a function of density. A new coke bed porosity distribution is then generated and used for a new combustion simulation using the in-house code. This process is repeated once more to reach a final converged raceway shape. Due to the extended run time of the full raceway formation model, and its primary dependence on blast conditions, the decision was made to use the baseline porosity distribution. The resulting gas species, temperature, and velocity distributions are then compressed azimuthally to generate an averaged radial distribution.
The raceway region combustion model was used to calculate a CFD analog to the theoretical raceway adiabatic flame temperature (RAFT) used in industrial operations. This analog termed flame temperature analog (FT-A) is calculated by taking the mass weighted temperature average of all cells in the domain above the centerline of the tuyere with a gas mass fraction below 0.5% for all of the following species: CO2, O2, H2O, and CH4. This provides a method of comparing the temperature of the bosh gas in the furnace under different scenarios and provides a representation of the available heat in the furnace to reduce iron ore, as well as a touchstone for comparison to existing operational practices that is familiar to the industrial operator.
The shaft is modeled using an in-house FORTRAN code that tracks the motion of the bosh gas, the reduction of the iron ore contained in the solid phase, the heating of the ore as it approaches the cohesive zone, and various chemical reactions that occur in the shaft region. The chemical kinetics modeled in the shaft region include the six ore reduction reactions, including the water gas shift reaction, flux decomposition, the Boudouard reaction, and the direct reduction of liquid FeO—a summary of all these reactions and is summarized in
Table 2.
The location and shape of the cohesive zone (CZ) is calculated by drawing two isotherms based on the temperature of the solid phase. The upper limit of the CZ is defined as the softening temperature of the iron ore—in this case 1473 K—and the lower limit is defined by the liquidus temperature of the ore—here 1673 K. In the cohesive zone, the porosity of the ore layers is assumed to be zero, and all gas flow must pass through the coke slits, that retain their original porosity. Additional details on the specifics of the model and validation work can be found in previously published work [
26,
27,
28,
29].
5. Geometry and Boundary Conditions
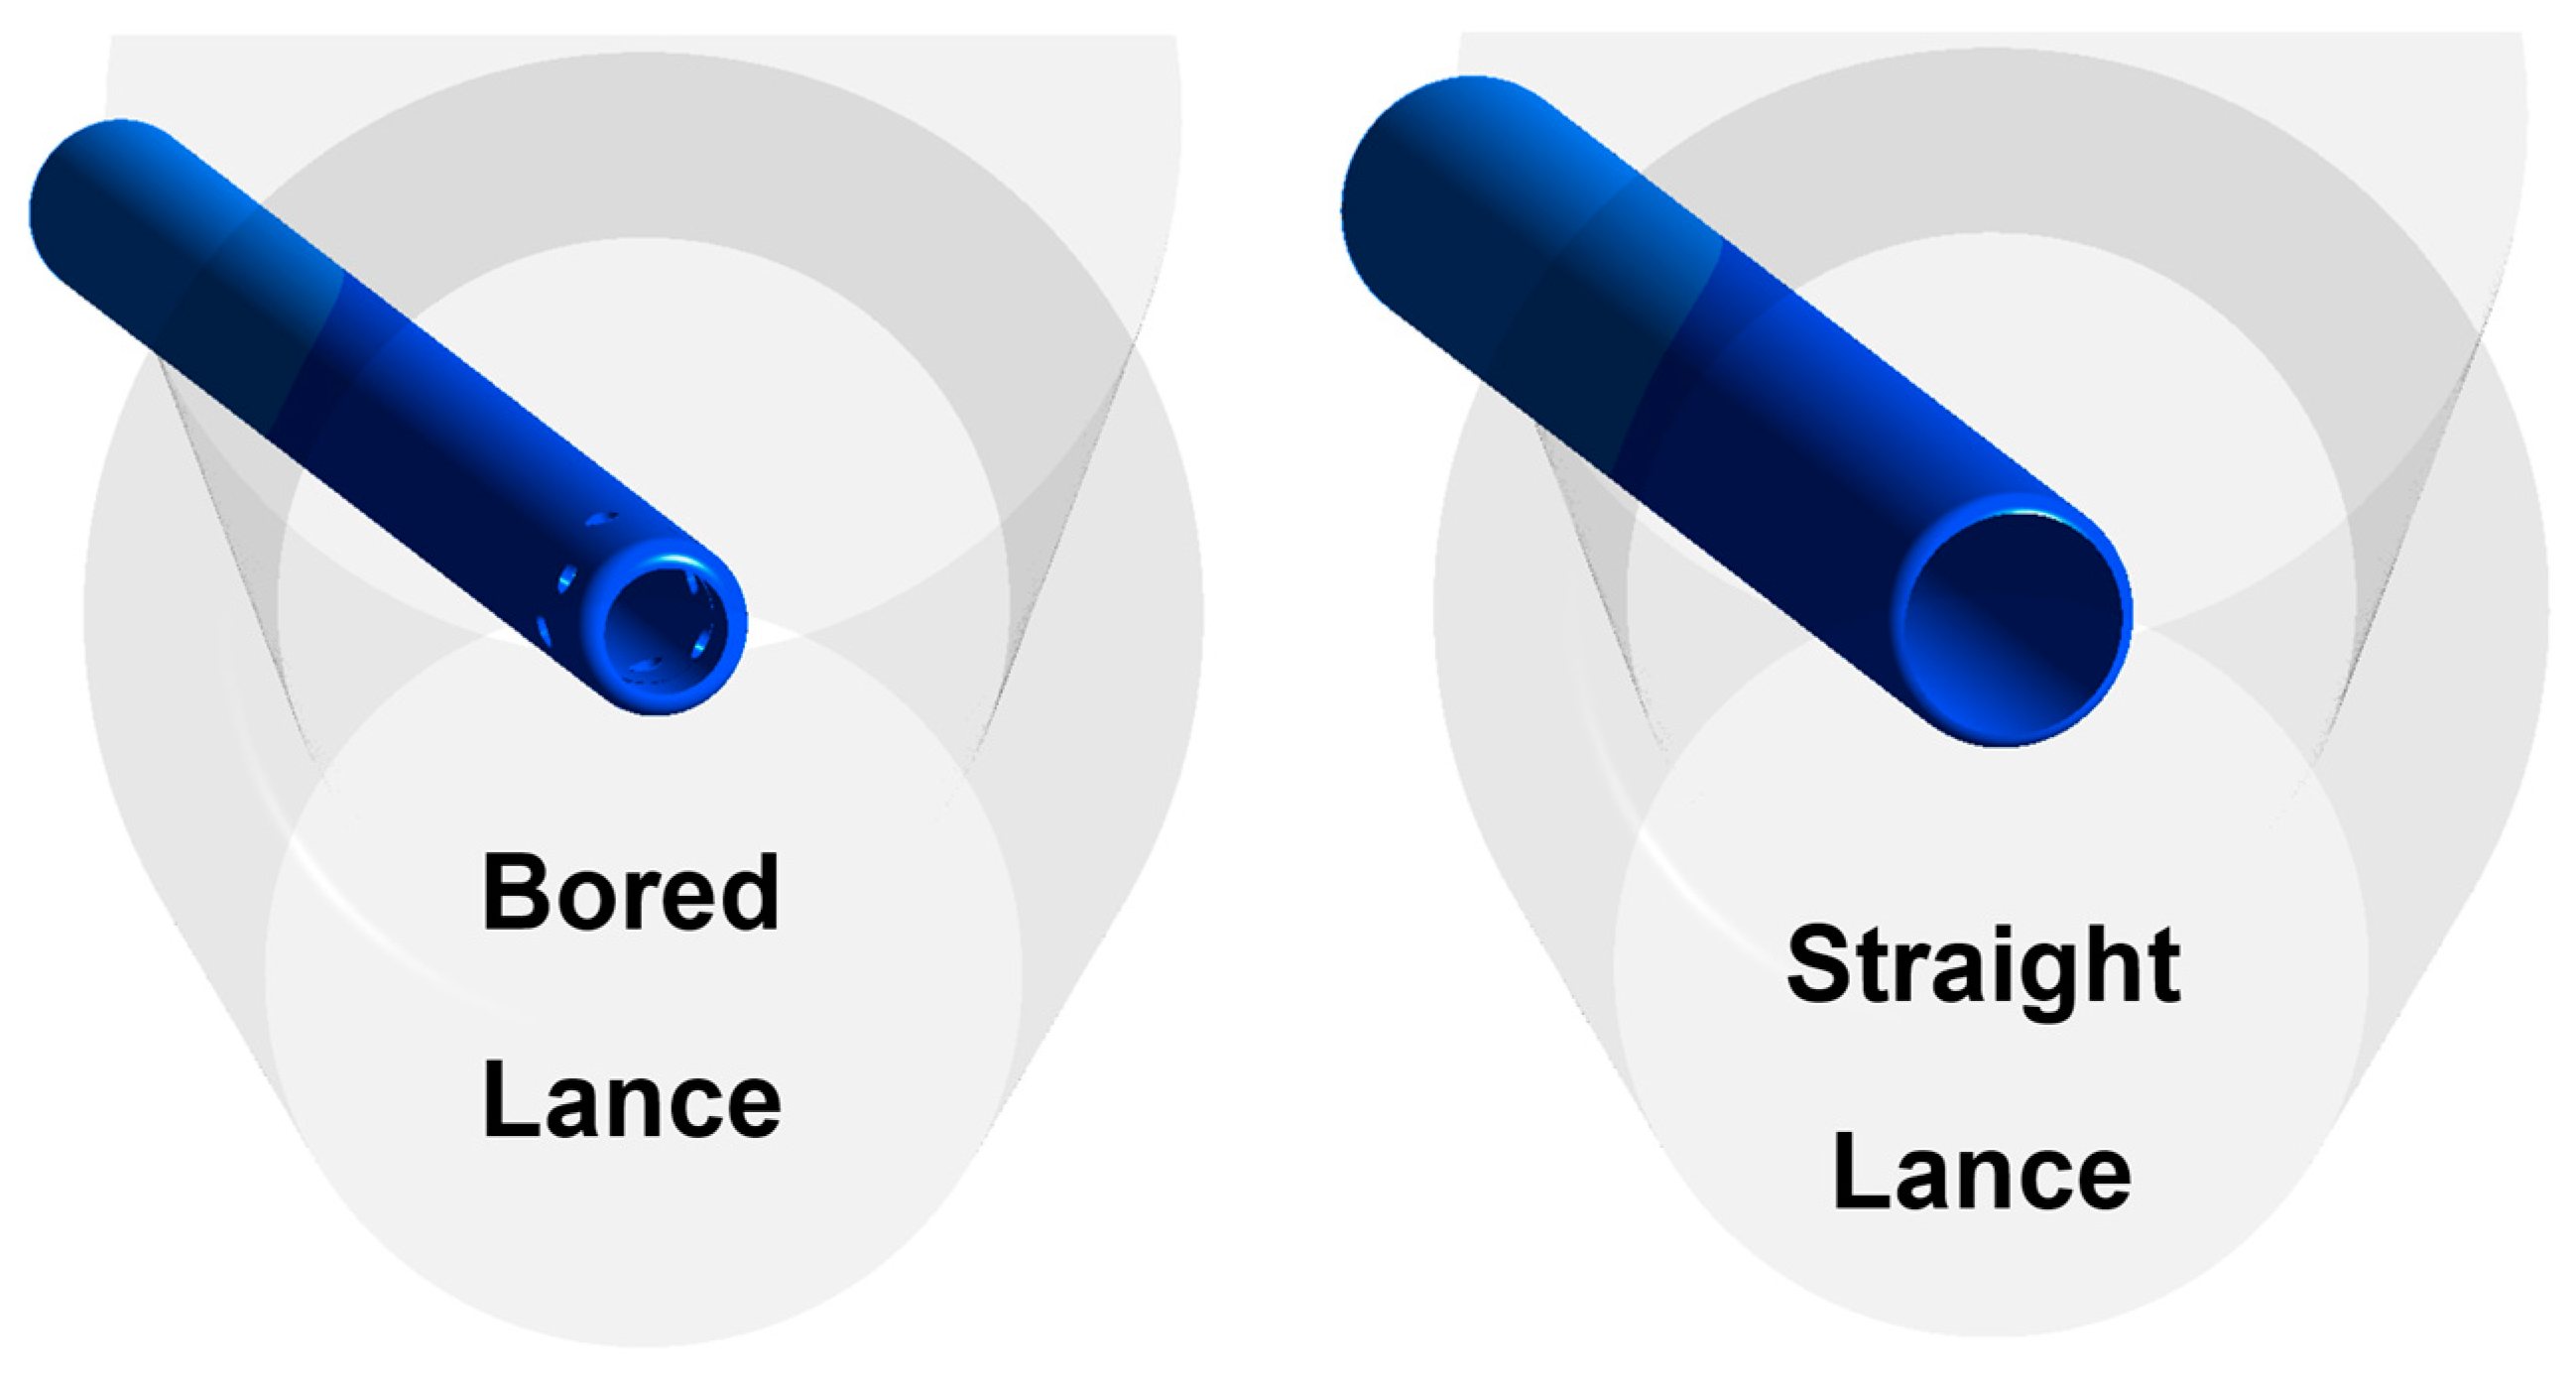
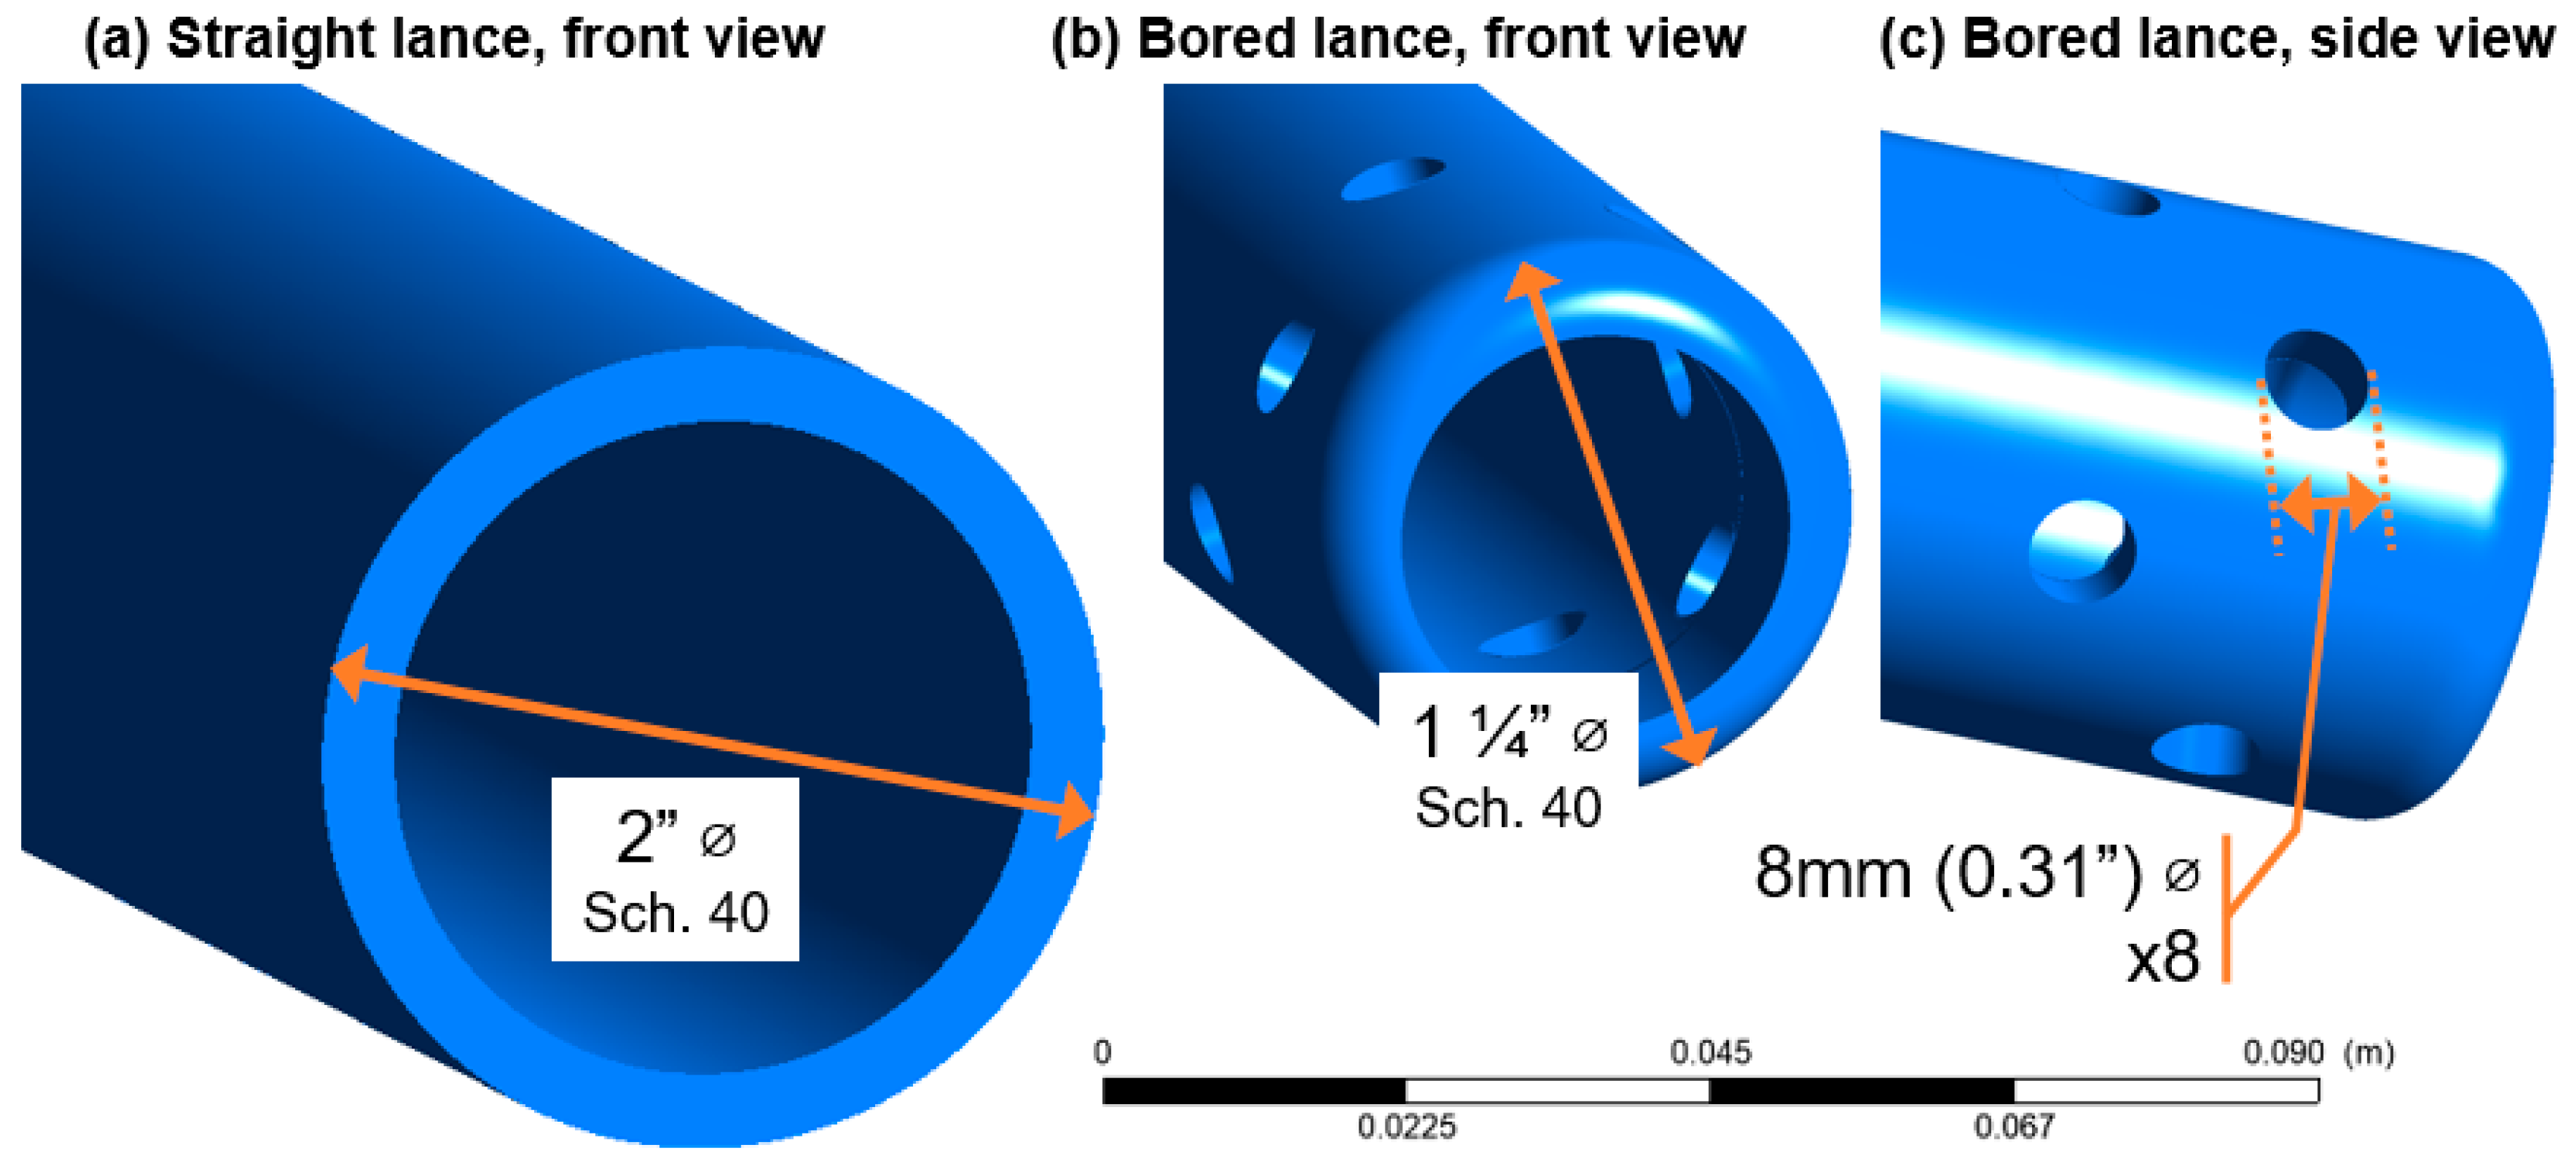
Geometry was developed based on a North American blast furnace of medium–large volume that operates exclusively with natural gas injection. This BF currently utilizes a 1.25 in Schedule 40 bored lance for natural gas injection. An overview of lance positioning and relative size is presented in
Figure 4, with additional detail and dimensions supplied in
Figure 5: it is noted that front views are shown from a perspective inside the blast furance. This bored lance is little more than a standard steel pipe with a series of perpendicular holes drilled into the tip of the lance to improve mixing. Previously undertaken work has indicated the potential for the impingement of hot gases on the tuyere side wall with increased injection velocity when using natural gas. Due to the decreased density of the syngas resulting from higher temperatures and increased free hydrogen content, the diameter of the fuel lance was increased to 2 in to increase the cross-sectional area and decrease the injection velocity, in the hope of avoiding impingement on the tuyere walls that would limit the practical implementation of syngas injection (also
Figure 4). Here, a simple “straight lance”, i.e., a lance without the additional holes of the bored lance added, was used.
Syngas injection was modeled using the same methodology previously used for NG preheating, with the existing reaction models. Three potential syngas compositions were provided by Linde based on their existing technologies using the methodology outlined above. These three compositions are outlined in
Table 3. These three compositions were selected to investigate different potential feedstocks based on feedback from industrial collaborators. One of these compositions uses natural gas as the feedstock, while the other two make use of coke oven gas (COG) as a feedstock. The primary benefit of using COG as a feedstock is that because it is a waste gas, the carbon impact of burning it in the blast furnace is negligible compared with the sourcing of natural gas explicitly for combustion. Three temperatures (400 °C, 700 °C, and high temperature) were selected for modeling. The high temperature cases were based on the temperature of the syngas at the outlet of the syngas generator, with the other two temperatures representing potential quenching and heat losses in the supply piping.
6. Results
Given the limitations of natural gas preheating encountered with gas cracking, syngas injection was investigated as an alternative method of maintaining raceway temperatures while pushing higher injection rates, with the added benefit of serving to reduce carbon emissions from the BF. As previously mentioned, the BF selected for CFD modeling in this study injects NG as the only auxiliary fuel. This allows for the isolation of syngas impacts on the blast furnace, and a quantitative comparison between operating conditions by directly replacing the NG using syngas generated by a similar mass flow rate of NG through a corresponding reactor. This then serves to clearly define the associated impacts, drawbacks, and improvements to the operation observed with syngas injection in comparison to the baseline operation.
The selected baseline operating conditions for this BF are a wind rate of 270,000 Nm3/h, with a total enriched oxygen content of 29% by volume, a hot blast temperature of 1448 K, and a NG injection rate of 95 kg per metric ton of hot metal (mthm). Injected natural gas was supplied through a lance with multiple ports around the edges near the tip and a single central port for primary gas flow, as previously shown in
Figure 4 and
Figure 5.
A comparison of CFD model predictions for key blast furnace operation parameters were made against industrial values for the baseline operating conditions.
Table 4 below details this comparison. Further details of previous validation for the CFD models utilized in this work can be found in previously published literature [
6,
19,
20,
21,
22,
23,
24,
25,
27,
28,
29], and additional details related to grid sensitivity studies can also be found in previously published literature [
29].
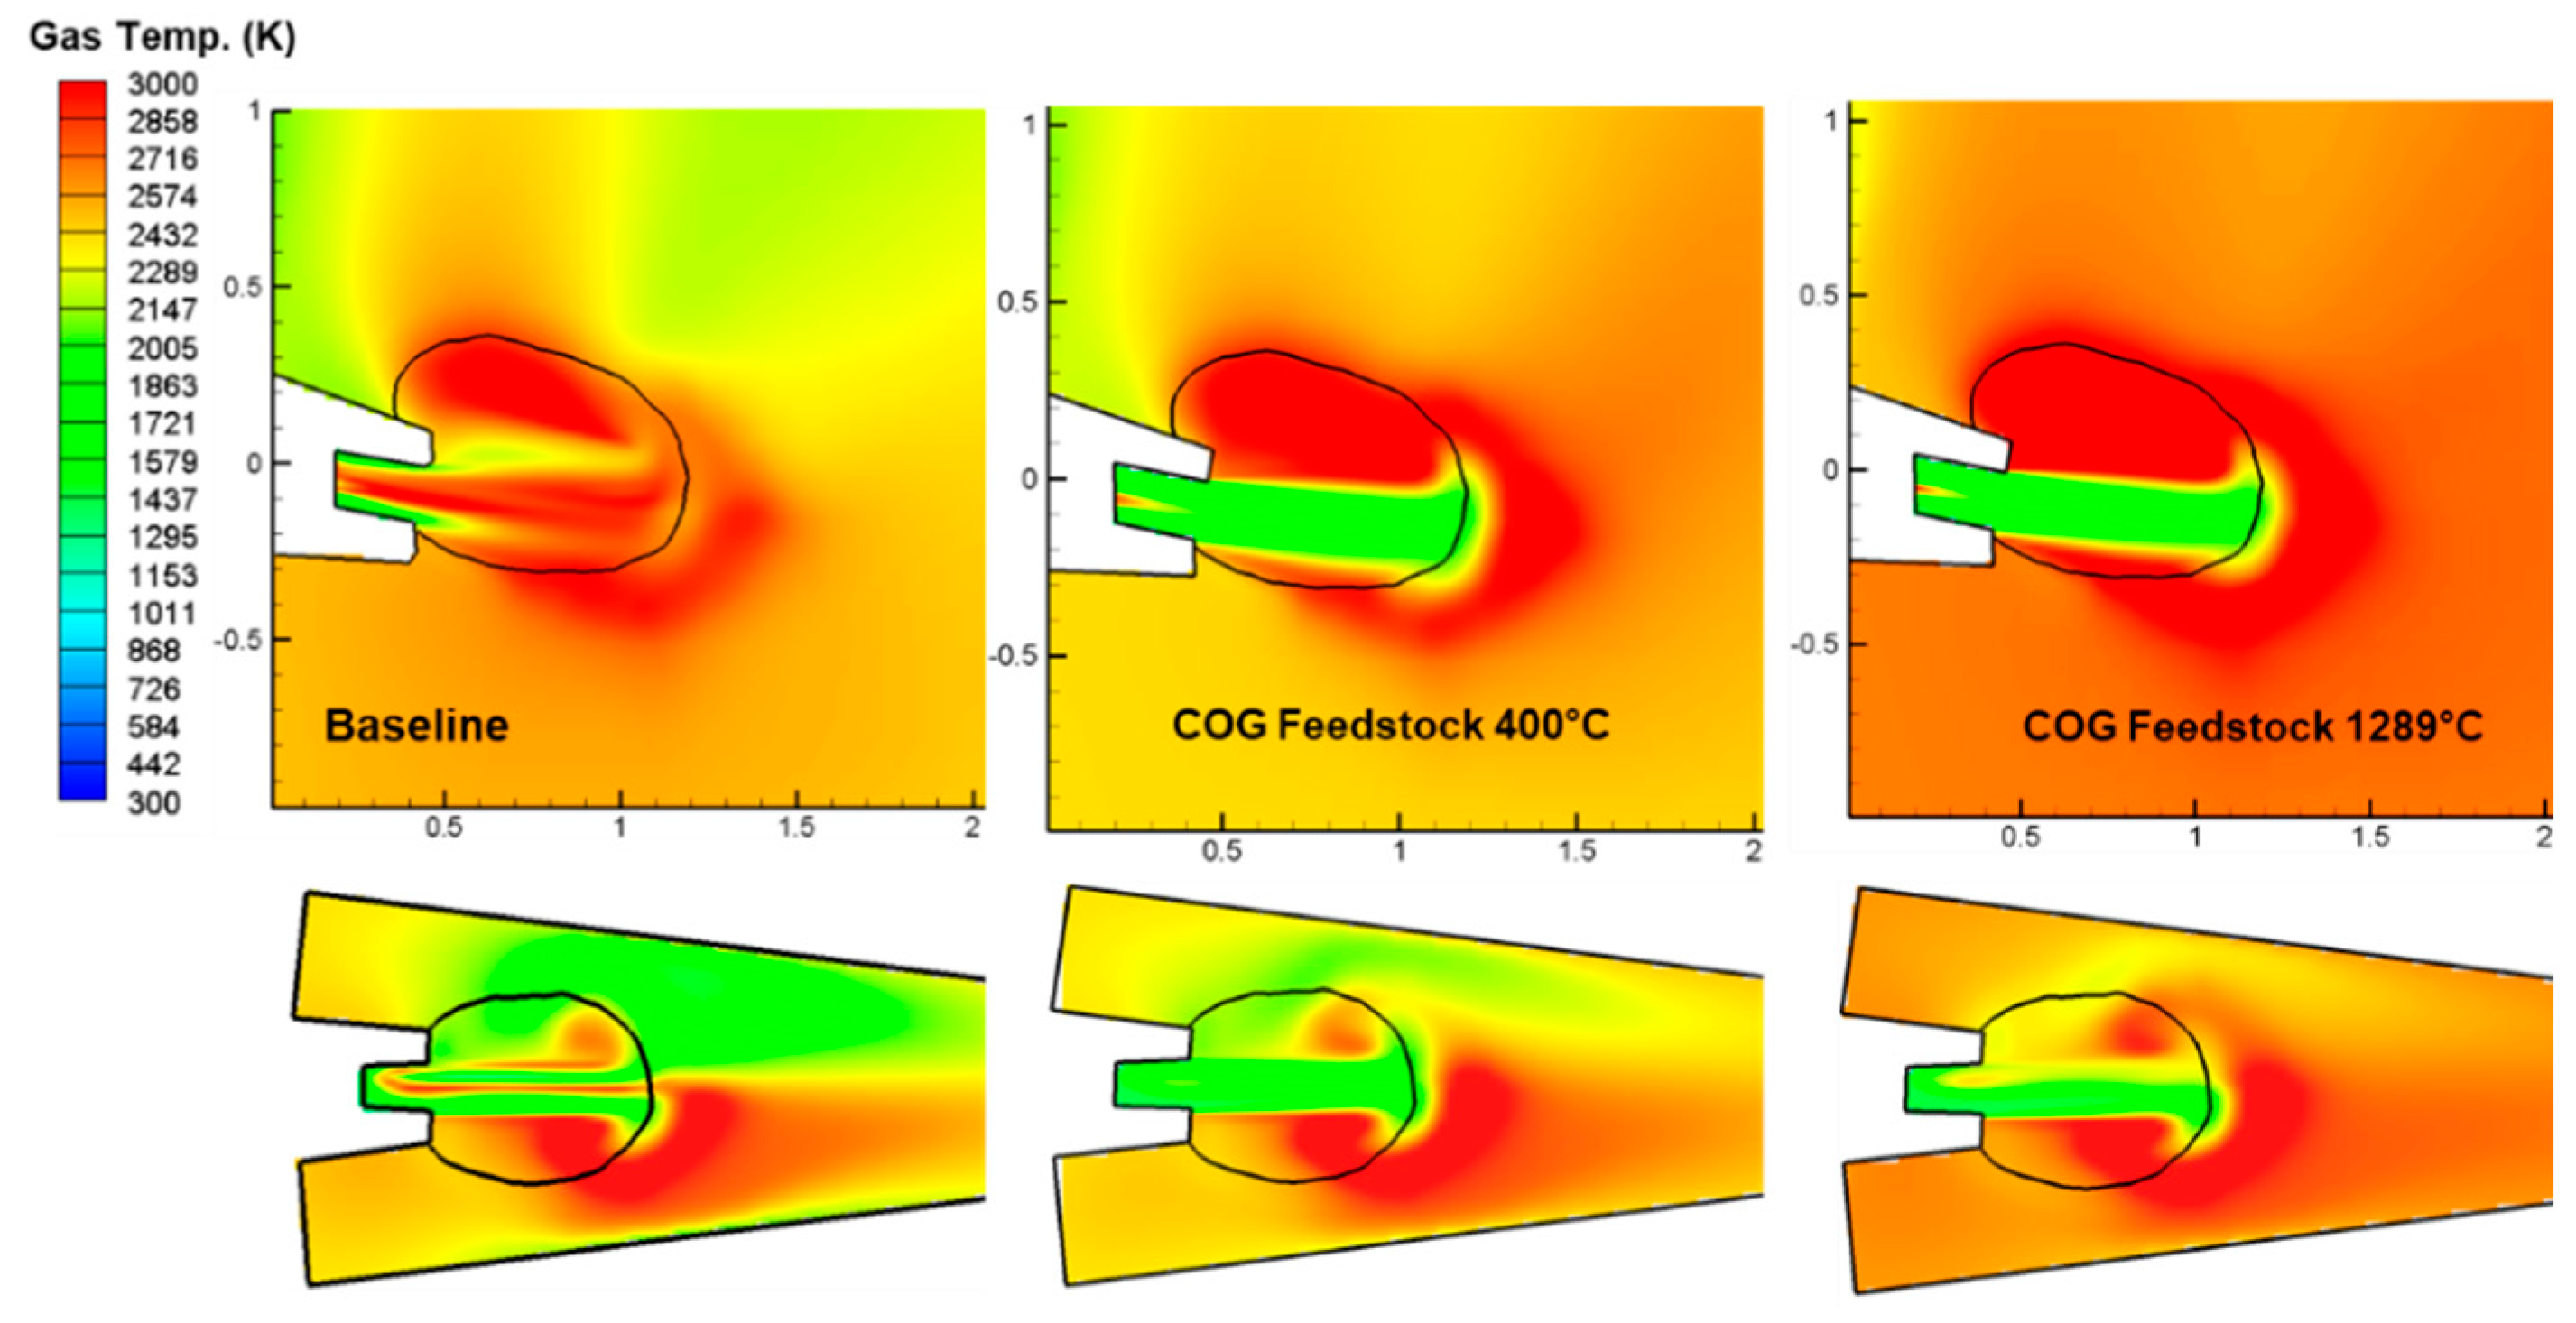
In the tuyere region, when considering syngas injection at identical mass flow rates, the baseline natural gas injection case (0.28 kg/s/tuyere), the higher temperatures of the injected syngas result in significant shifts in the location of the injection plume (
Figure 6). At higher injection rates and temperatures, this can cause an impingement on the side wall of the tuyere, particularly with the existing bored injection lance design used to deliver natural gas into the furnace. The impingement of the hot and combusting gases, while not as detrimental as a situation in which pulverized coal impinges upon the tuyere wall, may still result in the potential for increased thermal wear on the tuyere.
With this in mind, a reduction in the injection velocity was desired. The proposed solution explored in this research was two-fold: first by expanding the diameter of the injection lance, and second by reducing the temperature of the syngas to correspondingly increase gas density. As observed in
Figure 6, the simulation scenario utilizing cooled COG feedstock syngas injected at 400 °C through a straight pipe 2 in diameter lance results in a significant reduction in impingement on the sidewall when compared to the higher temperature 700 and ~1300 °C injection scenarios.
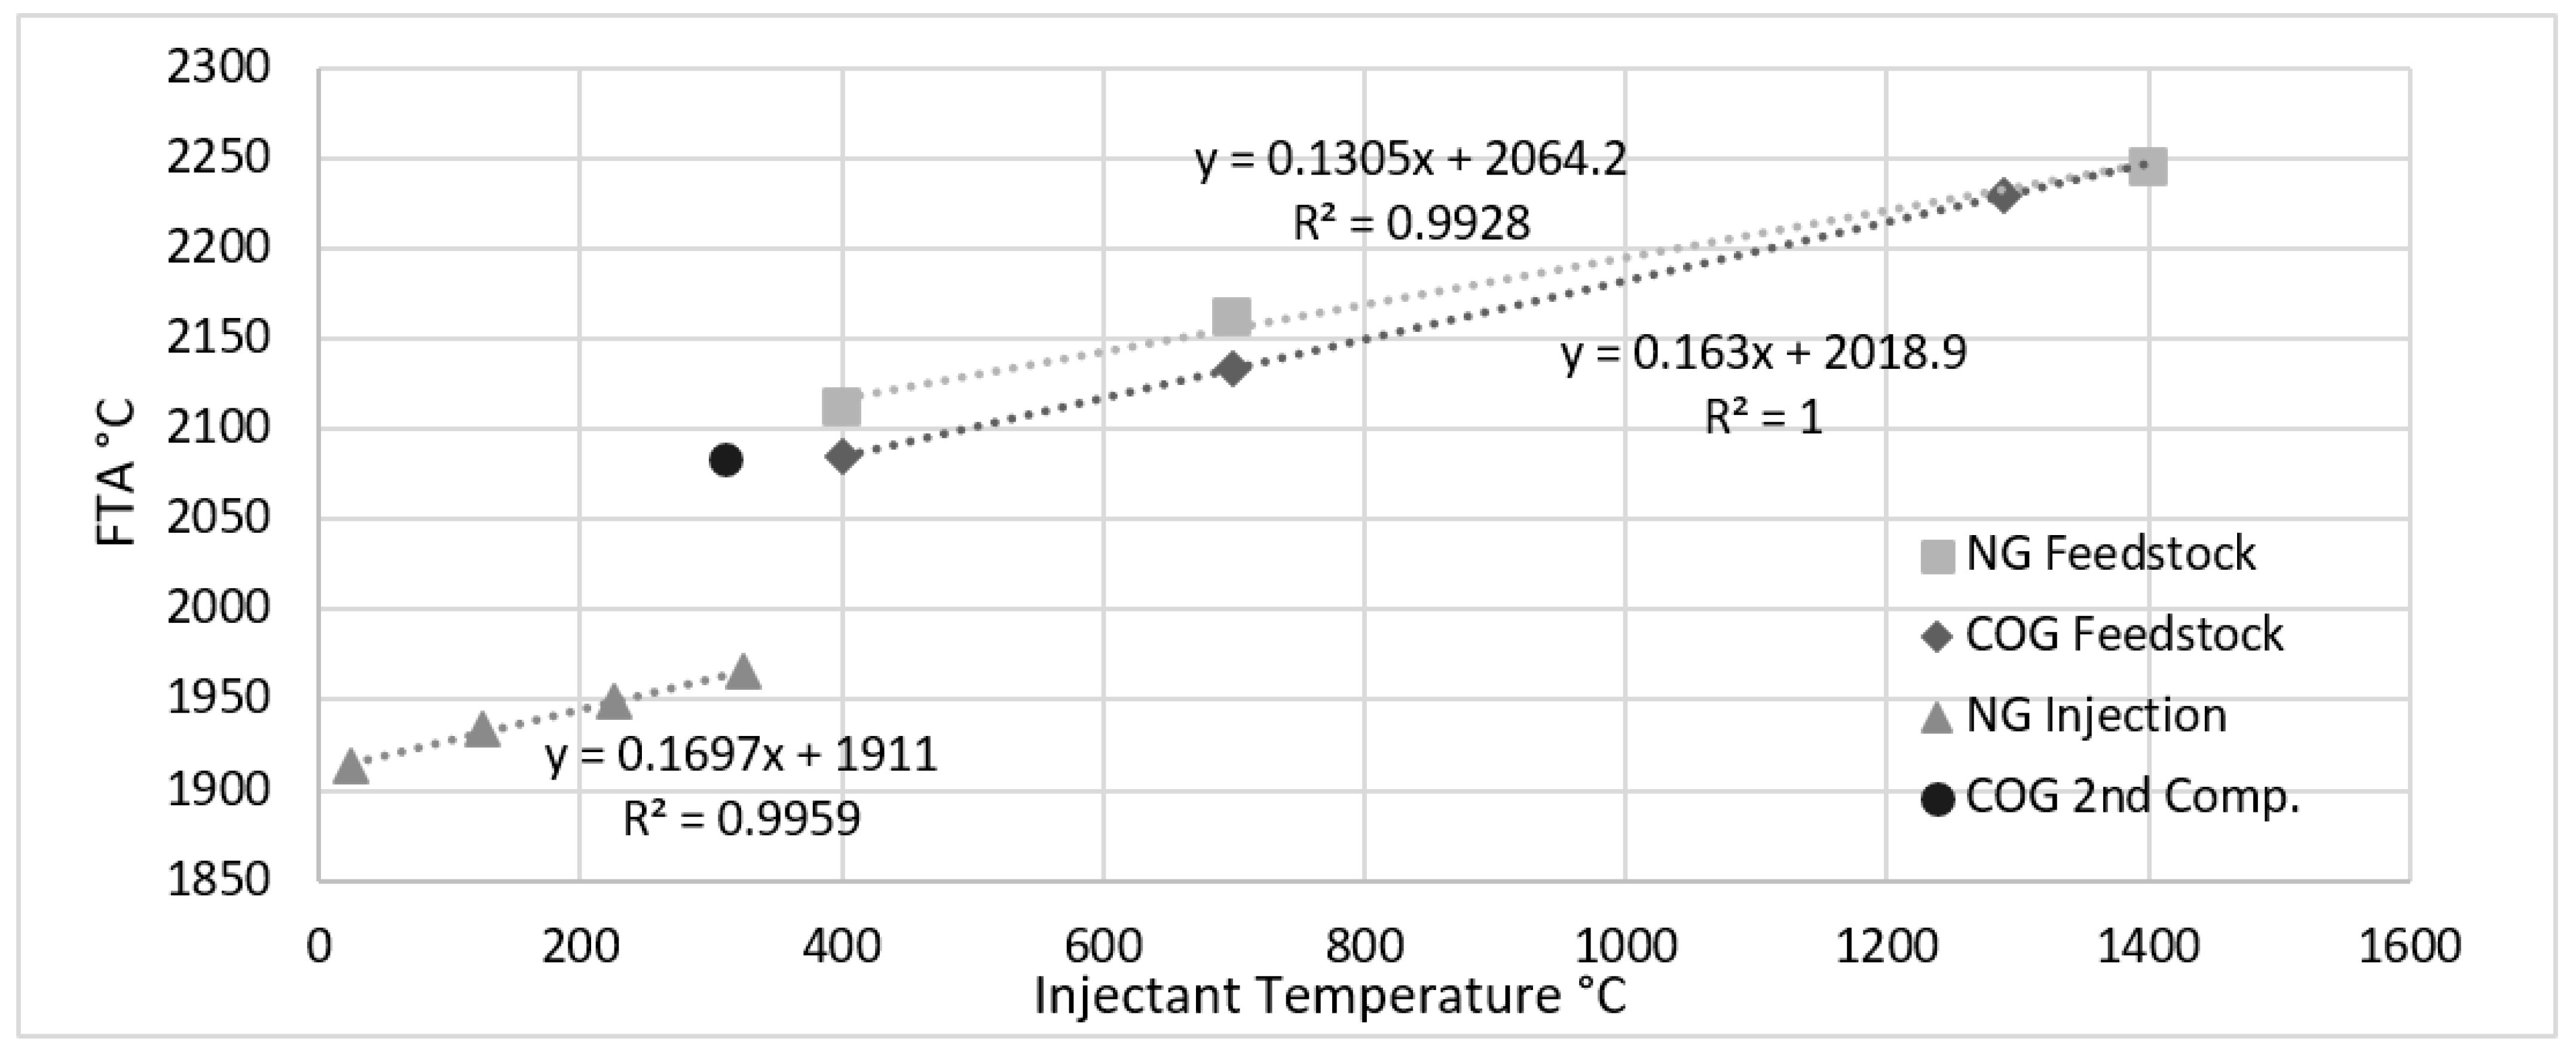
In the raceway, syngas injection produced higher FT-A values than the baseline scenario and scenarios involving natural gas pre-heating prior to injection (
Figure 7). To quantify the overall impact of auxiliary fuel injection temperature, a preheating efficiency is defined. This efficiency is the observed increase in FT-A for each unit increase in auxiliary fuel injection temperature relative to a baseline. This can also be observed as the slope of the regression line when plotting FT-A vs. injection temperature at a fixed injection rate (
Figure 7). Previous work using these models and operating conditions have established a baseline preheating efficiency of 0.17 FT-A K/PH K for natural gas injection [
6] (i.e., for each 1 K increase in natural gas temperature, the flame temperature rises by 0.17 K). The preheating efficiencies for the syngas compositions were slightly lower than the natural gas cases (0.17 FT-A K/PH K) depending on the composition. The NG feedstock case was the lowest at 0.13 FT-A K/PH K, while the COG feedstock cases were closer to the baseline at 0.16 FT-A K/PH K. This suggests that the temperature of the syngas has a less pronounced impact on flame temperature; however, because the decomposition and soot deposition at high temperatures is a less significant concern when utilizing syngas injection, it should be possible to push higher injectant temperatures, thus realizing a greater impact on the furnace.
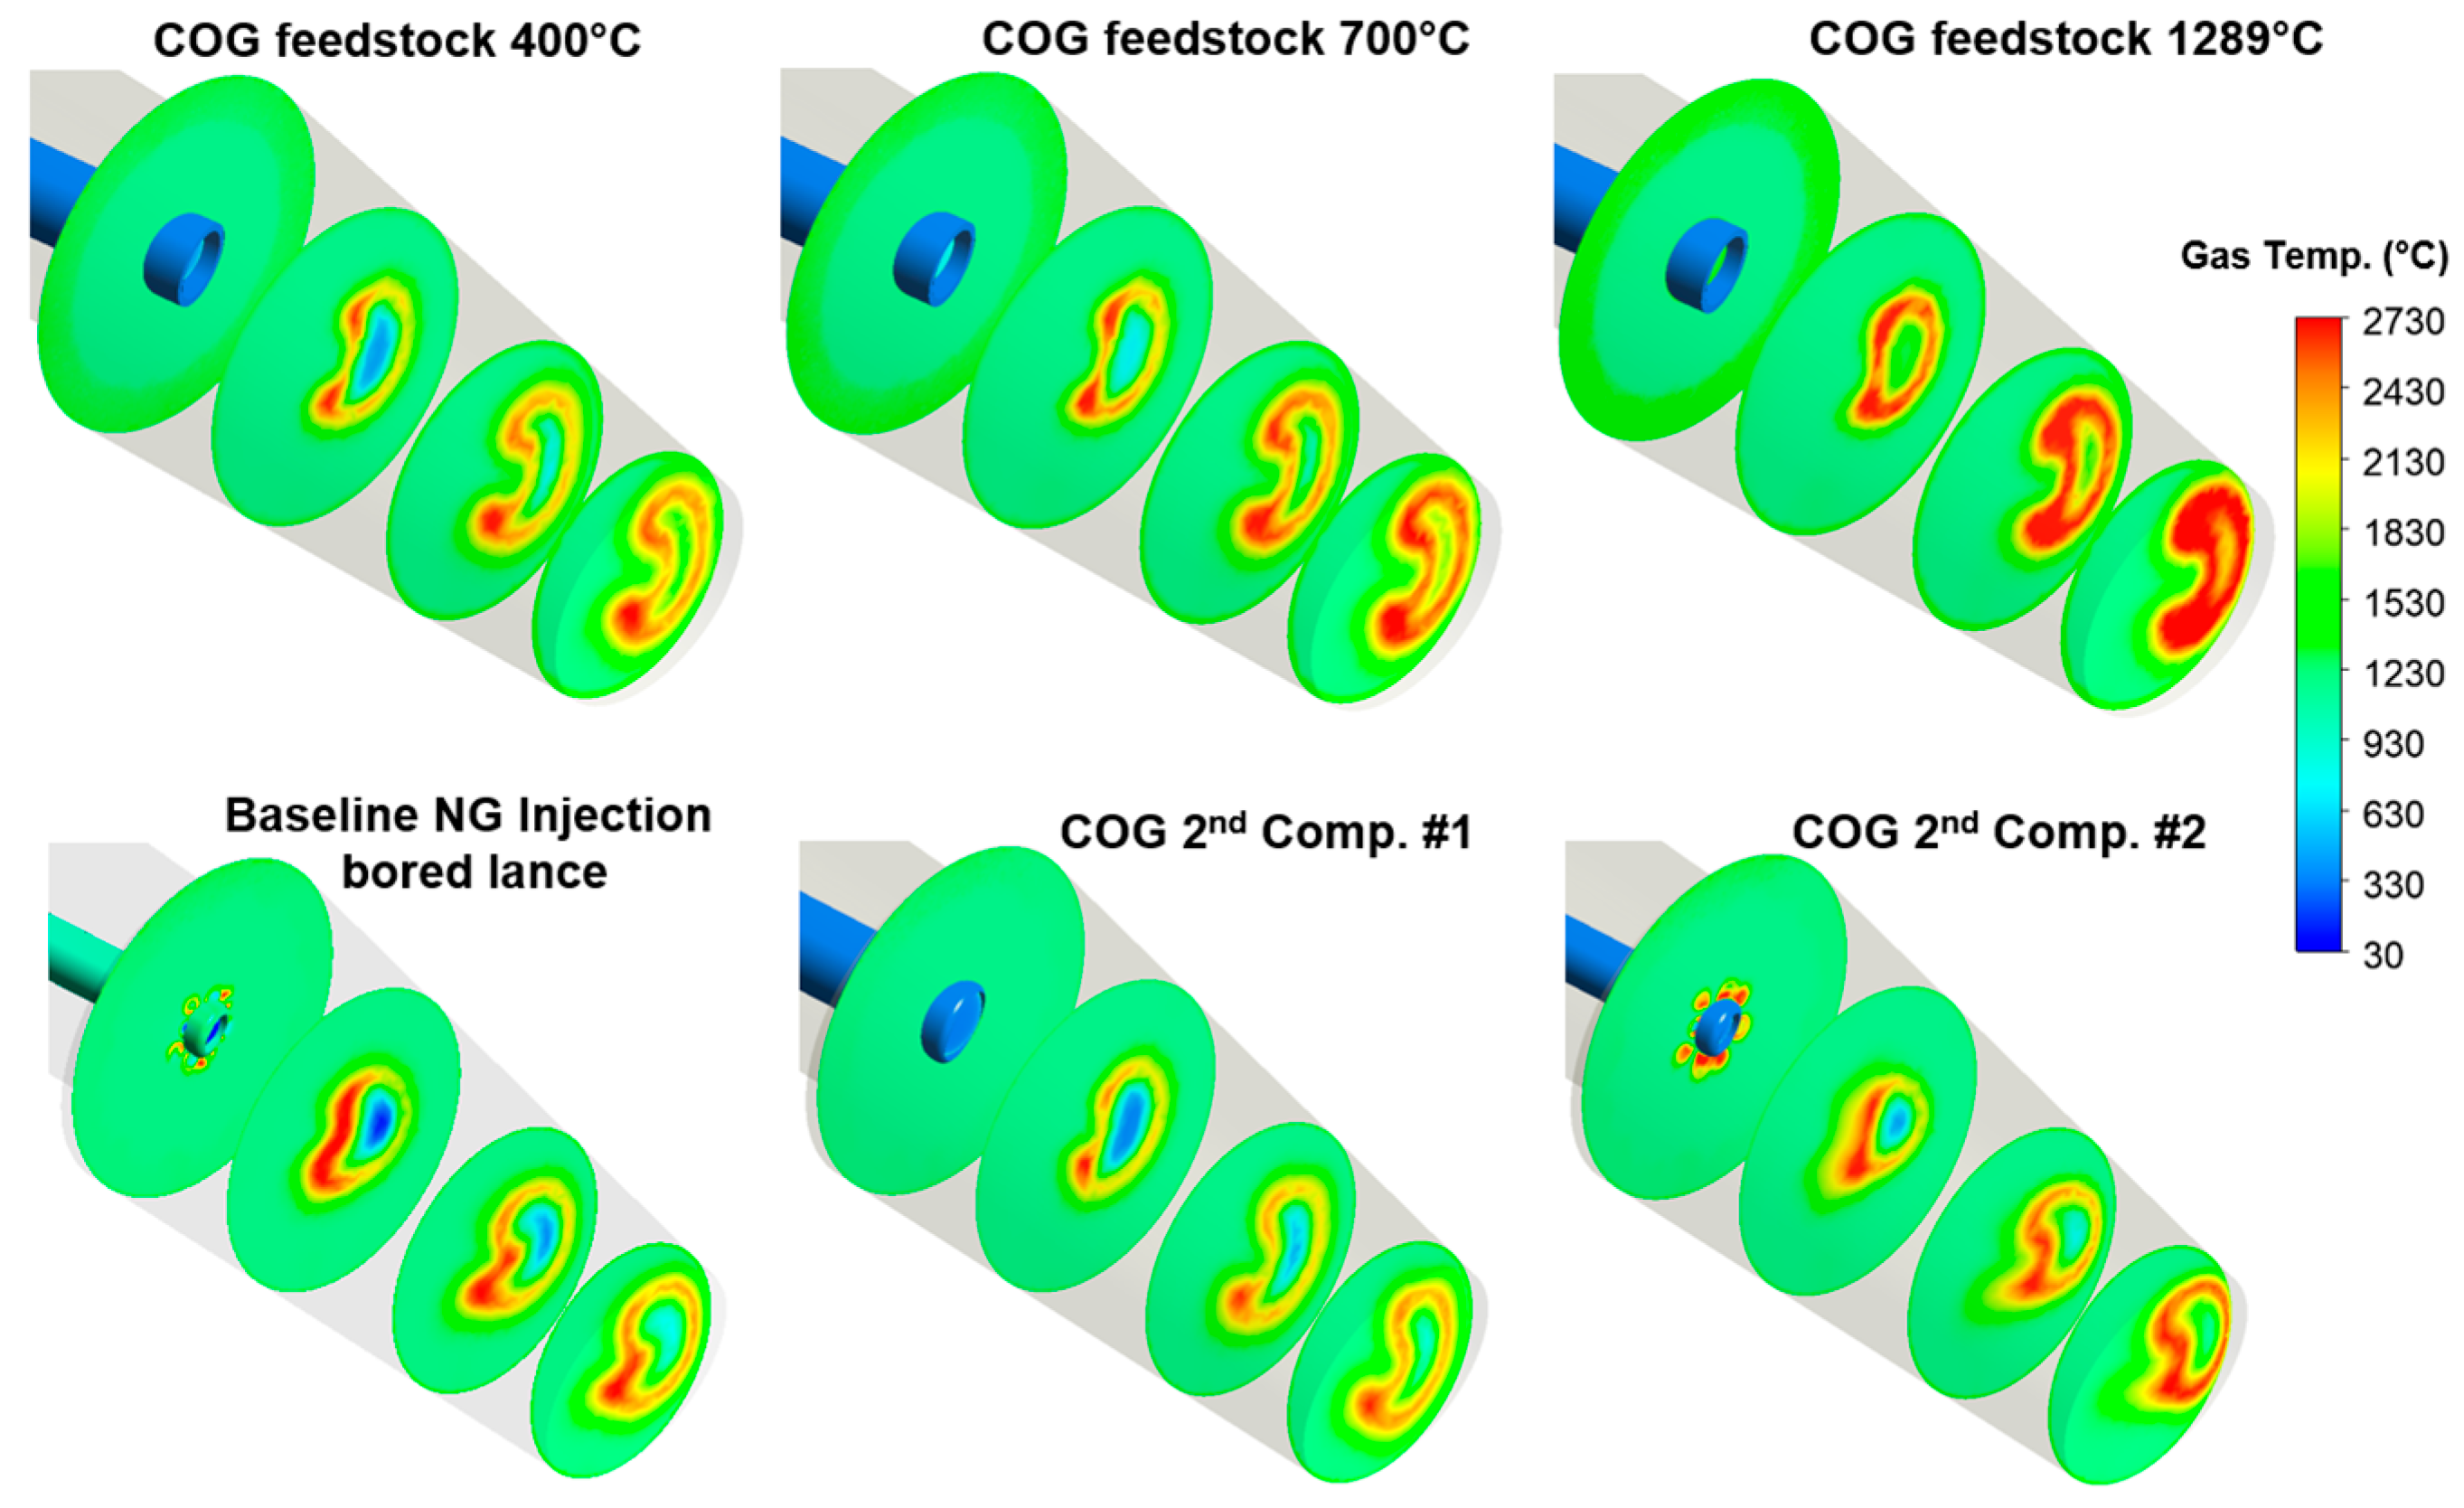
Gas temperatures in the raceway are uniformly higher with syngas injection (
Figure 8). Because syngas injection all but eliminates the decomposition reactions for all species except H
2O and CO temperatures increase. It is also notable that because of this, the left–right asymmetry that is present in the natural gas baseline case is significantly reduced, resulting in a more uniform bosh gas temperature distribution. There is a larger high temperature region in the raceway above the tuyere plume in the raceway combustion cases that is likely due to the combustion of CO.
Syngas injection also causes significant shifts in the species’ distributions inside the raceway.
Figure 9 depicts the changes to the intermediate combustion species between the natural gas baseline and the two selected syngas cases. There is a significant increase in CO
2 over the baseline case, likely due to the increased combustion in the tuyere of CO in the syngas.
Hydrogen distributions shift to the left because of the increased plume momentum, largely pushing it off the center plane. Because of this, a larger concentration of water vapor is apparent in the natural gas baseline case. Predictions from the blast furnace shaft model also indicated that syngas injection appears to positively impact furnace operation, with significant observed reductions in coke rate. In particular, the lower injection temperature NG feedstock and COG feedstock syngas cases both showed reduced coke rates from the baseline of 392 kg/thm. NG feedstock injection at 400 °C resulted in a predicted coke rate of 377 kg/thm, a 3.8% reduction, while the COG feedstock syngas at the same temperature resulted in a reduction of 2.5% percent for a total coke rate of 382 kg/thm.
The results of the ten scenarios simulated in this study are compiled in
Figure 10 and
Table 5 below, with particular attention paid to the furnace coke rates.
Figure 10 indicates that while the coke rate continues to decline with the injected fuel temperature (and the total sensible heat imparted to the furnace), the relationship between these two elements appears reduced in the higher-temperature range, in comparison to results from previous simulation studies exploring preheated natural gas injection. The numerical uncertainty present in these CFD models was evaluated in previous work at a reasonable level between 4 and 10% using the
Journal of Fluids Engineering Grid Convergence Index (GCI) methodology [
29]. The results observed in this study align with the established blast furnace operation rules of thumb relating to the impacts of sensible heat input to flame temperature and coke rate (i.e., for a 10 K increase in flame temperature, modern blast furnaces can expect a reduction of roughly 1.4 kg/thm in coke rate) [
2].
However, while the direct impacts on the coke rate of syngas injection are modest and logically follow, it is the impact on flame temperature which appears most beneficial in these scenarios. The use of syngas injection serves to shift endothermic decomposition reactions outside the furnace environment (to the syngas reactor), and as such, it is expected that syngas injection could enable higher total mass flow rates of injected fuels and a corresponding decrease in blast furnace coke consumption as more of the reducing gases in the furnace can be replaced with those generated by auxiliary fuel injection. This would, in effect, serve to widen the furnace operating window beyond existing limitations, particularly when exploring the concept of high natural gas injection rates.
7. Conclusions
This paper examined the potential impacts of replacing natural gas with syngas in a blast furnace with a single auxiliary fuel supply using CFD modeling. The simulations predicted that the use of syngas injection can provide a potential method of reducing coke consumption in the blast furnace at similar injection mass flow rates to natural gas injection while maintaining a stable raceway flame and reducing gas temperature. Improvements of 8–15 kg/thm in the total coke rate were indicated by modeling in the three most reasonable scenarios (cooled NG-based syngas, cooled COG-based syngas, and cooled COG-based syngas of a second composition). Extrapolated based on a basic assumption of 6000 metric tons per day of production, this would result in a potential annual reduction of approximately 23,800 metric tons per year of coke, or a 3.2% reduction in total coke consumption.
Additionally, given the increased raceway region temperatures predicted in cases utilizing syngas injection, it may be possible in these scenarios to reduce the oxygen content of the hot blast. Such an adjustment may potentially maintain a raceway flame temperature closer to the baseline operating conditions while retaining lower coke consumption in the raceway—though additional simulations may be required to ascertain the exact impacts of such operating conditions. It is also worth considering the reduced carbon content of the cooled NG feedstock syngas in comparison to standard natural gas injection. The NG baseline operation produces roughly 1.7 metric tons of CO2 per metric ton of hot metal, excluding emissions from hot stove operation. In comparison, the cooled NG feedstock syngas case has a calculated emission rate of roughly 1.5 metric tons of CO2 per metric ton of hot metal—a 12.9% reduction over the baseline.
From an implementation perspective, higher temperature syngas injection presents difficulties due to higher injection velocities, resulting in the observed impingement of the combusting gas plume on the tuyere side wall. Such injection velocity increases could be mitigated in the tuyere by utilizing a larger diameter lance or decreasing the lance angle to reduce the lateral momentum of the syngas plume when it enters the tuyere; however, these changes would require capital investment in the redesign of the blowpipes in addition to the implementation of a syngas generation system. As such, it is expected that the simpler approach of quenching the syngas before injection (also avoiding concerns with transportation for gas at temperatures in excess of 1000°C) would be desirable for furnace operators.


