Article

Anaerobic Acidogenic Fermentation of Cellobiose by Immobilized Cells: Prediction of Organic Acids Production by Response Surface Methodology

by
Panagiota Tsafrakidou
1,*,
Konstantina Tsigkou
2,
Argyro Bekatorou
1,*,
Maria Kanellaki
1 and
Athanasios A. Koutinas
1
1
Department of Chemistry, University of Patras, 26500 Patras, Greece
2
Department of Chemical Engineering, University of Patras, 26504 Patras, Greece
*
Authors to whom correspondence should be addressed.
Processes 2021, 9(8), 1441; https://doi.org/10.3390/pr9081441
Submission received: 16 June 2021 / Revised: 11 August 2021 / Accepted: 12 August 2021 / Published: 19 August 2021
(This article belongs to the Special Issue Novel Processes for Development of Fermentation-Based Products)

Abstract

:
Response surface methodology was used to derive a prediction model for organic acids production by anaerobic acidogenic fermentation of cellobiose, using a mixed culture immobilized on γ-alumina. Three parameters (substrate concentration, temperature, and initial pH) were evaluated. In order to determine the limits of the parameters, preliminary experiments at 37 °C were conducted using substrates of various cellobiose concentrations and pH values. Cellobiose was used as a model sugar for subsequent experiments with lignocellulosic biomass. The culture was well adapted to cellobiose by successive subculturing at 37 °C in synthetic media (with 100:5:1 COD:N:P ratio). The experimental data of successive batch fermentations were fitted into a polynomial model for the total organic acids concentration in order to derive a predictive model that could be utilized as a tool to predict fermentation results when lignocellulosic biomass is used as a substrate. The quadratic effect of temperature was the most significant, followed by the quadratic effect of initial pH and the linear effect of cellobiose concentration. The results corroborated the validity and effectiveness of the model.

1. Introduction

The decreasing fossil resources, increasing demand, and rising prices for energy, as well as the growing CO2 emissions caused by the massive consumption of fossil fuels, have stimulated research into the production of platform chemicals and fuels from renewable biomass resources, especially waste biomass [1,2,3]. Anaerobic digestion is a promising process for the conversion of biomass to renewable energy; and research in this field mainly focuses on determining the ideal conditions for diverse substrates such as agro-industrial wastes [4,5,6,7,8,9]. Anaerobic digestion involves four steps: (1) the breakdown of organic compounds into soluble oligomers; (2) further hydrolysis and fermentation to produce mainly organic acids (acidogenesis); (3) acetate production (acetogenesis); and finally, (4) methane and carbon dioxide production (methanogenesis), which is the most energy and time-consuming step [10,11]. Organic acids such as acetic, propionic, isobutyric, butyric, isovaleric, and valeric acid, produced during the acidogenesis step, may be used among other applications for the production of ester-based fuels similar to biodiesel. This approach has been previously proposed as a cost-effective and environmentally friendly alternative [6,7,8,9,12,13]; however, further research is needed on efficient and cost-effective esterification, separation, and purification processes.
Lignocellulose is the most abundant and promising source of biomass for the sustainable production of fuels and chemicals [14]. In the microfibrils of lignocellulosic biomass, each cellulose chain is rotated by 180° along the polymer axis, creating a flat ribbon structure, in which cellobiose is the repeating unit [15,16]. Cellulose is degraded by the synergistic action of various types of cellulases (endo-glucanases, exo-glucanases or cellobiohydrolases, and β-glucosidases), which generate short-chain oligosaccharides, cellobiose, and glucose [16,17,18]. Besides the advances in biomass-degrading enzymes, bioreactor design and optimization developments regarding the utilization of cellulosic materials and food industry wastes have significantly improved process efficiency for energy production, mainly in the form of biogas in the case of anaerobic treatment. However, the greatest challenge for the production of a new generation of biofuels, such as bioethanol, biodiesel, biobutanol, etc., is the development of robust, high-yielding microbes and processes for their production [19,20,21]. The optimization of fermentation media and conditions is also of primary importance towards sustainability.
The diverse combinatorial interactions of medium components with cell metabolism do not permit satisfactory modeling of such processes. One-dimensional research with successive variations in variables is still employed, although it is not practically expected to achieve an appropriate optimum in a finite number of experiments [22]. Response surface methodology (RSM) is an important method for the investigation and optimization of multivariate processes which combines mathematical and statistical tools to study the effects of several factors requiring a small number of experiments to investigate their possible interactions. Central composite design (CCD) is a widely used RSM when upper and lower limits of each factor are set for an experimental design [23]. The significant interactions between variables and the combination of factors generating a certain optimal response can be identified. In addition, an equation (linear, polynomial, etc.) is obtained that can act as a predictive tool for the chosen response.
In previous studies, it was shown that methane [24], alcoholic [25], and acidogenic fermentation [12,26] could be promoted in the presence of porous materials, such as γ-alumina and kissiris [6,7,8,27], which at the same time acted as culture immobilization carriers facilitating continuous processing. In the case of anaerobic acidogenic fermentation, the results showed that, at selected process conditions (initial sugar concentration, pH, temperature, type of substrate), and modes of operation (batch or continuous, with or without effluent recycling), the anaerobic acidogenesis can lead to products with different compositions of organic acids and ethanol, which allows the possibility to produce different types of ester-based new generation biofuels. The aim of the present work was to derive a predictive model based on response surface methodology, which would be utilized as a tool to predict fermentation results when pretreated lignocellulosic biomass is used as a substrate. Therefore, cellobiose (the disaccharide of cellulose) was used as a model substrate. The results from this research were the cornerstone for the subsequent experimentation with cellulose hydrolysates as raw materials for ester-based biofuels [12]. Examination of the effect of three parameters, which play an important role in the anaerobic fermentation, was studied with the aid of RSM. A CCD was employed to examine the effect of fermentation temperature, initial pH, and cellobiose concentration. These parameters may have a significant impact on the anaerobic fermentation process in general as well as on the type of microorganisms of the mixed anaerobic cultures that will prevail finally, in order to obtain the best result from the acidogenesis point of view [28].

2. Materials and Methods

2.1. Culture and Growth Media

Mixed anaerobic bacteria culture obtained from an up-flow anaerobic sludge blanket (UASB) reactor [6,7,12], treating molasses, was used to inoculate the growth medium containing: 50 g/L cellobiose, aqueous solution of NH3, and 50% H3PO4 (COD:N:P ratio of 100:5:1), 4 g/L NaHCO3, and 4 g/L yeast extract, without pH adjustment [24]. The medium was sterilized by autoclaving at 120 °C for 15 min. Cell growth was carried out at 37 °C overnight.

2.2. Cell Immobilization and Anaerobic Acidogenic Fermentation

Cell immobilization was carried out in conical flasks containing 50 g of γ-alumina pellets and a 70-mL growth medium. The γ-alumina pellets, which were used in this study, are characterized by an average length of 5.2 mm, surface area of 290 m2/g, and an average pore diameter of 7.8 nm. The system was left to ferment at 37 °C for 48 h without feeding in order to achieve immobilization of the cells on the biomass carriers [8]. Subsequently, the growth medium was decanted and a fresh synthetic medium was added for anaerobic fermentation experiments, which contained: cellobiose 30–70 g/L, the aqueous solution of NH3, and 50% H3PO4 (COD:N:P ratio of 100:5:1), 4 g/L of NaHCO3, and 4 g/L of yeast extract. The pH was adjusted with 0.5 N of HCl to values from 5 to 9, as slightly acidic pH values promote hydrolysis, while a pH less than 5 is usually inhibitory for the anaerobic culture. Alkaline pH values until 8–10 have also proved to be beneficial due to increased buffering capacity and methanogenesis inhibition [28]. The medium was sterilized by autoclaving at 120 °C for 15 min. Fermentation experiments were carried out at three different temperatures (27, 37, and 47 °C) for 48 h. The tested temperatures belong to the mesophilic range, which is mainly chosen for VFAs production as high efficiency of the process has been observed [28]. The experimental procedure is presented in detail in Figure 1.

2.3. Scanning Electron Microscope Imaging

After freeze-drying for 48 h, the samples of immobilized anaerobic mixed culture cells on γ-alumina were coated with gold (Blazers SCD 004 Sputter Coater) for 3 min to increase the electrical conductivity. Subsequently, scanning electron microscope (SEM) (JEOL model JSM-6300) imaging followed.

2.4. Organic Acids Analysis

The produced organic acids were analyzed by high-performance liquid chromatography (HPLC), on a Jasco LC-2000 Plus chromatograph (Jasco Inc., Tokyo, Japan), equipped with a Bio-rad Aminex HPX-87H column (300 × 7.8 mm, 9 μm particle size), a CO-2060 Plus column oven, an AS-2050 autosampler, a PU-2089 quaternary gradient pump, and an MD-2018 photodiode array detector. Isocratic separation at 50 °C with 0.008 N of H2SO4 and a mobile phase at a flow rate of 0.6 mL/min were performed, and all the data were processed with the ChromNav software (Jasco, 2010, Tokyo, Japan). The samples were filtered with a disposable cellulose acetate syringe filter (CHROMAFIL) of a 0.20-μm pore size. All determinations were performed by means of standard curves.

2.5. Experimental Design and Statistical Analysis

The production of organic acids was calculated as a function of the levels of the three independent variables (temperature, initial pH value, and cellobiose concentration) with a significant influence on the response variables. Each parameter had three levels: the maximum value (+1), the minimum (−1), and the center point (0), as shown in Table 1.
A second-order polynomial equation, which includes all interaction terms, was used to predict the response:
Y = β 0 + i k β i X i + i i k β i i X 2 i + i < j β i j X i X j
In this equation, Y represents the predicted response, i.e., organic acids production from the anaerobic fermentation of cellobiose (both expressed in g/L), β0 is the intercept, βi is the first order coefficient, βj is the second-order coefficient, βij is the coefficient of an interaction effect, and Xi, Xj are the coded levels of variables Xi and Xj investigated in the experiment. The variable Xi was coded as xi according to the equation:
xi = (Xi − X0)/ΔΧi
where xi is the coded value of the variable Xi (dimensionless), X0 is the value of Xi at the center point level, and the step change value ΔΧi = (high level − low level)/2. Coding is required since the factors are expressed in different units.
CCD is a useful design to acquire data to fit the above polynomial. A 23 full factorial design with six replicates at the center point resulting in 20 experiments was used to investigate the three selected variables (i.e., temperature, initial pH value, and cellobiose) for the determination of the fermentation conditions for the total organic acids production. The levels of the variables were chosen after a series of preliminary experiments. The experiments were designed using the Statistica software package (StatSoft Inc., Tulsa, OK, USA). The experimental design is presented in Table 2 and was repeated in three replications.
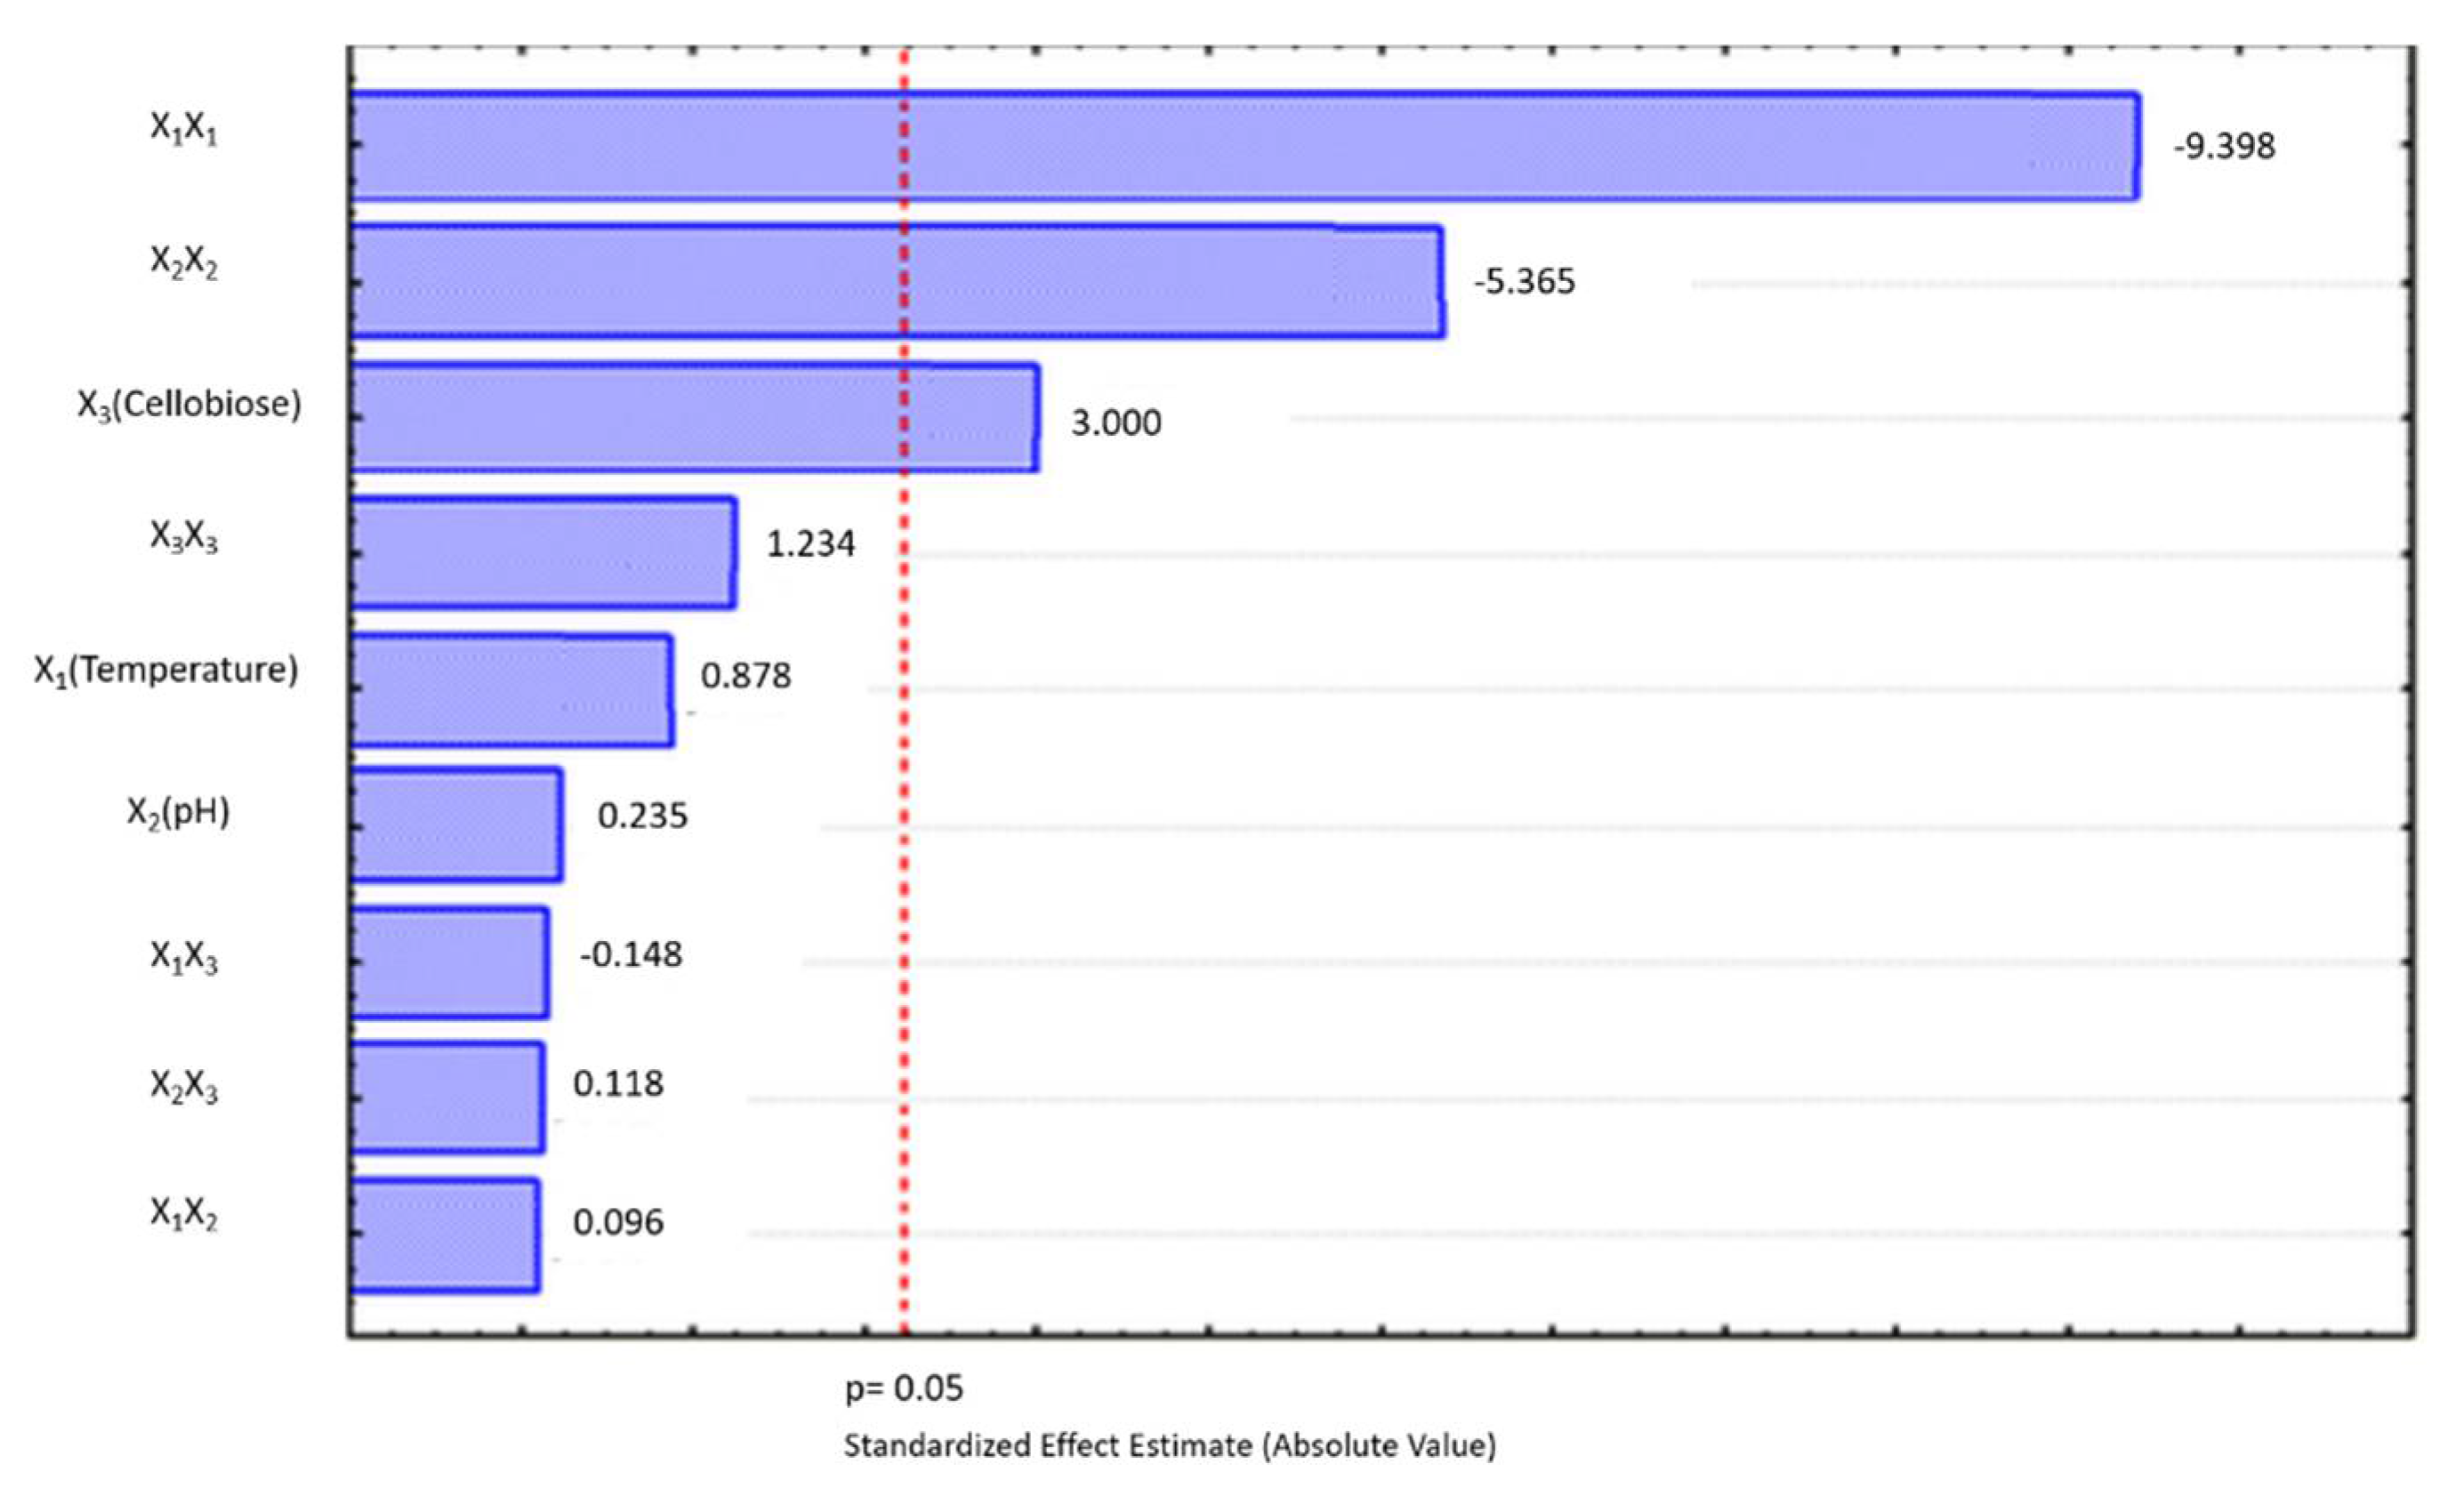
The experimental data were subjected to multiple regression analysis using the STATISTICA software package to obtain the coefficients of the second-order polynomial. The F-test was used to evaluate if the model was significant. The determination coefficient R2 was calculated to evaluate the performance of the regression equation. Statistical testing of the model was carried out in the form of analysis of variance (ANOVA), which is required to test the significance and adequacy of the model. In the Pareto plot of standardized effects, the important effects are visually identified. The bars correspond to the absolute magnitudes of the estimated effect coefficients. An effect that exceeds the vertical line (p = 0.05) may be considered significant.

3. Results and Discussion

3.1. Cell Immobilization

SEM images (Figure 2) were used in order to observe and evaluate the immobilization of the mixed anaerobic culture cells on the γ-alumina pellets. Elsewhere, γ-Alumina has been tested successfully for the immobilization of pure cultures, providing higher efficiency of the process as the concentration of the final product increased significantly [6,7,12,13]. The cells’ immobilization is probably performed by their attachment on the γ-alumina surface due to the electrostatic interactions between the cell membrane and the vector surface. As γ-alumina is classified as a porous material, cells entrapment is favored, thus providing a large surface area for cells and medium interaction [29,30]. The images in Figure 2 confirm the immobilization of the cells on the entire surface of γ-alumina. Successful immobilization is considered of great importance in order to achieve a robust system [30] and, more specifically, a stable biocatalyst, which usually leads to significantly decreased fermentation time requirements, increased process efficiency, and functionality.

3.2. Anaerobic Acidogenic Fermentation

The goodness of fit of the regression equation was evaluated by the determination coefficient (R2). The value of determination R2 (0.98) indicates that the response model could explain 98% of the total variations. The value of the adjusted determination coefficient (RAdj2 = 0.97) was high enough to indicate the significance of the model. According to the ANOVA of the regression model, the F-test for the regression was significant at a level of 5% (p < 0.05). The coefficients of the regression equation were calculated and the following regression equation was obtained:
Organic acids (g/L) = −84.30 + 3.36 X1 + 8.16X2 + 0.30X3 − 0.045X12 − 0.58X22 − 2.52E − 003X32 + 1.62E − 003X1X2 − 2.5E − 004X1X3 + 1E − 003X2X3.
ANOVA of the quadratic regression model demonstrates that the model is highly significant, as is evident from the Fisher’s F-test with a very low probability value (Table 3). At the same time, the relatively low value coefficient of variation (CV = 4.99%) indicates a better precision and reliability of the experiments carried out.
The standardized effects of the independent variables and their interactions on the dependent variable were investigated by preparing the Pareto Chart (Figure 3). Positive coefficients for the model components (X1, X2, X3, X32, X2X3, X1X2) showed a favorable or synergistic effect on organic acids production, while negative coefficients (X12, X22, X1X3) for the model components indicated an unfavorable effect. The quadratic effect of temperature was the most significant, followed by the quadratic effect of initial pH value, and the linear effect of cellobiose concentration. A little variation in these aspects will alter the organic acids production to a considerable effect. The fact that the bars of all interactions among the independent factors remained inside the reference line indicates that these terms contribute the least in the prediction of organic acids production by the mixed anaerobic culture.
In order to visually compare predicted and observed data, predicted values are plotted against actual measurements, as shown in Figure 4. The results corroborated the validity of the model as also indicated by the calculated bias factor, which is a measure of the overall agreement between predicted and actual values. The model can be considered reliable for predicting organic acids production.
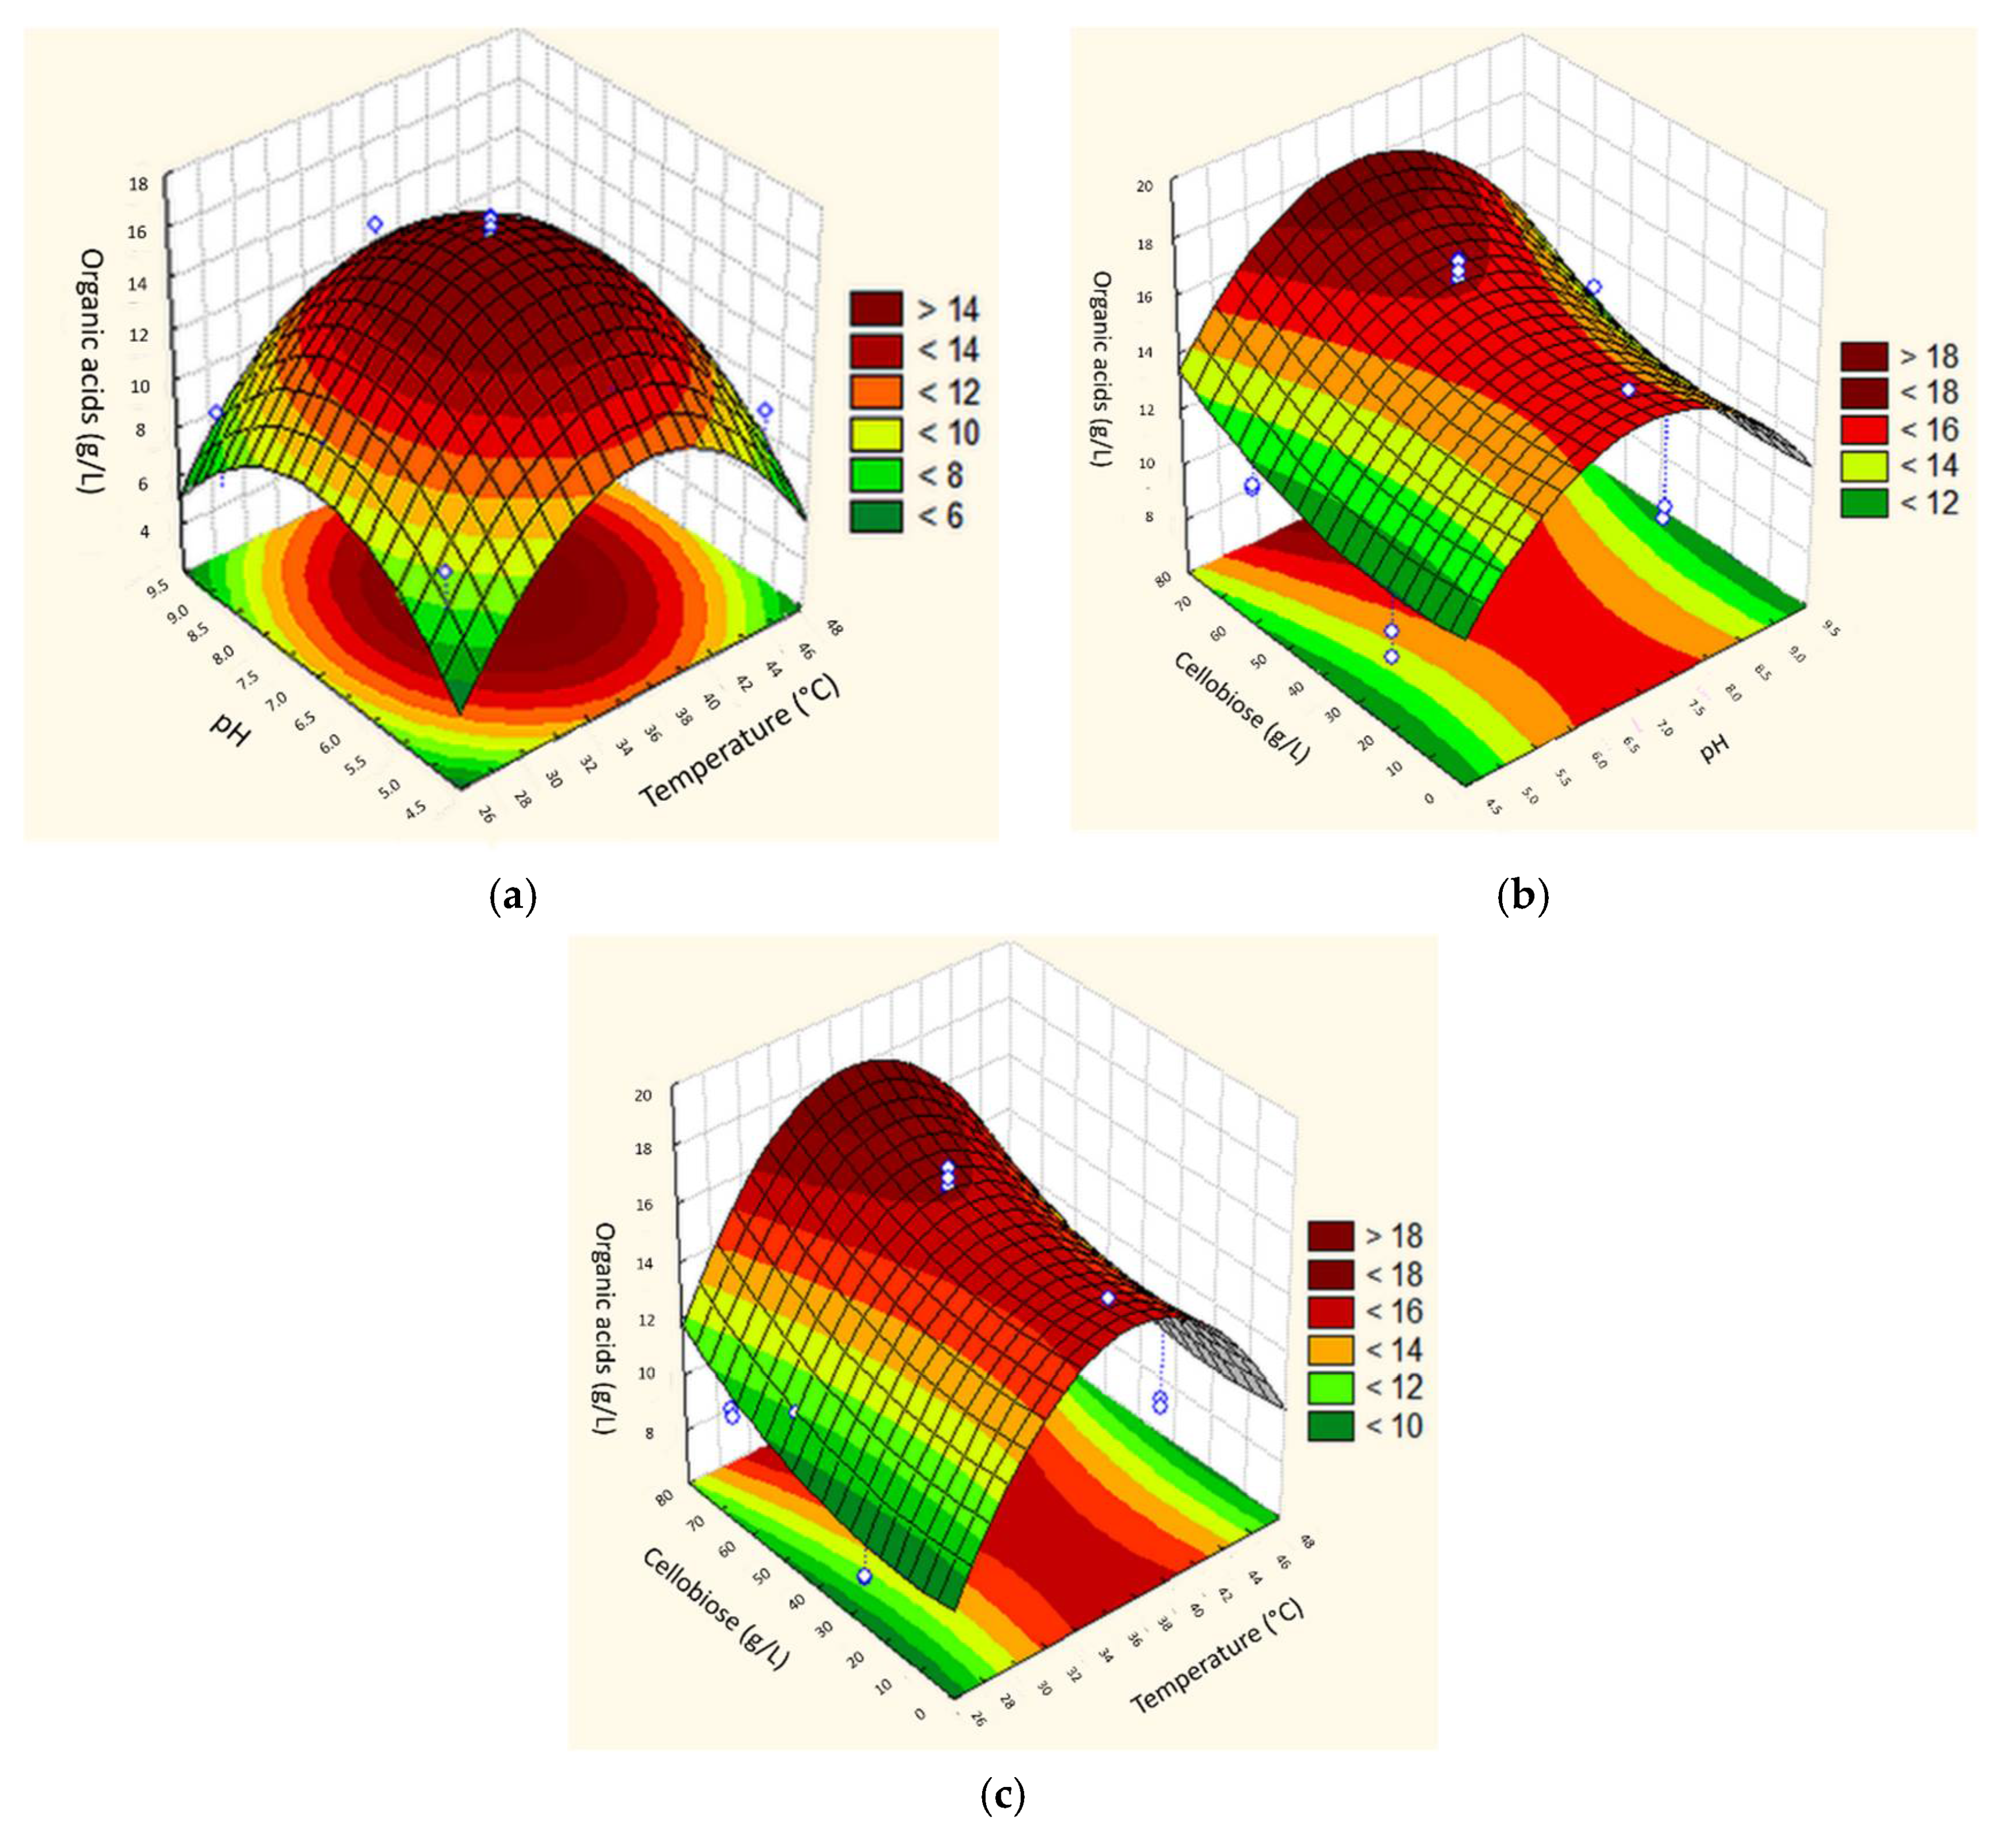
The contour and three-dimensional plots of interactions among the above variables are the graphical representations of the regression equation. Both plots are presented in the following figure (Figure 5). The main goal of the response surface is to efficiently determine the optimum values of variables such that the response is maximized. Each contour curve represents an infinite number of combinations of two test variables with the third one maintained at the zero level. The maximum predicted value is indicated by the surface confined in the smallest ellipse in the contour diagram. The contour plots are not perfectly elliptical; this indicates that there are few interactions among the independent variables.
The predicted optimum levels of the tested variables were obtained by applying regression analysis of the obtained equation with Design Expert software (Version 6.0, Stat-Ease Inc., Minneapolis, MN, USA) statistical package. Optimization of maximum organic acid production within the set parameters is as follows: 37.27 °C, pH 7.04, and 60.34 g/L cellobiose, which corresponds to an estimated concentration of organic acids of 16.5 g/L. However, besides the maximization of the response, economic cost should also be taken into consideration in microbial fermentation assays for the future development of effective scale-up processes. On that account, it is desirable to set independent factors (cultivation parameters) in a range production area, preferably in minimum or low-cost values [31]. In the present study, the most preferable set of parameters combines a temperature at almost 37 °C (optimum for the mesophilic bacteria that perform the fermentation without further production of hydrogen), an initial pH of the broth at 8.57, which is convenient because there is no need to adjust the pH after preparation of the broth, and a lower cellobiose concentration, which means that it is possible to achieve high organic acids productivity with low presence of fermentable sugar.
The predicted value of the organic acids production, using the above-mentioned combinations, was 7.13 g/L. Verification of the predicted value was conducted by using the aforementioned conditions in five repeated inoculation experiments. The mean value of organic acid production was 7.89 g/L, which is in agreement with the predicted value, while the detected organic acids were mainly lactate, butyrate, acetate, propionate and succinate.
It should be mentioned that subsequent experimentation with 3 wt% pretreated lignocellulosic biomass (wheat straw) as the sole carbon source and the optimal pH and temperature, resulted in the production of 7.45 ± 1.18 g/L total organic acids. The obtained concentration was almost two-fold higher compared with the results from acidogenic fermentation conducted with free cells (3.96 ± 0.93 g/L) [12]. Concerning the study of Adav et al. [32], a bacterial consortium obtained from a cattle feedlot manure composting plant was tested against various concentrations of cellobiose (2.5–20 g/L) for hydrogen production at pH 6.0 and mesophilic conditions. The increased cellobiose concentration led to different metabolic pathways, while the main products were usually ethanol, acetate, and butyrate, followed by lower amounts of propionate and formate. Additionally, the thermophilic dark fermentation of cellobiose by an enriched mixed culture was studied by Varanasi et al. [33]. The main products of the process were acetate, butyrate, and ethanol with a maximum total concentration of about 4 g/L, which is less than the organic acids produced in the current study, probably due to the absence of biomass carriers, while thermophilic conditions inevitably lead to higher operating costs. Pure cultures have also been tested for the efficient fermentation of cellobiose at pH 5.5 under mesophilic conditions. More specifically, for the case of Clostridium acetobutylicum ATCC 824, the fermentation resulted mainly in butyrate (up to 7 g/L) and acetate (up to 2.4 g/L) production, while low amounts of lactate and butanol were measured [34].
Most of the aforementioned products were also observed in our study, while succinic acid is usually characterized as less common. Lignocellulosic substrates after degradation have been tested for succinate production by pure microorganisms. such as Esherichia coli, Actinobacillus succinogenes, and Anaerobiospirillum succinoproducens. The presence of enzymes which act synergistically is of great importance for succinic acid production [35]. Additionally, it was observed that succinic acid was efficiently produced after the alkaline pretreatment and solid-state fermentation of corn fiber, but its production increased when cellulase was added in addition to cellobiose [36].

4. Conclusions

The use of an experimental design with the main aim to reveal the influence of fermentation conditions allowed the rapid screening of a large experimental domain in search of a prediction model for organic acids production by the anaerobic acidogenic fermentation of cellobiose. Cellobiose was used as a model substrate for further experiments with delignified straw or another cellulosic biomass. The results of five repeated experiments at a defined set of factor values corroborated the validity of the model, while the latter can be considered reliable for predicting the production of organic acids. According to the analysis, maximization of the organic acid production can be obtained at 37.27 °C, pH 7.04, and 60.34 g/L cellobiose, while for a cost-effective operation the parameters could be adjusted at 36.10 °C, pH 8.57, and 3.26% (32.6 g/L), resulting in a mean value of organic acid production of 7.89 g/L.

Author Contributions

Conceptualization, A.B., A.A.K. and M.K.; methodology, P.T.; writing—original draft preparation, P.T. and K.T.; writing—review and editing, A.B.; supervision, A.A.K., A.B. and M.K.; funding acquisition, A.A.K., A.B. and M.K. All authors have read and agreed to the published version of the manuscript.

Funding

This research was funded by the European Union (European Regional Development Fund–ERDF) and Greek National Funds through the Operational Program “Competitiveness and Entrepreneurship” of the National Strategic Reference Framework (NSRF) 2007–2013—National Action “Cooperation 2011: Partnerships of Production and Research Institutions in Focused Research and Technology Sectors” of General Secretariat for Research and Technology, grant number 11SYN-8-839.

Institutional Review Board Statement

Not applicable.

Informed Consent Statement

Not applicable.

Data Availability Statement

Data is contained within the article.

Conflicts of Interest

The authors declare no conflict of interest. The funders had no role in the design of the study; in the collection, analyses, or interpretation of data; in the writing of the manuscript, or in the decision to publish the results.

References

  1. Menon, V.; Rao, M. Trends in bioconversion of lignocellulose: Biofuels, platform chemicals & biorefinery concept. Prog. Energy Combust. Sci. 2012, 38, 522–550. [Google Scholar]
  2. Deng, W.; Zhang, Q.; Wang, Y. Catalytic transformations of cellulose and cellulose-derived carbohydrates into organic acids. Catal. Today 2014, 234, 31–41. [Google Scholar] [CrossRef]
  3. Sanna, A. Advanced biofuels from thermochemical processing of sustainable biomass in Europe. BioEnergy Res. 2014, 7, 36–47. [Google Scholar] [CrossRef]
  4. Fontanille, P.; Kumar, V.; Christophe, G.; Nouaille, R.; Larroche, C. Bioconversion of volatile fatty acids into lipids by the oleaginous yeast Yarrowia lipolytica. Bioresour. Technol. 2012, 114, 443–449. [Google Scholar] [CrossRef] [PubMed]
  5. De La Rubia, M.A.; Raposo, F.; Rincón, B.; Borja, R. Evaluation of the hydrolytic–acidogenic step of a two-stage mesophilic anaerobic digestion process of sunflower oil cake. Bioresour. Technol. 2009, 100, 4133–4138. [Google Scholar] [CrossRef] [PubMed]
  6. Syngiridis, K.; Bekatorou, A.; Kallis, M.; Kandylis, P.; Kanellaki, M.; Koutinas, A.A. γ-Alumina as a process advancing tool for a new generation biofuel. Bioresour. Technol. 2013, 132, 45–48. [Google Scholar] [CrossRef]
  7. Syngiridis, K.; Bekatorou, A.; Kandylis, P.; Larroche, C.; Kanellaki, M.; Koutinas, A.A. Favouring butyrate production for a new generation biofuel by acidogenic glucose fermentation using cells immobilised on γ-alumina. Bioresour. Technol. 2014, 161, 118–123. [Google Scholar] [CrossRef]
  8. Lappa, K.; Kandylis, P.; Bekatorou, A.; Bastas, N.; Klaoudatos, S.; Athanasopoulos, N.; Kanellaki, M.; Koutinas, A.A. Continuous acidogenesis of sucrose, raffinose and vinasse using mineral kissiris as promoter. Bioresour. Technol. 2015, 188, 43–48. [Google Scholar] [CrossRef]
  9. Koutinas, A.; Kanellaki, M.; Bekatorou, A.; Kandylis, P.; Pissaridi, K.; Dima, A.; Boura, K.; Lappa, K.; Tsafrakidou, P.; Stergiou, P.-Y.; et al. Economic evaluation of technology for a new generation biofuel production using wastes. Bioresour. Technol. 2016, 200. [Google Scholar] [CrossRef]
  10. Li, Y.; Chen, Y.; Wu, J. Enhancement of methane production in anaerobic digestion process: A review. Appl. Energy 2019, 240, 120–137. [Google Scholar] [CrossRef]
  11. Tomei, M.C.; Braguglia, C.M.; Cento, G.; Mininni, G. Modeling of anaerobic digestion of sludge. Crit. Rev. Environ. Sci. Technol. 2009, 39, 1003–1051. [Google Scholar] [CrossRef]
  12. Tsafrakidou, P.; Bekatorou, A.; Koutinas, A.A.; Kordulis, C.; Banat, I.M.; Petsi, T.; Sotiriou, M. Αcidogenic fermentation of wheat straw after chemical and microbial pretreatment for biofuel applications. Energy Convers. Manag. 2018, 160, 509–517. [Google Scholar] [CrossRef]
  13. Kandylis, P.; Bekatorou, A.; Pissaridi, K.; Lappa, K.; Dima, A.; Kanellaki, M.; Koutinas, A.A. Acidogenesis of cellulosic hydrolysates for new generation biofuels. Biomass Bioenergy 2016, 91, 210–216. [Google Scholar] [CrossRef]
  14. Liang, J.; Nabi, M.; Zhang, P.; Zhang, G.; Cai, Y.; Wang, Q.; Zhou, Z.; Ding, Y. Promising biological conversion of lignocellulosic biomass to renewable energy with rumen microorganisms: A comprehensive review. Renew. Sustain. Energy Rev. 2020, 134, 110335. [Google Scholar] [CrossRef]
  15. Harris, D.; DeBolt, S. Synthesis, regulation and utilization of lignocellulosic biomass. Plant Biotechnol. J. 2010, 8, 244–262. [Google Scholar] [CrossRef]
  16. Bajpai, P. Structure of lignocellulosic biomass. In Pretreatment of Lignocellulosic Biomass for Biofuel Production; Springer: Berlin/Heidelberg, Germany, 2016; pp. 7–12. [Google Scholar]
  17. Bansal, P.; Hall, M.; Realff, M.J.; Lee, J.H.; Bommarius, A.S. Modeling cellulase kinetics on lignocellulosic substrates. Biotechnol. Adv. 2009, 27, 833–848. [Google Scholar] [CrossRef] [PubMed]
  18. Juturu, V.; Wu, J.C. Microbial cellulases: Engineering, production and applications. Renew. Sustain. Energy Rev. 2014, 33, 188–203. [Google Scholar] [CrossRef]
  19. Fischer, C.R.; Klein-Marcuschamer, D.; Stephanopoulos, G. Selection and optimization of microbial hosts for biofuels production. Metab. Eng. 2008, 10, 295–304. [Google Scholar] [CrossRef] [PubMed]
  20. Anandharaj, S.J.; Gunasekaran, J.; Udayakumar, G.P.; Meganathan, Y.; Sivarajasekar, N. Biobutanol: Insight, Production and Challenges. Sustain. Dev. Energy Environ. 2020, 25–37. [Google Scholar] [CrossRef]
  21. Kumar, M.; Rathour, R.; Gupta, J.; Pandey, A.; Gnansounou, E.; Thakur, I.S. 2—Bacterial production of fatty acid and biodiesel: Opportunity and challenges. In Refining Biomass Residues for Sustainable Energy and Bioproducts; Academic Press: Cambridge, MA, USA, 2020; pp. 21–49. [Google Scholar] [CrossRef]
  22. Francis, F.; Sabu, A.; Nampoothiri, K.M.; Ramachandran, S.; Ghosh, S.; Szakacs, G.; Pandey, A. Use of response surface methodology for optimizing process parameters for the production of α-amylase by Aspergillus oryzae. Biochem. Eng. J. 2003, 15, 107–115. [Google Scholar] [CrossRef]
  23. Neter, J.; Kutner, M.H.; Nachtsheim, C.J.; Wasserman, W. Applied Linear Statistical Models; McGraw-Hill: New York, NY, USA, 1996. [Google Scholar]
  24. Koutinas, A.A.; Toutoutzidakis, G.; Kana, K.; Kouinis, I. Methane fermentation promoted by γ-alumina pellets. J. Ferment. Bioeng. 1991, 72, 64–67. [Google Scholar] [CrossRef]
  25. Kanellaki, M.; Koutinas, A.A.; Kana, K.; Nicolopoulou, M.; Papadimitriou, A.; Lycourghiotis, A. Ethanol production by Saccharomyces cerevisiae promoted by γ-alumina. Biotechnol. Bioeng. 1989, 34, 121–125. [Google Scholar] [CrossRef] [PubMed]
  26. Boura, K.; Kandylis, P.; Bekatorou, A.; Kolliopoulos, D.; Vasileiou, D.; Panas, P.; Kanellaki, M.; Koutinas, A.A. New generation biofuel from whey: Successive acidogenesis and alcoholic fermentation using immobilized cultures on γ-alumina. Energy Convers. Manag. 2017, 135, 256–260. [Google Scholar] [CrossRef]
  27. Dima, A.; Boura, K.; Bekatorou, A.; Stergiou, P.-Y.; Foukis, A.; Gkini, O.A.; Kandylis, P.; Pissaridi, K.; Kanellaki, M.; Papamichael, E.M.; et al. Scale-up for esters production from straw whiskers for biofuel applications. Bioresour. Technol. 2017, 242, 109–112. [Google Scholar] [CrossRef] [PubMed]
  28. Ramos-Suarez, M.; Zhang, Y.; Outram, V. Current perspectives on acidogenic fermentation to produce volatile fatty acids from waste. Rev. Environ. Sci. Bio/Technol. 2021, 1–40. [Google Scholar] [CrossRef]
  29. Al-Amshawee, S.; Yunus, M.Y.B.M. Geometry of biofilm carriers: A systematic review deciding the best shape and pore size. Groundw. Sustain. Dev. 2020, 12, 100520. [Google Scholar] [CrossRef]
  30. Lu, J.; Peng, W.; Lv, Y.; Jiang, Y.; Xu, B.; Zhang, W.; Zhou, J.; Dong, W.; Xin, F.; Jiang, M. Application of cell immobilization technology in microbial cocultivation systems for biochemicals production. Ind. Eng. Chem. Res. 2020, 59, 17026–17034. [Google Scholar] [CrossRef]
  31. Breig, S.J.M.; Luti, K.J.K. Response surface methodology: A review on its applications and challenges in microbial cultures. Mater. Today Proc. 2021, 42, 2277–2284. [Google Scholar] [CrossRef]
  32. Adav, S.S.; Lee, D.-J.; Wang, A.; Ren, N. Functional consortium for hydrogen production from cellobiose: Concentration-to-extinction approach. Bioresour. Technol. 2009, 100, 2546–2550. [Google Scholar] [CrossRef]
  33. Varanasi, J.L.; Roy, S.; Pandit, S.; Das, D. Improvement of energy recovery from cellobiose by thermophillic dark fermentative hydrogen production followed by microbial fuel cell. Int. J. Hydrog. Energy 2015, 40, 8311–8321. [Google Scholar] [CrossRef]
  34. Buendia-Kandia, F.; Rondags, E.; Framboisier, X.; Mauviel, G.; Dufour, A.; Guedon, E. Diauxic growth of Clostridium acetobutylicum ATCC 824 when grown on mixtures of glucose and cellobiose. AMB Express 2018, 8, 1–9. [Google Scholar] [CrossRef] [PubMed]
  35. Akhtar, J.; Idris, A.; Aziz, R.A. Recent advances in production of succinic acid from lignocellulosic biomass. Appl. Microbiol. Biotechnol. 2014, 98, 987–1000. [Google Scholar] [CrossRef] [PubMed]
  36. Zheng, P.; Fang, L.; Xu, Y.; Dong, J.-J.; Ni, Y.; Sun, Z.-H. Succinic acid production from corn stover by simultaneous saccharification and fermentation using Actinobacillus succinogenes. Bioresour. Technol. 2010, 101, 7889–7894. [Google Scholar] [CrossRef] [PubMed]
Figure 1. Experimental procedure of cell growth, cell immobilization on γ-alumina pellets, and anaerobic acidogenic fermentation.
Processes 09 01441 g001
Figure 2. SEM images of the immobilized mixed anaerobic culture cells on γ-alumina pellets.
Processes 09 01441 g002
Figure 3. Standardized effect of temperature (X1), initial pH value (X2), and cellobiose concentration (X3) in the fermentation broth used for organic acids production by a mixed anaerobic culture.
Processes 09 01441 g003
Figure 4. Observed versus actual values of organic acids production according to the experimental design for the mixed anaerobic culture.
Processes 09 01441 g004
Figure 5. Response surface plot and corresponding contour plot for organic acids production by mixed anaerobic culture, showing (a) the effect on the response of the initial broth pH and fermentation temperature, (b) the effect on the response of the cellobiose concentration and the initial pH of the broth and (c) the effect on the response of the cellobiose concentration of the broth and the fermentation temperature.
Processes 09 01441 g005
Table 1. Factors, codes and actual levels for design of the present research experiment.
Independent VariablesUnitsSymbolCoded Levels
−101
Temperature°CX1273747
Initial pH X2579
Cellobioseg/LX3305070
Table 2. Experimental design (CCD) and results of total organic acids production by the mixed anaerobic culture at 48 h of fermentation [Data are shown as mean ± standard deviation of three replications. Means with different superscript letters are different by Tukey’s test (p < 0.05)].
Run OrderVariablesTotal Organic Acids
X1X2X3Experimental Results (g/L)Prediction (g/L)
1−1−1−17.03 a±0.16.95
21−1−17.91 b±0.137.52
3−11−17.06 a±0.276.95
411−17.56 c±0.127.64
5−1−119.4 c±0.119.06
61−119.57 d±0.039.42
7−1119.08 e±0.339.22
81119.89 e±0.119.71
9−10011.01 f±0.0311.41
1010011.3 f,g±0.1611.94
110−1012.8 h±0.1313.76
1201013.83 h±0.113.90
1300−113.63 g±0.2214.13
1400115.69 g,h±0.1416.22
1500016.16 g±0.0816.19
1600016.97 g±0.2316.19
1700016.92 g,h±0.1416.19
1800016.3 g±0.1516.19
1900016.6 g,h±0.1716.19
2000016.24 g±0.116.19
Table 3. ANOVA of quadratic model.
SourceSum of SquaresDegrees of FreedomMean SquareF-ValueProb (P) > F
Model251.8004927.9778274.87511<0.0001
Residual3.736598100.37366
Lack of Fit3.11211550.6224234.9835030.0513
Pure Error0.62448350.124897
Total255.53719
R2 = 0.98, CV = 4.99%, RAdj2 = 0.97
Publisher’s Note: MDPI stays neutral with regard to jurisdictional claims in published maps and institutional affiliations.