Article

Optimal Design and Simulation Analysis of Spike Tooth Threshing Component Based on DEM

1
School of Biological and Agricultural Engineering, Jilin University, Changchun 130022, China
2
Key Laboratory of Bionic Engineering, Jilin University, Ministry of Education of China, Changchun 130022, China
*
Author to whom correspondence should be addressed.
Processes 2021, 9(7), 1163; https://doi.org/10.3390/pr9071163
Submission received: 1 June 2021 / Revised: 24 June 2021 / Accepted: 1 July 2021 / Published: 4 July 2021
(This article belongs to the Special Issue DEM Simulations and Modelling of Granular Materials)

Abstract

:
This paper takes a local drum-type corn thresher as an example. In order to make the threshing principle transform to the plate-tooth type, the width of the spike-tooth threshing component is increased gradually, and three threshing components of different shape and size are selected as the research objects. Based on the preliminary experimental research, the corn threshing process is simulation analyzed using the self-developed corn threshing process analysis software. The effects of the width of the threshing component on the corn ears threshing rate and kernel damage rate under different rates of drum rotation were studied from a macroscopic perspective. The results show that with the increase of drum rotation rate, both the corn ear threshing rate and kernel damage rate increase; with the increase of threshing component width, the threshing rate increases and the damage rate decreases; and when the component width is too large, the stacking between adjacent components has an impact on the threshing performance. The effects of threshing component width on the amount of kernel threshing and the total compressive force during the simulation time were investigated from microscopic perspective at different rates of drum rotation, and the results show that the microscopic analysis is consistent with the macroscopic analysis. Therefore, the optimization of the structural parameters and operating parameters of the threshing component was achieved. When the width of the threshing component was 25 mm and the roller speed was 187.50 rpm, the threshing performance was optimal, with a 98.04% corn ears threshing rate and a 2.56% kernel damage rate. This paper verifies the practical applicability of the corn threshing process analysis software and provides a reference for the optimal design of threshing devices.

1. Introduction

By revealing the law of influence of the core parameters of corn threshing elements on the kernel threshing and damage rates [1,2], it becomes a prerequisite and key to improve the quality of corn threshing operations [3,4]. The standard of corn kernel threshing rate and damage rate is 90% and 6% respectively (national industry standard of PRC). Corn threshing operation is a central part of corn production [5,6], and the operation quality directly determines corn yield and quality [7]. The core parameters of the threshing element are the contact width and the rotational speed [8,9], respectively, both of which determine the kinetic state of the corn kernels during threshing [10,11]. Therefore, if the quality of corn threshing operation is to be improved, the optimal combination of design parameter values for corn threshing elements needs to be optimized.
How to achieve accurate observation and analysis of the kinetic state of the corn kernel population during the threshing process is the central difficulty in the optimal design of corn threshing element parameters [12]. Currently, researchers commonly use empirical, experimental and analytical methods to study the kinetic state of corn kernels [13,14]. The aforementioned methods rely on a large number of tests and require processing of threshing elements with multiple parameters, which is too costly in terms of time and economy [15,16]. At the meantime, tests can only be conducted within a week of corn kernel maturity [17,18,19], making the test period too short for large-scale replication. Therefore, in recent years, researchers have begun to explore high-precision discrete element numerical simulation methods that can be used for the analysis of the kinetic state of corn kernel populations [20,21,22].
At present, discrete element numerical simulation methods on the kinetic state of corn kernel population can only consider the corn ears as a whole and cannot realize the simulation of corn threshing under the conditions of ears, cobs and kernels separation [23,24]. Qu et al. studied the spike-tooth threshing device using EDEM software and analyzed the overall force on the corn cob during the threshing process [20]. Kovacs et al. studied the combined harvesting process of corn plants using the discrete element method and analyzed the overall operation of the corn cob during the harvesting process [21]. All of the above studies provide some theoretical and data support for the optimal design of corn threshing element parameters, but the difficulty of the simulation process to restore the state of cob, core, and kernel separation in the actual operation leads to its inability to achieve a high precision simulation of the kinetic state of the corn kernel population during the threshing process [25,26].
In summary, this paper simulates the contact mechanics behavior between the corn ears, corn cobs, corn kernel populations and threshing elements using a linear damping mechanics model based on the self-developed discrete element simulation software for the corn threshing process. The proposed elastic–plastic bonding model and its fracture criterion were used to simulate the mechanical behavior and fracture process of the connection between the kernel and the corn cob, to achieve a high-precision simulation of the kinetic state of the corn kernel population during the threshing process, and then to reveal the influence of the core parameters of the corn threshing element on the kernel threshing rate and damage rate, and finally to optimize the optimal design parameter value combination of the corn threshing element.

2. Models and Methods

2.1. Experimental Method

The experiments in this paper are divided into two parts, which are simulation model accuracy calibration test and corn threshing simulation test. The simulation model accuracy calibration test consists of a bench test and a simulation test of the threshing element. The simulation test parameters are set at the same values as the bench test, and the accuracy of the simulation model is calibrated and verified by comparing the bench test data with the simulation test results. Based on the calibrated and validated simulation model, a corn threshing simulation test was conducted, with the contact width and rotational speed of the threshing element as the test factors and the kernel threshing rate and damage rate as the evaluation indexes. The contact width was set at four levels of 15 mm, 20 mm, 25 mm and 30 mm, and the rotational speed was set at four levels of 122.70 rpm, 187.50 rpm, 252.10 rpm and 317.15 rpm, for a total of 16 sets of tests, with each set of tests repeated five times. Finally, through the statistical analysis of the results of corn threshing simulation tests and the accurate observation and analysis of the kinetic state of the corn kernel population during the threshing process, the influence of contact width and rotational speed on the kernel threshing and damage rates were revealed, and the optimal combination of parameter values was optimized.

2.2. Corn Ear Numerical Model

The corn ears consist of corn kernels and corn cobs, where the kernels are closely spaced and connected to the cob by the kernel stalk. When threshing operations are carried out, the corn ears are subjected to external forces such as squeezing and rolling, striking or friction of the threshing device, and the kernels threshed from the corn cob and the cob is broken. Therefore, the corn threshing region contains a variety of materials such as corn ears, broken corn cobs, and shed corn kernels. The threshing process should consider not only the contact action between the materials, and between the materials and the threshing component, but also the mechanical behavior and fracture mechanism between the corn kernels and the corn cobs, and the bonding between the corn cobs [27,28].
According to the structure and morphology of the corn ears (Figure 1a), they are divided into three parts in the axial direction, namely, the first, middle and last parts, where the first and last parts of the ears are of small length and no longer subdivided, and the middle part could be subdivided into small parts along the axial direction of the ears. In the radial direction it can be divided by the number of rows of the corn ears into the corresponding number of blocks. The structure of the corn cob is similar to that of the corn ears (Figure 1b), dividing the corn cob in the axial and radial directions as well. The cross-section of the kernels in the middle part of the corn cob approximates a wedge shape (Figure 1c), while the irregular shape of the kernels in the upper and lower parts of the cob, which are also approximated as a wedge shape due to the small number of kernels, was modeled using a uniform modeling approach.
To simulate the damage of the corn ears, a bonding model was used to develop an analytical model of the corn cob. The smallest constituent unit of the model was the corn cob nugget, which was modeled by a multi-sphere model, where each constituent ball corresponds to a corn kernel [29,30]. In radial direction, the starting constituent balls of adjacent nuggets were bonded to produce each segment of corn cob. In axial direction, the first and last constituent balls of two adjacent segments of corn cob were bonded to produce the complete corn cob (Figure 1d). When the corn cob damage conditions were met, the bonding between the small pieces of corn cob was broken, thus allowing the corn cob to be broken into small pieces or a combination of several small pieces during threshing. A multi-sphere model was used to model the analysis of corn kernels (Figure 1e), and each kernel was combined using a certain number of single-layer balls. In order to simplify the algorithm, the corn kernels were no longer separated into balls, and the brokenness of the kernels is determined by calculating the external force applied to the kernels during threshing. To simulate the threshing of corn kernels, a bonding model was used to simulate the mechanical behavior between corn kernels and corn cobs. The established corn kernel numerical model was bonded to the corresponding corn cob composition spheres, and the kernels were threshed when the threshing conditions were met. The corn cob numerical model is shown in Figure 1f.

2.3. Corn Thresher Numerical Model

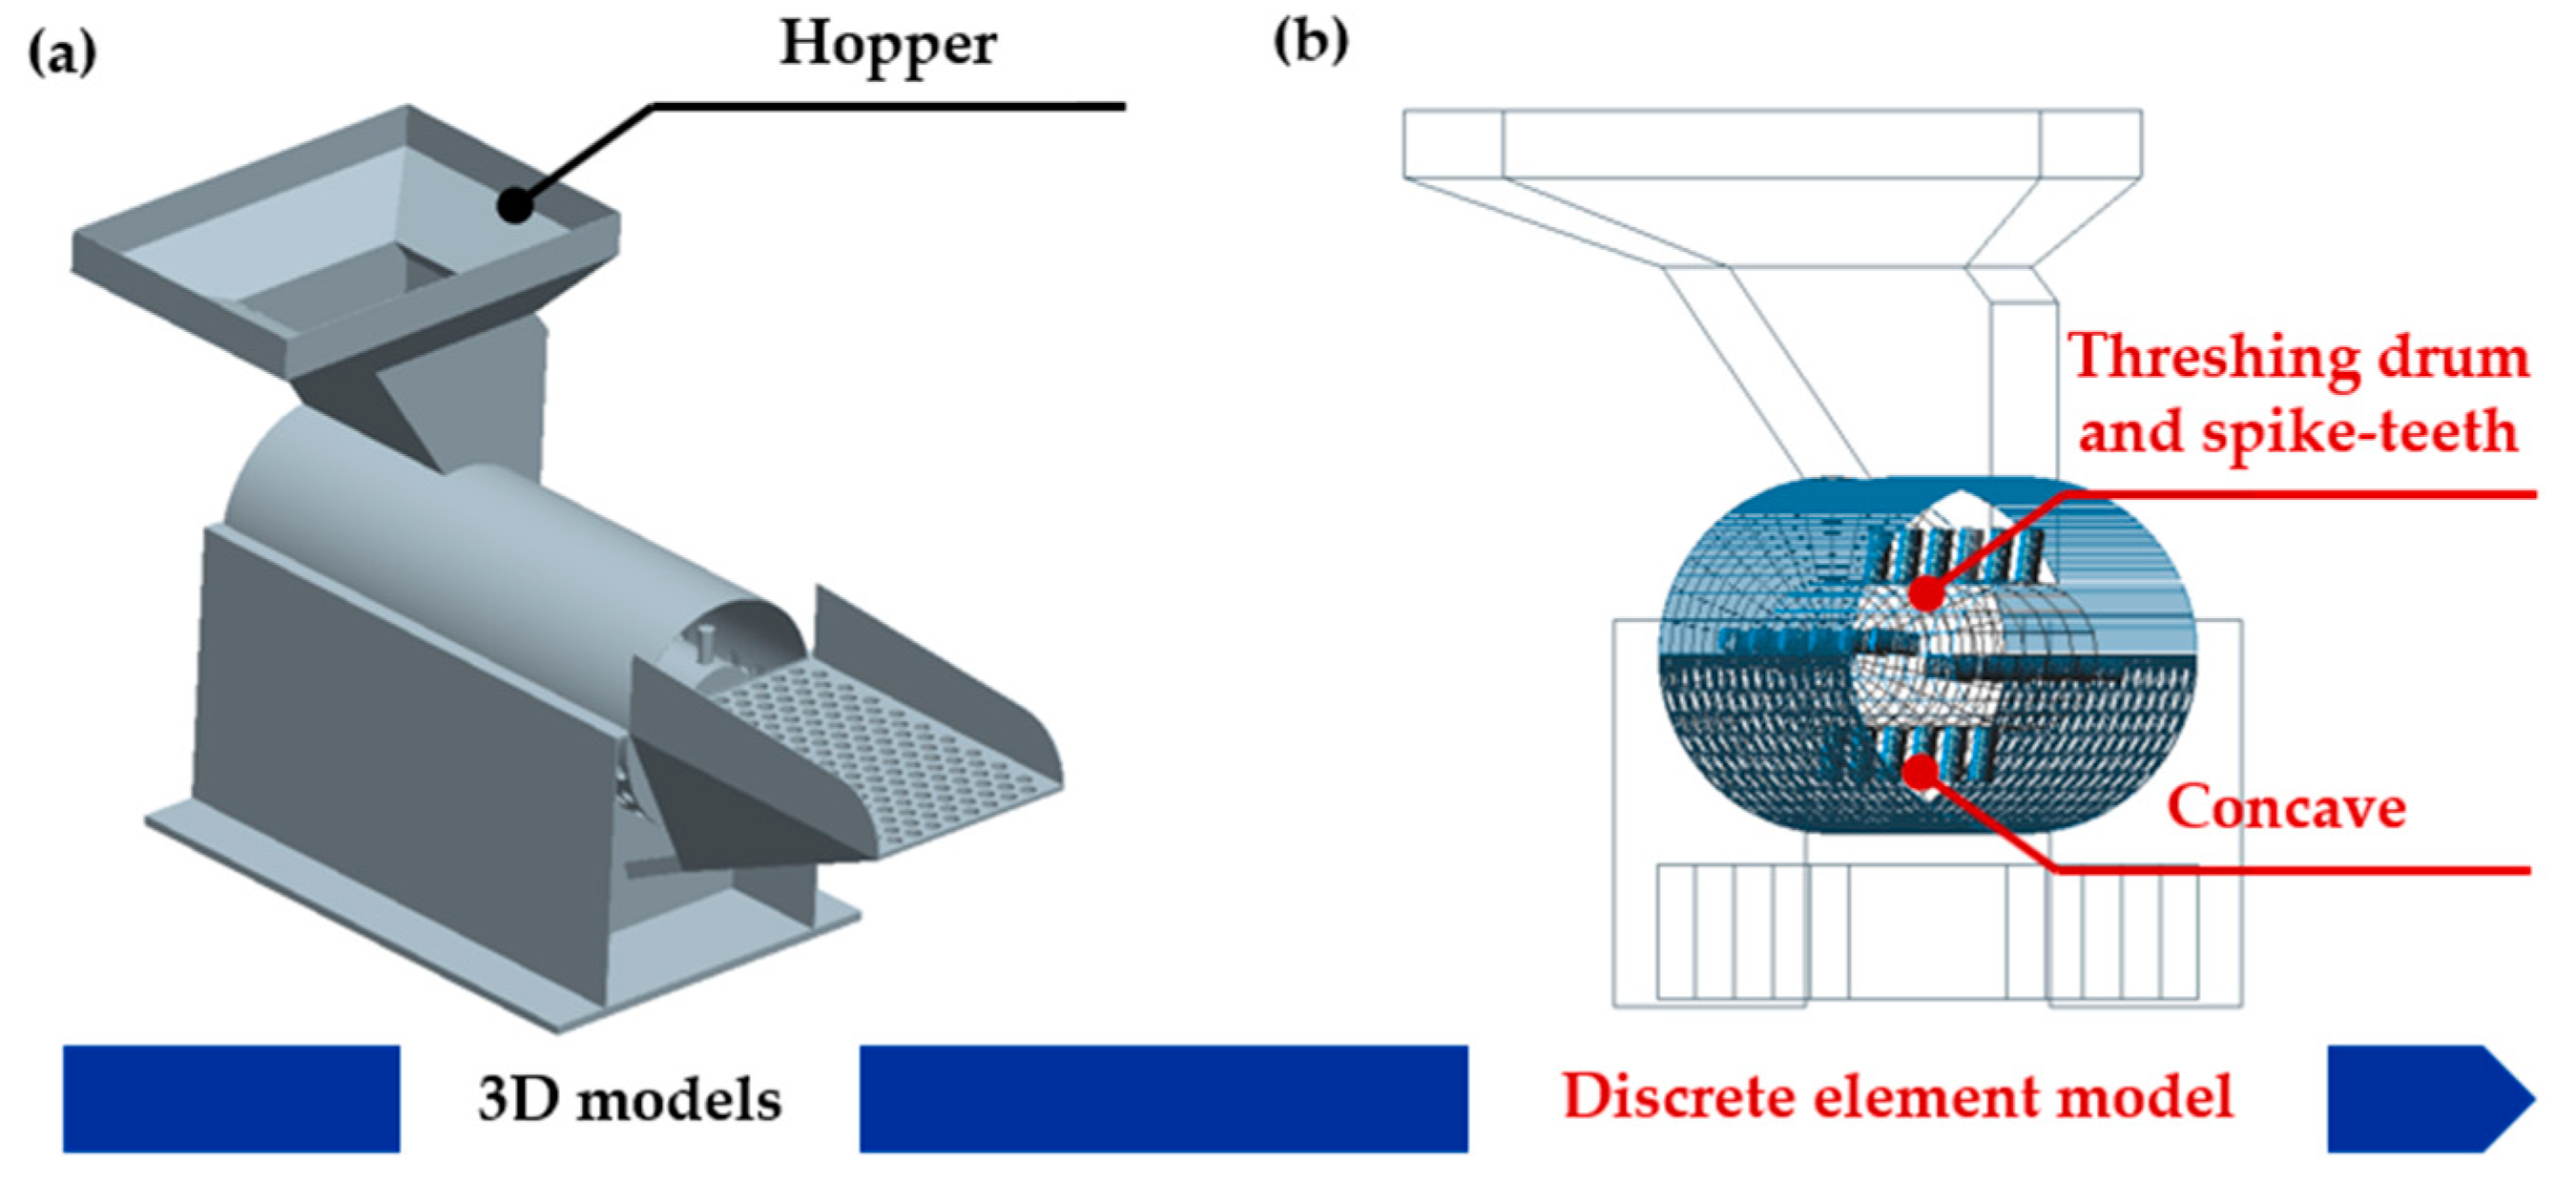
A local YT-3 drum type corn thresher is taken as an example, which is mainly composed of a feed box, a threshing drum and nail teeth, a concave plate and a cob discharge port, and its operating principle has been described in reference [12]. The proposed boundary modeling method [12] is used to build the numerical model from its 3D CAD model, as shown in Figure 2.
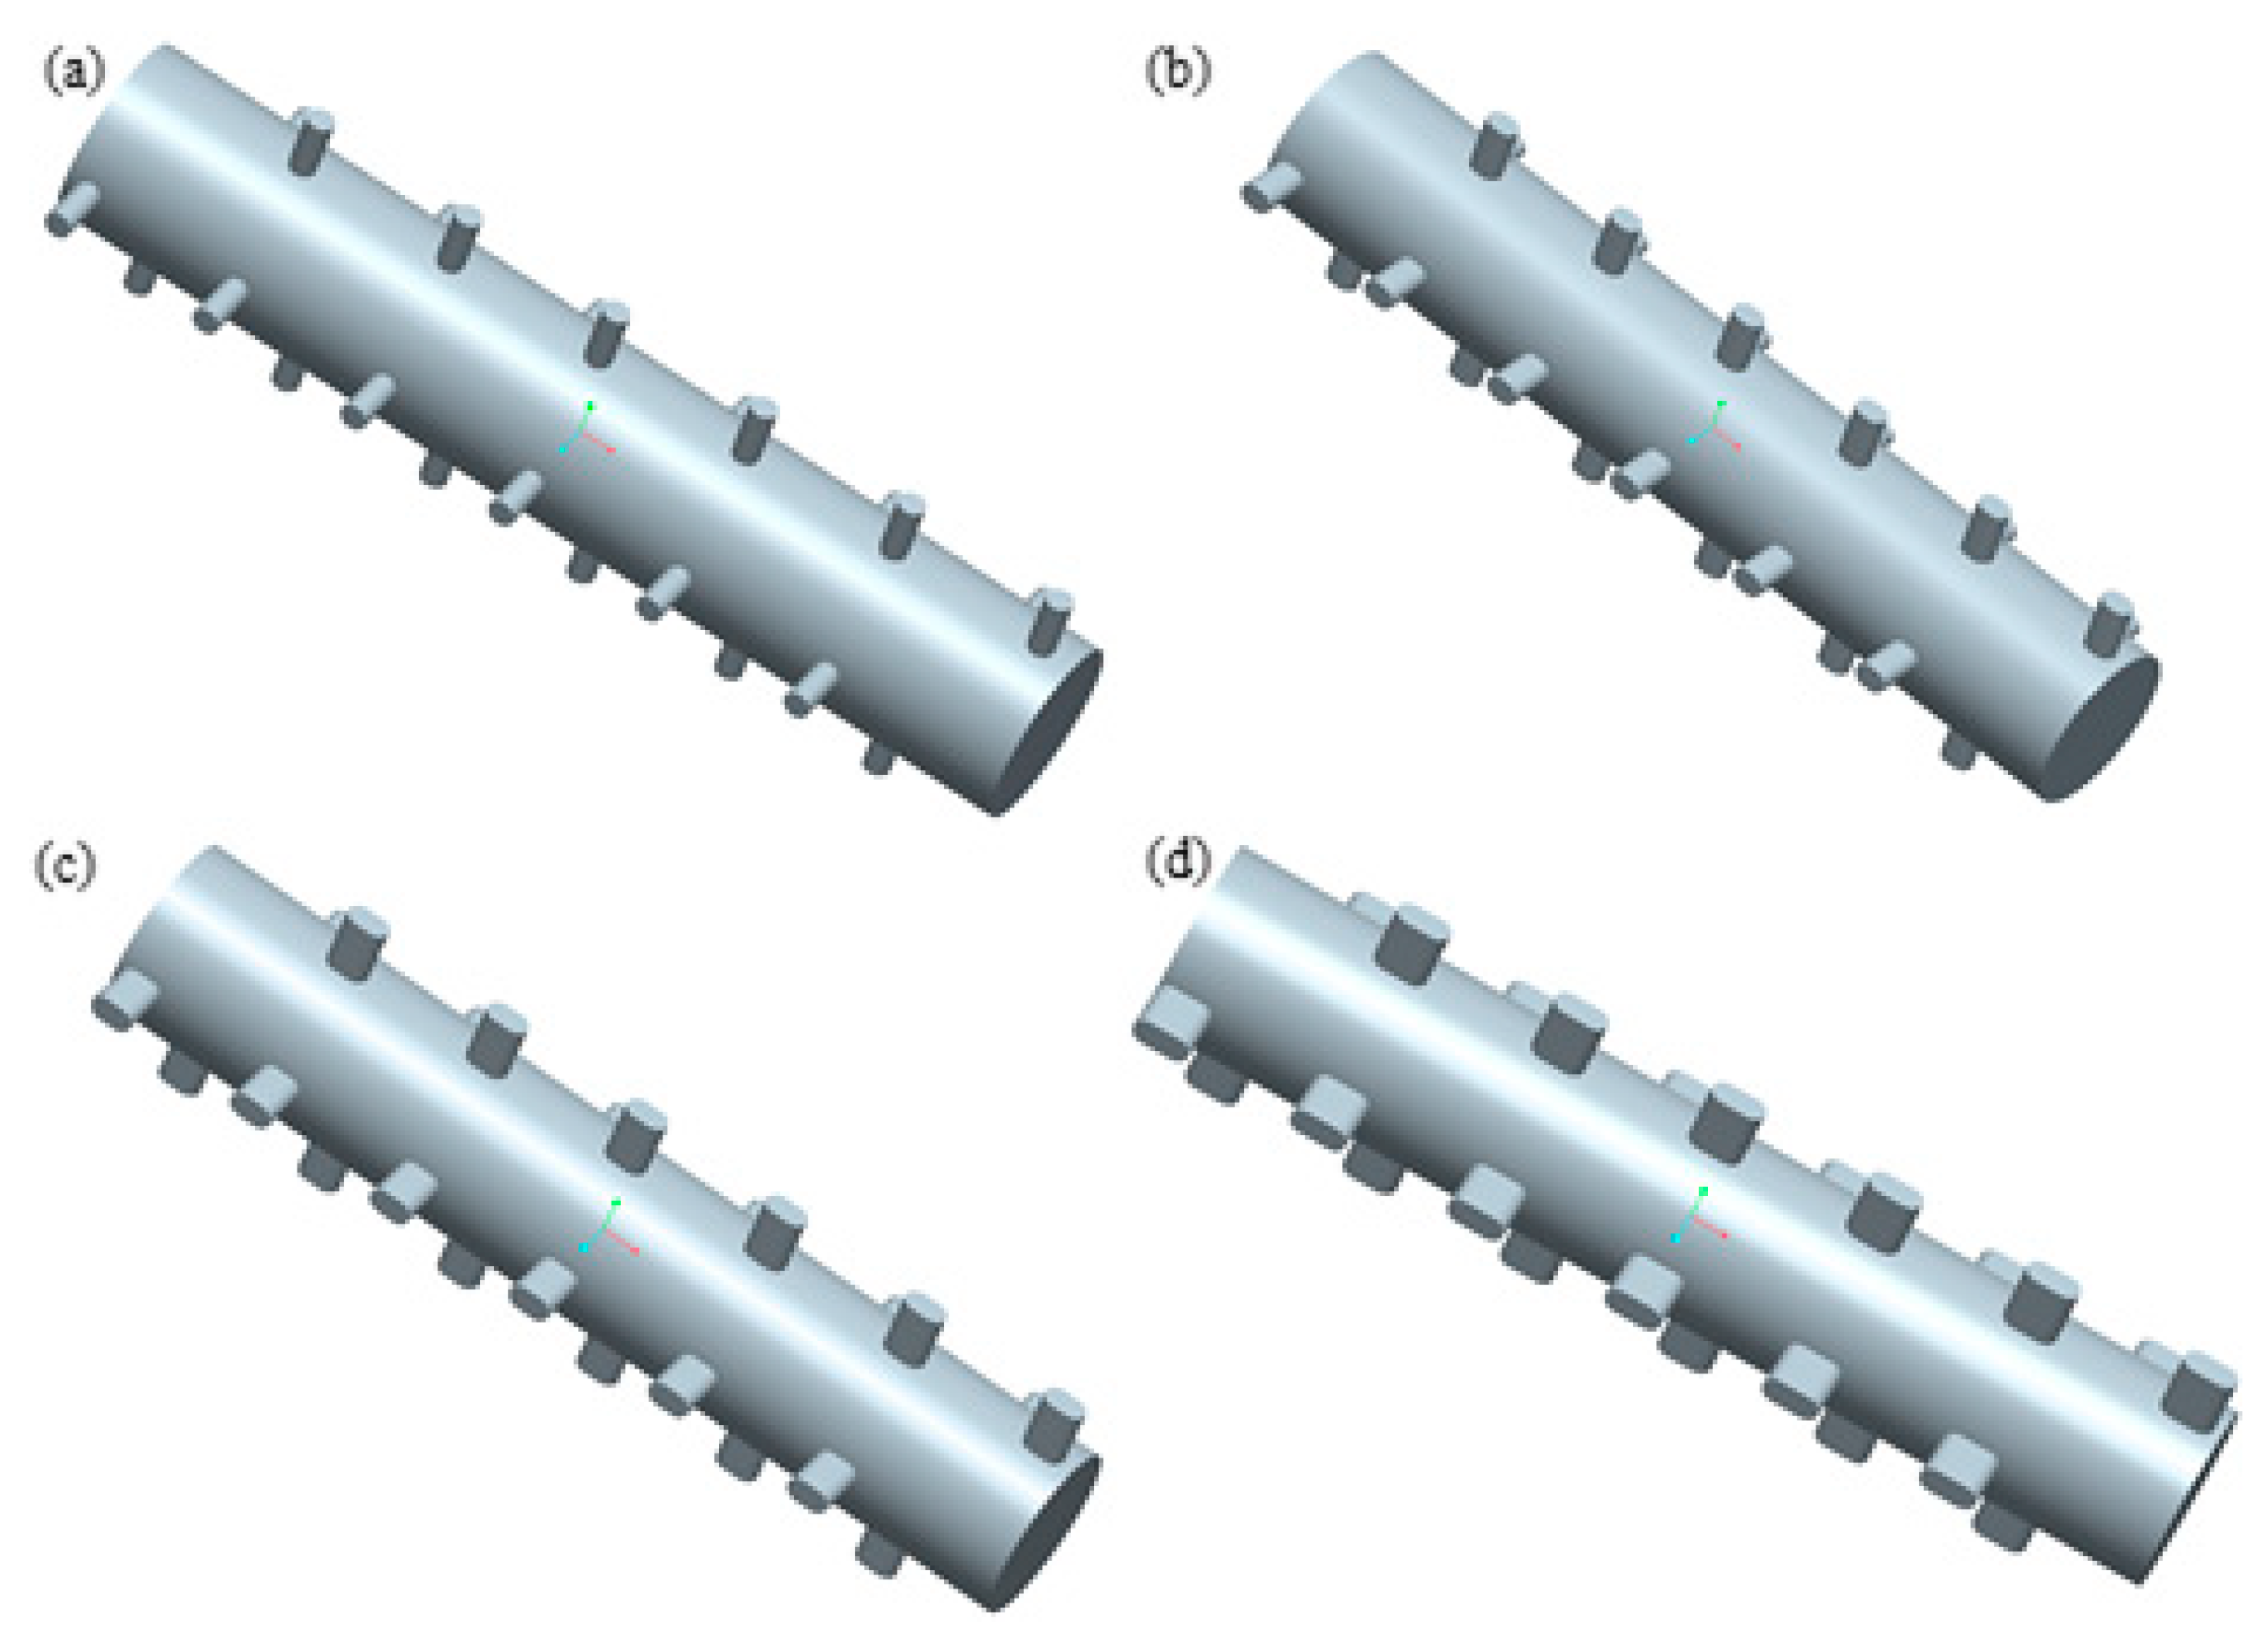
The threshing roller is distributed with four rows of spike teeth with a diameter of 15 mm and six teeth per row. From the vertical axis cross-sectional direction, the four rows of spike teeth are arranged in a circular array with an array angle of 90°, and two adjacent rows of spike teeth are spaced at a certain distance along the roller axis to ensure the forward movement of the corn cob in the threshing area. In order to study the influence of the threshing component on the performance of the thresher, its shape and dimensional parameters were modified. When the width of the threshing component gradually increases, the threshing principle will gradually transition from the spike-tooth type to the plate-tooth type, and three shape sizes were selected as the study objects; the component widths were 20 mm, 25 mm and 30 mm; and the CAD models of different threshing rollers are shown in Figure 3.

2.4. DEM Mechanical Model

2.4.1. Contact Mechanical Model

For the simulation of threshing process, the contact action between the boundary and the materials (corn cob, corn cob, shed kernels) and between each material is calculated by a linear spring damping contact mechanical model.
The normal contact force between the two particles is given by:
F n ( t ) = k n δ + c n v n
where k n δ and c n v represent the normal elastic and damping contact force between two particles at time t, and k n , c n , δ and v n represent the normal stiffness, the normal damping factor, the normal overlap and the normal relative velocity between two particles, respectively.
The tangential contact force between the two particles is given by:
F t ( t ) = F t e ( t 1 ) + k t Δ u t + c t v t
where F t e ( t 1 ) + k t Δ u t and c t v t represent the tangential elastic and damping contact force between two particles at time t, and F t ( t 1 ) represents the tangential elastic contact force between two particles at time t − 1. k t , c t , Δ u t and v t represent the tangential stiffness, the tangential damping factor, the tangential relative displacement and the tangential relative velocity between two particles, respectively.
The contact force between the two particles should also satisfy the Mohr–Coulomb model, which is given by:
{ F t ( t ) = F t ( t ) F t ( t ) = | F n ( t ) | μ d F t ( t ) / | F t ( t ) | , F t ( t ) | F n ( t ) | μ j , F t ( t ) | F n ( t ) | μ j
where μ j and μ d represent the coefficient of static and slide friction between two particles, respectively.

2.4.2. Bonding Mechanical Model

The bond behavior between the kernel and the cob is calculated using an elastic–plastic bonding mechanical model, which is given by:
F X ( Y , Z ) ( t ) = { k 1 X ( Y , Z ) u X ( Y , Z ) ( t ) k 1 X ( Y , Z ) u X ( Y , Z ) ( t ) < k 2 X ( Y , Z ) ( u X ( Y , Z ) ( t ) u 0 X ( Y , Z ) ( t ) ) k 2 X ( Y , Z ) ( u X ( Y , Z ) ( t ) u 0 X ( Y , Z ) ) u X ( Y , Z ) ( t ) > u 0 X ( Y , Z ) ( t ) 0 u X ( Y , Z ) ( t ) u 0 X ( Y , Z ) ( t )
where the direction of X, Y and Z represents the direction of the length (radial compression and tension), the thickness (longitudinal shear) and the width (tangential shear) of the kernel, respectively, and k 1 i , k 2 i , u i ( t ) and u 0 i ( t ) (i = X, Y, Z) represent the bonding loading stiffness, unloading stiffness, relative displacement and residual displacement at time t between the kernel and the cob along the X-, Y-, and Z direction, respectively.
The residual displacement is updated for every time step according to the following rule:
u X ( Y , Z ) 0 ( t ) = { u X ( Y , Z ) ( t ) ( 1 k 1 X ( Y , Z ) k 2 X ( Y , Z ) ) k 1 X ( Y , Z ) u X ( Y , Z ) ( t ) < k 2 X ( Y , Z ) ( u X ( Y , Z ) ( t ) u 0 X ( Y , Z ) ( t ) ) u 0 X ( Y , Z ) ( t ) u X ( Y , Z ) ( t ) > u 0 X ( Y , Z ) ( t ) u X ( Y , Z ) ( t ) u X ( Y , Z ) ( t ) u 0 X ( Y , Z ) ( t )
Based on the kernel threshing force from testing and the coefficient of friction of the kernel stalk, the fracture criterion for the bond behavior between the kernel and the cob is given by:
{ | F X ( t ) | > F X m a x | F Y ( t ) + μ F X ( t ) | > F Y m a x | F Z ( t ) + μ F X ( t ) | > F Z m a x
where F i m a x (i = X, Y, Z) represents the kernel threshing force along the X, Y, and Z direction respectively, μ represents the coefficient of the kernel stalk.

2.5. Simulation Setup

2.5.1. Threshing Performance Indicator

In this paper, the corn threshing process was simulated and analyzed. The corn ear threshing rate and kernel damage rate were used as performance evaluation indicators.
The threshing rate was calculated by following model:
P t = i = 1 n m 1 i / M
where m1 represents the mass of the threshed kernel of each ear, M represents the total mass of the kernels thereon the ears.
The damage rate was calculated by following model:
P d = i = 1 n m 2 i / M
where m2 represents the mass of each damage kernel. The damage of the corn kernel is determined for every time step by the following equation:
F c = i = 1 n | F n i | > F m a x
where F c represents the compressive force of the kernel, i = 1 n | F n i | represents the total normal force generated by all contact actions in a time step and F m a x represents the damage force of the kernel from testing.

2.5.2. Simulation Parameters and Dynamic

In this paper, based on the previous bench test of threshing process, three shape sizes of threshing components were added. The effect of the width of the threshing components on the rate of corn cob threshing and kernel damage at four drum rotation rates was investigated, and the table of test factor levels used in this paper is shown in Table 1.
The parameters of the contact mechanical model for the simulation are selected in Table 2. Particle density, coefficient of static friction, coefficient of sliding friction and normal stiffness between particle and boundary were taken as the average values measured in the test. The tangential stiffness between particles and boundary, the normal and tangential stiffness between particles, the normal and tangential damping factors were determined according to the calculation methods and rules. The kernel breaking force was firstly obtained by experimental test, and then was calibrated based on the kernel damage rate in threshing bench test.
The parameters of the bonding mechanical model for the simulation are selected in Table 3. The loading stiffness and unloading stiffness were taken as the average values measured by the test. The kernel threshing force was firstly obtained by test, then was calibrated based on the corn ear threshing rate in threshing bench test.
As an example, the dynamic simulation of the threshing process for different components with a drum rotation rate of 187.50 rpm is shown in Figure 4, with the color displayed according to the kernel total compressive force. As can be seen from the figure, for the spike-tooth threshing component, most of the kernel threshing occurs in the front half of the roller, and the impact of the component on the cob is greater. As the width of the component increases, the kernel threshing position gradually moves backwards and the impact of the component on the cob gradually decreases, which is basically consistent with the performance of the actual spike-tooth and plate-tooth corn threshing devices.

3. Results and Discussion

3.1. The Effect on Threshing Rate

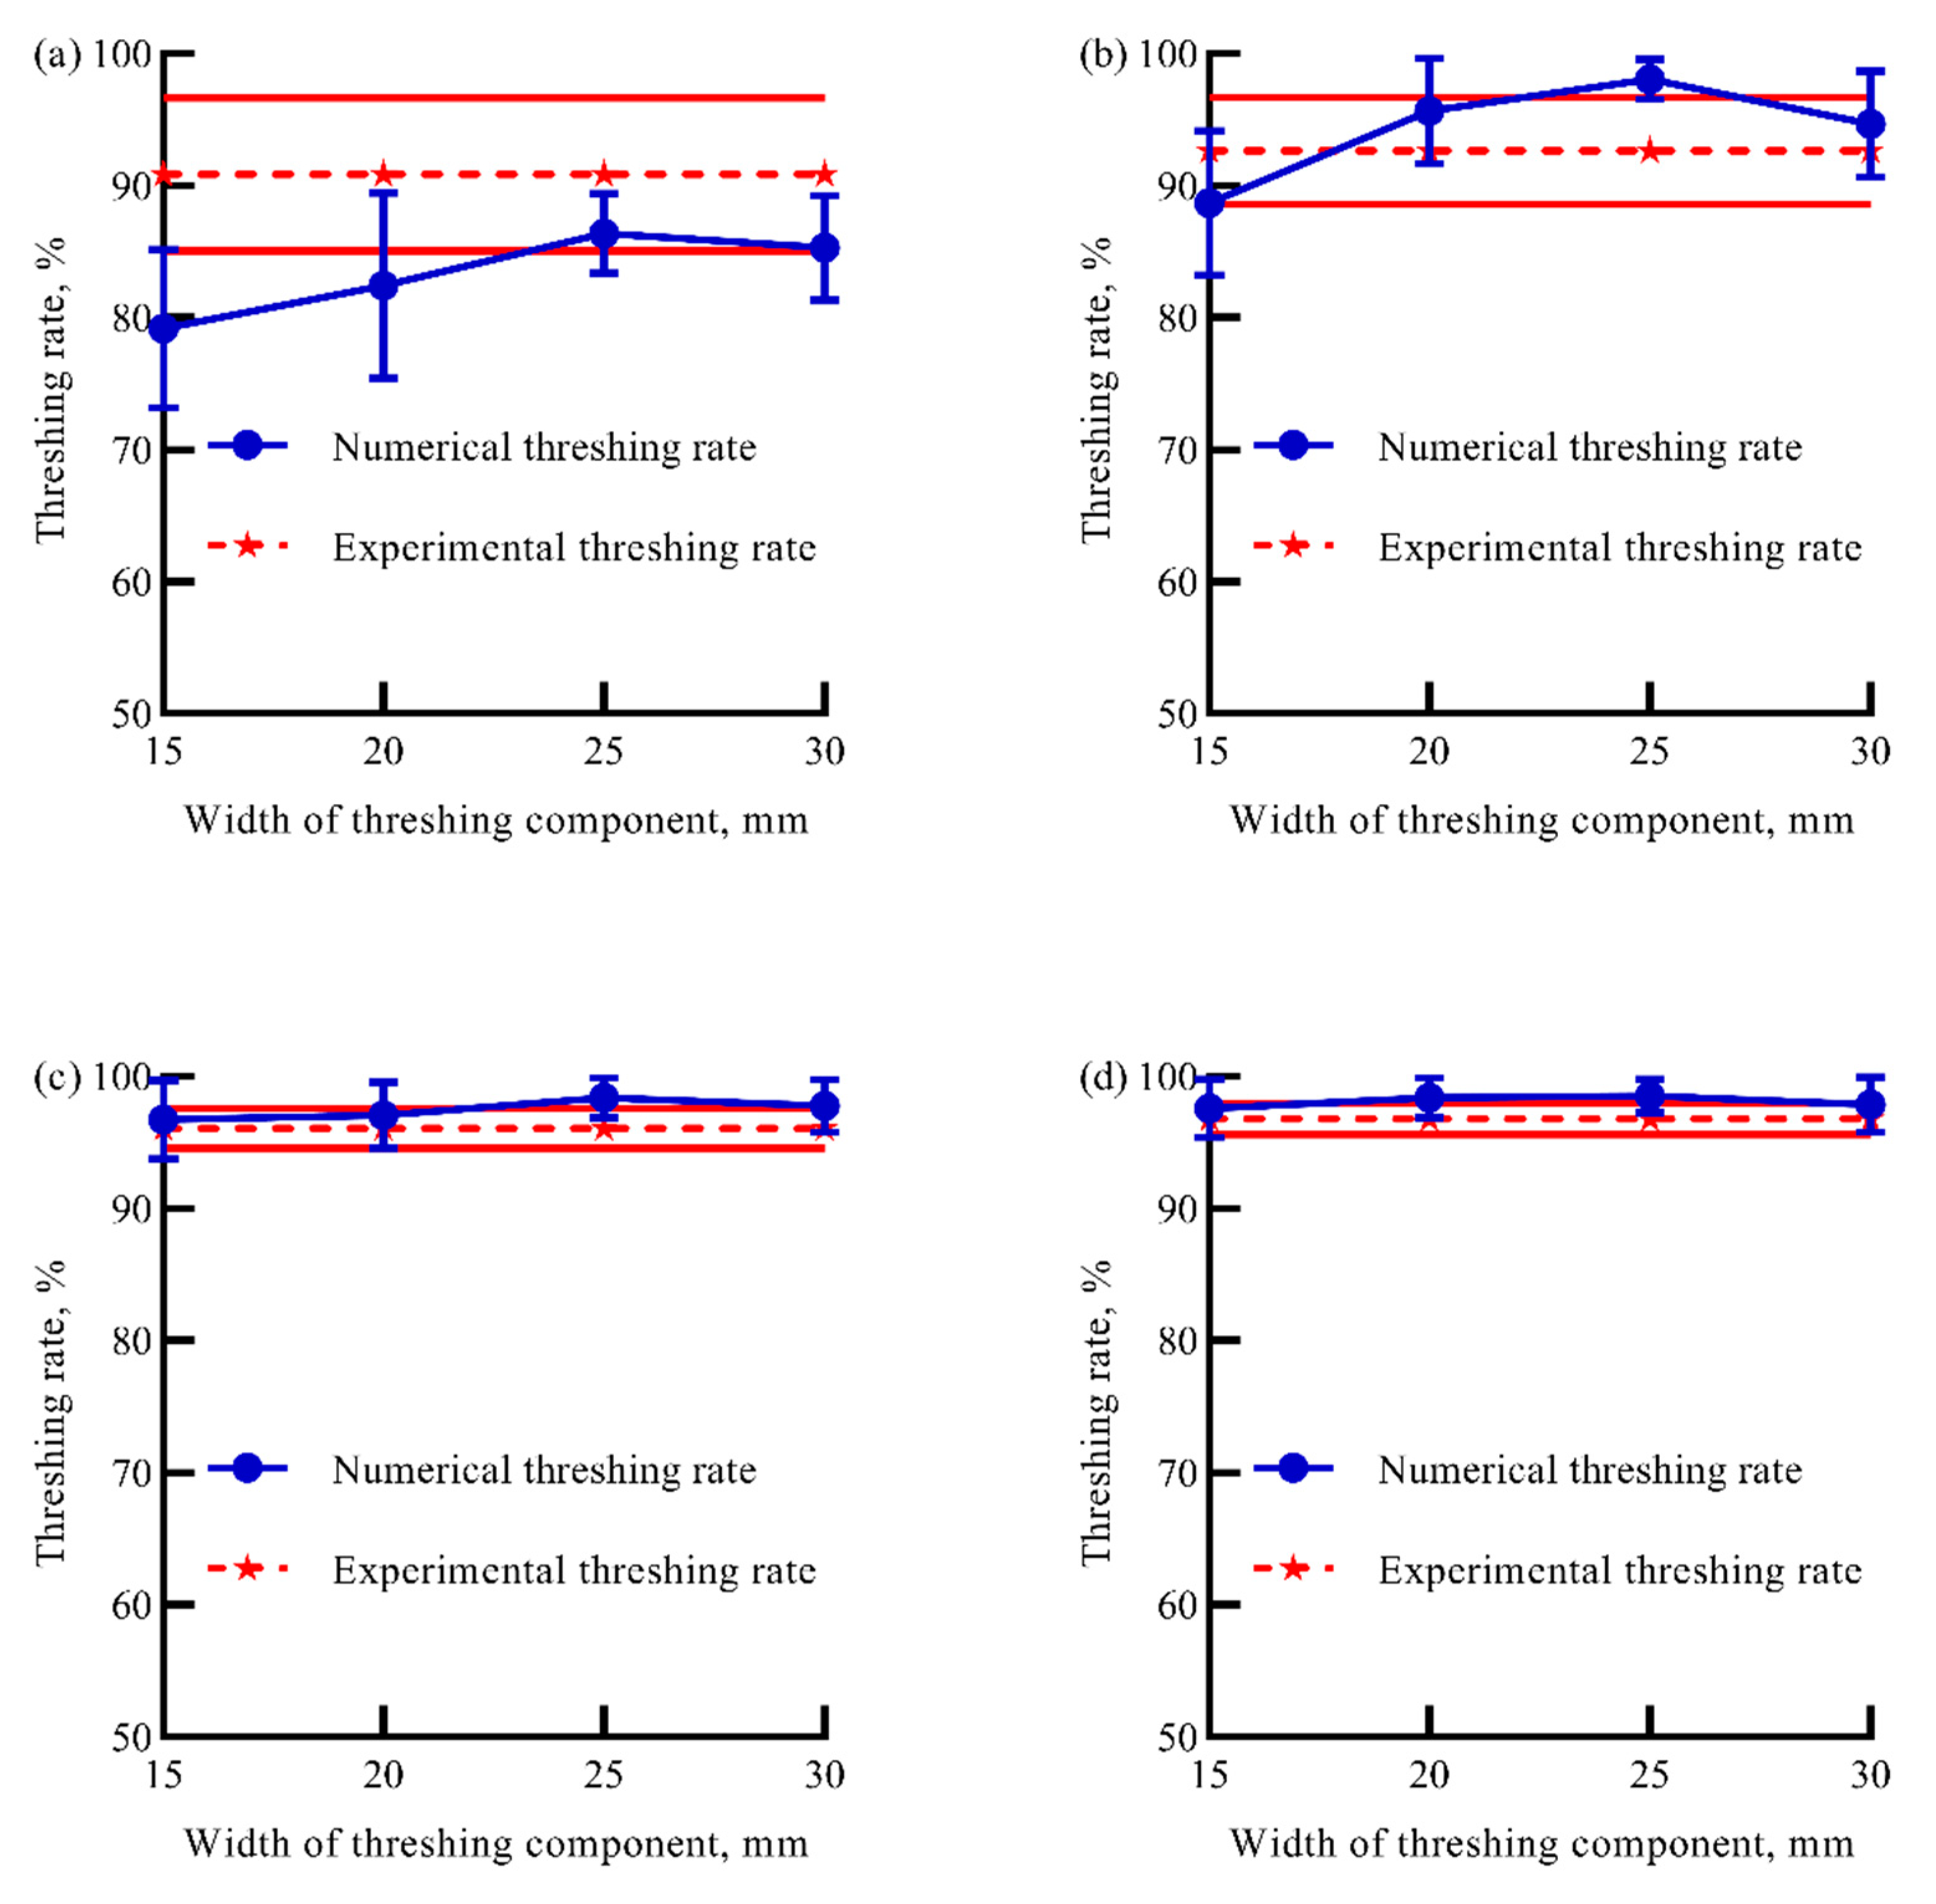
The threshing rate under different rates of threshing element widths was simulated and analyzed at the feeding amount was 10 ears of corn, and the numerical results were compared with the experimental date when the element width was 15, as shown in Figure 5.
Through the analysis we can realize that when the drum rotation rate is lower, the value of threshing rate is low, and the standard deviation is large. When the rate of drum rotation exceeds 252.10 rpm, the thresher reaches the ideal working state. Therefore, the experimental results at 252.10 rpm are used as reference to calibrate the simulation parameters.
As can be seen from Figure 5a, when the width of threshing component increased from 15 mm to 25 mm at the drum rotation rate of 122.70 rpm, the threshing rate increased from 79.19% to 86.38%, and decreased from 86.38% to 85.31% when the width of threshing component increased from 25 mm to 30 mm.
As can be seen from Figure 5b, the drum rotation rate is 187.50 rpm, and when the width of the threshing component increased from 15 mm to 25 mm, the threshing rate increased from 88.66% to 98.04%, and when the width of the threshing component increased from 25 mm to 30 mm, the threshing rate decreased from 98.04% to 94.66%.
From Figure 5c,d, it can be seen that the minimum and maximum values of the threshing rate are 96.74% and 98.38%, respectively, when the drum rotation rate is 252.10 rpm, and the minimum and maximum values of the simulated threshing rate are 98.57% and 99.51%, respectively, when the drum rotation rate is 317.15 rpm, and the threshing rate is influenced by the drum rotation rate at this time.

3.2. The Effect on Damage Rate

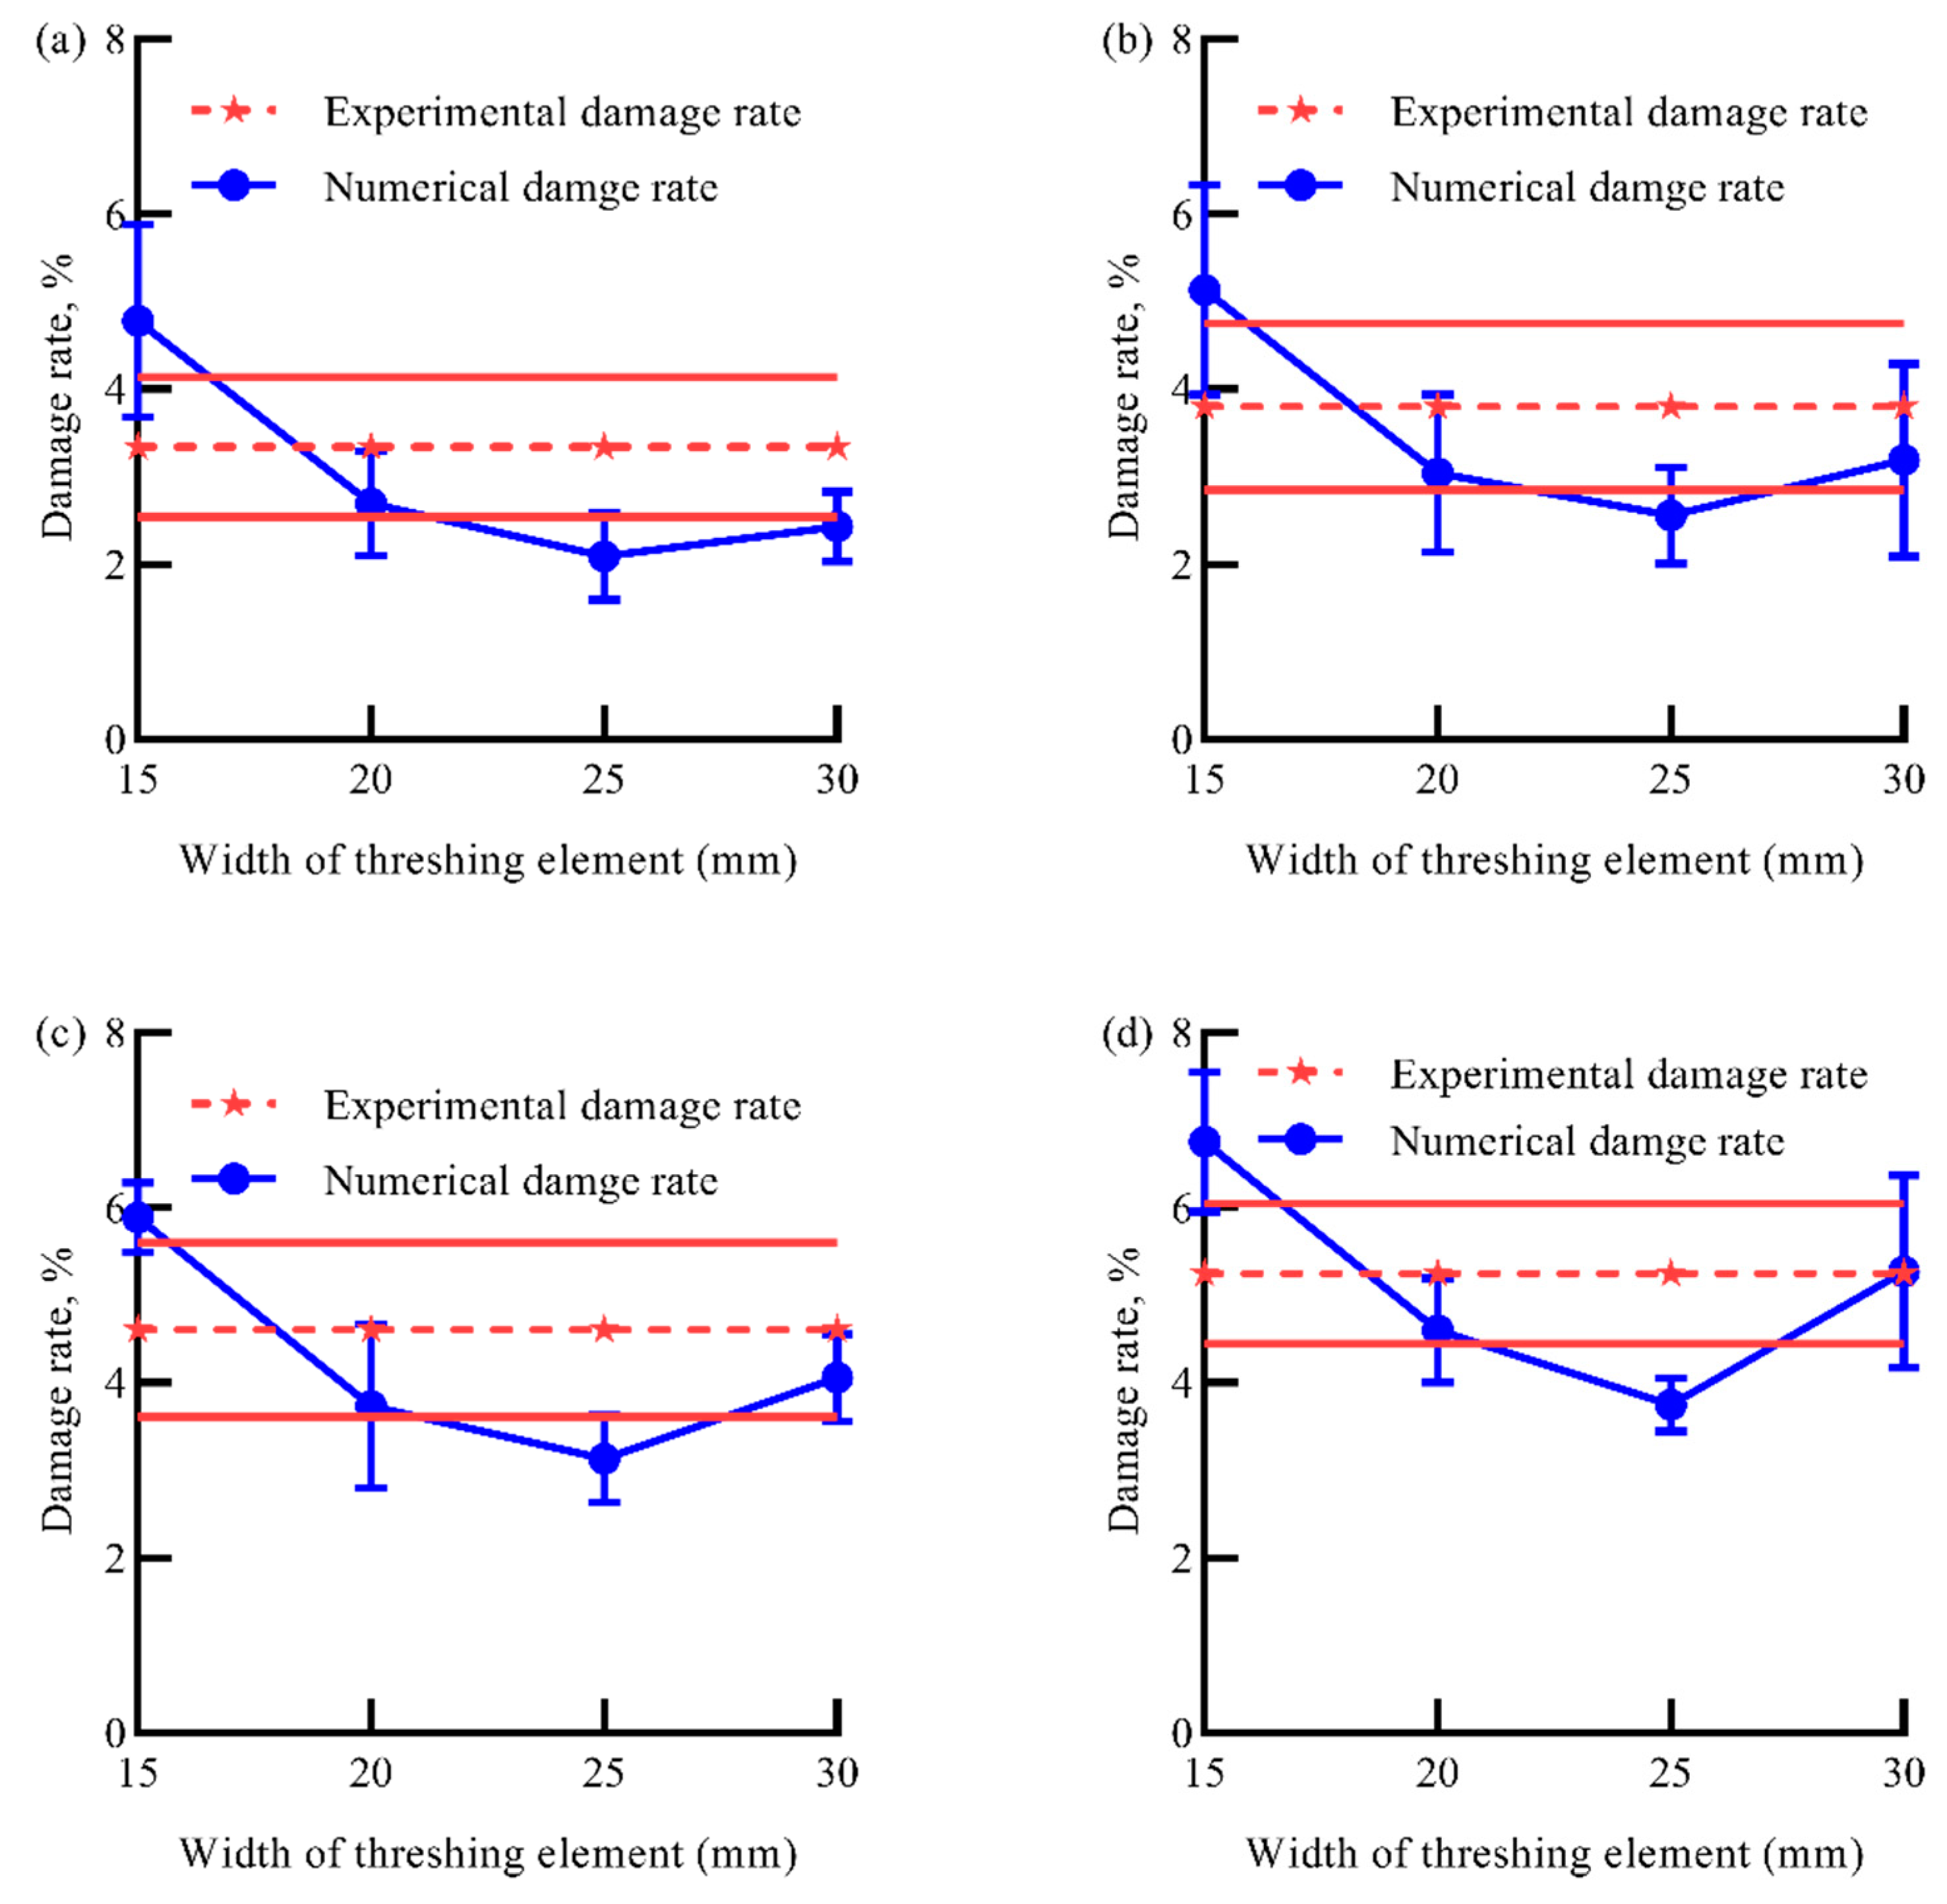
The damage rate under different rates of threshing element widths was simulated and analyzed at the feeding amount was 10 ears of corn, and the numerical results were compared with the experimental date when the element width was 15, as shown in Figure 6. The experimental results at 252.10 rpm were used as reference to calibrate the simulation parameters.
As can be seen from Figure 6a, the simulated damage rate decreased from 4.78% to 2.09% when the width of the threshing component increased from 15 mm to 25 mm for a drum rotation rate of 122.70 rpm, and increased from 2.09% to 2.43% when the width of the threshing component increased from 25 mm to 30 mm.
As shown in Figure 6b–d, when the drum rotation rate is 187.50 rpm, the width of threshing component increased from 15 mm to 30 mm, and the simulated damage rate decreased from 5.13% to 2.56%, and then increased from 2.56% to 3.19%.
When the drum rotation rate is 252.10rpm, the width of threshing component increased from 15 mm to 30 mm, and the simulated damage rate decreased from 5.89% to 3.13%, and then increased from 3.13% to 4.06%; when the drum rotation rate is 252.10 rpm, the width of threshing component increased from 15 mm to 30 mm, and the simulated damage rate decreased from 5.89% to 3.13%, and then increased from 3.13% to 4.06%.
When the drum rotation rate is 317.15 rpm, the width of threshing component increased from 15 mm to 30 mm and the simulation damage rate decreased from 6.75% to 3.75% and then increased from 3.75% to 5.27%.

3.3. The Effect on Kernel Threshing Amount

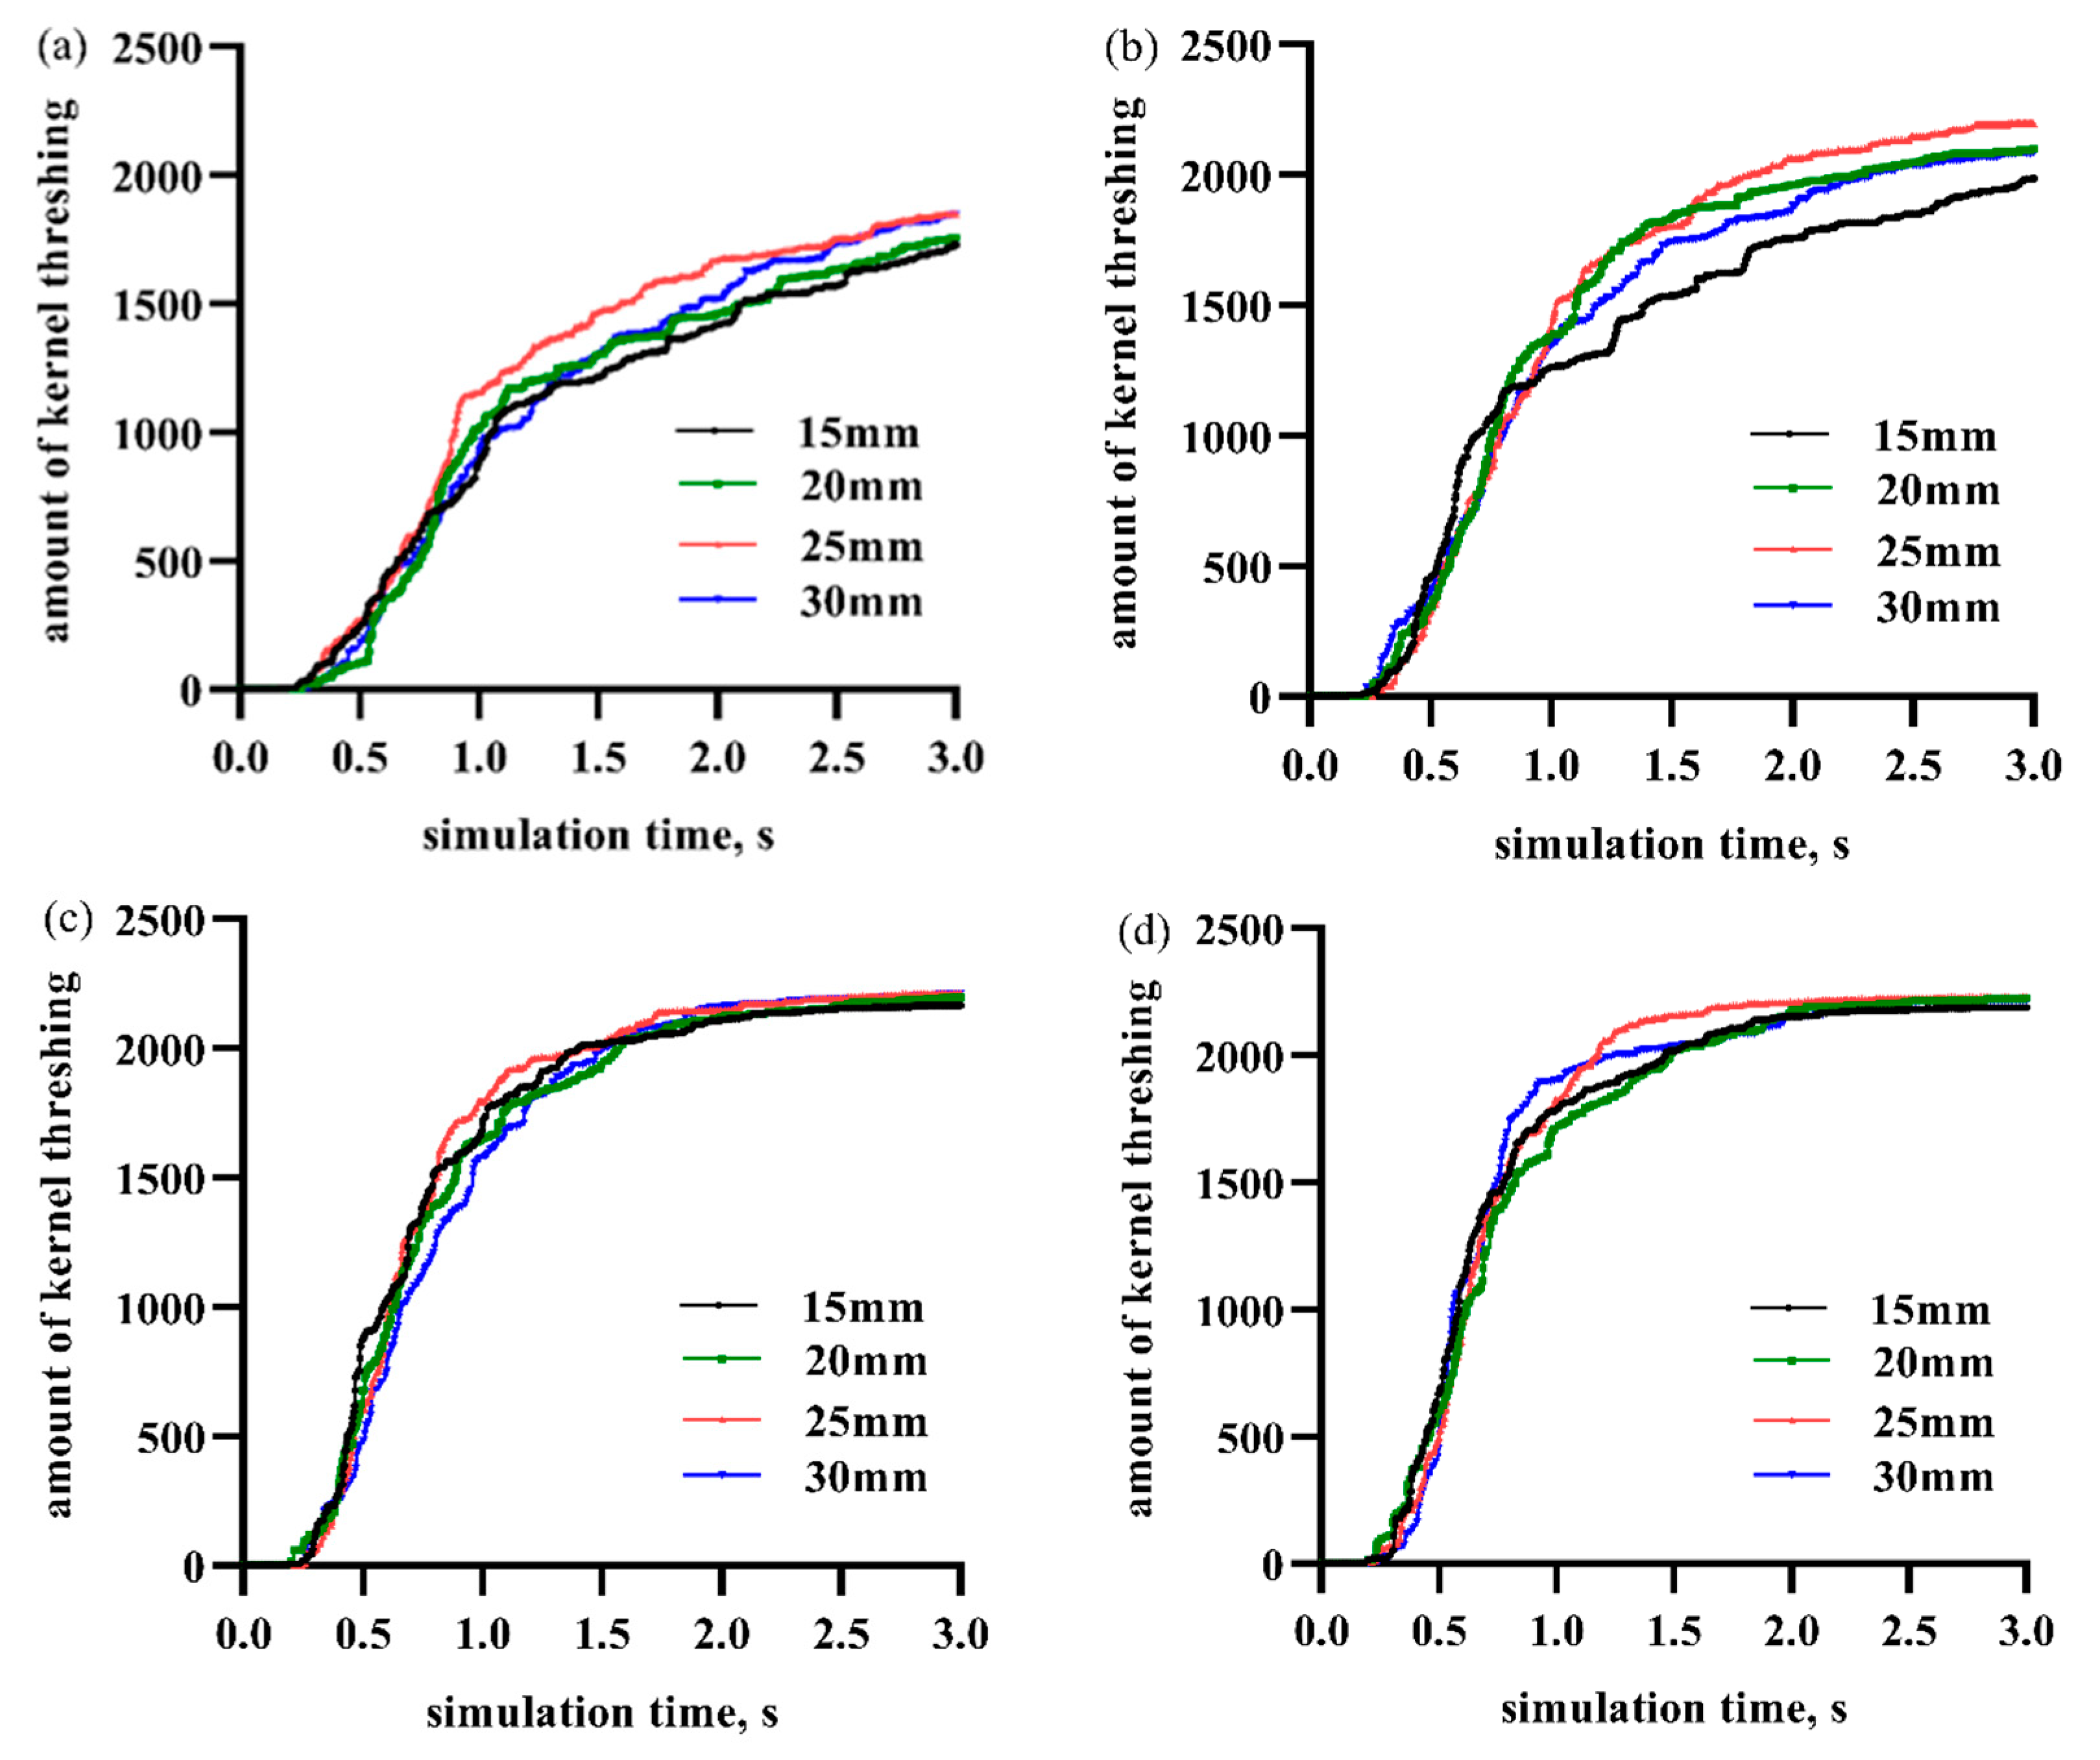
In order to study the effect of the width of the threshing component on the rate of corn threshing from a microscopic perspective, the amount of kernels threshing was analyzed during the simulation time, and the data was recorded once at an interval of 0.003 s for a simulation time of 3 s, with a total of 1000 data points.
The relationship curves of the number of kernels shed with simulation time for different rates of drum rotation and width of threshing component are shown in Figure 7. From Figure 7a, it can be seen that the kernels were threshed from 0.25 s when the drum rotation rate is 122.70 rpm, and the variation curves of the amount of kernels threshed with simulation time for different widths of threshing component in the simulation time from 0.25 to 0.8 s were not very different. In the simulation time from 0.8 s to 3.0 s, the variation curve for the width of threshing component of 25 mm is higher than the other curves, and the threshing effect is the best. The threshing effect for the width of threshing component of 30 mm is better than that of 20 mm, and the threshing effect for the width of threshing component of 15 mm is the worst, and the variation curve of amount of kernel threshed with simulation time is consistent with the curve in Figure 5a, corresponding to the variation of the number of kernels shed with the simulation time is consistent with the variation of the threshing rate under the width of the threshing component in Figure 5a.
From Figure 7b, it can be seen that when the drum rotation rate is 187.50 rpm, the kernels are shed from 0.25 s, and the kernels are basically shed by 2.5 s. The variation curve of the number of kernels shed with simulation time for different widths of threshing components in the simulation time from 0.25 to 0.70 s is not very different. In the simulation time of 0.70–2.5 s, the variation curves of the number of kernels shed with simulation time for the width of threshing component of 25 mm were higher than the other curves, and the threshing effect is the best, and the difference between the threshing effect for the width of threshing component of 20 mm and 30 mm is not much, whereas the threshing effect is the worst for the width of threshing component of 15 mm. The trend of the number of kernels shed with different widths of threshing components is basically the same as that of the drum speed of 122.70 rpm.
As can be seen from Figure 7c,d, the kernels started to be threshed from 0.25 s when the drum rotation rate is 252.10 rpm and 317.15 rpm, respectively. Within the simulation time from 0.25 to 1.8 s, although the variation curves of the amount of threshed kernels under each width of the threshing component with the simulation time were different, the kernels had been threshed off by 1.8 s, and the threshing efficiency was higher. In the simulation time of 1.8 to 3.0 s, the variation curves of the amount of threshed kernels with simulation time for each width of threshing component differed slightly, which showed that the influence of drum rotation rate on threshing efficiency is greater at a high rate, which is consistent with the variation of threshing rate under the corresponding width of threshing component in Figure 5c,d.

3.4. The Effect on Kernel Compressive Force

In order to study the effect of the width of the threshing component on the rate of kernel damage from a microscopic perspective, the kernel total compressive force was analyzed during the simulation time.
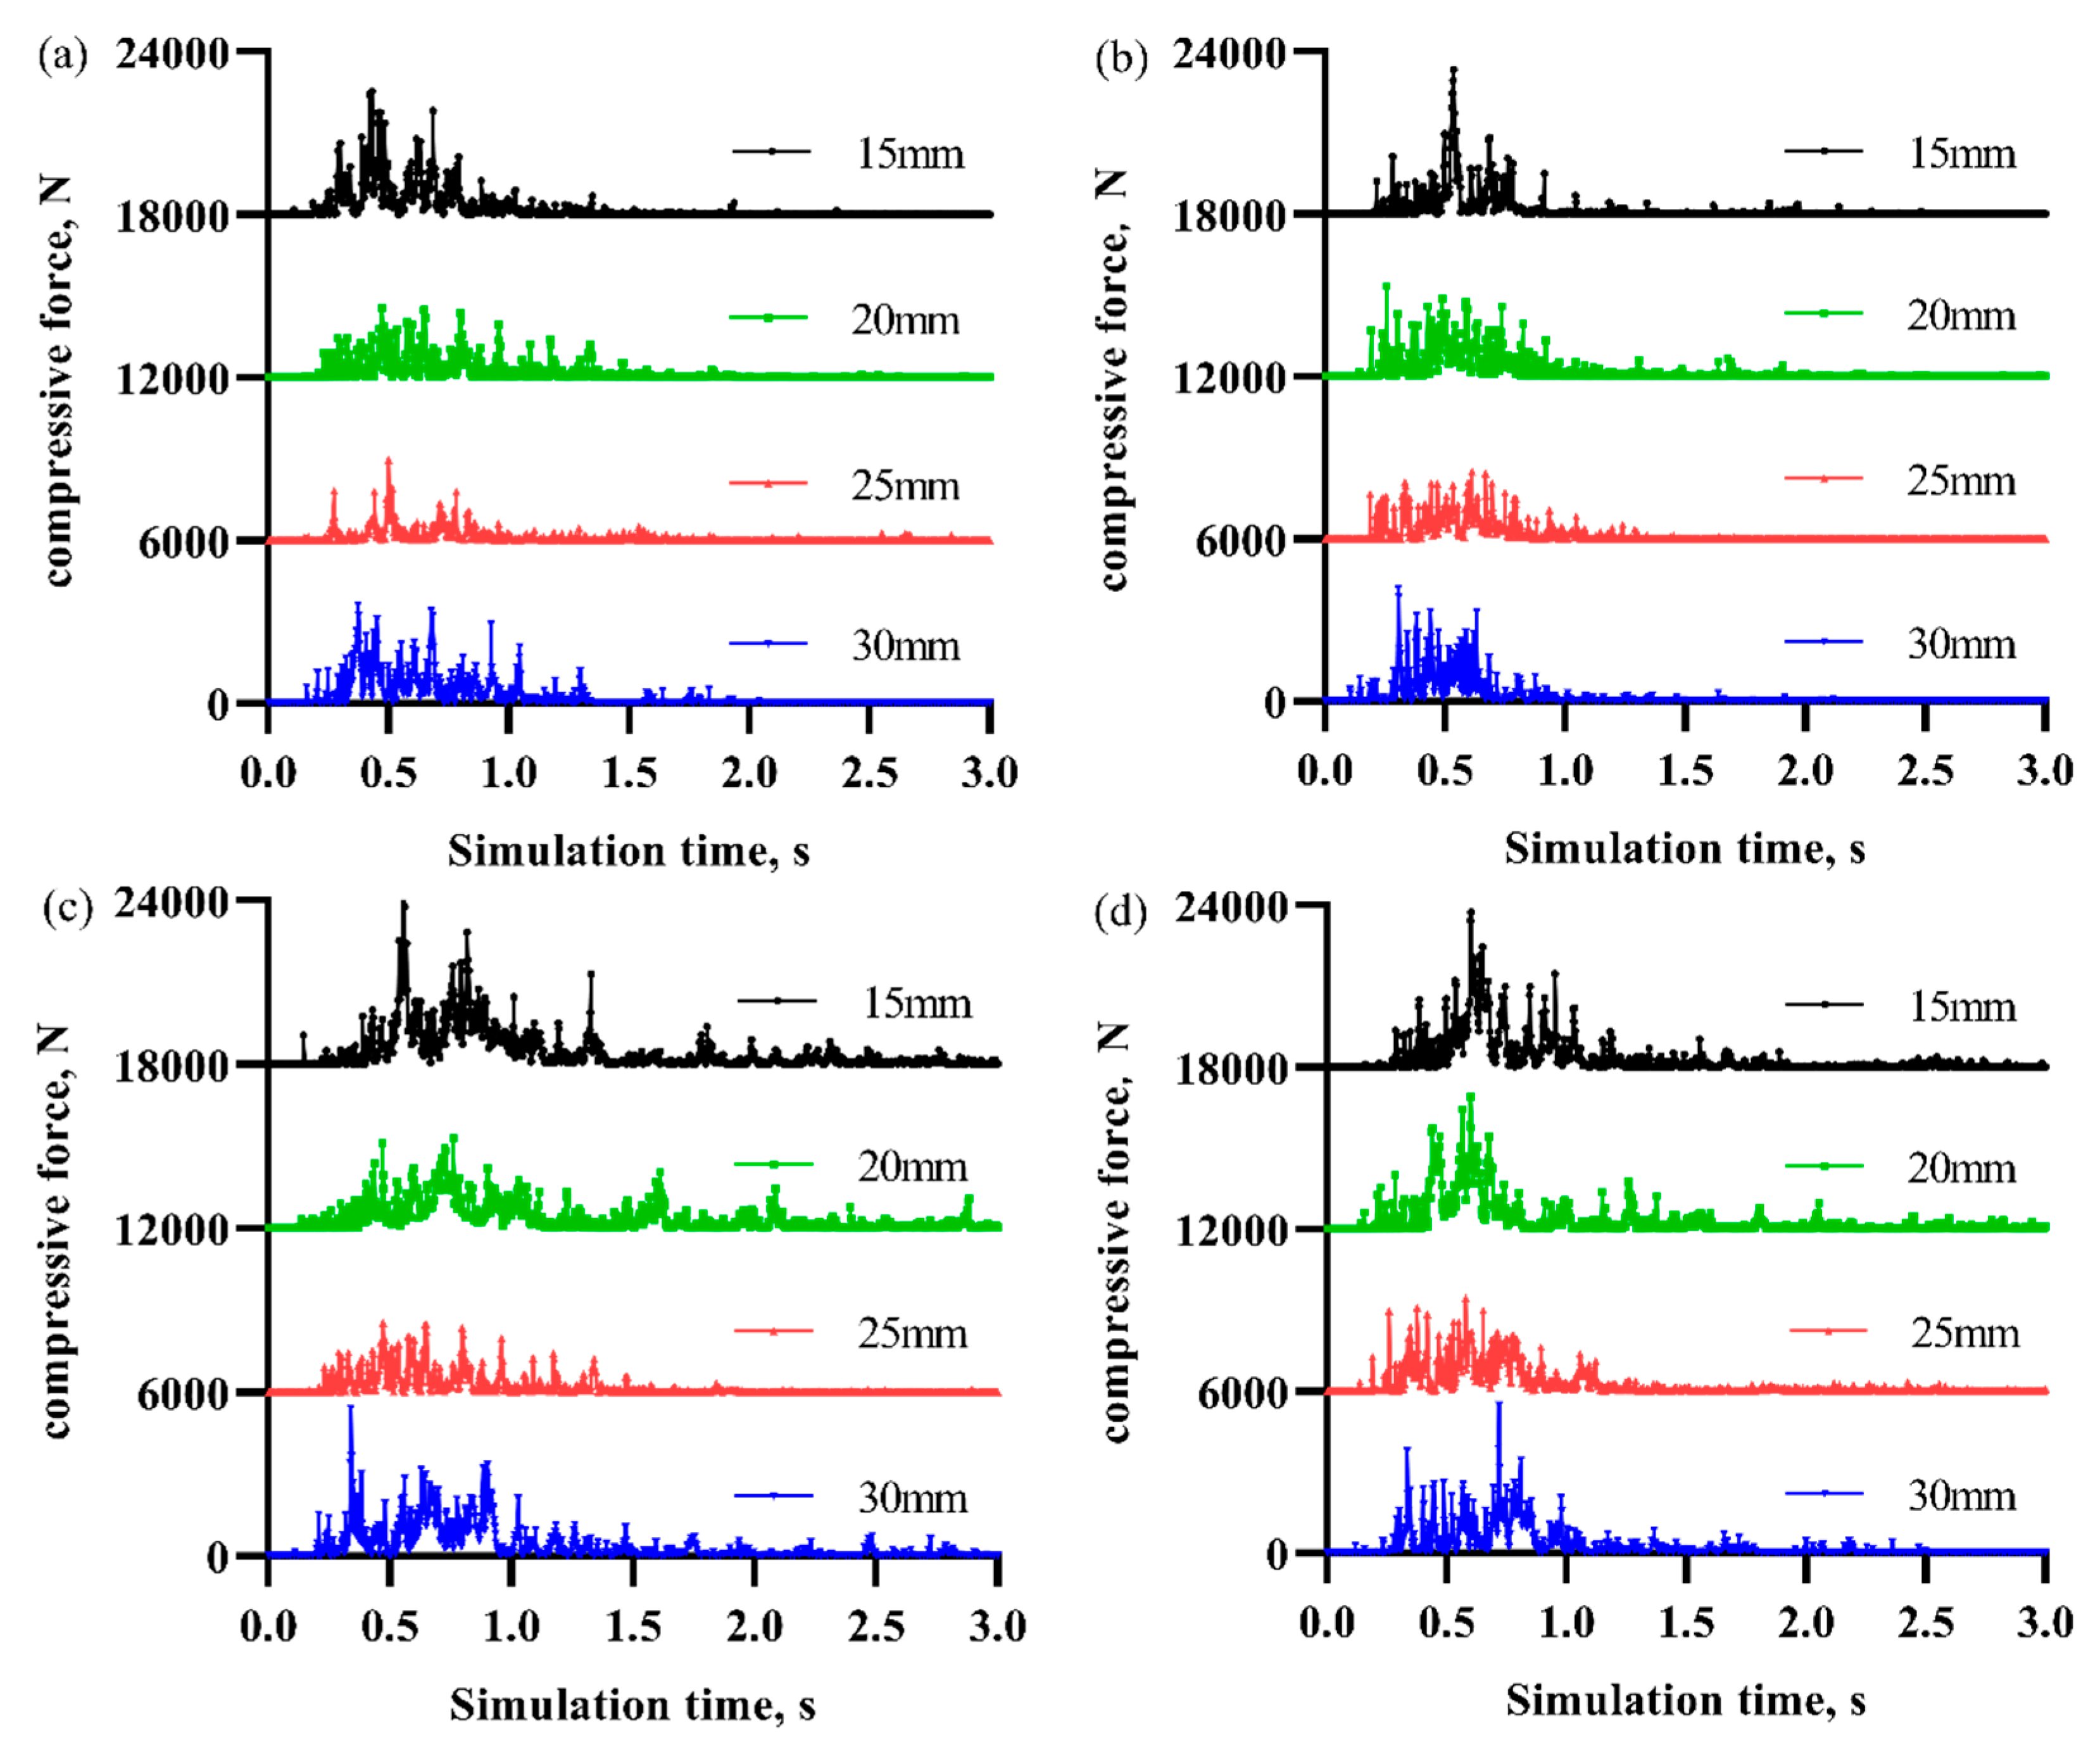
The correlation curves between the total compressive force on the kernel and the simulation time for different rates of drum rotation and width of threshing component are shown in Figure 8. As can be seen from Figure 8a, when the rates of drum rotation is 122.70 rpm, the compressive force on the kernel gradually increases at the simulation time of 0.2 s. When the width of the threshing component increases from 15 mm to 30 mm, the compressive force and the its peak first decreases and then increases, and the compressive force on the kernels is lowest when the width of the threshing component is 25 mm. As shown in Figure 8b–d, when the rates of drum rotation increases, the trend of kernel compressive force at different threshing component widths is consistent with that at the rates of drum rotation of 122.70 rpm, and the compressive force and peak value increase compared to that at 122.70 rpm.

4. Discussion

4.1. Discussion of Threshing Rate

When the drum rotation rate is 122.70 rpm, the standard deviation (SD) of the simulation results is large, and the simulation results differ greatly from the experimental data. When the width of the component increases to 25 mm and 30 mm, the error limit of the simulation results is close to the experimental data. When the rotation rate increases to 187.50 rpm, SD of the simulation results decreases. When the component width is greater than 20 mm, the simulation results reach the upper limit of the error of experimental data. The thresher basically reaches a good working state. With the increase of the drum rotation rate, the simulation threshing rate continues to increase, but not obviously.
The analysis shows that the change trend of corn cob threshing rate at different rates of drum rotation is basically the same. When the width of the threshing component is lower than 25 mm, the contact area and opportunity between the corn cob and the threshing component increase as the width of the component increases, and the threshing rate increases. When the width of the threshing component increases to 30 mm, there is a staggered overlapping part between two adjacent rows of threshing components, and the corn ears are affected by the joint action of the two rows of threshing components during the threshing process, which affects the threshing performance and leads to a lower threshing rate.
When the width of threshing component is less than 20 mm, the working principle of the thresher is similar to striking type, and a larger drum rotation rate needs to achieve the ideal working state. When the width of threshing component is 25 mm, the threshing component changes from spike teeth to plate teeth, and the working principle changes from striking to extruding and rubbing. When the rate of drum rotation is lower (i.e., 187.15 rpm), the thresher can also get a better threshing effect, and with the increase of the rotation rate, the working effect continues to improve.

4.2. Discussion of Damage Rate

The analysis shows that the kernel damage rate gradually increases with the increase of drum rotation rate, which was consistent with the research in literature such as [1,4,8,10]. It can be seen that the damage of kernel is mainly caused by the impact force of threshing components. With the increase of the drum rotational rate, the impact force of kernels also increases correspondingly. Therefore, the damage rate will increase with the increase of the rate of threshing drum rotation.
The change trend of damage rate with the width of threshing component at different rates of drum rotation is basically the same. When width of the threshing component is 15 mm, the kernel is threshed by striking, and the damage rate is bigger, the simulation results is higher than the experimental data through way threshing. With the increase of the width, the threshing component changes from spike tooth to plate tooth, the contact area between corn ears and threshing component becomes bigger through the crowded rub knead the principle of threshing, the damage rate is lower and the threshing effect is better.
When the width of the threshing component increases to 30 mm, there is a staggered overlapping part between the two rows of threshing components, and the corn cob is impacted by the two overlapping parts, resulting in the opposite effect, leading to a higher damage rate.
Therefore, when the width of threshing element is 25 mm and the rate of drum rotation is 187.5 rpm, the simulated damage rate of corn cob is the lowest and the net loss rate is higher, and the threshing effect is better.

4.3. Discussion of Kernel Threshing Amount

According to the analysis, at the initial stage of threshing process, the kernels on the ear of corn were closely arranged and difficult to be threshed. Because of the stronger impact effect of the spike-tooth threshing component (i.e., 15 mm), the kernel threshing amount was better than that of the plate-tooth threshing component (i.e., 20, 25 and 30 mm). As the threshing process continues, part of the kernels were threshed, making the arrangement of kernels loose. At this time, the kernel threshing amount of plate-tooth threshing component gradually exceeded that of spike-tooth due to its larger contact area.
According to the analysis of kernel threshing amount, with the increase of the width of threshing component, the overall threshing effect gradually improved. However, when the width of threshing component was too large, the threshing efficiency was reduced to some extent. When the width of threshing element was 25 mm, the threshing effect reached the best result, which was consistent with the analysis results of the threshing rate.
By analyzing the variation curves of the amount of kernels threshed with the simulation time for each width of threshing component from the microscopic perspective, the changes of the amount of kernels threshed and the threshing time in various cases can be seen, which provides a new method for the study of the shelled process.

4.4. Discussion on Kernel Compressive Force

According to the analysis of kernels total compressive force, as the rates of drum rotation increases, the compressive force on the kernels gradually increases. As the width of the threshing component increases, the compressive force on the kernels first decreases and then increases. When the width of the threshing component is 25 mm, the compressive force on the kernels is the lowest, which is consistent with the conclusion of macroscopic analysis.
By analyzing the variation curves of the kernel compressive force with the simulation time for each width of threshing component, the changes of the kernels total force and the threshing time in various cases can be seen. The threshing process and the mechanism of threshing component were studied in depth from the time dimension, which provided a new method for the optimization of threshing process.

5. Conclusions

In this paper, we used a self-developed discrete element analysis software to simulate the force on the kernels during the kernel threshing process in order to improve the quality of corn kernels. In this paper, we found that: a linear damping mechanics model can be used to simulate the contact interaction between the material and the boundary, an elastoplastic bonding model can be used to simulate the mechanical behavior between the kernels and the corn cob, and the corn cob model established by the particle bonding method can highly restore the kernel dynamics during the corn threshing process. By comparing the actual test results, it is found that the simulation model developed in this paper can simulate and predict the threshing process and performance with high accuracy.
This paper found that by appropriately increasing the design value of the width of the corn threshing element, the force on the kernels during the threshing process can be changed from striking to squeezing and rubbing, which in turn improves the threshing rate and reduces the damage rate. At the meantime, this paper found that as the width of the threshing element increased, the threshing rate showed a trend of increasing and then decreasing, and the damage rate showed a trend of decreasing and then increasing. The experimental results showed that the optimal combination of width parameter and speed parameter with the value of 25 mm and 187.50 rpm could improve the corn threshing rate by about 8% and reduce the kernel damage rate by about 3%. The results of this paper can provide a new simulation model, as well as design theory and parameter guidance for future parametric design of corn threshing elements, which can greatly simplify the design process.

Author Contributions

Conceptualization, L.L.; methodology, Y.Y; validation, Y.Y. and L.L.; resources, J.Z.; writing—original draft preparation, J.Z.; writing—review and editing, Y.Y.; supervision, X.W.; project administration, J.F. All authors have read and agreed to the published version of the manuscript.

Funding

The research was financially supported by the National Key Research and Development Project of China, grant number 2017YFD0700701, the National Natural Science Foundation of China, grant number 52075215, Outstanding Young Talents Fund of Science and Technology Department of Jilin Province of China, grant number 20200403153SF, and the Thirteenth Five-Year Plan Science and Technology Project of Jilin Provincial Education Department, grant number JJKH20201009, and Innovation and Entrepreneurship Training Program for College Students of Jilin University 202010183616.

Institutional Review Board Statement

Not applicable.

Informed Consent Statement

Not applicable.

Data Availability Statement

Data sharing not applicable.

Conflicts of Interest

The authors declare no conflict of interest.

References

  1. Zhu, X.L.; Chi, R.J.; Du, Y.F.; Qin, J.H.; Xiong, Z.X.; Zhang, W.T.; Li, X.J. Experimental study on the key factors of low-loss threshing of high-moisture maize. Int. J. Agric. Biol. Eng. 2020, 13, 23–31. [Google Scholar] [CrossRef]
  2. Wang, X.Q.; Ren, X.C.; Mei, N.; Xie, Y.N.; Yang, X.Y.; Wang, X.J.; Zhao, R.G. Genome-wide association analysis for the genetic basis of seven traits associated with corn grain moisture and ear threshing rate. Int. J. Agric. Biol. 2019, 21, 810–818. [Google Scholar]
  3. Gu, R.L.; Huang, R.; Jia, G.Y.; Yuan, Z.P.; Ren, L.S.; Li, L.; Wang, J.H. Effect of mechanical threshing on damage and vigor of maize seed threshed at different moisture contents. J. Integr. Agric. 2019, 18, 1571–1578. [Google Scholar] [CrossRef]
  4. Xia, G.Y.; Xu, Y.; Su, Y.; Gao, X.J.; Li, Y.B.; Qian, M.M.; Yu, Y.B. Feature selection, artificial neural network prediction and experimental testing for predicting damage rate of maize kernels based on mechanical properties. J. Food Process. Eng. 2021, 44, e13621. [Google Scholar] [CrossRef]
  5. Yang, L.Q.; Wang, W.Z.; Zhang, H.M.; Wang, M.M.; Hou, M.T. Maize Ear Threshing—An Experimental Investigation. AMA-Agric. Mech. Asia Afr. Lat. Am. 2020, 51, 34–41. [Google Scholar]
  6. Fu, J.; Chen, Z.; Han, L.J.; Ren, L.Q. Review of grain threshing theory and technology. Int. J. Agric. Biol. Eng. 2018, 11, 12–20. [Google Scholar] [CrossRef]
  7. Li, L.L.; M, B.; Jue, X.; Shang, G.; Wang, K.R.; Xie, R.Z.; Peng, H.; Li, S.K. Difference in corn kernel moisture content between pre-and post-harvest. J. Integr. Agric. 2021, 20, 1775–1782. [Google Scholar] [CrossRef]
  8. Fu, J.; Yuan, H.K.; Zhang, D.P.; Chen, Z.; Ren, L.Q. Multi-objective optimization of process parameters of longitudinal axial threshing cylinder for frozen corn using RSM and NSGA-II. Appl. Sci. 2020, 10, 1646. [Google Scholar] [CrossRef] [Green Version]
  9. Steponavicius, D.; Kemzuraite, A.; Kiniulis, V.; Andriusis, A.; Juknevicius, D. Influence of cylinder design on its speed during corn ear threshing. In Proceedings of the 8th International Scientific Conference Rural Development, Akademija, Lithuania, 23–24 November 2017; pp. 453–459. [Google Scholar]
  10. Li, X.P.; Wu, K. Design and experiment of bionic discrete devices based on corn threshing system. In Proceedings of the 3rd International Conference on Applied Engineering, Dubai, United Arab Emirats, 27–28 May 2016; pp. 127–132. [Google Scholar]
  11. Kiniulis, V.; Steponavicius, D.; Kemzuraite, A.; Andriusis, A.; Juknevicius, D. Dynamic Indicators of a corn ear threshing process influenced by the threshing-separation unit load. Mechanika 2018, 24, 412–421. [Google Scholar] [CrossRef] [Green Version]
  12. Yu, Y.J.; Fu, H.; Yu, J.Q. DEM-based simulation of the corn threshing process. Adv. Powder Technol. 2015, 26, 1400–1409. [Google Scholar] [CrossRef]
  13. Mousaviraad, M.; Tekeste, M.Z. Effect of grain moisture content on physical, mechanical, and bulk dynamic behaviour of maize. Biosyst. Eng. 2020, 195, 186–197. [Google Scholar] [CrossRef]
  14. Hundal, J.; Takhar, P.S. Dynamic viscoelastic properties and glass transition behavior of corn kernels. Int. J. Food Prop. 2009, 12, 295–307. [Google Scholar] [CrossRef]
  15. Akubuo, C.O. Performance evaluation of a local maize sheller. Biosyst. Eng. 2002, 83, 77–83. [Google Scholar] [CrossRef]
  16. Yang, L.; Cui, T.; Qu, Z.; Li, K.; Yin, X.; Han, D.; Ya, B.; Zhao, D.; Zhang, D. Development and application of mechanized maize harvesters. Int. J. Agric. Biol. Eng. 2016, 9, 15–28. [Google Scholar]
  17. Steponavicius, D.; Puzauskas, E.; Spokas, L.; Jotautiene, E.; Kemzuraite, A.; Petkevicius, S. Concave design for high-moisture corn ear threshing. Mechanika 2018, 24, 80–91. [Google Scholar] [CrossRef]
  18. Li, L.L.; Ming, B.; Xie, R.Z.; Wang, K.R.; Hou, P.; Gao, S.; Chu, Z.; Zhang, W.; Huang, Z.; Li, X.; et al. The stability and variability of maize kernel moisture content at physiological maturity. Crop Sci. 2021, 61, 704–714. [Google Scholar] [CrossRef]
  19. Brown, D.M.; Bootsma, A. Moisture in maize kernels at physiological maturity. Can. J. Plant Sci. 2002, 82, 549–550. [Google Scholar] [CrossRef] [Green Version]
  20. Qu, Z.; Zhang, D.X.; Yang, L.; Zhang, T.L.; Wang, Z.D.; Tao, C. Experiment on feed rate and cylinder speed of longitudinal axial flow threshing and separating device for maize. Trans. CSAM 2018, 49, 58–65. [Google Scholar]
  21. Kovacs, A.; Kerenyi, G. Modeling of corn ears by discrete element method (DEM). In Proceedings of the 31st European Conference on Modelling and Simulation ECMS, Budapest, Hungary, 23–26 May 2017; pp. 355–361. [Google Scholar]
  22. Li, X.Y.; Du, Y.F.; Guo, J.L.; Mao, E.R. Design, simulation, and test of a new threshing cylinder for high moisture content corn. Appl. Sci. 2020, 10, 4925. [Google Scholar] [CrossRef]
  23. Qian, Z.J.; Jin, C.Q.; Zhang, D.G. Multiple frictional impact dynamics of threshing process between flexible tooth and grain kernel. Comput. Electron. Agric. 2017, 141, 276–285. [Google Scholar] [CrossRef]
  24. Xu, L.Z.; Li, Y.M.; Ma, Z.; Zhao, Z.; Wang, C.H. Theoretical analysis and finite element simulation of a rice kernel obliquely impacted by a threshing tooth. Biosyst. Eng. 2013, 114, 146–156. [Google Scholar]
  25. Puzauskas, E.; Steponavicius, D.; Spokas, L.; Jotautiene, E.; Petkevicius, S.; Kemzuraite, A. Substantiation of concave crossbars shape for corn ears threshing. Mechanika 2016, 6, 553–561. [Google Scholar] [CrossRef]
  26. Yu, Y.J.; Zhou, H.L.; Fu, H.; Wu, X.C.; Yu, J.Q. Modeling method of corn ears based on particles agglomerate. Trans. Chin. Soc. Agric. Eng. 2012, 28, 167–174. [Google Scholar]
  27. Chen, Z.P.; Wassgren, C.; Veikle, E.; Ambrose, K. Determination of material and interaction properties of maize and wheat kernels for DEM simulation. Biosyst. Eng. 2020, 195, 208–226. [Google Scholar] [CrossRef]
  28. Boac, J.M.; Ambrose, R.P.K.; Casada, M.E.; Maghirang, R.G.; Maier, D.E. Applications of discrete element method in modeling of grain postharvest operations. Food Eng. Rev. 2014, 6, 128–149. [Google Scholar] [CrossRef] [Green Version]
  29. Yu, Y.J.; Yu, J.Q.; Zhang, M.J. Study of damping force between corn kernels and cobs based on DEM. In Proceedings of the 2nd International Workshop on Materials Science and Mechanical Engineering, Qingdao, China, 26–28 October 2018; p. 012082. [Google Scholar]
  30. Yu, Y.J.; Zhang, M.J.; Yu, J.Y.; Fu, H.; Yu, J.Q. Study of connection mechanics model and mechanical properties of corn kernel carpopodium based on DEM. In Proceedings of the 7th International Conference on Discrete Element Methods, Dalian, China, 1–4 August 2016; Springer: Berlin, Germany, 2017; pp. 1241–1251. [Google Scholar]
Figure 1. Corn ears discrete element modeling methods: (a) corn ears structure, (b) corn cob structure, (c) corn kernel structure, (d) corn cob discrete element model, (e) corn kernel discrete element model and (f) corn ears discrete element model.
Processes 09 01163 g001
Figure 2. CAD model and DEM numerical model of a drum-type corn-thresher: (a) CAD model and (b) DEM numerical model.
Processes 09 01163 g002
Figure 3. CAD model of different threshing rollers at the threshing component width of: (a) 15 mm, (b) 20 mm, (c) 25 mm and (d) 30 mm.
Processes 09 01163 g003
Figure 4. Dynamic simulation of the corn-threshing process at the threshing component width of: (a) 15 mm, (b) 20 mm, (c) 25 mm and (d) 30 mm.
Processes 09 01163 g004
Figure 5. Effects of the width of threshing component on the simulation results of threshing rate at the drum rotation rate of (a) 122.70 rpm, (b) 187.15 rpm, (c) 252.10 rpm and (d) 317.15 rpm.
Processes 09 01163 g005
Figure 6. Effects of the width of threshing component on the simulation results of threshing rate at the drum rotation rate of (a) 122.70 rpm, (b) 187.15 rpm, (c) 252.10 rpm and (d) 317.15 rpm.
Processes 09 01163 g006
Figure 7. Effects of the width of threshing component on the amount of kernel threshing at the rate of drum rotation of (a) 122.70 rpm, (b) 187.15 rpm, (c) 252.10 rpm and (d) 317.15 rpm.
Processes 09 01163 g007
Figure 8. Effects of the width of threshing component on the kernel total compressive force at the rate of drum rotation of (a) 122.70 rpm, (b) 187.15 rpm, (c) 252.10 rpm and (d) 317.15 rpm.
Processes 09 01163 g008
Table 1. Factors and levels of the simulation analysis.
Rate of Drum Rotation, rpmWidth of Threshing Element, mm
1122.7015
2187.5020
3252.1025
4317.1530
Table 2. Simulation parameters of contact model.
Simulation ParameterCob to KernelCob to CobKernel to KernelCob to BoundaryKernel to Boundary
Normal stiffness, N/m21,00012,00045,00024,00090,000
Tangential stiffness, N/m14,000800030,00016,00060,000
Normal damping factor, N/(m/s)1.481.281.172.982.81
Tangential damping factor, N/(m/s)1.211.050.962.612.48
Coefficient of sliding friction 0.450.80.290.40.27
Coefficient of static friction 0.550.90.390.50.36
Kernel density, kg/m31119
Cob density, kg/m3275
Gravity acceleration, m/s29.8
Table 3. Simulation parameters of contact bonding model between the kernel and the cob.
Simulation ParameterTangential ShearLongitudinal ShearRadial CompressionRadial Tension
Loading stiffness, N/m26993738867216.635
Unloading stiffness, N/m903711.14327.76663.047
Threshing force, N6.27.112.513.8
Publisher’s Note: MDPI stays neutral with regard to jurisdictional claims in published maps and institutional affiliations.