1. Introduction
During the last decades, efforts have been increased to generate clean energy from renewable sources to avoid polluting gases [
1]. The polymer electrolyte fuel cell (PEFC) appears as a suitable solution for portable applications due to its modularity and electrical efficiency [
2]. A PEFC generates electrical energy due to the chemical reactions that occur during the energy conversion process. Among the constitutive elements that make the energy conversion possible are the catalyst layers (CL), gas diffusion layer (GDL), and the heart of the device, the ion exchange membrane. In addition, the micro-porous layer (MPL) has also been included as a part of the PEFCs to improve fuel cell behavior [
3].
In a PEFC, CLs, GDLs, and MPLs constitute the diffusion medium. The GDL conducts the reactant gases to the so-called three-phase boundary (TPB), where the electrochemical reactions occur. The mechanical support of a PEFC and electron transport from the TPBs to current collectors are also functionalities of GDLs. In general, there are two main types of GDLs, carbon paper (randomly oriented non-woven) and carbon cloth (woven) [
4], each of them with advantages and disadvantages, as presented by [
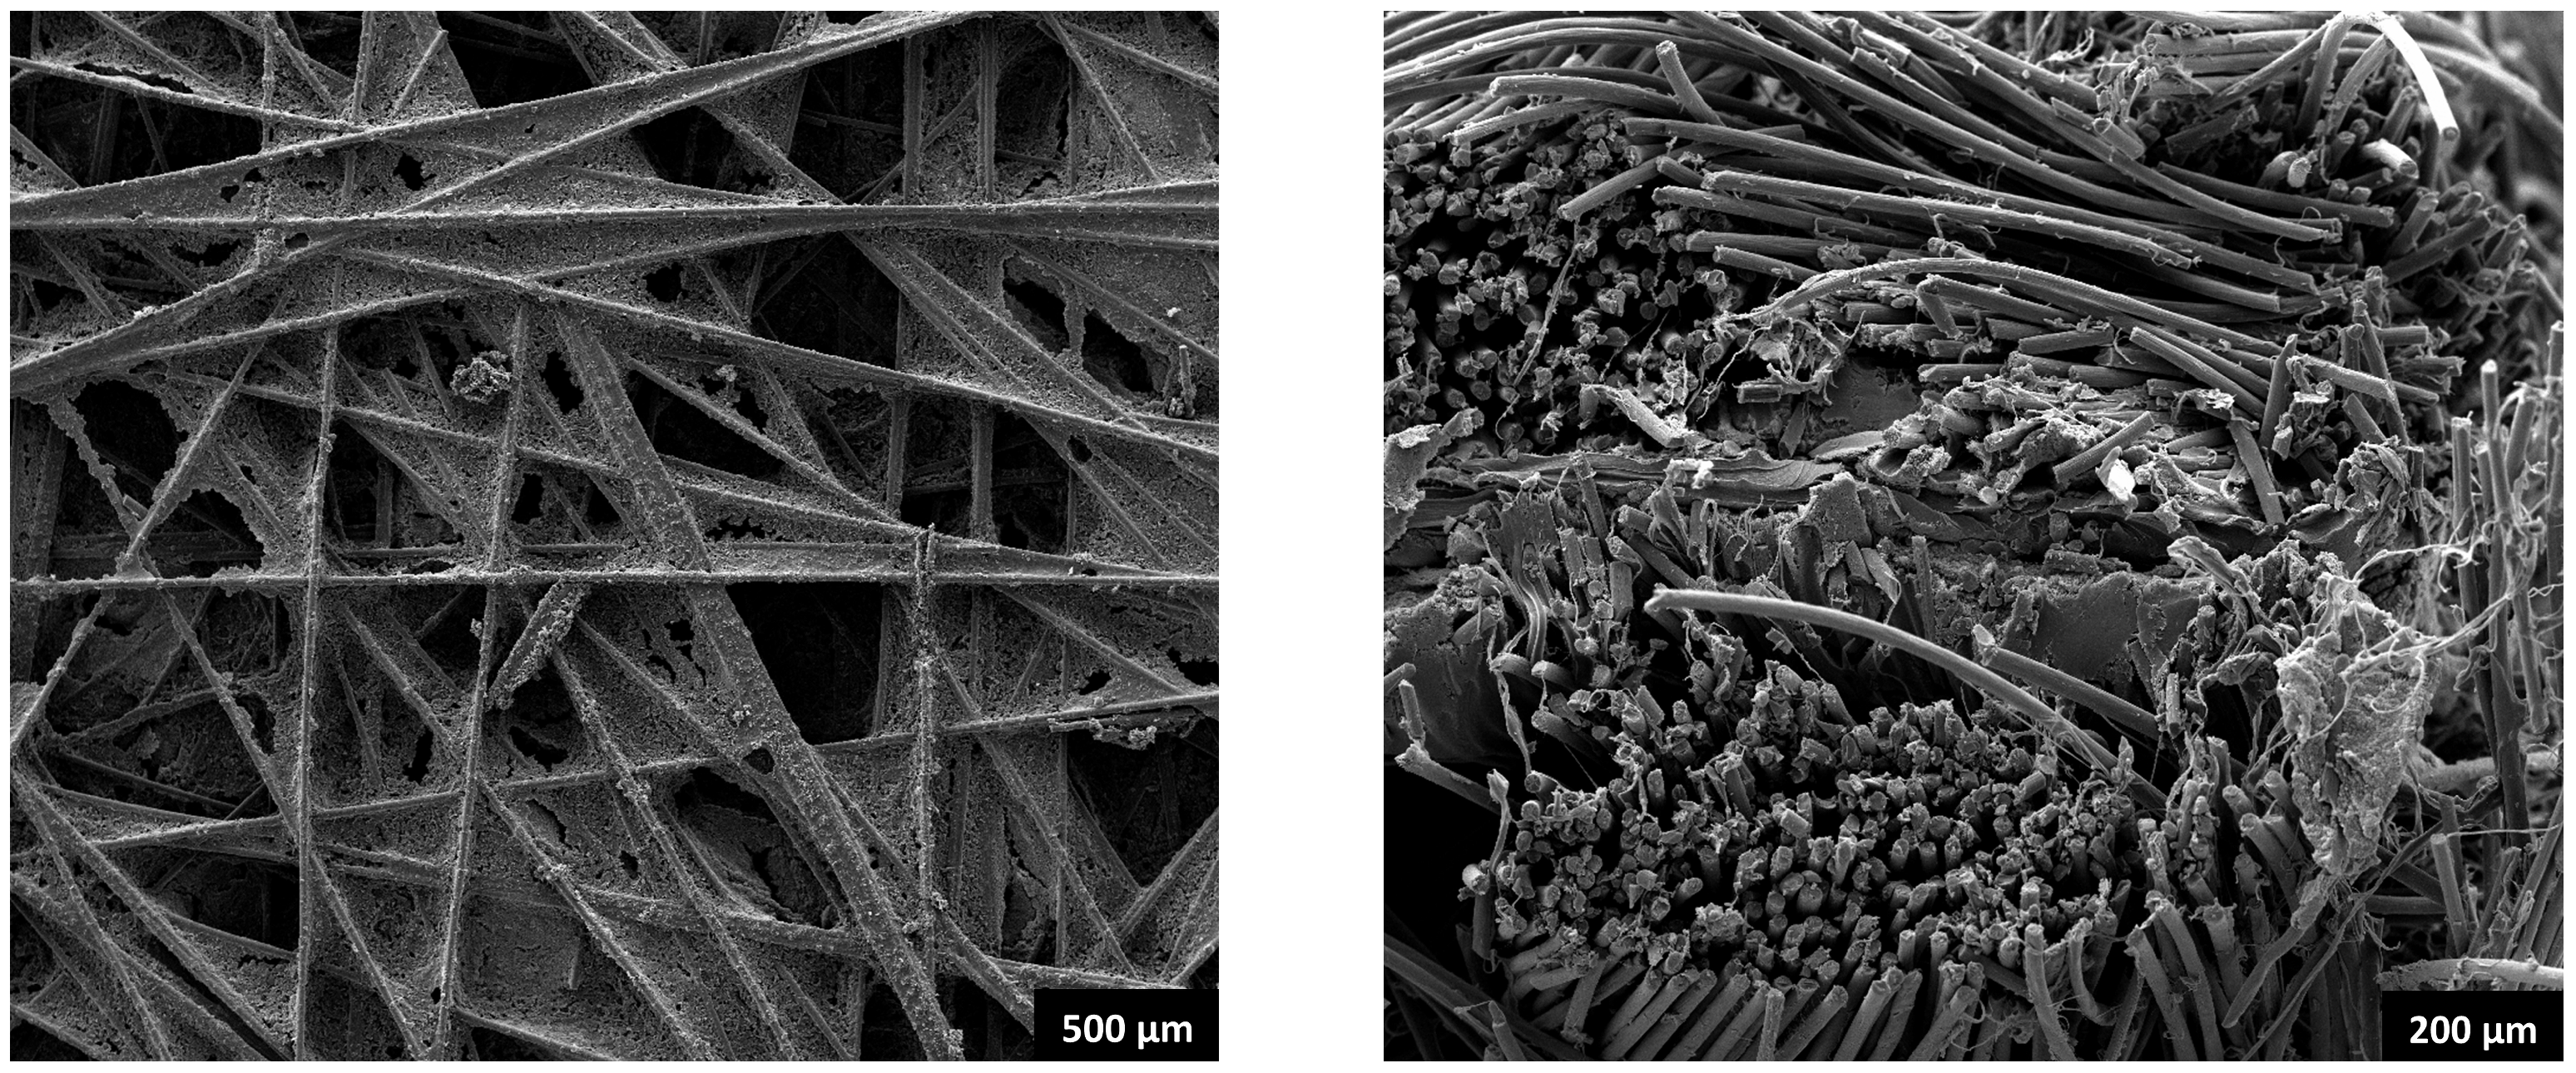
5]. Both types can be seen as a complex medium constituted by carbon fibers arranged so the reactants are allowed to pass through the void spaces, and the electrons can flow through the solid phase. Given its complex nature (see
Figure 1), the study of GDL transport properties is not an easy task from an experimental perspective, and computational tools arise as a suitable solution [
6].
3D material reconstruction approaches for PEFC can roughly be divided into [
7] the stochastic model, based on numerical simulation techniques [
8], and the 3D tomography model, which consists of using images to reconstruct the three-dimensional porous materials [
9]. Several attempts to compute transport parameters in GDLs have been carried out during the last years [
10,
11,
12]. Researchers have predicted GDL diffusion parameters from experimental and modeling points of view. The current study authors have analyzed the impact of considering the land-channel region when computing the GDL diffusion parameters using the Lattice Boltzmann method (LBM) [
13]. Furthermore, [
14] applied LBM to analyze the behavior of liquid water droplets breaking through stochastically reconstructed GDLs.
A numerical study [
15] proposes correlations to predict diffusion parameters in 3D digitally reconstructed GDLs, specifically for transport phenomena in the void space. In addition, a detailed analysis of fuel cell GDLs using fiber spacing was carried out [
16] to evaluate the effective thermal conductivity. However, no study correlates the transport parameters such as permeability, electric conductivity, diffusibility, and thermal conductivity in which the variation of the fiber diameter is considered.
This study aims to propose, based on numerical simulations, transport parameter correlations for digitally reconstructed GDLs. In addition, this study considers the physical characteristics of commercial GDLs and the impact of the fiber diameters of the GDLs.
The diffusion media are digitally created using a library of Open Pore Network modeling (OpenPNM), a powerful tool to simulate different transport phenomena in complex geometries [
17]. For example, in the void phase, the phenomena are described using the Fick and Darcy laws.
As mentioned, a GDL is a network of carbon fibers, and for each group of fibers a specific diameter is defined. This study goes from the GDL generation passing by the transport phenomena simulation for different fiber diameter values. With the obtained data, the respective correlations are proposed.
The rest of the paper is divided as follows: the second part corresponds to the methodology, which explains the generation of the media representing the GDL, the initial conditions, and the computation of the different transport phenomena involved in this study. The third part presents the results of the computed transport parameters and their subsequent discussion. Finally, the conclusions are given in the last section.
2. Materials and Methods
Due to the nature of this study, the first part describes the digital generation of the GDLs. Then, the algorithm that involves the digital construction of the complex media in three dimensions, i.e., fiber and pore positions, is presented. Initial and boundary conditions and the corresponding governing equations to compute the transport phenomena are finally described.
2.1. GDL Generation
A GDL can be seen as a thin membrane, i.e., between 100 µm and 300 µm [
18], which offers mechanical support to the PEFC and allows the transport of reactant gases, electrons, and exhaust gases during the energy conversion process. The digital representation is an array of carbon fibers randomly placed in a 3D domain in which the pore spaces allow the diffusion of reactant gases. In the current study, the analyzed domain is a cubic volume of 200 µm representing a tiny portion of a GDL. Composed of a fibrous carbon framework, the OpenPNM tries to adapt the space irregularity characterized using spherical pores and cylindrical connecting throats. A pre-established number of pores must be set to generate the media. The porous media used in this study require 600 pores stochastically distributed throughout the whole volume. A previous study by the authors has shown that geometric shapes with spheres and cylinders have a good approximation of the porous media’s natural material [
19].
Pore position and throat connections are defined using Delaunay triangulation (DT) and Voronoi tessellation (VT). The mentioned algorithms have their basis in Graph Theory [
20,
21] and allow a more accessible manner to generate porous media. The DT algorithm is responsible for forming polygons, restricted specifically to connected and convex triangles. For example, the vertices are protruding to assure at least one connection between two points paths. In this study, the DT allows distributing the pores since their positions are given by the circles’ centers circumscribed to the triangles. The mentioned distribution complies with not containing all vertices, except the three of their inscribed triangles.
Along with DT, VT is used in the GDL generation covering surfaces with irregular and convex polygons, filling all spaces and avoiding polygons overlapping. The edges or contour of the polygon represent the connecting throats between the pores for the media generation, i.e., each vertex of the polygon represents a pore and, in turn, is the center of the circumferences that circumscribe the triangles used in DT. Both processes are highly complex in three dimensions due to the optimization of distances that must be fulfilled. Hence, the Euclidean distance governs them.
In addition to the number of initial pores, the fiber diameter must be set. This study evaluates the impact on different transport properties as the fiber diameter is changed. The fiber diameter is varied between 6.0 µm and 10.0 µm in steps of 1.0 µm. Once the fiber diameters are established, fifteen GDL samples are stochastically generated, keeping the diameter constant. In the end, a total of seventy-five GDL samples are modeled, and their corresponding transport parameters are computed. The selection of the number of iterations for each simulation is justified by the computational cost that involves the simulation and computation of transport phenomena in a highly complex porous media.
2.2. Boundary Conditions
The transport phenomena analysis for the GDL samples is carried out in the through-plane direction. The inlet and outlet boundaries must be established by implementing the Dirichlet and Neumann boundary conditions to model the different transport phenomena according to the described phenomena and governing equations. Simultaneously, the boundary conditions at the four sides of the representative GDL are implemented as a periodic boundary condition.
Dirichlet boundary conditions play an essential role when the differential equations are solved. They are commonly expressed as a defined value of the solved function at the extremes of the range. For example, if a partial differential equation (PDE) is described by Equation (
1):
where
is the Laplacian operator and
is the function to be solved, the Dirichlet boundary conditions are determined by using Equation (
2):
where
is a known function defined at the boundaries. On the other hand, the Neumann boundary conditions for the same PDE presented as Equation (
1) are represented as a function of the derivative by using Equation (
3):
where
n denotes the normal direction to the boundaries.
2.3. Computed Transport Parameters
Once the transport phenomena through the porous media are simulated, setting the corresponding inlet and outlet boundary conditions, the transport parameters are computed. On the solid phase, the thermal and electrical conductivity are calculated. On the other hand, permeability and mass diffusion coefficients are computed by solving the governing equations in the pore space. The governing equations and setting initial values are described in this section.
Due to the complexity of the generated media, OpenPNM uses numerical solutions to facilitate computations and mathematical operations. Most transport parameters are described through differential equations, and OpenPNM employs discretization methods to find a straightforward solution similar to the one used by [
22]. In addition, OpenPNM uses a spreading technique to transform dense matrices into non-dense matrices, which accelerates the computations.
2.3.1. Hydraulic Permeability
The hydraulic permeability of a porous medium is related to its ability to allow a fluid to pass through it without causing internal modifications to its structure. There have been several attempts to approximate the permeability to the porosity from experimental and theoretical points of view [
22], some of them without considering the morphological characteristics of the porous media. OpenPNM makes use of Stokes law to analyze the movement of steady flow through the medium under the condition of low Reynolds number
[
23] and considering Equation (
4):
where
p is the fluid pressure,
u is the fluid flow velocity, and
the dynamic viscosity. Thus, the continuity equation is necessary, as in Equation (
5):
Based on the average velocity obtained from the flow distribution of the Stokes flow and pressure gradient, the hydraulic permeability is calculated by using Equation (
6), named Darcy’s law [
19]:
where
is the dynamic viscosity,
is the average volume velocity of the fluid,
is the pressure gradient, and the permeability of the studied medium is given by
K.
In this study, Dirichlet boundary conditions must be used to mimic the pressure gradient applied at the porous media’s inlet and outlet surface. Therefore, for the porous media simulation, the inlet and outlet boundary conditions were set to 2 atm and 1 atm of pressure, respectively, along with the direction of the central flow axis (+Z).
2.3.2. Effective Mass Diffusivity
The mass transport phenomena in a GDL is also affected by the morphological characteristics of the media. The bulk diffusivity with the classical continuum mechanics approach by solving Laplace’s equation can be expressed by Equation (
7) [
24]:
and solved for the concentration
c in the pore space and the computational domain
(GDL pores). This solution gives us the total diffusion flux
j, and according to Fick’s law, it is calculated by using Equation (
8):
Then, the effective mass diffusivity coefficient of the GDL is determined by using Equation (
9) [
25]:
A GDL Toray-090 type has a diffusive mass coefficient of around 0.20 cm2/s. The boundary conditions are associated with the concentration gradient between the inlet and outlet of the analyzed samples. In this study, the inlet boundary condition is established at 2.25 kg/m3 while the output at 0.50 kg/m3.
3. Results and Discussion
In this section, a sample of generated GDL is presented, and the results of different transport parameters are depicted as a function of the fiber diameter. In addition, correlations to predict the transport parameters are presented.
3.1. GDL Generation
As mentioned, the generated-medium geometry corresponds to a cube, a small fraction of what a GDL is. In general, it is composed of pores and throats (spheres and cylinders) and a network of fibers.
Figure 2 shows the fibers’ framework of a GDL. The fibers are not allowed to reach out of the simulation domain. OpenPNM has already been used with Python, ANN has already been used with Python, and assumptions are considered to be able to model, so it has been widely used to perform simulations, computations, and other analyses. For example, the simulation domain is representative of a real GDL as presented by Shintato et al. [
26] and Bevilacqua et al. [
27].
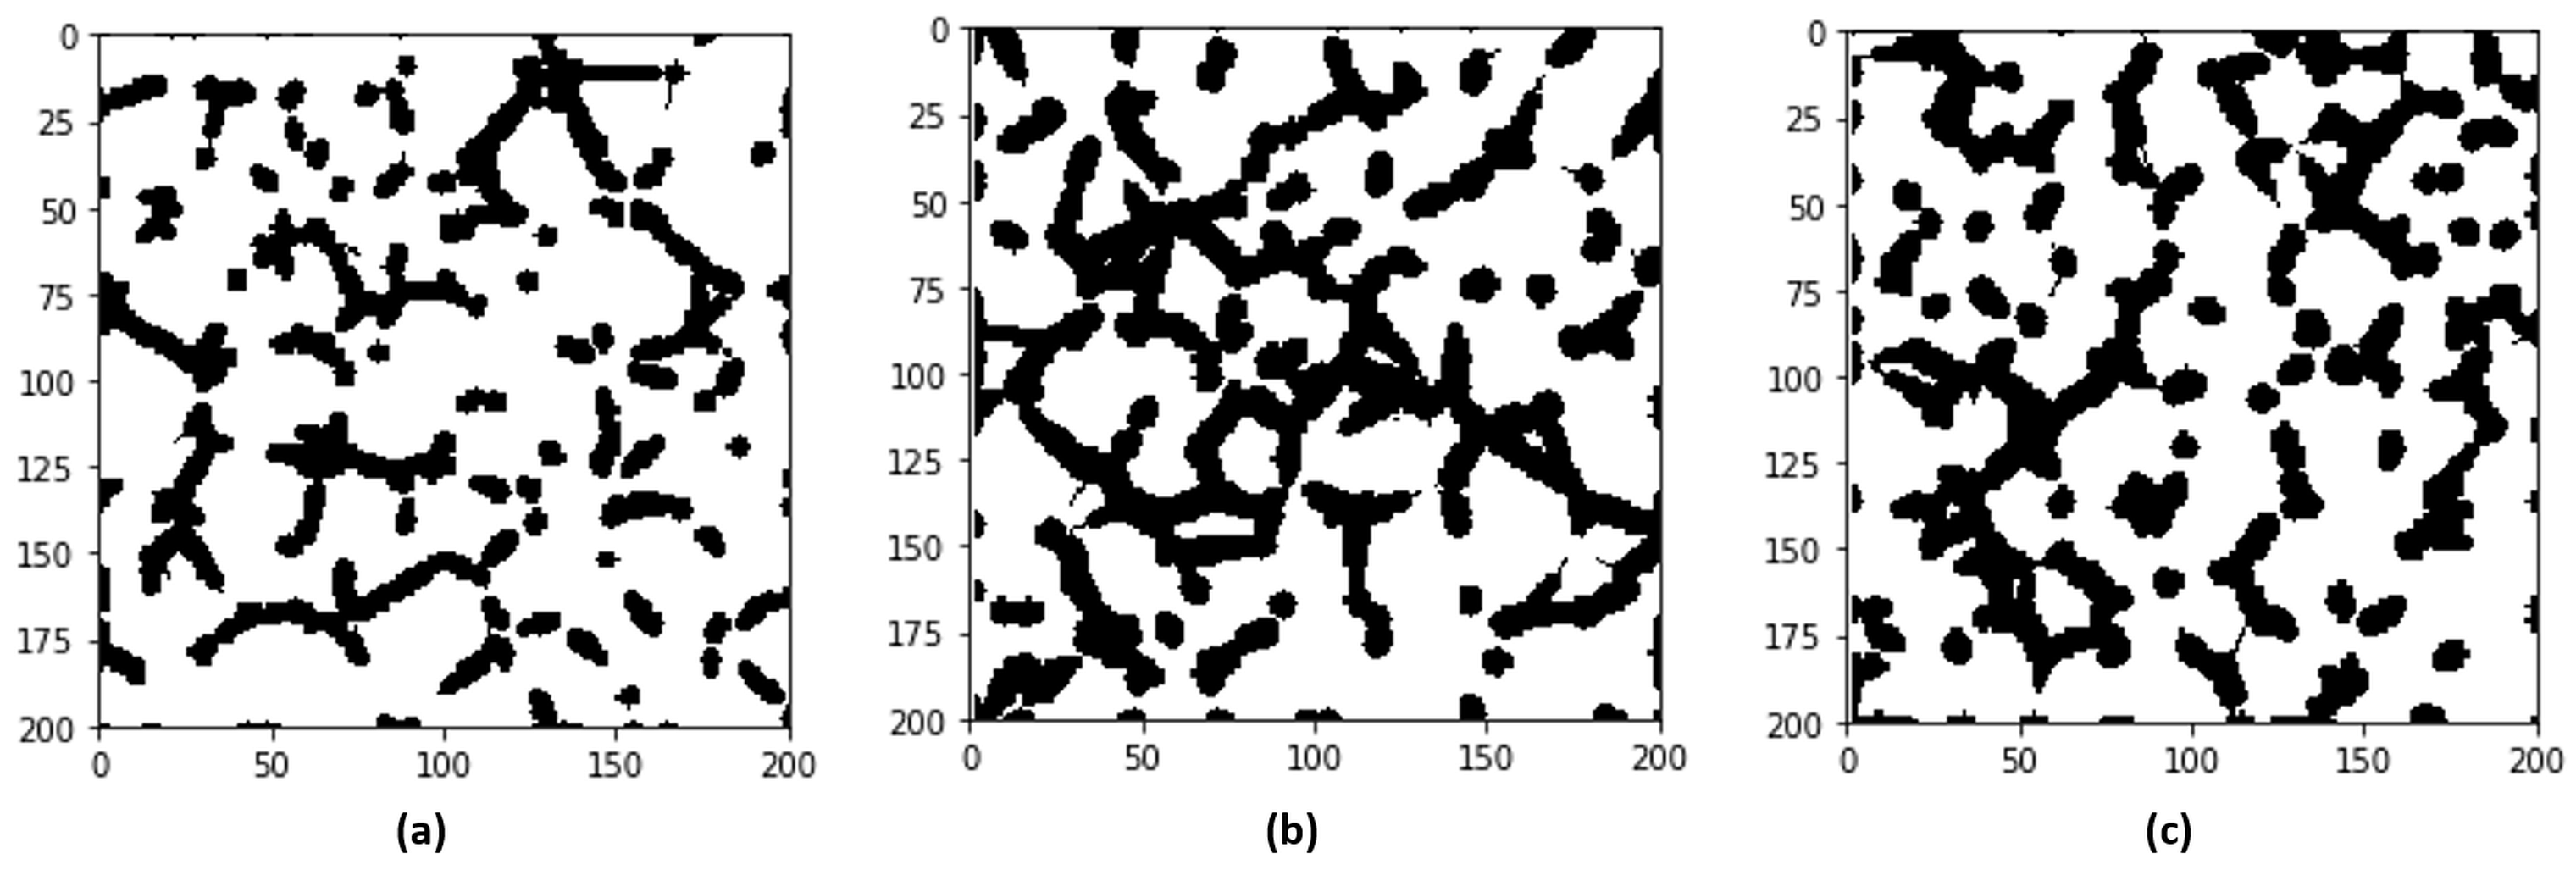
To observe the internal configuration of generated GDLs, a mid-plane image has been selected for three different fiber radii.
Figure 3 shows the solid material, i.e., the carbon fibers, in black, while the space is white.
Figure 3a shows the cross-sectional view of a GDL in which the diameter of the carbon material is 6 µm; in
Figure 3b, the radius of the fiber is 8 µm, while in
Figure 3c, the cross-sectional image shows fiber materials with 10 µm radius.
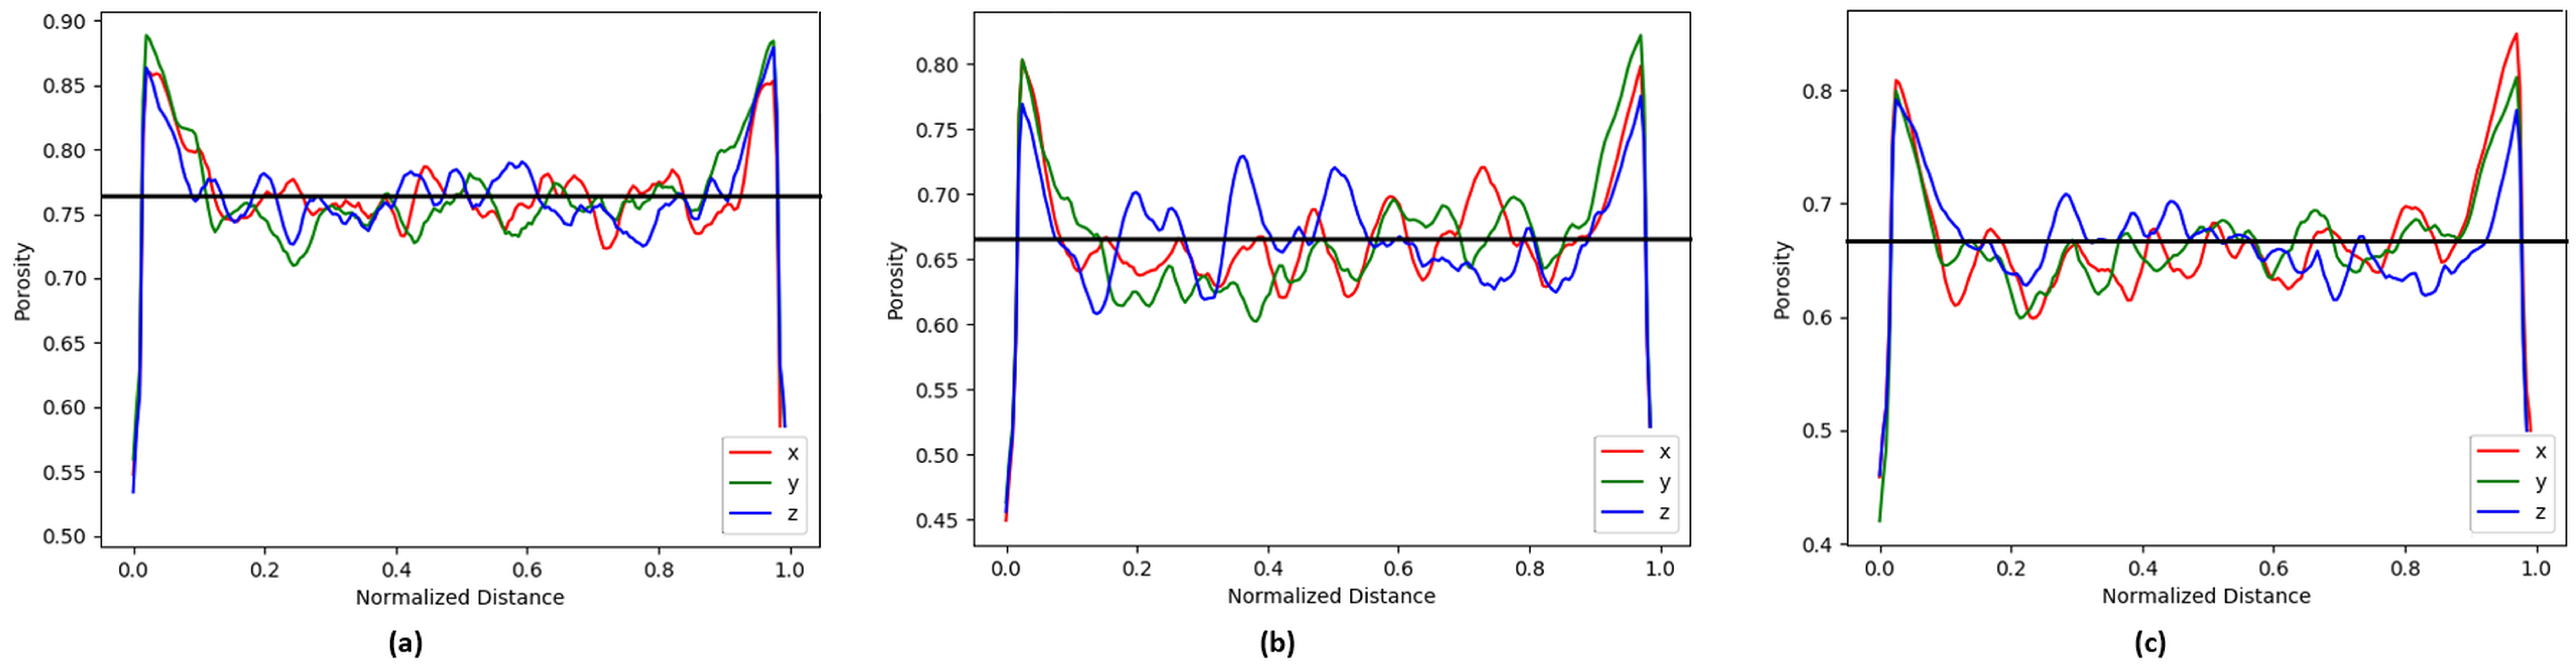
3.2. Bulk and Local Porosity
Porosity is one of the essential characteristics of the GDLs. It defines how much of the total volume can transport the reactant gases during the energy conversion process. Therefore, it impacts the efficiency of the PEFCs. Although the obtained bulk porosity from models is similar to what is defined for commercial ones, the local porosity can reach values as low as 0.42, especially at the material’s surface. Therefore, the local porosity is measured for each GDL sample’s three directions, i.e., the X, Y, and Z directions. In
Figure 4, the bulk and local porosities for three selected GDL samples are presented. The bulk porosity is presented as the horizontal straight black line. In contrast, the local porosities are represented by red, green, and blue colors for X, Y, and Z local porosity, respectively. The local porosity minimum at the edges is a result of the way in which the representative GDL are digitally created. It is low since it is calculated at beginning of the plane. As observed in the same figure, the local porosity is stabilized as certain depth is reached. This approximation is obtained by using OpenPNM, and it has been used accordingly in previous studies by Gostick et al. in [
17,
28].
It is observed that the bulk porosity decreased as the fiber diameter increased, which occurred due to the increment in the diameter, reducing the empty spaces. As a result, the porosity for the selected GDL samples decreased from 0.78 to 0.67. The entry and exit of the medium presented lower porosities due to the fiber density at the boundaries.
3.3. Transport Phenomena Modeling
Modeling the different transport phenomena over the digitally generated GDLs allows us to compute the transport parameters according to the specified boundary conditions. The hydraulic permeability and the mass distribution are obtained after solving the corresponding differential equations in the void spaces. For each transport phenomenon, fifteen GDL samples were modeled with similar characteristics having the possibility of computing the average value and their corresponding uncertainty.
3.3.1. Hydraulic Permeability
To obtain the hydraulic permeability the pressure gradient must be established in the boundary of the GDLs. The pressure gradient is applied along the main flow direction, i.e., the Z-axis. The boundary conditions satisfy this gradient due to the decay of the pressure through the medium. Once the velocity field through the porous media is computed, the hydraulic permeability is obtained.
Table 1 presents the possible correlations used to predict hydraulic permeability as a fiber diameter function.
Although all the correlations in
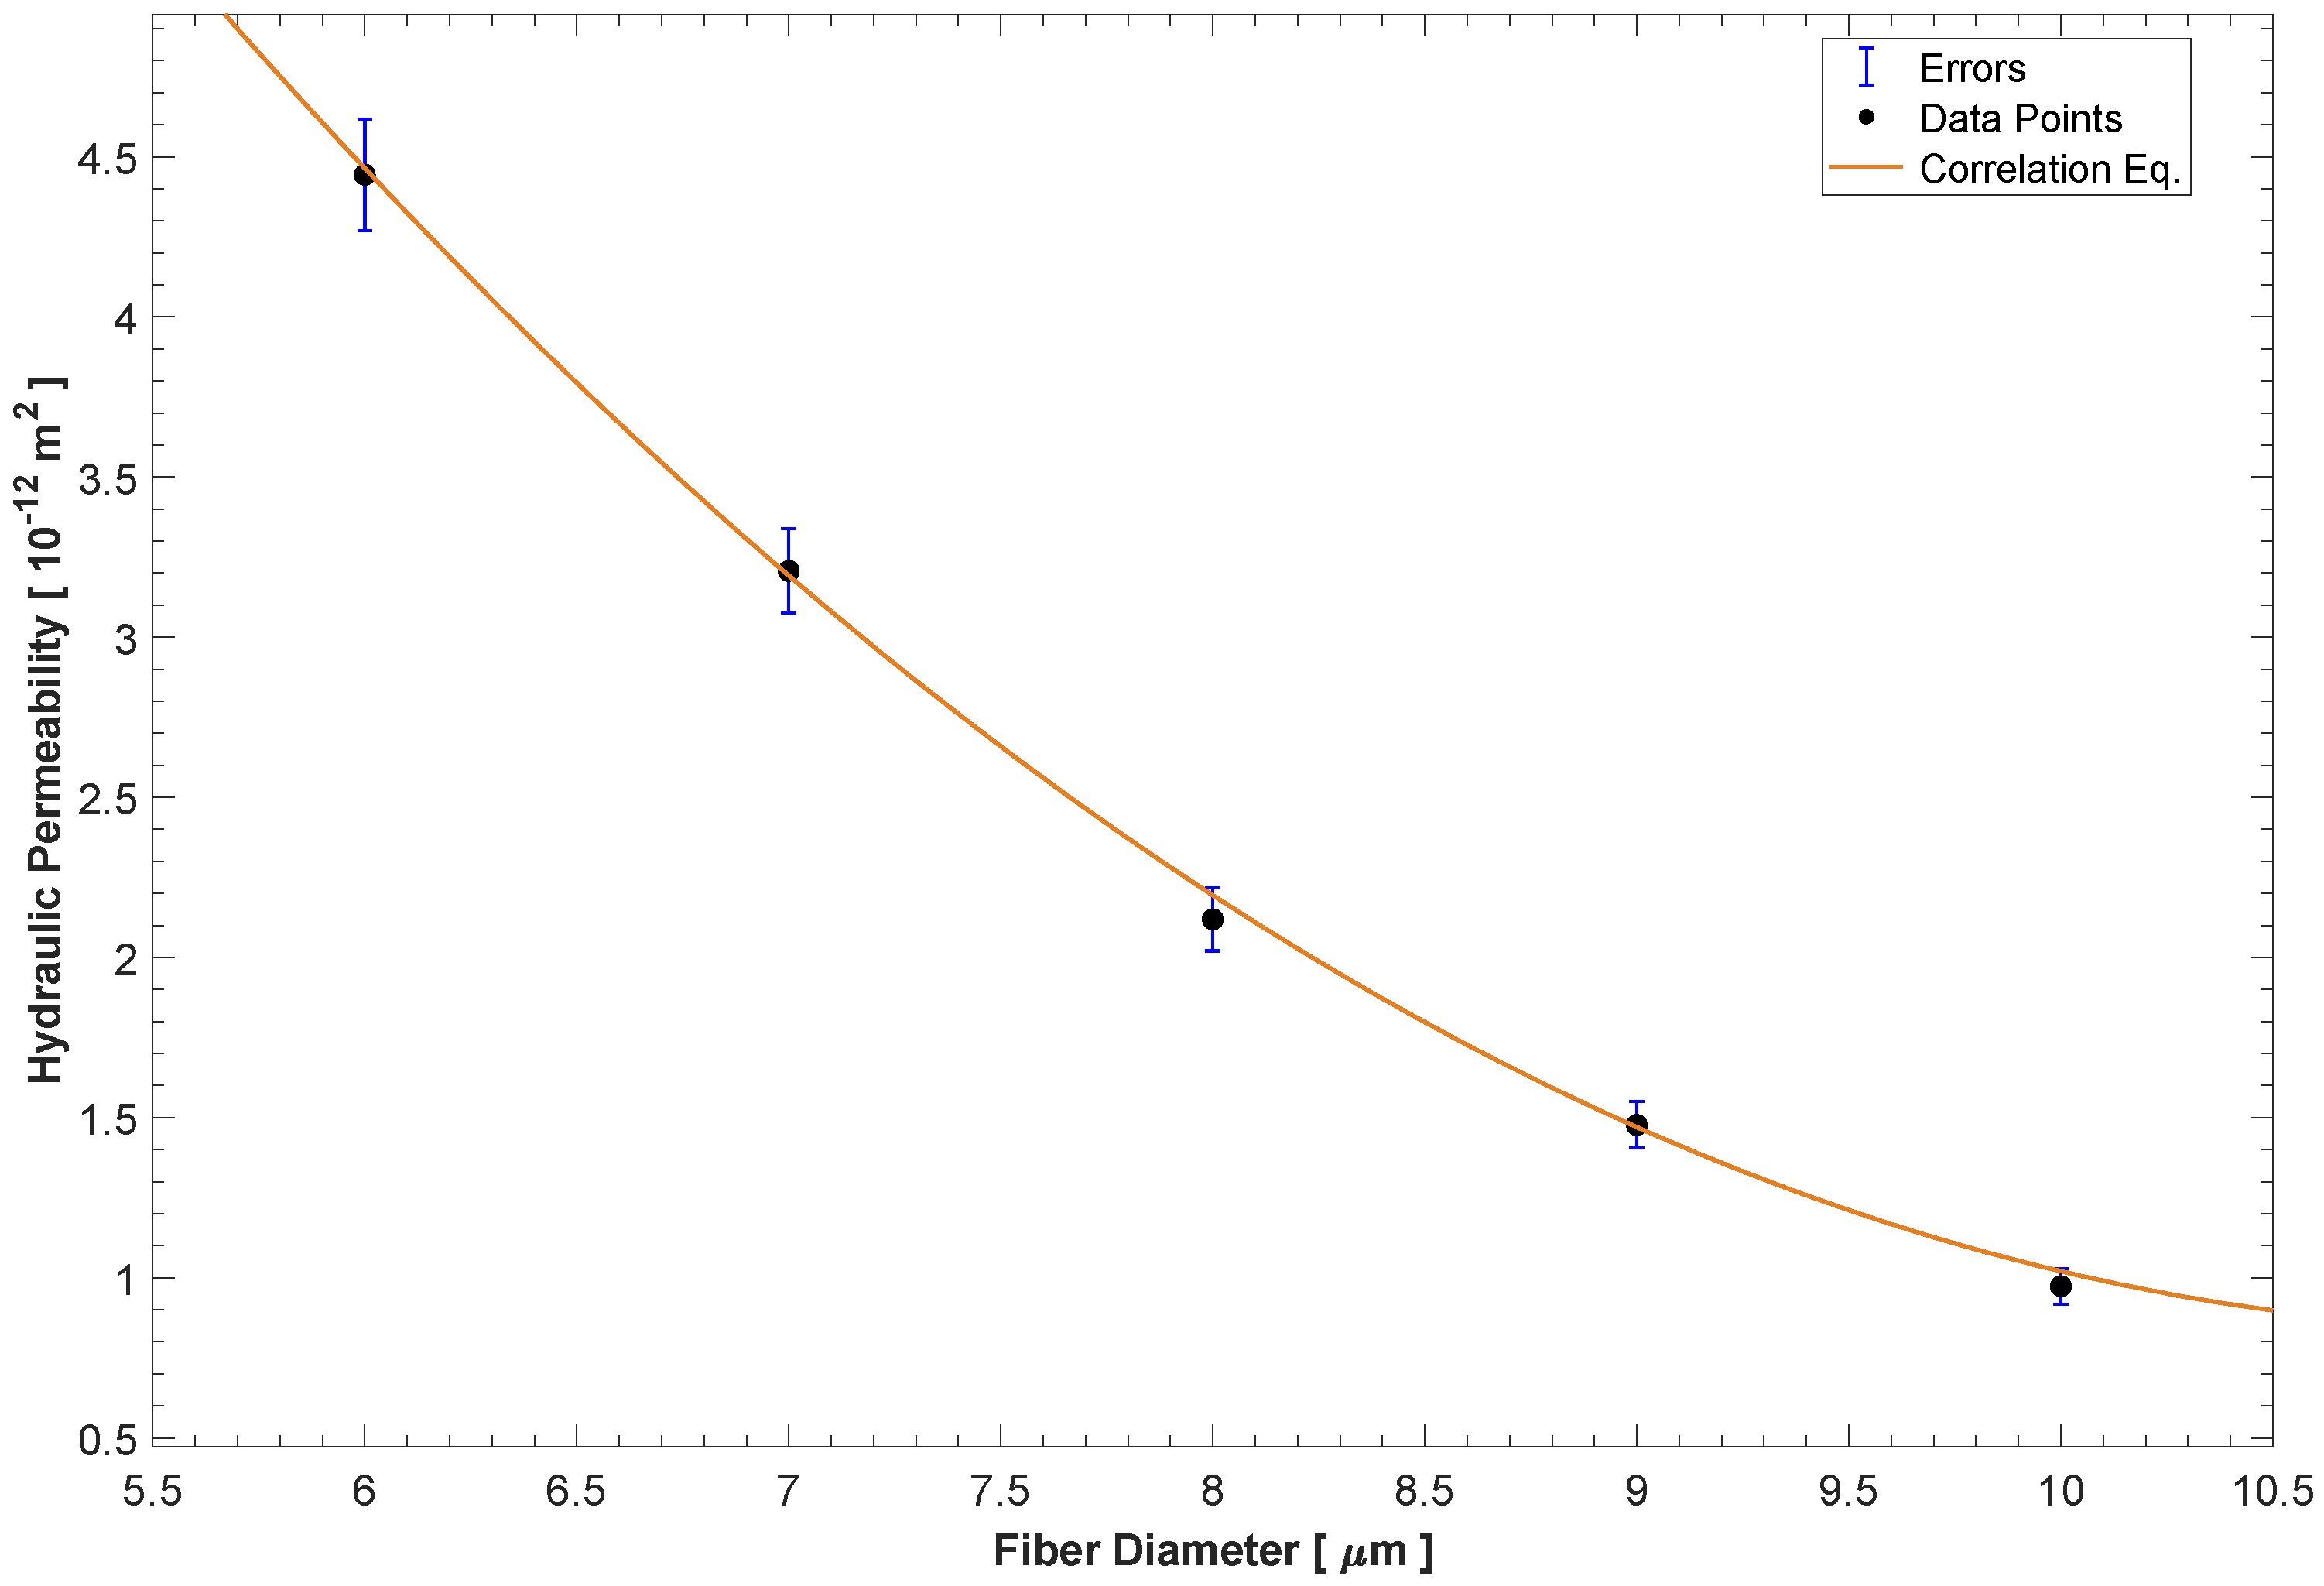
Table 1 present acceptable R-squares, the best one was the polynomial correlation. It is possible to say that 99.93% of the obtained data can be represented with a correlation with a confidence interval of 95%. According to the obtained data, with an R-square of 0.9993, the correlation has the form showed in Equation (
10):
Here,
K is the hydraulic permeability,
is the diameter of the fiber, and {
a,
b,
c} are the parameters of the equation which, after using the fitting tool, the correlation is expressed by using Equation (
11):
Figure 5 shows the obtained hydraulic permeability data along with the proposed correlation. Additionally, each fiber diameter is associated with the respective hydraulic permeability, and their corresponding uncertainty is based on all modeled samples. Trend and correlation show that the fiber diameter increment resulted in a decrement in the hydraulic permeability.
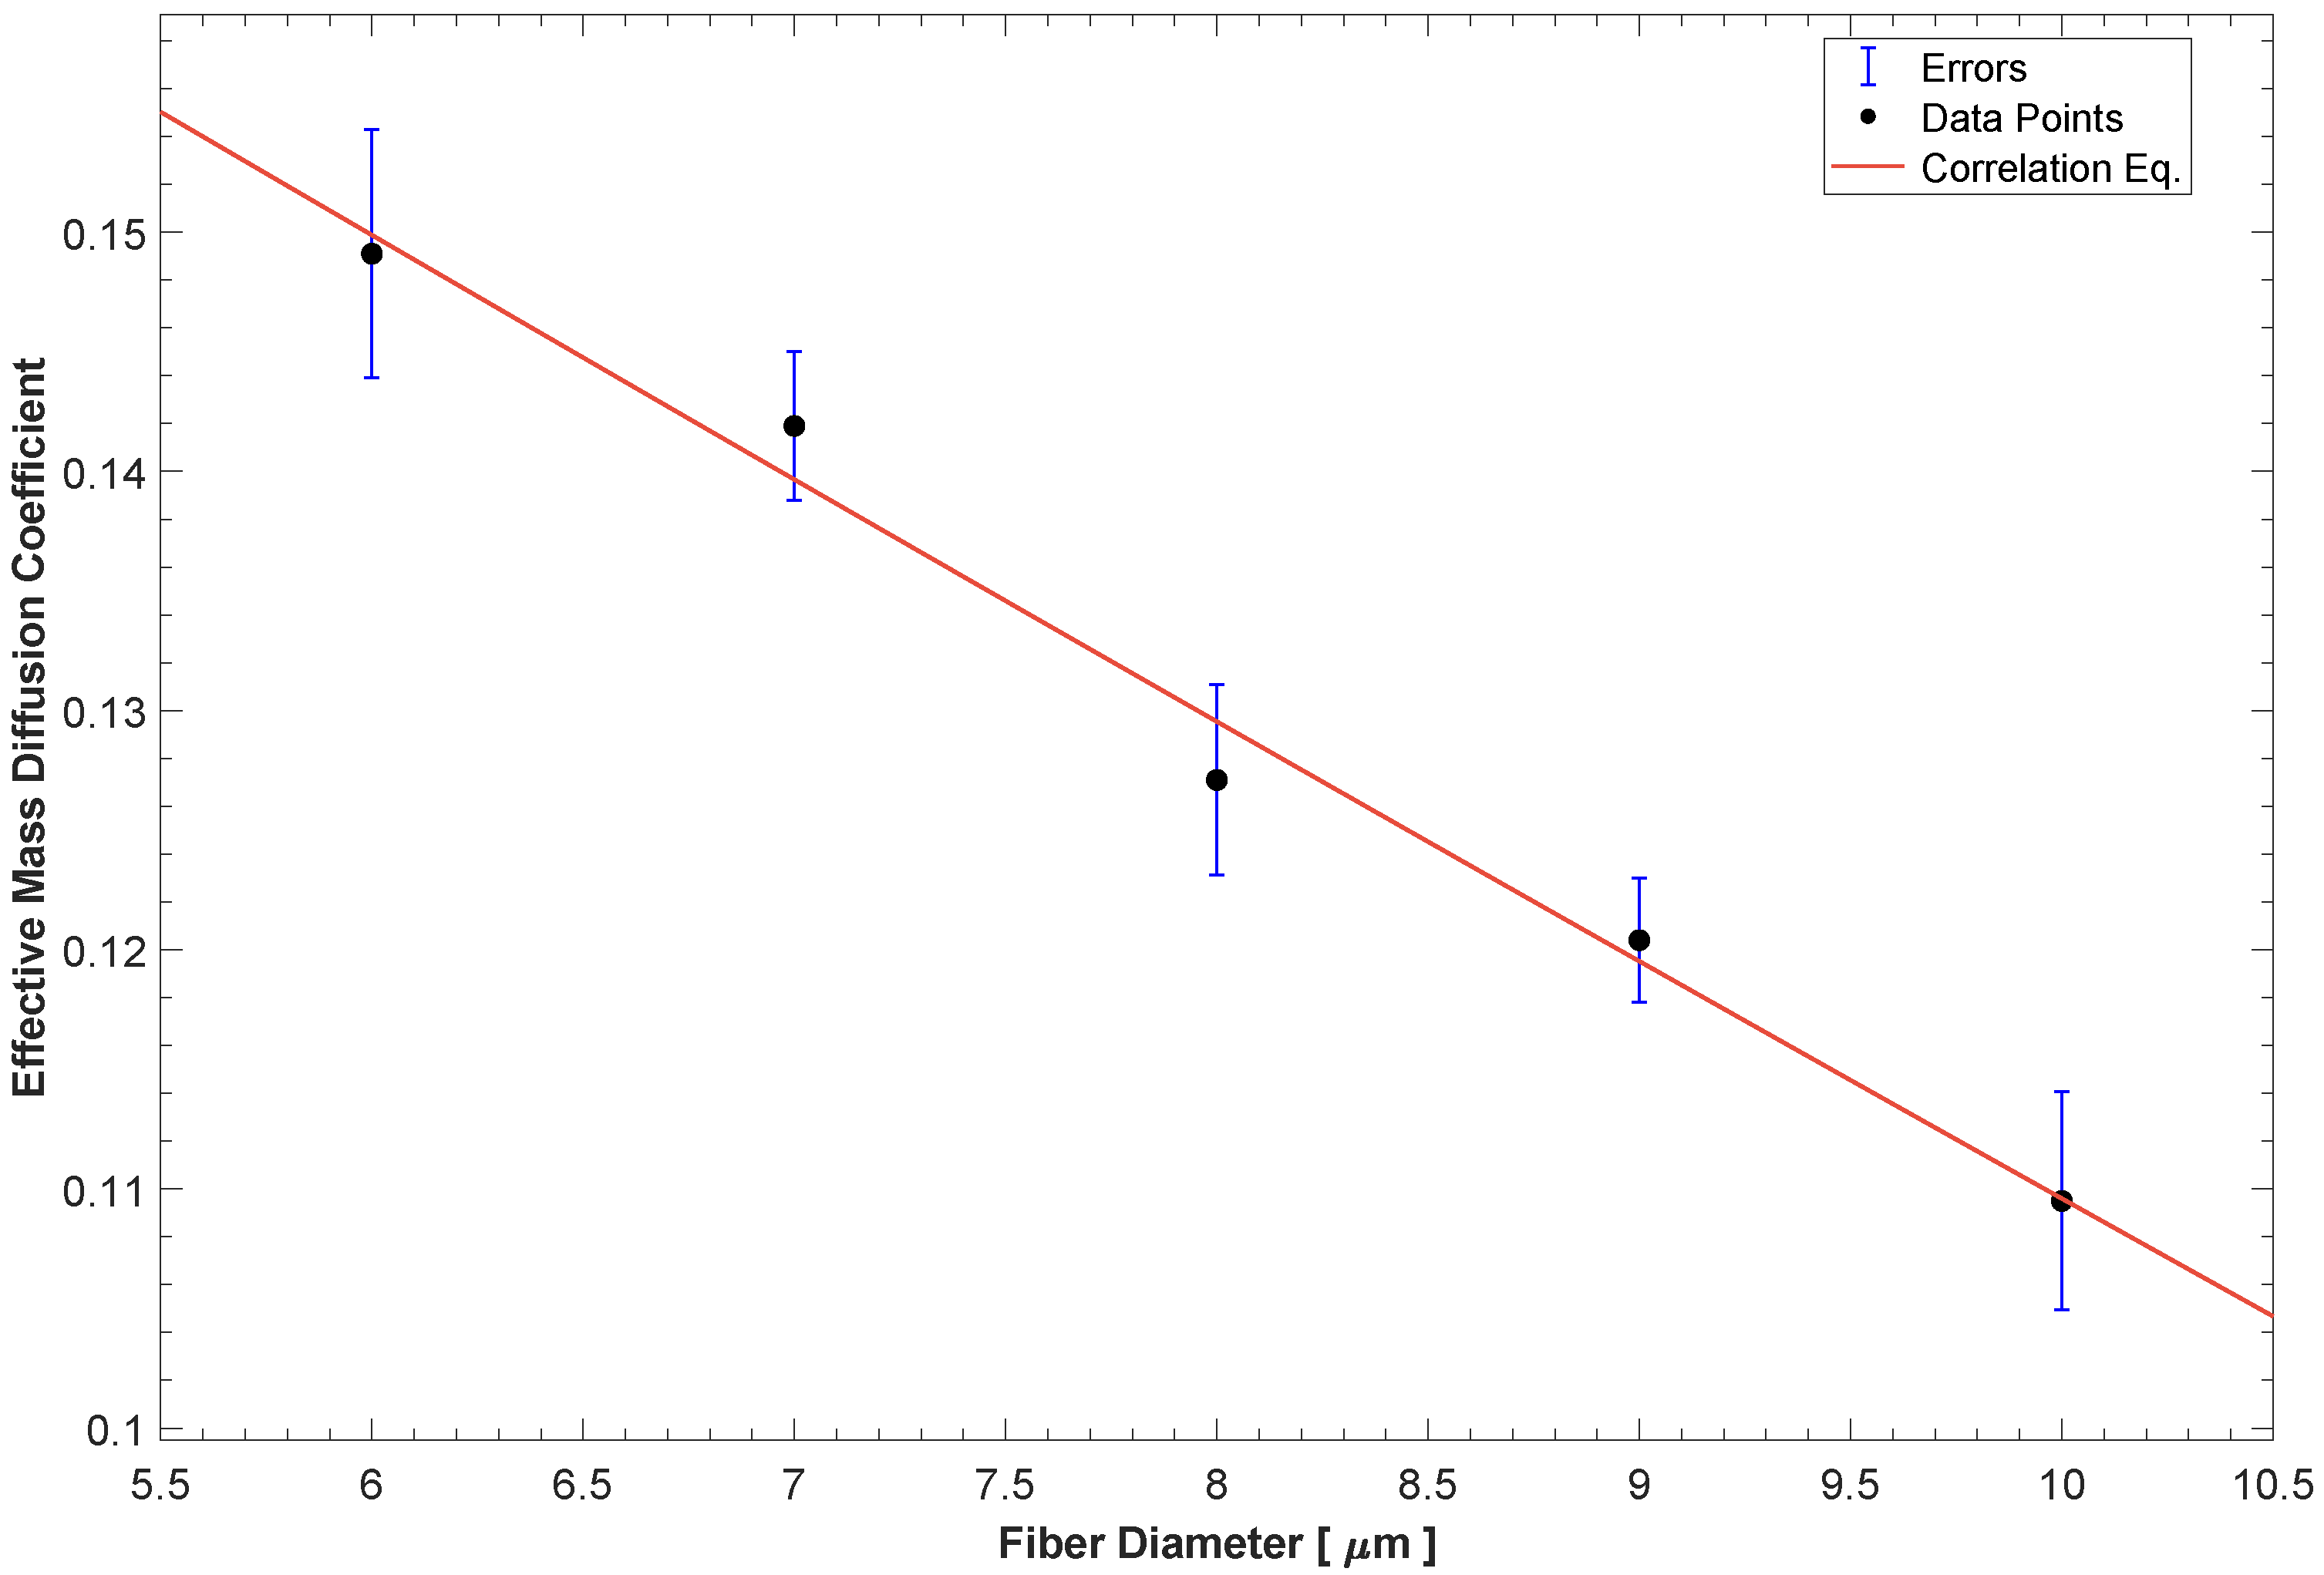
3.3.2. Effective Mass Diffusion Coefficient
The mass concentration distribution is computed for the void spaces within the GDLs. As expected, the mass concentration decay is in the direction of the concentration gradient. Therefore, it allows us to compute the effective mass diffusion coefficient for each corresponding fiber diameter. Three different correlations are selected to describe the effective mass diffusion coefficient using the computed data and fitting tools.
Table 2 presents the characteristics of the correlations.
Comparing the three proposed functions and their adjustment to the data, the correlation that predicts 99% of the data is the polynomial one, and it is expressed by Equation (
12):
where
is the diameter of the fibers forming the GDLs.
Figure 6 shows the selected correlation together with the obtained data from the GDL models.
4. Conclusions
The OpenPNM library has been a powerful tool for solving different transport phenomena in complex geometries such as GDLs. For example, GDL samples represented by cubes of 200 µm have been used to mimic four different transport phenomena in the current work. The modeled transport phenomena allow us to compute the transport parameters such as hydraulic permeability and mass diffusion coefficient. The primary variable considered in this work is the GDL fiber diameter.
A pair of correlations is proposed for predicting the mentioned parameters as a function of the fiber diameter. Although all the correlations have similar trends, the functions representing the parameters are expressed as to potential, power, or polynomial. For all cases, the parameter decreases as the fiber diameter increases.
OpenPNM has demonstrated its suitability since it generates the porous media and solves the different governing differential equations within the GDLs. Furthermore, the complexity of the generation process provides a high degree of closeness to reality, which allows us to guarantee that the results of the modeling of the GDLs coincide with other tools’ performance. Finally, for this research, the fiber’s diameter has been considered the main parameter. However, the porosity and tortuosity of the medium are factors with a high impact on the GDL efficiency. Therefore, future work should propose correlations between the transport phenomena and these two parameters to observe their impact on the studied variables.


 ,
, 


