Abstract
At present, the theoretical estimation of paper web’s evaporation heat is based on sorption isothermals. The measuring conditions are harsh, and the test speed is slow. This paper attempts to explore a theoretical method which can quickly determine the evaporation heat of paper web. During the new method, based on the measurement of the paper drying curve, the theoretical estimation model of paper evaporation heat was obtained by deducing the mechanism of heat and mass transfer. Compared with the traditional method based on sorption isothermals, the new model based on the drying curve has some advantages in measurement speed and easy access to basic data. Finally, the paper verifies the reliability of the model from two application scenarios of the laboratory and production line.
1. Introduction
Paper is a kind of hygroscopic material with a porous structure, mainly composed of fibers and other solid particles, such as fillers, sizing materials, additives and so on. Paper products play a significant role in every area of human activity, such as the recording, storage and dissemination of information, wrapping and packaging, writing and printing and so on. Papermaking is a basic raw material industry, closely related to the national economy.
The paper-making process is essentially a very large dewatering operation. The major sections of the paper machine consist of: the forming section, press section and dryer section. The dryer section removes between 1.1–1.3 kg of water per kg of paper production, as compared with the 200 and 2.6 kg removed in the forming and press section [1]. Although the dryer section is responsible for a small fraction of total dewatering, it is the major energy consumer in the paper mill because porous and hygroscopic pulp fibers have hard-to-remove water that is considered to be located in the fiber cell wall and trapped in the fiber network geometry. According to the report prepared by the Institute of Paper Science and Technology (IPST), 61.9% of the total energy required for paper making is consumed in the paper drying process [2], and about 65% of the thermal energy is used for water evaporation based on Chen’s investigation [3,4]. In spite of its key role in papermaking and its high energy consumption—taking approximately 60% of the total physical length and accounting for almost 40% of the total capital cost of a common paper machine—paper drying is arguably the least understood papermaking operation. Perhaps the reason is the complexity of the paper drying process that involves heat transfer, evaporation, and the water removal process where steam pressure, air conditions, and condensate removal play key roles in determining the drying capacity and final product quality. The papermakers often treat the dryer section as a “black box”. Nevertheless, rising energy costs are forcing papermakers to pay more attention to the dryer section, and especially steam usage.
The thermal energy consumption during paper drying is mainly used to evaporate the water in the moist paper. According to the diverse binding force, the water in the moist paper can be divided into different types, such as free water and bound water, of which thermodynamic and physical properties are different. For the bound water, evaporation heat is used not only to vaporize water, but also to overcome the interaction between cellulose fibers and water. The quantitative measurement of evaporation heat is important to understand the interaction between fibers and water (drying mechanism) and the resulting impact on the paper drying behavior for optimizing the capital and operating costs of the dryer section.
At present, there are few studies on the quantitative measurement of evaporation heat, mainly because heat energy flow is difficult to measure directly. Heikkilä [5] studied the evaporation heat of coated paper and found that the evaporation heat of bound water was composed of two parts, latent heat of vaporization and an extra amount of energy called heat of sorption. The latent heat of evaporation is the same as that of pure water, which can be easily obtained by consulting the physical property data of water, but the data of sorption heat is difficult to obtain. At present, the traditional method to obtain the sorption heat is to establish its theoretical model based on the Clausius–Clapeyron equation, and the theoretical model estimation needs to use the data of paper sorption isotherm [1]. Taking mechanical pulp as an example, the theoretical estimation equation of sorption heat is as follows:
where Equation (1) is the calculation model of sorption heat (∆Hsorp), Rv is the gas constant, Tp is the paper temperature, and u is the paper moisture, Equation (2) is an example of fitting equation of sorption isotherm(φ), c1, c2, c3 and c4 are the equation parameters.
This model had been widely used in modeling and simulation of the paper drying process. For instance, Slätteke [6] established a complete simulation model for the drying section that is implemented in the object-oriented modeling language Modelica. The purpose is to study the feedback control of paper drying. Roonprasang [7] made a theoretical study on the modeling and simulation of the impact of new design configuration geometry on the drying process, with means of theoretical estimation model of evaporation heat. Karlsson [8,9] presented several models for the drying section to describe the phenomena at a steady state. New control strategies applicable for both steady-state control and for grade changes were derived. Heo [10] used the theoretical estimation model of evaporation heat to model and simulate the state change of paper in the drying section, trying to solve the problem of the “black box” in dryer section. Åkesson [11] used the theoretical estimation model of evaporation heat to present a Modelica library, DryLib, which enables users to rapidly develop complex models of dryer section. In addition, parameter optimization by means of non-linear model predictive control is treated.
Nevertheless, there were still many inconveniences in the practical application in the process of using the above model based on the sorption isotherm. The main reason is that the data of sorption isotherm curves of different paper grades in the industry are very few. The sorption isotherm is a correlation between relative humidity and the equilibrium moisture content. The measurement of the sorption isotherm is time-consuming and difficult, requiring strict test conditions such as constant temperature and humidity [12,13]. Measurement of sorption isotherms is a common practice in many fields of science and engineering, such as food science, material science, and so on. Traditional methods to determine sorption isotherms usually rely on conditioning above saturated salt solutions that keep constant relative humidity and gravimetric methods to determine the moisture content in the sample. In order to reduce the systematic error caused by the change of relative humidity around the sample during sampling and weighing, the whole experiment process, including water balance and weighing, needs to be kept under the same relative humidity. Many different relative humidity are needed to determine a complete sorption isotherm, as at each relative humidity the water balance of the sample takes a long time. Therefore, the measurement of sorption isotherm line is very time-consuming.
The sorption isotherm of paper depends on the structure of the paper and the fibers and other raw materials used to manufacture the paper. Keränen [14] has studied handmade paper’s sorption isotherms with different filler contents. Fitting the experimental data with the Soininen model, it was found that the model parameters was obviously different corresponding to the different filler content. Popescu [15] studied the adsorption isotherm of wood and got the similar conclusion. There are more than 1000 kinds of paper in the current paper-making industry; according to market demand, each kind of paper’s manufacturing process has been frequently adjusted in the actual production process. How to rapidly estimate the evaporation heat of the frequently changing paper, and then guide the dryer section to optimize the process parameters in time, is a new problem encountered in the process of paper enterprises in pursuit of energy saving and consumption reduction. The traditional estimation method based on sorption isotherm obviously can not achieve the purpose of rapid measurement, and can not adapt to the rapidly changing market demand. Therefore, developing a simple approach for rapidly measuring the evaporation heat of paper is urgent.
The drying curve is an overall indication of the paper drying process, covering all the information during paper drying, and including paper’s evaporation heat [16,17]. The current study attempts to explore a simple method for rapidly measuring evaporation heat based on the drying curve measurement. Generally, the drying curve is a curve that changes in the moisture content of the material with the drying time. In the papermaking industry, it was also expressed by a correlation between paper moisture content and drying position (cylinder number) [18]. The new method starts from the measurement of the drying curve, and no longer needs to measure the sorption isotherm, which makes the measurement of evaporation heating time-saving and convenient.
2. Methodology
2.1. Theoretical Model Based on Drying Curve
The moist paper consists of water in different fractions, free water in large pores and bound water in micro pores. They have different thermodynamic and physical properties, such as different vapor partial pressures, enthalpies and so on. The thermodynamic and physical properties of free water being same as that of bulk water. The binding force of free water is small, generally, it evaporates first in the drying process. Drying decreases the level of fiber swelling by closing the pores in a fiber cell wall irreversibly. The removal of bound water needs to overcome such resistance, so with the passage of time, it is more and more difficult to remove water by drying, so it also needs to consume more heat energy.
During the drying process, wet paper passes through three distinct phases, including the preheating phase, c, and the falling drying rate phase. In the preheating phase, part of the heat of the heating medium is used to heat the paper, and the paper temperature increases rapidly, but the moisture content of the paper changes little with the drying time. Then, the paper drying enters the constant drying rate phase, and the moisture content of the paper is basically linear with the drying time. The slope is constant, that is, the drying rate is constant. At this time, the heat transferred by the heating medium to the paper and the heat required by the evaporation of the water in the paper are in balance, and the surface temperature of the paper remains unchanged, which is just equal to the wet bulb temperature of the hot air around the paper surface. After a period of time, when the moisture content of the paper is lower than the critical moisture content (CMC), the paper drying enters the deceleration stage. In this stage, the drying characteristic curve tends to be flat, gradually approaching the equilibrium moisture content (EMC), and the drying rate decreases. Part of the heat provided by the heating medium is used to evaporate water, and part is used to heat the paper, and the surface temperature of the paper continues to rise. The above idealized scheme occurs if drying conditions are similar over the entire drying process. In commercial dryer sections, the constant rate phase does not often exist.
The schematic diagram of the evaporation heat measurement based drying curve is shown in Figure 1. It shows that the one-to-one correspondence function between the evaporation heating curve (Figure 1a) and the drying curve (Figure 1b) can be established theoretically during the paper drying. The specific derivation process is as follows:
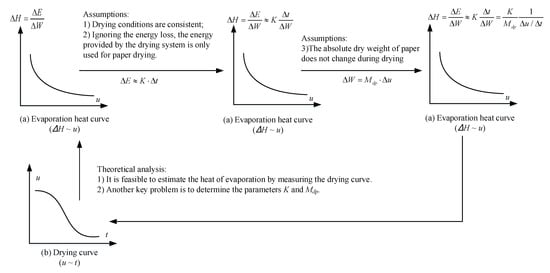
Figure 1.
Schematic diagram of evaporation heat measurement based drying curve: (a) Evaporation heat curve; (b) Drying curve.
The evaporation heat (∆H) in the paper drying process refers to the energy consumed by the evaporation of water inside the paper sheet and the final release. As shown in Figure 1a, it is a curve where the y-axis is evaporation heat (ΔH) and the x-axis is the moisture of the paper (u), u is a state variable, which can be easily obtained by weighing the paper sheet. ΔH is a process variable, which can be calculated by Equation (3).
Energy consumption(ΔE) is difficult to measure directly. According to the principle of energy conservation, it can theoretically be measured indirectly by measuring the energy consumption of the drying system. As shown in Equation (4), K is the effective horsepower of drying system. In a period of time (t1~t2), energy consumption (ΔE) can be calculated by an integral formula. The right side approximation holds in the assume that K is a constant.
Water evaporation (ΔW) is also a process variable, which is a function of the drying rate (R) and time (t), as shown in Equation (5). Mdp is the mass of the dry paper.
From Equations (3)–(5), evaporation heat (ΔH) can be calculated by Equation (6), under the following assumptions: (1) drying conditions are consistent; (2) ignoring the energy loss, the energy provided by the drying system is only used for paper drying; (3) the absolute dry weight of the paper does not change during drying.
A relationship model between evaporation heat (ΔH) and the first derivative of paper moisture (Δu/Δt) has been established in Equation (7). That means the evaporation heat curve can be obtained as long as the drying curve (Figure 1b) was measured. K/Mdp is the model parameter.
Through theoretical analysis, it is found that it is feasible to theoretically estimate the heat of evaporation by measuring the drying curve, but there is still a key problem to be solved, which is to determine the constants K and Mdp. The method for determination of the model parameter K/Mdp is introduced in Figure 2. In the initial drying period, free water is preferentially evaporated. The thermodynamic and physical properties of free water are the same as that of bulk water. Its evaporation heat is just the latent heat of bulk water (ΔHlat). Therefore, Equation (7) can be obtained according to the law of energy conservation. u∞ is the paper moisture in the initial drying period, mainly referring to the constant drying rate phase.
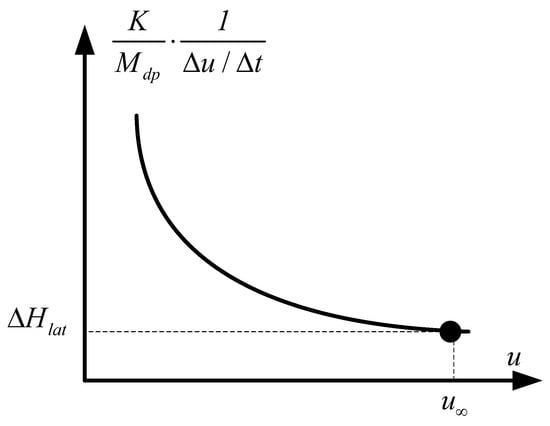
Figure 2.
Determination of model parameter K/Mdp.
The model parameter (K/Mdp) can be calculated as following:
At atmospheric pressure, ΔHlat is a single variable function of evaporation temperature that is approximately equal to paper temperature (Tp). By inquiring the physical property data of water, the following fitting Equation (9) can be utilized to calculate the latent heat of water vaporization (ΔHlat), which is obtained by regressing the physical property data of water at atmospheric pressure.
Finally, we find that the evaporation heat is related to the drying curve (Figure 1b) and temperature of paper at atmospheric pressure. It can be calculated as following Equation (10), which is obtained by substituting Equation (8) into Equation (6):
2.2. Advantages of the New Method
In this paper, a convenient and rapid method to measure the evaporation heat of paper is proposed. The new method is based on the drying curve, while the old method is based on the sorption isotherm. Because the measurement of the drying curve is more convenient than that of sorption isotherm, the new method has two great advantages.
As shown in Table 1, one is the measuring time, in the same laboratory environment, the old method based on the sorption isotherm get each data point generally needs to be in constant temperature and humidity environment for 24 h to balance water, however, the new method based on the drying curve only takes 1–2 h to complete the measurement of the whole drying curve, or even less than 15 min when using the moisture rapid analyzer. During on-line measurement at the production site, in the on-line measurement of production site, it takes 10 min for the new method to measure a data point, but the old method can not measure directly, so it can only use the data measured in the laboratory.

Table 1.
Comparison of new and old methods.
Another advantage is the measuring conditions. The measurement of the drying curve only needs the conventional experimental environment, while the measurement of the sorption isotherm needs the special experimental environment of constant temperature and humidity.
3. Results and Discussion
3.1. Laboratory Verification
In the laboratory, mechanical pulp was used as raw material to make hand paper. The specific steps are as follows:
Step1: Through the Wally beater (VB-42F, China pulp and Paper Research Institute Co., Ltd., Beijing, China), the raw material of mechanical pulp was dredged and beat to a specific beating degree (30).
Step2: The pulp concentration was measured, and a certain amount of pulp was weighed based on the paper with a weight of 60 g/m2.
Step3: The pulp was dissociated with a fiber standard dissociator (ZY-XW, Shandong Zhongyi Instrument Co., Ltd., Shandong, China), and formed into wet paper on a rapid Kaiser sheet former (ASM-32N2F, China pulp and Paper Research Institute Co., Ltd., Beijing, China).
Step4: The wet paper was pressed on the multi-functional extruder (MASP22H803, China pulp and Paper Research Institute Co., Ltd., Beijing, China) by 50 kPa.
Step5: It was sent to the moisture rapid analyzer (MB120, Aohaus Changzhou Co., Ltd., Jiangsu, China) to determine the drying curve (Figure 3), obtain and record the test data of paper moisture (u) changing with time(t).
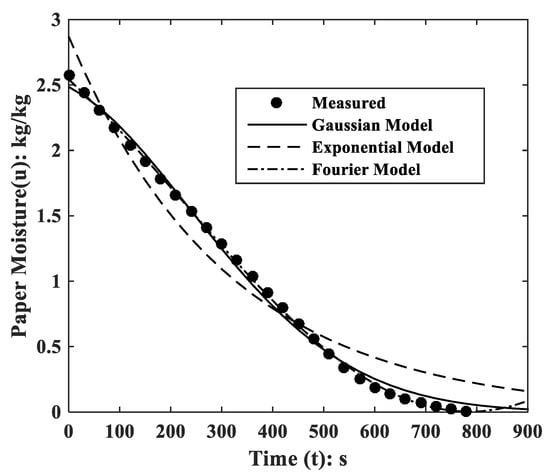
Figure 3.
Measurement and analysis of drying curve in laboratory.
The experimental model, Gaussian model and Fourier model were used to fit the test data. The fitting curves were shown in Figure 3, and the model structure and model parameter results are shown in Table 2. The Gaussian model has the best simulation effect and R2 value is 0.996. Therefore, the Gaussin model is used to estimate the subsequent evaporation heat.
Table 2.
Fitting results of drying curve data in laboratory.
Figure 4 shows a comparison of calculation results of the evaporation heat between the new and old methods in laboratory. The results calculated by the new method based on the test of drying curve are similar to the old method based on the measurement of the sorption isotherm. The MRE (average relative error) was calculated as 0.81% by Equation (12).
where, i represents the number of data groups, N represents the number of data groups, represents the evaporation heat obtained by the new method, represents the evaporation heat obtained by the old method.
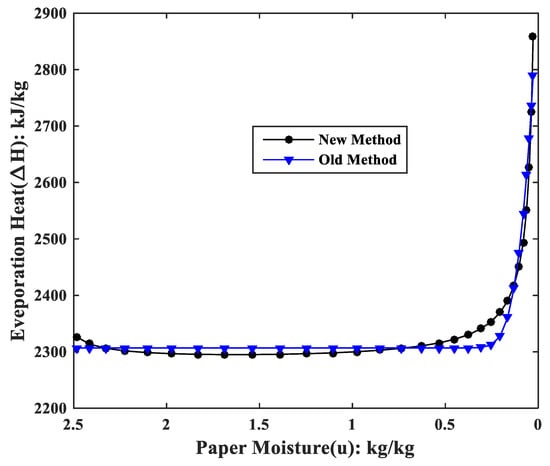
Figure 4.
Comparison of results between the new and old methods in the laboratory.
The laboratory verification results show that the new method can achieve the credibility of the old method. However, the new method can greatly simplify the test process of the water evaporation heat in paper drying process.
3.2. Industrial Verification
The verification object is a pre-drying process of high-strength corrugated paper with an annual output of 80,000 tons. The paper machine has 48 dryer cylinders, a speed of 500 m/min, a width of 4 m, and can produce high-strength corrugated paper with basis weight of 100 g/m2.
Figure 5 shows the schematic diagram of paper drying process. The material flow in and out of the pre-dryer section is clearly marked. In the actual production process, the paper drying is completed in the dryer-section, that is, a group of horizontally arranged heating dryer cylinders. The paper is pasted on the surface of the dryer cylinders to evaporate and dry. The production is continuous and the paper is moving forward dynamically, generally, the speed of the paper machine is 1000~2000 m/min. In this case, it is difficult to obtain the data of the moisture content of paper with time. Therefore, the drying curve of the production process is usually recorded as the change of the moisture content of the paper with different drying positions(u~N). The moisture content of the paper can be measured by hand-held portable sensor, and the drying position is usually indicated by the cylinder number of different positions.
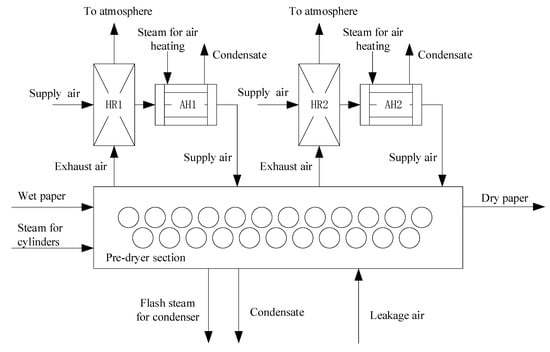
Figure 5.
Schematic diagram of paper drying process.
Figure 6 shows measurement and analysis of drying curve in industrial production. The basis weight of paper web was measured by a portable sensor (NDC 8110-F/104 from NDC infrared Engineering Co., Ltd., Los Angeles, CA, USA). This kind of small single-sided sensor can be extended into the narrow gap between the dryer cylinders, and it can be used to measure quantitatively on-line on the surface of the wet web without affecting the normal production. The drying curve data represented by paper moisture (u) and cylinder number (N) are recorded online as shown in Figure 6. The experimental model, Gaussian model and Fourier model were used to fit the test data. The fitting curves are shown in Figure 6, and the model structure and model parameter results are shown in Table 3. The Gaussian model has the best simulation effect and the R2 value is 0.986. Therefore, the Gaussian model is used to estimate the subsequent evaporation heat.
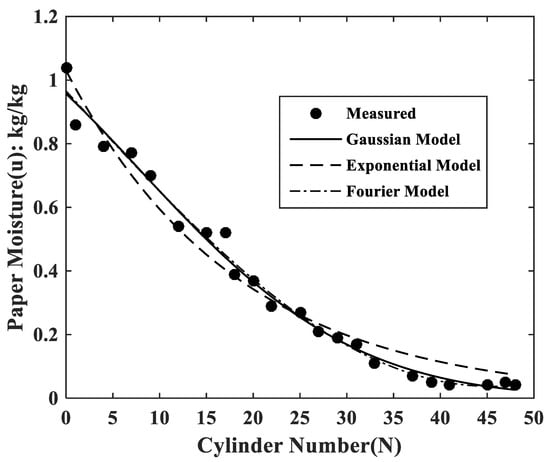
Figure 6.
Measurement and analysis of drying curve in industrial production.
Table 3.
Fitting results of drying curve data in industrial production.
Figure 7 shows comparison of calculation results of evaporation heat between the new and old methods in industrial production. Like the results of the laboratory verification, the results calculated by the new method based on the test of the drying curve are similar to the old method based on the measurement of the sorption isotherm in industrial production. The MRE was calculated as 0.80%. It shows that the new method can achieve the credibility of the old method in industrial production too.
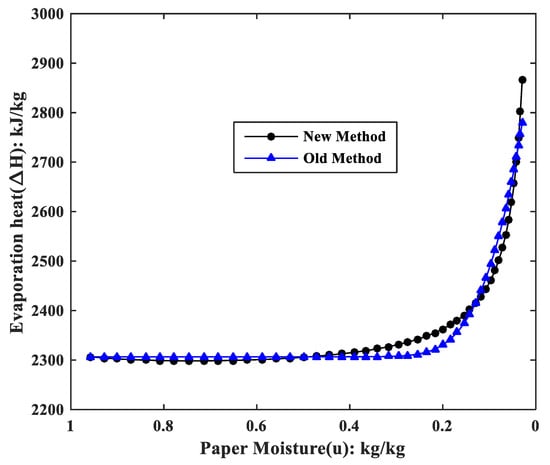
Figure 7.
Comparison of results between the new and old methods in industrial production.
4. Conclusions
In this paper, a mathematical model for rapid estimation of water evaporation heat in the paper drying process was proposed. During modeling, the drying curve is selected as the model input variables, and then evaporation heat (∆H) can be calculated. Compared with the old method using adsorption isotherm as model input, the new method has the advantages of easily obtained model inputs, short measurement time, and less harsh measurement environment.
The current paper also compares and analyzes the calculation results of the new and old methods in laboratory and industrial production. The results calculated by the new method based on the test of the drying curve are similar to the old method based on the measurement of the sorption isotherm in both scenarios. It shows that the new method can achieve the credibility of the old method.
This paper provides a simple tool for estimating the heat of evaporation in the drying process, and it can also be used to estimate the total energy consumption in the drying process, taking the total energy consumption as the goal, an optimal drying curve can be found through the optimization calculation, and then the drying process can be optimized and adjusted. The focus of our next study is the quantitative study of this model applied for optimal operation during paper drying.
Author Contributions
Conceptualization, X.C. and Q.Z.; methodology, X.C.; software, X.C.; validation, X.C., Q.Z. and Y.D.; formal analysis, X.C.; investigation, X.C. and Y.D.; resources, X.C.; data curation, X.C.; writing—original draft preparation, X.C.; writing—review and editing, X.C.; visualization, Y.D.; supervision, Q.Z.; project administration, Q.Z.; funding acquisition, Q.Z. All authors have read and agreed to the published version of the manuscript.
Funding
This work was supported from the Basic Public Research Project of Zhejiang Province (LQ18B060003), the Research Fund Program of Guangdong Provincial Key Lab of Green Chemical Product Technology (GC201809), the Quzhou science and technology plan project (2018ASA90140), the Key R & D plan of Zhejiang Province (2021C02031).
Institutional Review Board Statement
Not applicable.
Informed Consent Statement
Not applicable.
Data Availability Statement
The study did not report any data.
Conflicts of Interest
The authors declare no conflict of interest.
References
- Ghosh, A.K. Fundamentals of paper drying—Theory and application from industrial perspective. In Evaporation, Condensation and Heat Transfer; Ahsan, A., Ed.; InTech: Croatia, Yugoslavia, 2011. [Google Scholar]
- Jacobs, I.P.S.T. Report for Pulp and Paper Industry Energy Bandwidth Study; American Institute of Chemical Engineers: New York, NY, USA, 2006. [Google Scholar]
- Chen, X.; Li, J.; Liu, H.; Yin, Y.; Hong, M.; Zeng, Z. Energy system diagnosis of paper-drying process. Part 1: Energy performance assessment. Dry. Technol. 2015, 34, 930–943. [Google Scholar] [CrossRef]
- Chen, X.; Li, J.; Liu, H.; Yin, Y.; Zhang, Y. Energy system diagnosis of paper-drying process. Part 2: A model-based estimation of energy-saving potentials. Dry. Technol. 2015, 34, 1219–1230. [Google Scholar] [CrossRef]
- Heikkilä, P. A Study on the Drying Process of Pigment Coated Webs. Ph.D. Thesis, Åbo Akademi University, Turku, Finland, 1993. [Google Scholar]
- Slätteke, O. Modeling and Control of the Paper Machine Drying Section; Lund University: Lund, Sweden, 2006. [Google Scholar]
- Roonprasang, K. Thermal Analysis of Multi-Cylinder Drying Section with Variant Geometry. Ph.D. Thesis, Technischen Universität Dresden, Dresden, Germany, 2008. [Google Scholar]
- Karlsson, M.; Stenström, S. Static and dynamic modeling of cardboard drying. Part 1: Theoretical model. Dry. Technol. 2005, 23, 143–163. [Google Scholar] [CrossRef]
- Karlsson, M.; Stenström, S. Static and dynamic modeling of cardboard drying. Part 2: Simulations and experimental results. Dry. Technol. 2005, 23, 165–186. [Google Scholar] [CrossRef]
- Heo, C.H.; Cho, H.; Kim, J.-K.; Moon, S.-J.; Yeo, Y.-K. Modeling and simulation of multi-cylinder paper drying processes. J. Chem. Eng. Jpn. 2011, 44, 437–446. [Google Scholar] [CrossRef]
- Åkesson, J.; Slätteke, O. A Modelica Library for Paper Machine Dryer Section Modeling—DryLib—And Applications; Report; Lund University: Lund, Sweden, 2006. [Google Scholar]
- Wadsö, L.; Svennberg, K.; Dueck, A. An experimentally simple method for measuring sorption isotherms. Dry. Technol. 2004, 22, 2427–2440. [Google Scholar] [CrossRef]
- Krupinska, B.; Strømmen, I.; Pakowski, Z.; Eikevik, T.M. Modeling of sorption isotherms of various kinds of wood at different temperature conditions. Dry. Technol. 2007, 25, 1463–1470. [Google Scholar] [CrossRef]
- Keränen, J. Increasing the Drying Efficiency of Cylinder Drying. Ph.D. Thesis, University of Jyyväskyä, Jyyväskyä, Finland, 2011. [Google Scholar]
- Popescu, C.-M.; Hill, C.A.S.; Curling, S.; Ormondroyd, G.; Xie, Y. The water vapour sorption behaviour of acetylated birch wood: How acetylation affects the sorption isotherm and accessible hydroxyl content. J. Mater. Sci. 2014, 49, 2362–2371. [Google Scholar] [CrossRef]
- Stenström, S. Drying of paper: A review 2000–2018. Dry. Technol. 2019, 4, 1–21. [Google Scholar] [CrossRef] [Green Version]
- Chen, X.; Man, Y.; Zheng, Q.; Hu, Y.; Li, J.; Hong, M. Industrial verification of energy saving for the single-tier cylinder based paper drying process. Energy 2019, 170, 261–272. [Google Scholar] [CrossRef]
- Li, J.; Kong, L.; Liu, H. Dryer section energy system measurement and energy-saving potential analysis for a paper machine. Meas. Control. 2012, 45, 239–243. [Google Scholar] [CrossRef]
Publisher’s Note: MDPI stays neutral with regard to jurisdictional claims in published maps and institutional affiliations. |
© 2021 by the authors. Licensee MDPI, Basel, Switzerland. This article is an open access article distributed under the terms and conditions of the Creative Commons Attribution (CC BY) license (https://creativecommons.org/licenses/by/4.0/).